Abstract
Obesity and its consequences are among the greatest challenges in healthcare. The gut microbiome is recognized as a key factor in the pathogenesis of obesity. Using a mouse model, we show here that a wild-derived microbiome protects against excessive weight gain, severe fatty liver disease and metabolic syndrome during a 10-week course of high-fat diet. This phenotype is transferable only during the first weeks of life. In adult mice, neither transfer nor severe disturbance of the wild-type microbiome modifies the metabolic response to a high-fat diet. The protective phenotype is associated with increased secretion of metabolic hormones and increased energy expenditure through activation of brown adipose tissue. Thus, we identify a microbiome that protects against weight gain and its negative consequences through metabolic programming in early life. Translation of these results to humans may identify early-life therapeutics that protect against obesity.
Obesity and its consequences are among the greatest present and future challenges in healthcare. Obesity-associated diseases including diabetes, cardiovascular disease and fatty liver disease cause more deaths than all types of cancer combined1. Interventions such as education, exercise and diet are ineffective on a population level as evidenced by a steadily rising prevalence of obesity in adults2 and adolescents3. The high prevalence of obesity and its associated morbidities paired with ineffective treatments necessitates new approaches to understand its pathophysiology.
The microbiome has become recognized for its impact on almost all aspects of host physiology in health and disease4–7. The gut microbiome in particular has a substantial impact on metabolic function8–11 and is vertically transmitted from parents to children12,13. This emphasizes the need for maintaining microbiota health as changes in microbiota composition can be passed down through generations, thereby affecting human physiology across generations14. This is supported by the finding that the microbiome of Western societies is dramatically different from that of non-Western peoples15,16, giving rise to the concept of an ‘industrialized’ microbiome17. Indeed, the era of industrialization coincided with the rapid rise of many noncommunicable diseases such as obesity, high blood pressure and auto-immune diseases18, all of which are affected by the microbiome4,5. This resulted in the hypothesis that the loss of microbial complexity and function is causally linked to the increasing prevalence of such diseases19,20.
Similar to humans in the industrialized era14,17,19, common laboratory mouse models that are currently used in obesity and metabolism research lack many microbes that may be physiologically important. This is because those laboratory mouse strains were repeatedly germ-free re-derived and re-colonized in a restrictive laboratory environment leading to the loss of their natural microbiome and thus some of its functions21,22. To more completely assess the impact of the microbiome on health, a model that more closely resembles the complex and host-adapted wild-type microbiota is necessary23.
To this end, we have recently demonstrated that laboratory mice can be reconstituted with the microbiome of wild mice. This wild-type microbiome is better adapted to the host and more resilient to external challenges than the microbiome of conventional laboratory mice21. The wild-derived microbiota spans multiple kingdoms, many of which have an increased diversity compared with those of conventional laboratory mice21. Importantly, it can be maintained in conventional C57BL/6 laboratory mice at multiple body sites (for example, gut, skin, female reproductive tract) in a standard animal facility, resulting in a colony of mice that we have termed ‘wildlings’21.
In this study, we hypothesize that standard laboratory mouse models are missing essential components of the natural microbiome that impact the host response to a caloric challenge. Using the wildling model, we investigate how a more complex and better host-adapted microbiome affects the response to excess energy consumption upon high-fat diet (HFD) and how the timing of microbiome exposure modulates these effects.
Results
Wildlings are protected from excessive weight gain on HFD.
To investigate how natural microbiota impact host physiology in a diet-induced obesity model, we provided either regular National Institutes of Health (NIH) chow or HFD to C57BL/6NTac with wild mouse microbiome (wildlings) and to specific-pathogen-free (SPF) C57BL/6NTac with laboratory mouse microbiome (lab mice). Mice were 10 weeks of age at the start of HFD (Fig. 1a). As early as 1 week after the start of HFD, female wildings weighed significantly less than female lab mice (20.4 ± 1.5 g versus 23.3 ± 2.8 g, P < 0.00001; Fig. 1b). This trend continued throughout the 10-week course of HFD with female wildlings weighing 26.3 ± 4.5 g as compared with female lab mice weighing 34.1 g ± 5.5 g at the end of the experiment (P < 0.00001; Fig. 1c). The differential weight gain held true for male mice (Fig. 1d,e). Interestingly, even on regular chow diet, both female and male wildlings gained less weight than conventional lab mice (female wildling versus lab mice: 21.9 g ± 1.6 g versus 24.34 ± 3.0 g, P = 0.0033; male wildling versus lab mice: 26.9 g ± 1.5 g versus 32.9 ± 4.3 g, P = 0.0001; Fig. 1c,e).
Fig. 1 |. Wildlings are protected from excessive weight gain on HFD.
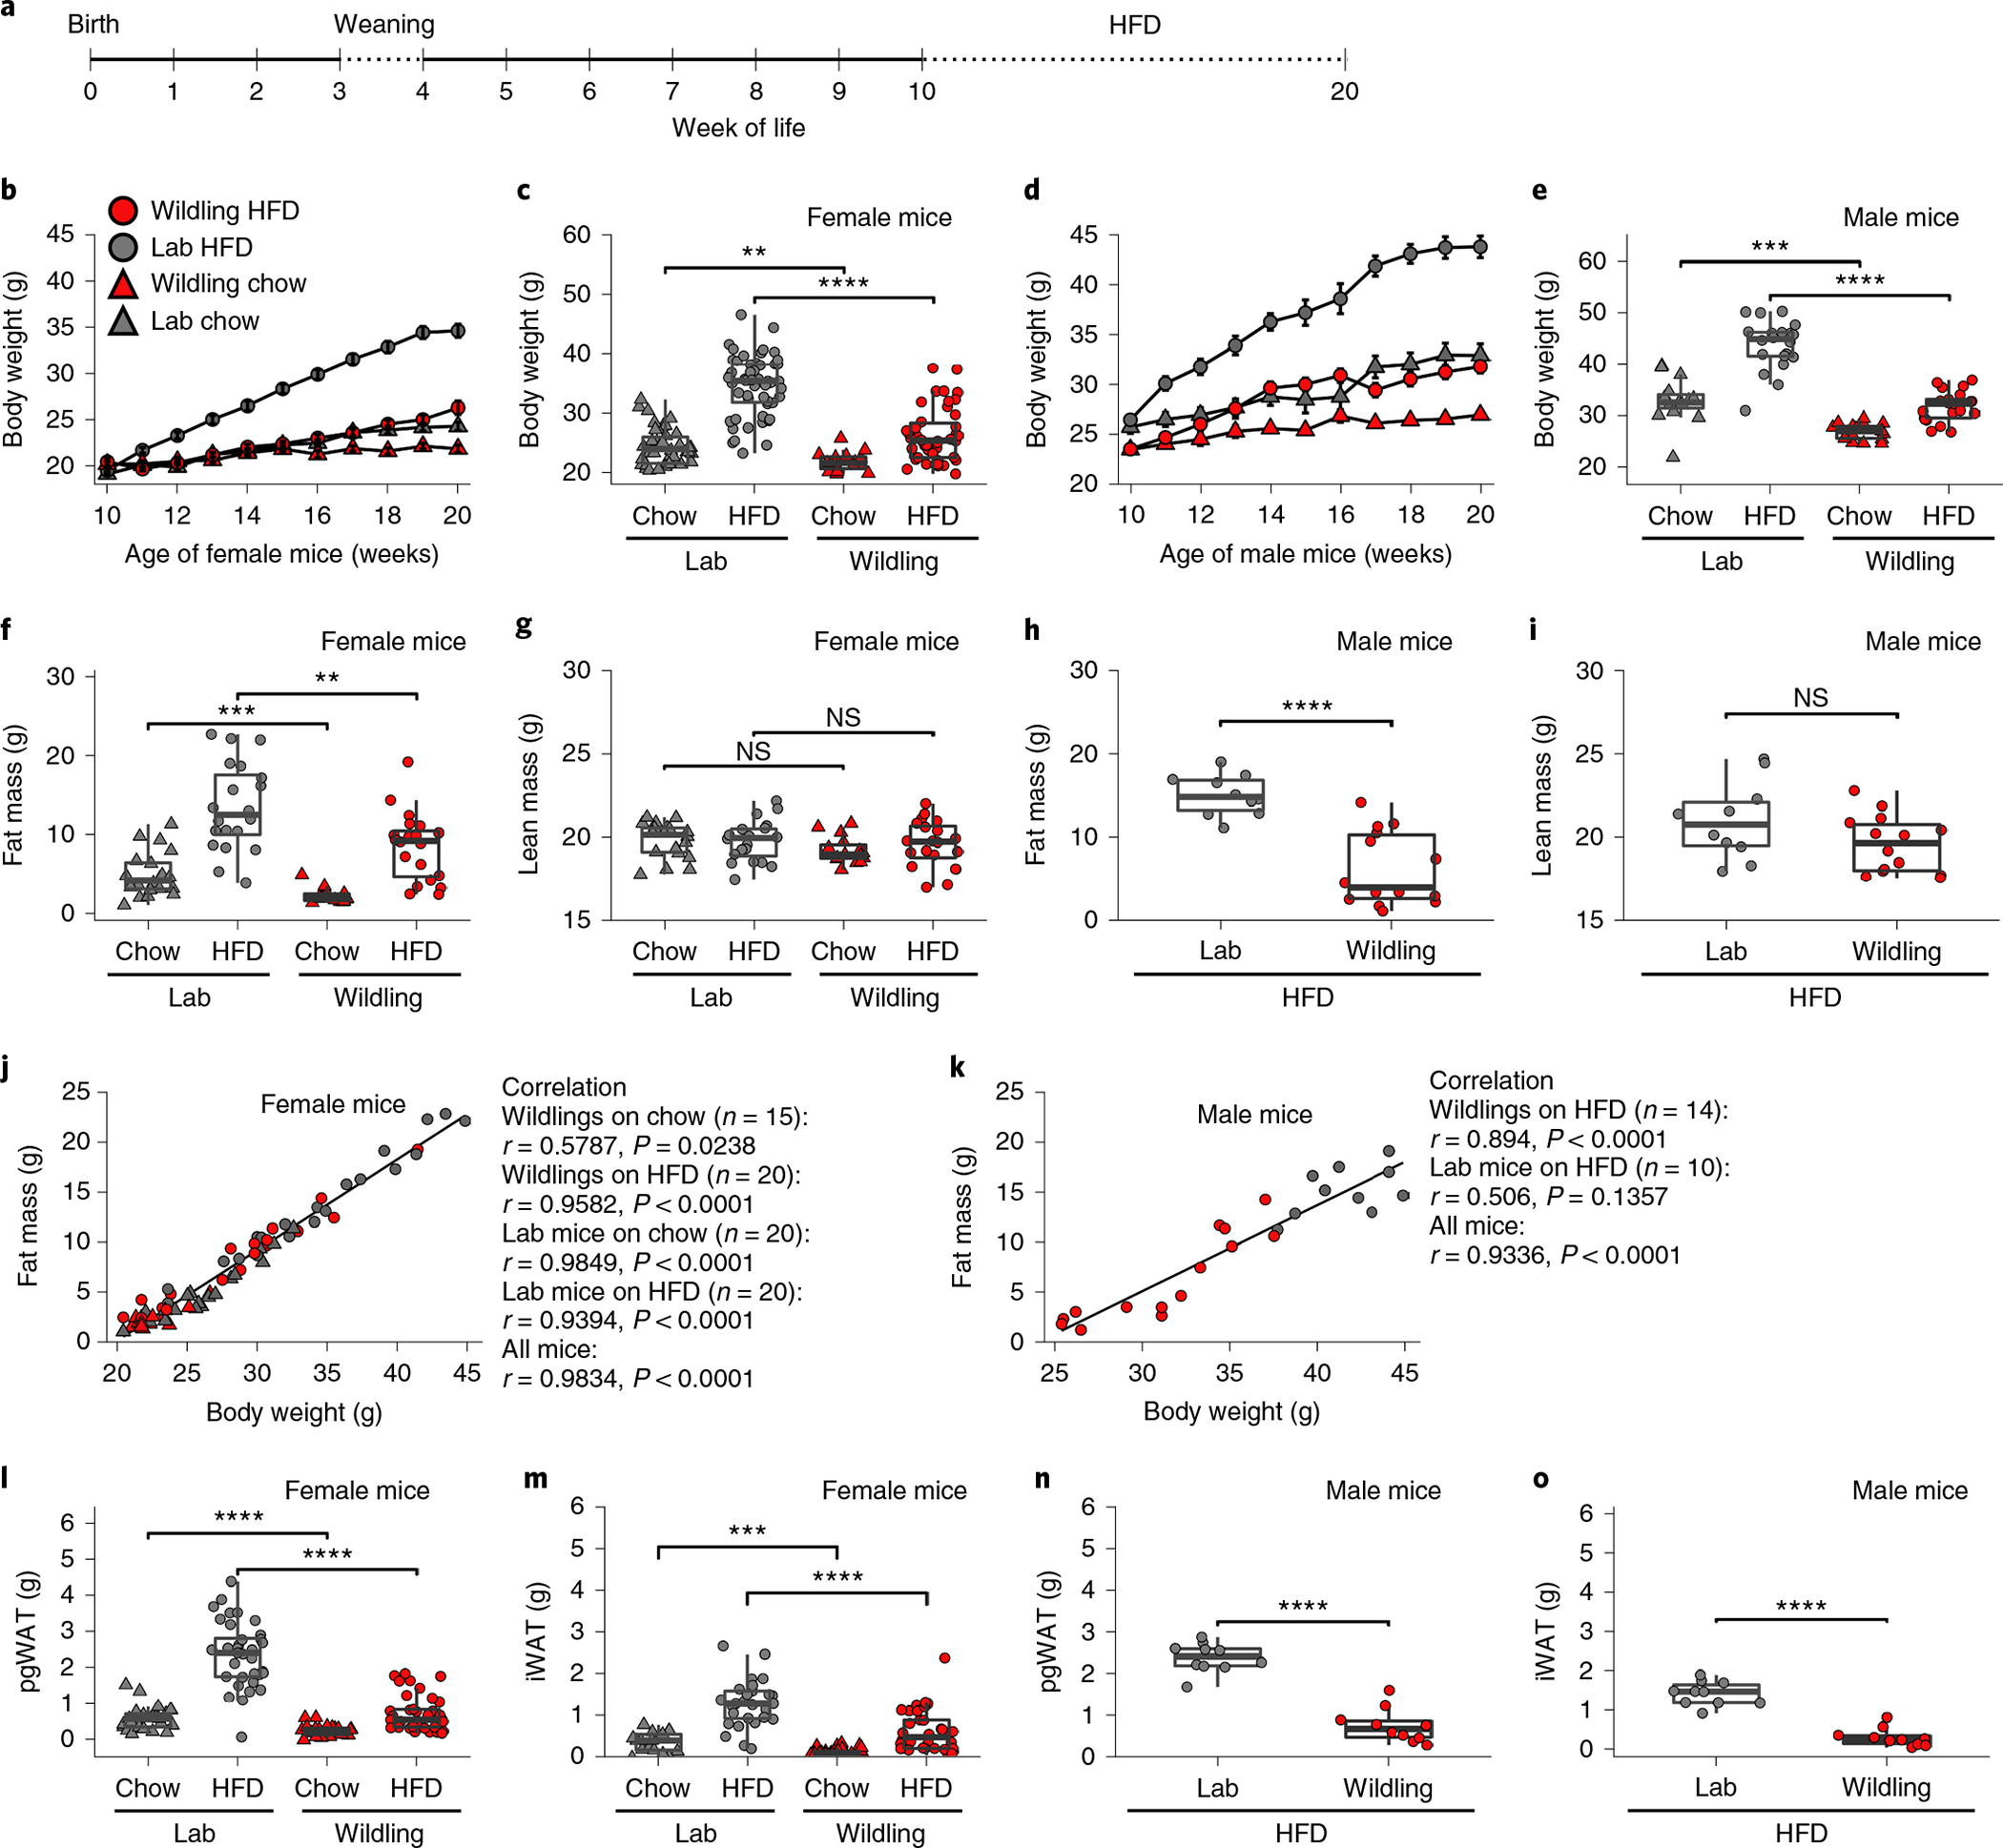
a, Experimental design. C57BL/6NTac with wild mouse microbiome (wildlings) and C57BL/6NTac with SPF lab mouse microbiome (lab) received a 10-week course of either regular chow or HFD. b,c, Weight of female lab or wildling mice during (b) and after 10 weeks of chow or HFD (c). n = 42 lab mice on chow, n = 55 lab mice on HFD; n = 30 wildlings on chow, n = 60 wildlings on HFD examined over 3 independent experiments. d,e Weight of male lab or wildling mice during (d) and after 10 weeks of chow or HFD (e). n = 15 lab mice on chow, n = 20 lab mice on HFD; n = 17 wildlings on chow, n = 23 wildlings on HFD examined over two independent experiments. f,g, Fat (f) and lean (g) body mass of female mice on chow (n = 20 lab mice, n = 15 wildlings) or HFD (n = 20 lab mice, n = 20 wildlings). h,i, Fat (h) and lean (i) body mass of male mice on HFD (n = 10 lab mice, n = 14 wildlings). j,k, Pearson correlation of body weight and fat mass of female (j) and male (k) lab and wildling mice after 10 weeks of chow or HFD; two independent experiments each, symbols as in b. l,m, Weight of pgWAT (l) and iWAT (m) of female mice after 10 weeks of chow (n = 50 lab mice, n = 78 wildlings) or HFD (n = 57 lab mice, n = 70 wildlings), examined over five independent experiments. n,o, Weight of pgWAT (n) and iWAT (o) of male mice after 10 weeks of HFD (n = 10 lab mice, n = 10 wildlings), examined over two independent experiments. Mean ± s.e.m. are shown (b,d). Box plots show median (centre line), 75th (upper limit of box) and 25th percentiles (lower limit of box) and outliers (whiskers) if values do not exceed 1.5 × interquartile range (c,e–i,l–o). Two-sided Student’s t-test (Gaussian model) (e,g,h,i,n,o); two-sided Wilcoxon rank sum test (c,f,l,m). NS, not significant; **P < 0.01, ***P < 0.001, ****P < 0.0001; exact P values are provided in the Source Data.
To assess how the differential weight gain affected fat and lean body mass, we analysed body composition using magnetic resonance. On chow diet, wildlings had significantly less fat mass than lab mice (Fig. 1f), whereas lean mass did not differ between the groups (Fig. 1g). On HFD, wildlings had significantly less fat mass than lab mice (Fig. 1f,h), and the groups did not differ in lean mass (Fig. 1g,i). The strong correlation between fat mass gain and body weight across mouse groups and diets (female: ρ = 0.9834, P < 0.0001; male: ρ = 0.9336, P < 0.0001; Fig. 1j,k) indicates that the increase in body weight was due to an expansion of fat mass. Differential fat mass expansion was observed for both perigonadal white adipose tissue (pgWAT, Fig. 1l,n) and inguinal white adipose tissue (iWAT, Fig. 1m,o) in wildling and lab mice irrespective of sex. Collectively, the data show that female and male wildlings are protected from excessive weight gain during HFD.
Wildlings are protected from adverse metabolic effect of HFD.
Obesity is a known risk factor for many diseases, including steatohepatitis, metabolic syndrome and type 2 diabetes24. Consistent with the differential increase in body weight, both female and male wildlings had significantly lower liver weight than lab mice after 10 weeks on HFD (Fig. 2a,b). This was associated with reduced liver fat accumulation and reduced liver injury (alanine aminotransferase activity) in wildling mice compared with lab mice (Fig. 2c–e, assessed in females). A trend towards increased serum alanine aminotransferase activity was also observed in male lab mice compared with male wildlings but did not reach statistical significance (Fig. 2f). Liver weight and liver fat content did not differ between wildlings and lab mice on chow diet (Fig. 2a,c).
Fig. 2 |. Wildlings are protected from adverse metabolic effects of HFD.
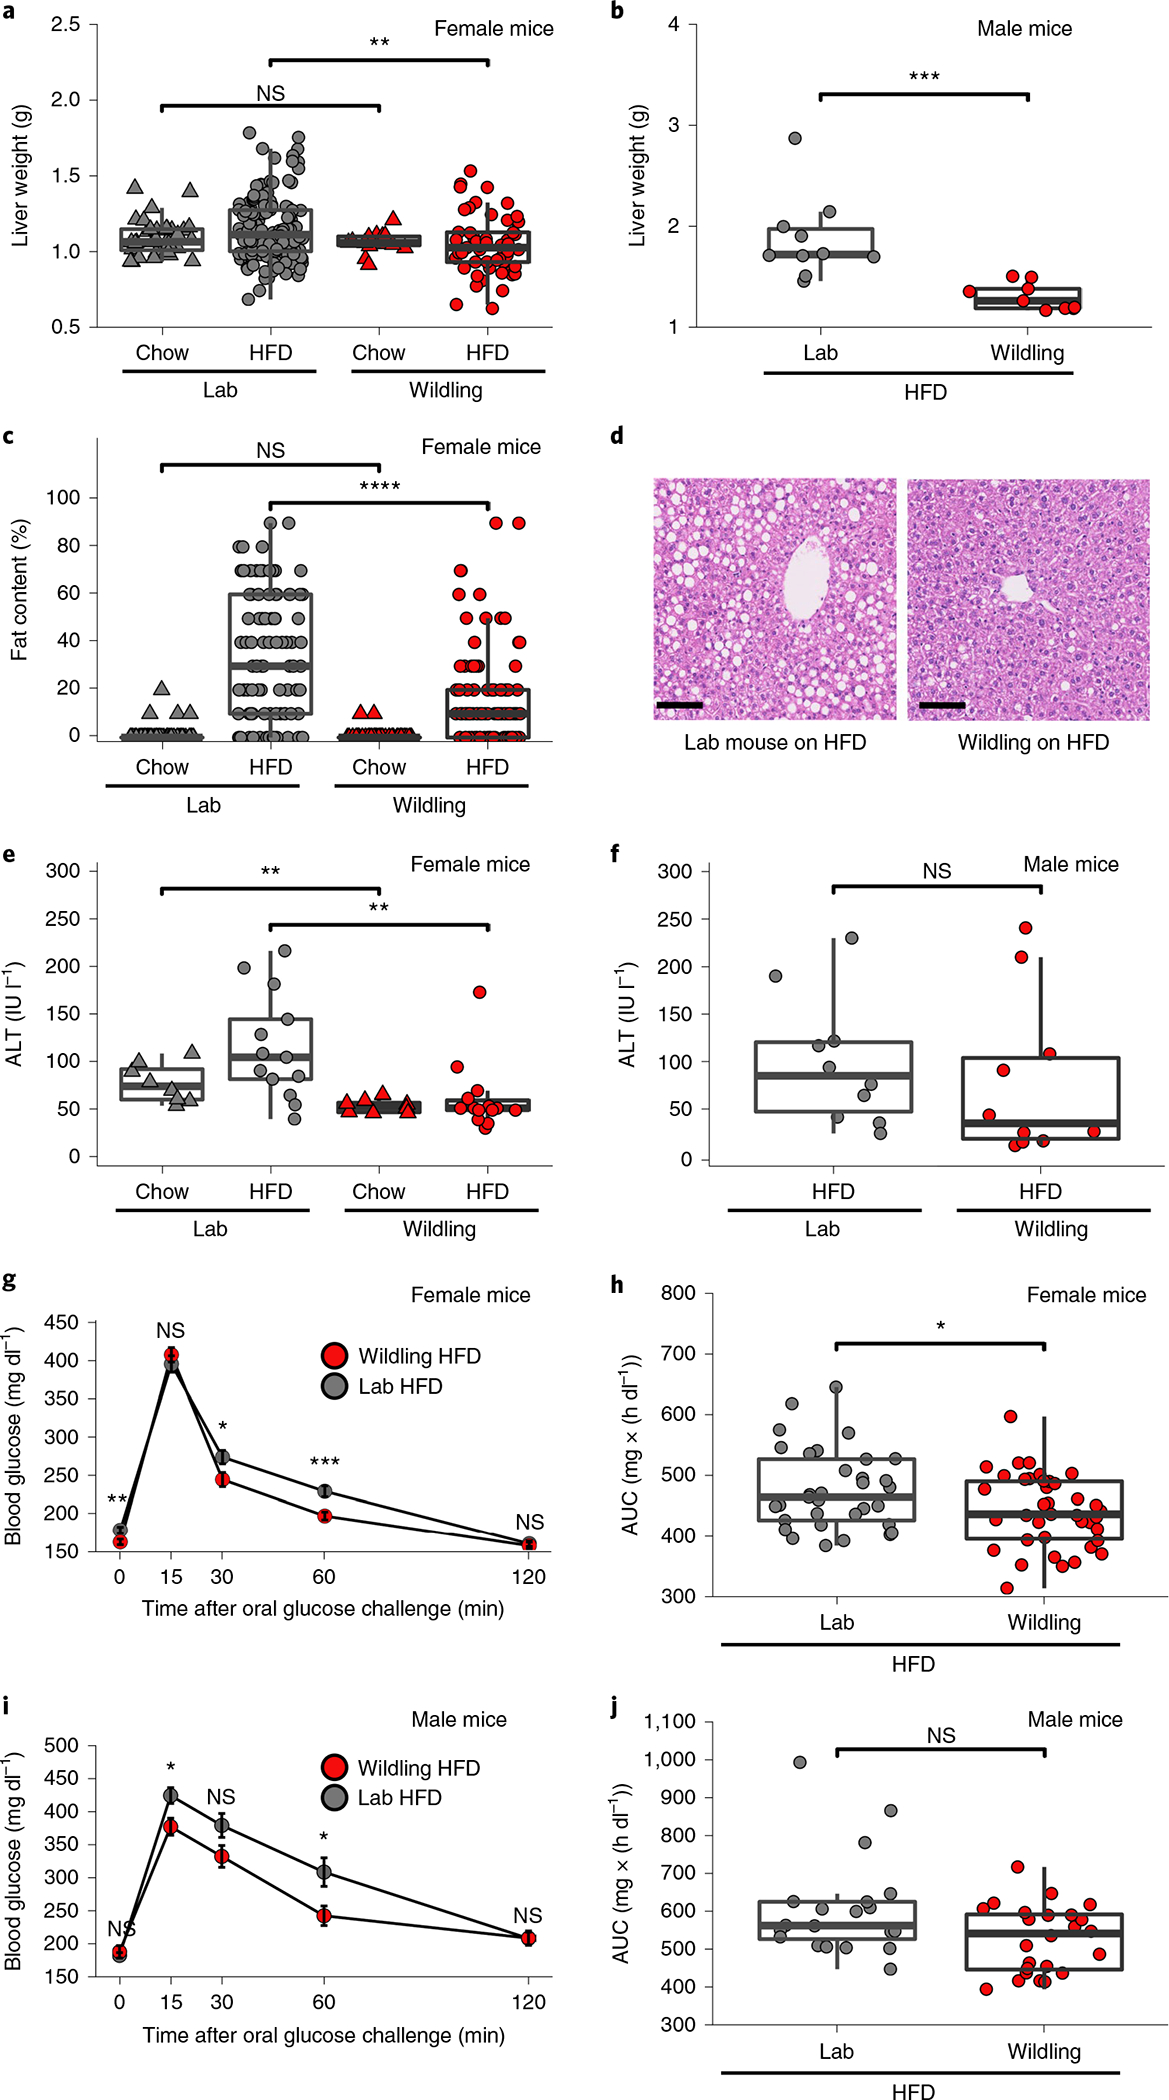
a,b, Liver weight of female (a) or male (b) lab or wildling mice at week 10 of chow or HFD; n = 159 lab mice on HFD, n = 55 lab mice on chow; n = 95 wildlings on HFD, n = 78 wildlings on chow examined over three independent experiments (a); n = 10 lab mice, n = 10 wildlings examined over two independent experiments (b). c, Liver fat content of female lab and wildling mice at 10, 20 or 30 weeks of age on chow and at 20 or 30 weeks of age on HFD as assessed by scoring of liver histology by two independent assessors. n = 47 lab mice on chow, n = 50 lab mice on HFD; n = 38 wildlings on chow, n = 52 wildlings on HFD examined over three independent experiments. d, Hematoxylin and eosin (H&E)-stained liver histology from female lab and wildling mice after 10 weeks of HFD, representative for data in c obtained over three independent experiments. Scale bars, 100 μm. e,f, Serum alanine aminotransferase (ALT) activity of female (e) and male (f) lab or wildling mice after 10 weeks of chow or HFD. n = 8 lab mice on chow, n = 14 lab mice on HFD; n = 8 wildlings on chow, n = 14 wildlings on HFD (e); n = 10 lab mice, n = 10 wildlings (f). g,h, Oral glucose tolerance test of female mice (n = 33 lab mice, n = 39 wildlings) on HFD showing blood glucose levels at different times of the test (g) and glucose area under the curve (AUC) for the entire assay (h). Data are from three independent experiments. i,j, Oral glucose tolerance test of male mice (n = 20 lab mice, n = 24 wildlings) on HFD showing blood glucose levels at different times of the test (i) and glucose area under the curve (AUC) for the entire assay (j). Data are from three independent experiments. Data are presented as mean values ± s.e.m. (g,i). Box plots show median (centre line), 75th (upper limit of box) and 25th percentiles (lower limit of box) and outliers (whiskers) if values do not exceed 1.5 × interquartile range (a–c,e,f,h,j); *P < 0.05, **P < 0.01, ***P < 0.001. Unpaired two-sided Student’s t-test (Gaussian model) (b); two-sided Wilcoxon rank sum test (a,c,e,f–j). *P < 0.05, **P < 0.01, ***P < 0.001, ****P < 0.0001; exact P values are provided in the Source Data. IU, international units.
The regulation of the blood glucose level has been shown to be impaired in obese individuals25. We therefore measured 6-h-fasting blood glucose levels of wildlings and lab mice. Consistent with the reduced weight gain, female wildlings had lower fasting glucose levels than lab mice after 10 weeks on HFD (Fig. 2g). To further characterize the metabolic responses in both mouse groups, we performed oral glucose tolerance tests at week 10 of HFD. While female wildlings and lab mice on HFD showed similar peak glucose levels, wildlings on HFD normalized their serum glucose level faster than lab mice (Fig. 2g). Accordingly, the area under the curve was significantly lower for wildlings than for lab mice on HFD (Fig. 2h). Male wildlings had lower peak serum glucose levels than male lab mice (Fig. 2i), but there was no significant difference in the area under the curve (Fig. 2j). In conclusion, wildling mice were protected from adverse metabolic effects of HFD.
HFD-induced changes in the wildling and lab mouse microbiome.
We have previously shown that the faecal bacterial microbiome of wildlings is relatively stable upon change of diet whereas the lab mouse microbiome is not21. To evaluate HFD-induced changes in the caecal bacterial microbiome, we performed shotgun metagenomic analysis of caecal content from female wildling and lab mice at week 10 of chow or HFD. As illustrated by principal coordinate analysis (PCoA), samples from wildling mice on chow and HFD clustered in close proximity. Samples from lab mice clustered distant based on diet (Fig. 3a,b).
Fig. 3 |. HFD-induced changes in the wildling and lab mouse microbiome.
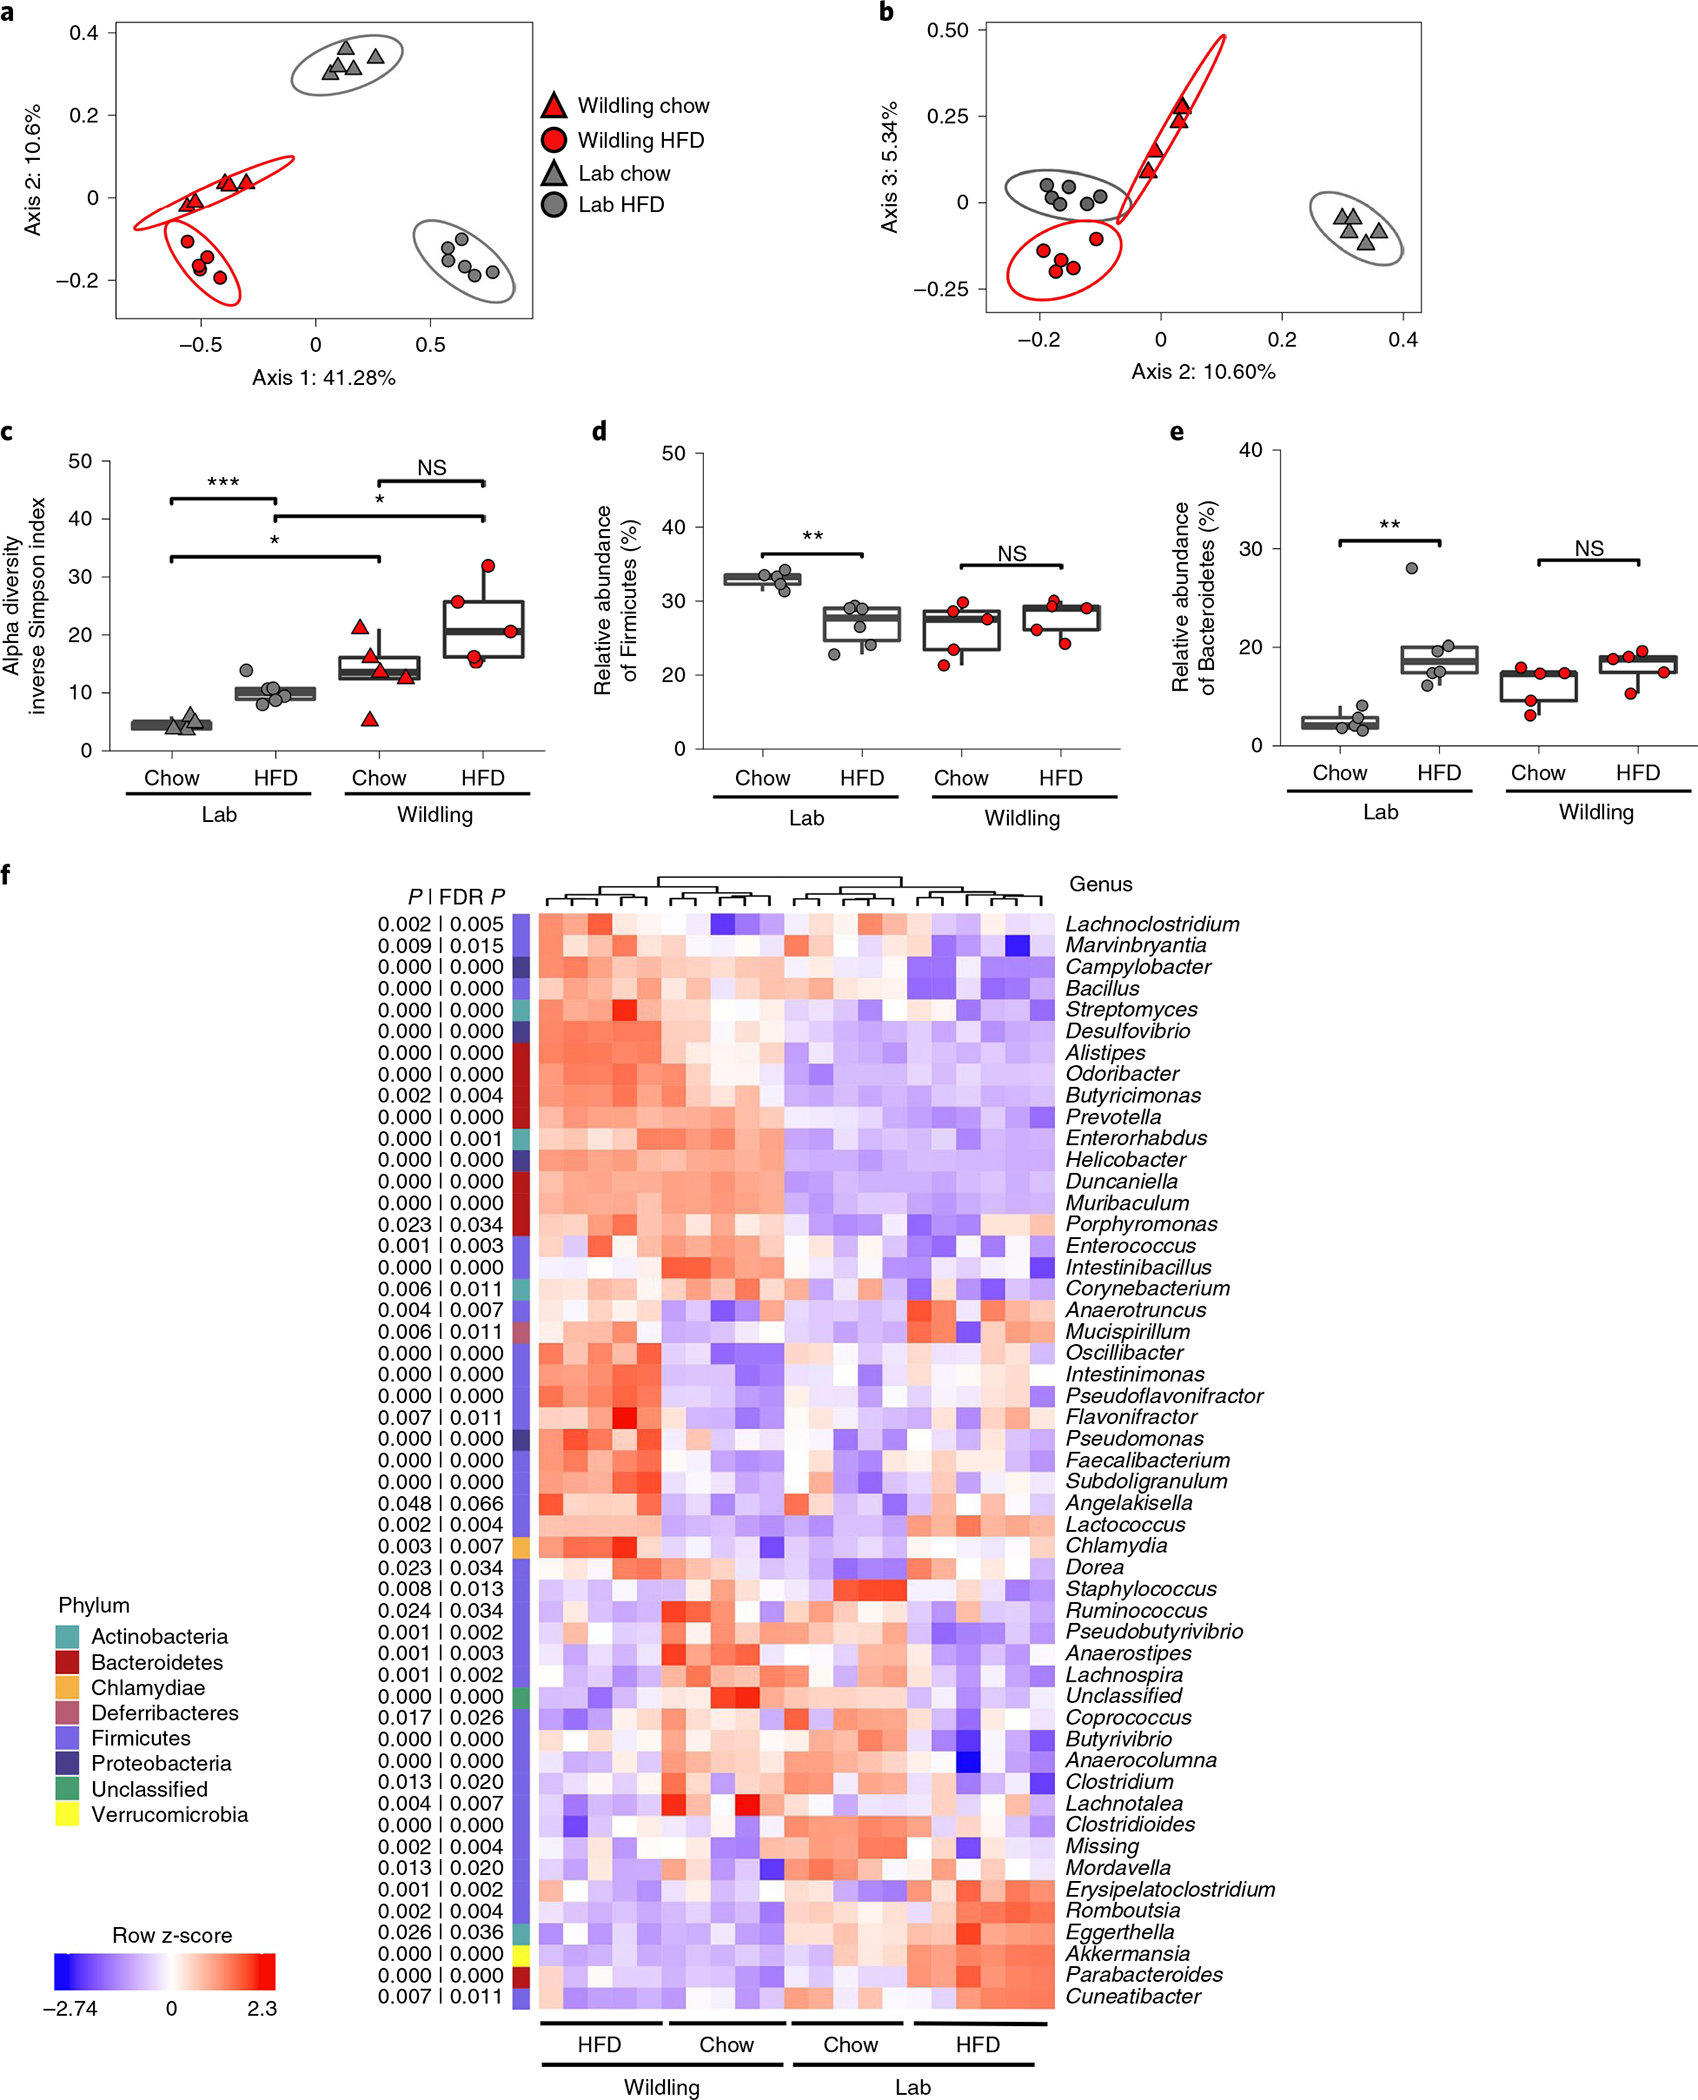
Shotgun metagenomics data comparing the caecal microbiome of female wildling and lab mice at week 10 of chow or HFD. a,b, PCoA (Jaccard distance) of first and second (a) and the second and third (b) most variant axes. c, Alpha diversity expressed as inverse Simpson index. d,e, Relative abundance of the phyla Firmicutes (d) and Bacteroidetes (e). f, Heat map generated by unsupervised clustering, showing the top 50 most variant genera (false discovery rate (FDR)-adjusted P < 0.05 across groups by analysis of variance test) after filtering based on taxon genome completeness of >10% in at least 5% of samples and abundance of >250 parts per million in at least 15% of samples. Relative abundances are shown as z-score. n = 6 lab mice on HFD, n = 6 lab mice on chow; n = 5 wildlings on HFD, n = 5 wildlings on chow (c–e). Box plots show median (centre line), 75th (upper limit of box) and 25th percentiles (lower limit of box) and outliers (whiskers) if values do not exceed 1.5 × interquartile range (c–e). Unpaired two-sided Student’s t-test (Gaussian mode) (b); two-sided Wilcoxon rank sum test (c–f). *P < 0.05, **P < 0.01, ***P < 0.001; exact P values are provided in the Source Data.
Another important characteristic of the bacterial microbiome is its diversity. Increased microbial diversity has been correlated with health26 and decreased microbial diversity has been reported in many diseases27. Interestingly, wildlings had a higher microbial alpha diversity than lab mice on both chow and HFD as assessed by inverse Simpson index (Fig. 3c), and this was confirmed using other measures of diversity (Extended Data Fig. 1a–c).
Next, we assessed the abundance of two phyla (Firmicutes and Bacteroidetes), which are known to be affected by HFD28. The relative abundance of Firmicutes showed a decrease and that of Bacteroidetes an increase in lab mice on HFD as compared with their counterparts on chow. In wildlings, to the contrary, the relative abundance of Firmicutes and Bacteroidetes was not affected by the type of diet (Fig. 3d,e). Unsupervised clustering of genera (Fig. 3f) clearly separated wildlings and lab mice on chow diet, and exposure to HFD let to an even greater separation. At the level of last-known taxa, HFD-induced changes were observed in both wildlings and lab mice but the affected taxa differed (Extended Data Fig. 1d,e).
Impact of adult life microbiome on HFD response.
Next, we asked whether wild-type gut microbiota can be transferred to adult lab mice to prevent HFD-induced weight gain. Nine-week-old female lab mice were gavaged with caecal content from either wildlings or (as control) from lab mice three times within a week, and subsequently subjected to a 10-week course of chow diet or HFD (Fig. 4a). As shown in Fig. 4b, the transferred wild-type microbiota did not confer resistance to HFD-induced weight gain. In fact, lab mice that had received wild-type microbiota had a significantly higher weight at week 20 of age after the 10-week course of HFD than lab mice that had received lab mouse microbiota (weight: 38.48 g versus 34.67 g, P = 0.009; Fig. 4c). The groups did not differ in their weight after a 10-week course of chow diet (Fig. 4b,c).
Fig. 4 |. impact of adult life microbiome on HFD response.
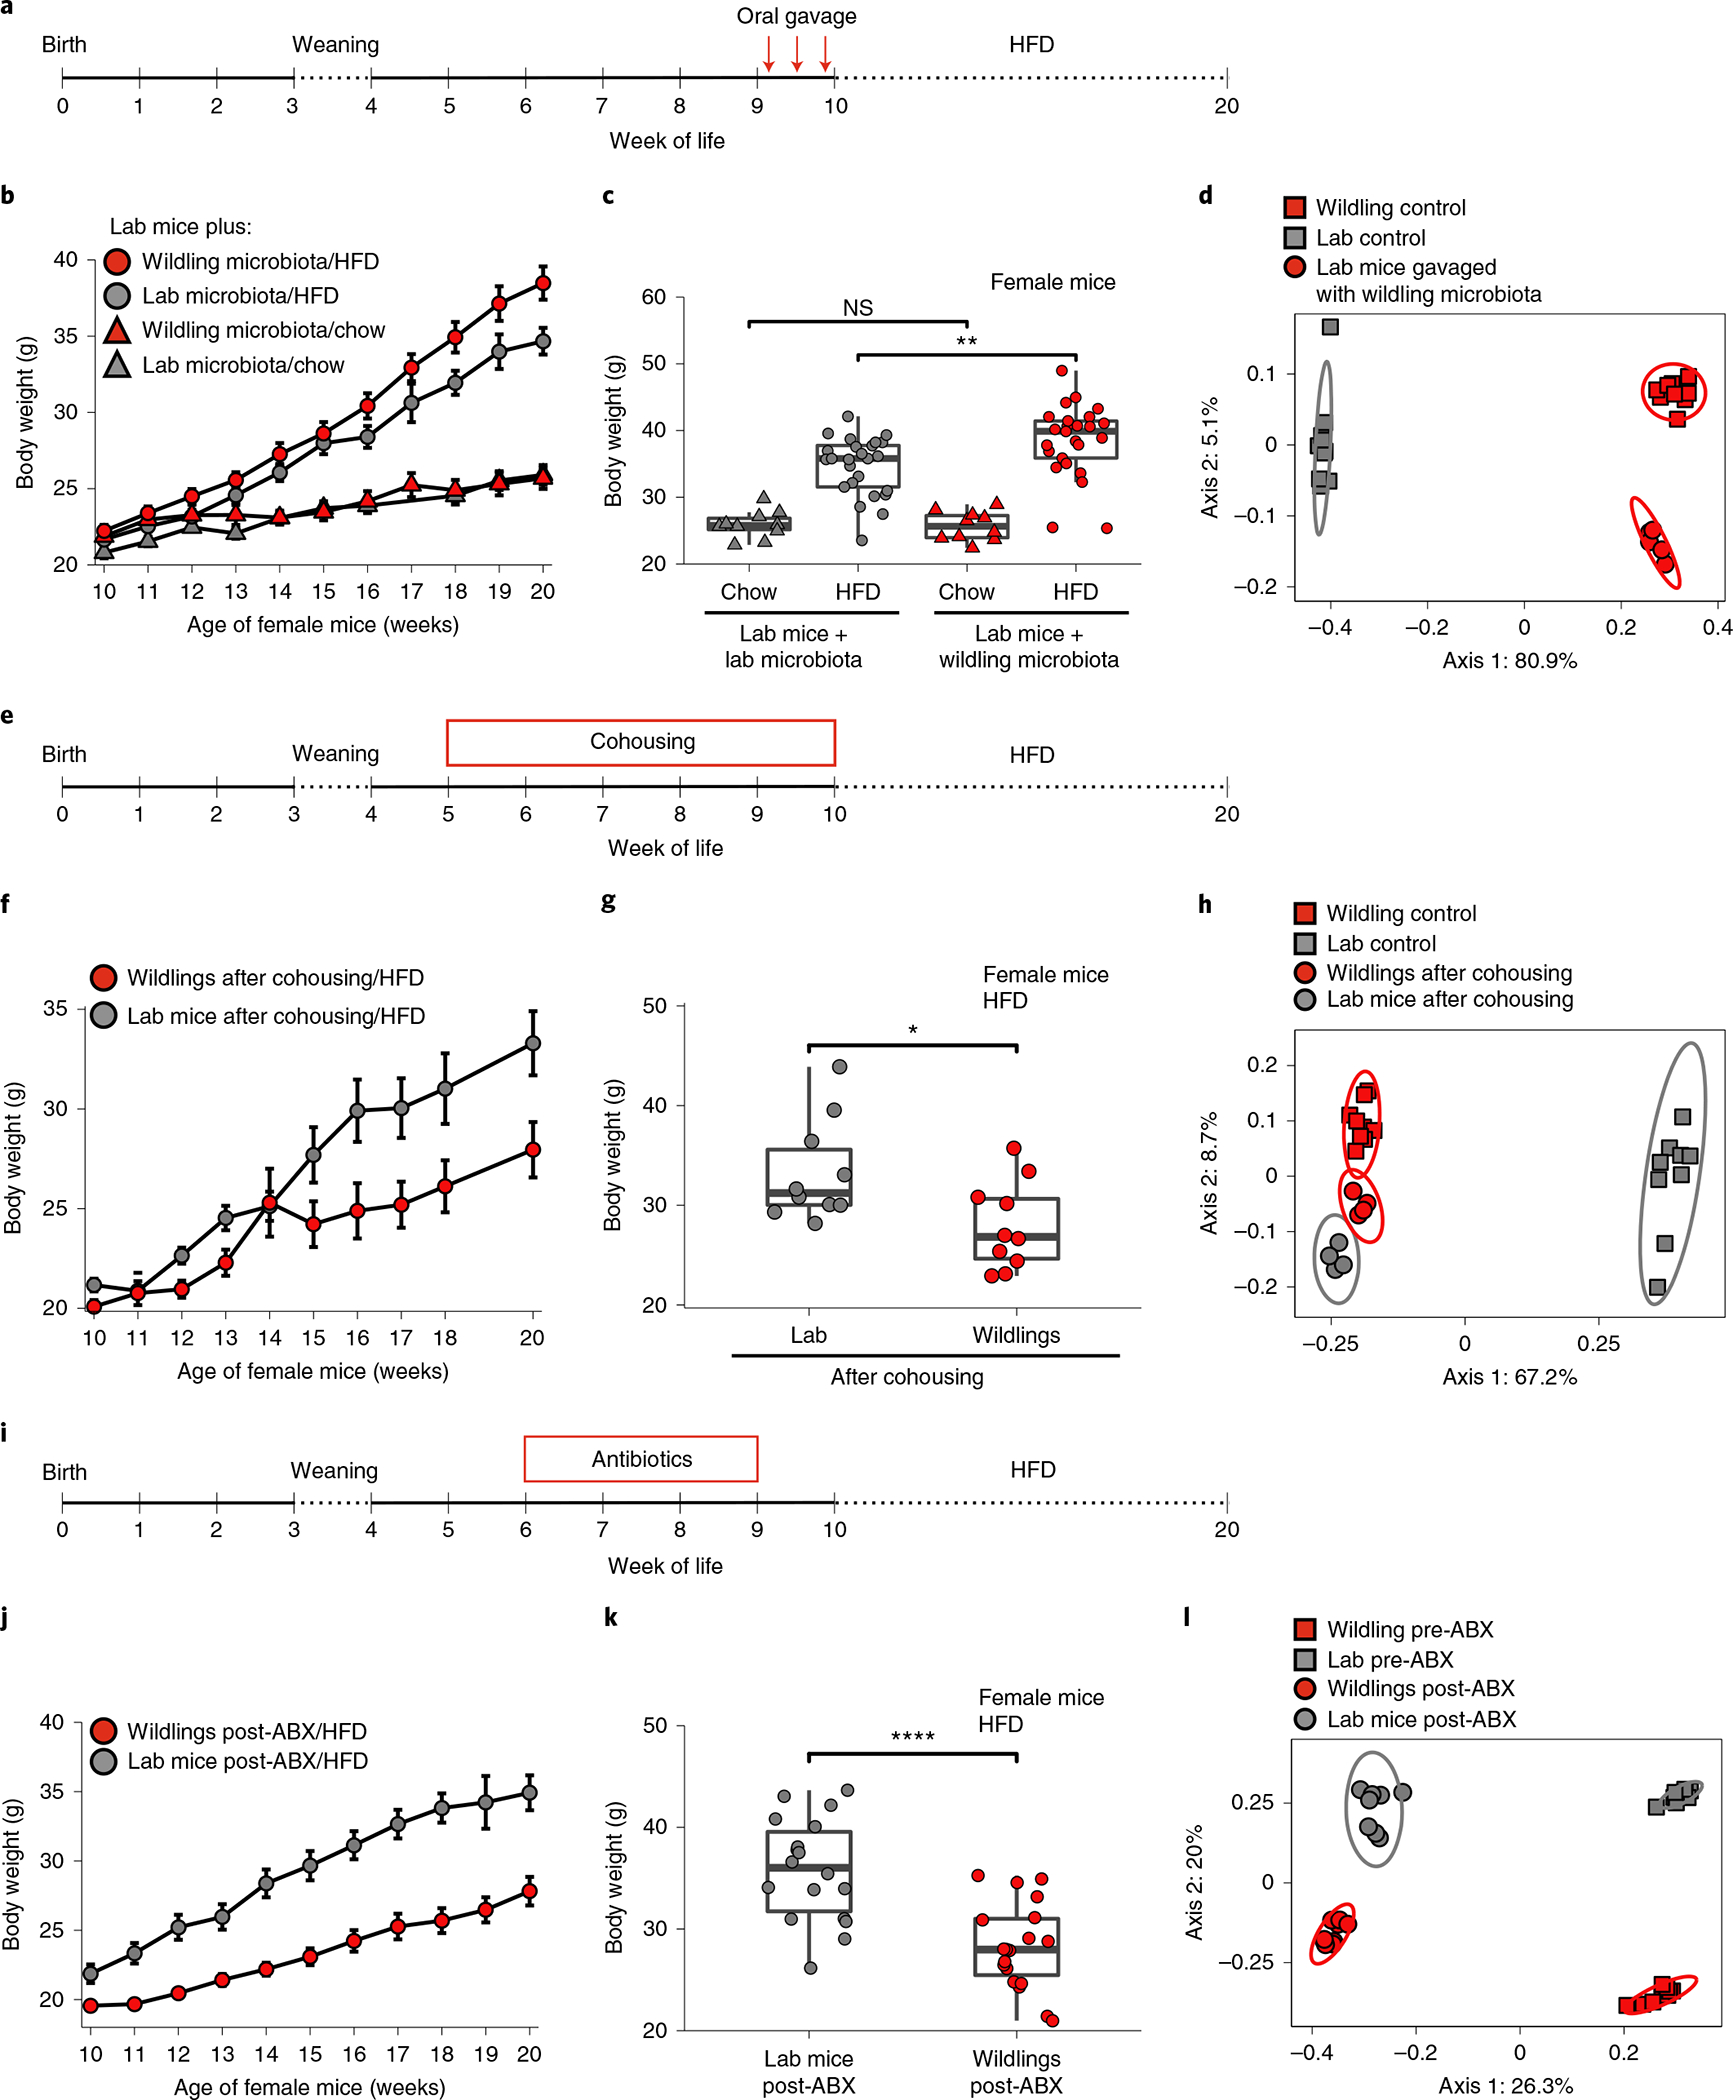
a, Design of experiment. b,c, Weight during (b) and after 10 weeks on chow or HFD (c) of lab mice (n = 10 mice on chow and n = 25 mice on HFD over two independent experiments) that had been gavaged with caecal content from wildlings and of lab mice (n = 10 mice on chow and n = 24 mice on HFD over two independent experiments) that had been gavaged with caecal content from lab mice. d, PCoA (Jaccard distance) of 16S rRNA gene-profiling data of faecal samples from lab mice at week 20 of age on chow diet (10 weeks after gavage with caecal content from wildlings), in comparison with untreated lab mice and untreated wildlings. e, Design of experiment. f,g, Weight over time (f) and after 10 weeks of HFD (g) of n = 10 lab mice and n = 10 wildlings that had been cohoused at weeks 5–10 of age, examined over two independent experiments. h, PCoA (Jaccard distance) of 16S rRNA gene-profiling data of faecal samples from lab mice and wildlings at week 20 of age on HFD (after cohousing for weeks 5–10 of age) in comparison with control lab mice and wildlings. i, Design of experiment. j,k, weight over time (j), and after 10 weeks of HFD (k) of n = 18 lab mice and n = 20 wildlings that had received 3 weeks of antibiotic (ABX) treatment (vancomycin, neomycin, metronidazole, ampicillin) from week 6 to 9 of age. l, PCoA (Jaccard distance) of 16S rRNA gene-profiling data of faecal samples from lab mice and wildlings before (pre-ABX) and 1 week after (post-ABX) a 3-week course of ABX treatment. Mean ± s.e.m. are shown (b, f, j). Ellipses indicate 95% confidence interval (d,h). Box plots show median (centre line), 75th (upper limit of box) and 25th percentiles (lower limit of box) and outliers (whiskers) if values do not exceed 1.5 × interquartile range. Unpaired two-sided Student’s t-test (Gaussian model) (c,g,k). *P < 0.05, **P < 0.01, ****P < 0.0001; exact P values are provided in the Source Data.
To assess the efficacy of the microbiota transfer we used 16S ribosomal RNA gene profiling to compare the gut microbiome of the lab mice that had been gavaged with caecal content from wildlings with the gut microbiome of untreated wildlings and untreated lab mice. This analysis was performed at week 20 of age (that is, 10 weeks after the oral gavage). All mice had been kept on chow diet to avoid HFD-induced changes in the lab mouse microbiome. As shown in the PCoA of 16S rRNA gene-profiling data in Fig. 4d, lab mice that had been gavaged with wildling faecal matter clustered separately from untreated lab mouse controls on axis 1 (accounting for 80.9% of variation) and only slightly apart from untreated wildling controls on axis 2 (accounting for 5.1% of variation). These data demonstrate successful transfer of the wildling gut microbiome to and its maintenance in adult lab mice.
The results were confirmed using a cohousing approach. Cohousing of mice allows the natural transmission of microbiota via coprophagy, and also permits the transfer of commensals and pathogens that reside outside the gut. After cohousing seven female wildlings with five female lab mice from week 5 to week 10 of age, mice were separated and subjected to HFD from week 10 to week 20 of age. Consistent with the results of the caecal content gavage in the previous experiment, lab mice did not acquire the obesity-resistant phenotype (Fig. 4f,g) even though gut microbiome transfer was successful (Fig. 4h).
Next, we asked whether antibiotic-induced perturbation of wild-type gut microbiota in adult life can abrogate the wildlings’ resistance to HFD-induced weight gain. For this purpose, wildlings were subjected to quadruple antibiotic treatment with vancomycin, neomycin, metronidazole and ampicillin in the drinking water from week 6 to week 9 of age and subsequently subjected to a 10-week course of chow or HFD starting at week 10 of age (Fig. 4i). Interestingly, wildlings maintained their protective phenotype and gained significantly less weight than lab mice (Fig. 4j,k) even though their microbiome was significantly disturbed as a result of the antibiotic treatment (Fig. 4l). Collectively, these results demonstrate that the wild-type microbiota-mediated protection against the adverse effects of HFD can neither be transferred nor abrogated in adult life.
Microbiota exposure in early-life programmes the response to HFD.
To test whether wild-type microbiota have to be present in early life to confer protection against the adverse effects of HFD later in life, and to distinguish between prenatal and postnatal exposure, we delivered lab mouse pups via caesarean section and fostered them to either wildling or lab mouse dams (Fig. 5a). This excluded exposure to the wildling microbiome in utero and controlled for delivery mode. The pups were separated from their respective foster dams at the regular weaning date (week 4) and exposed to HFD at week 10 of age. As shown in Fig. 5b, fostering efficiently transferred the bacterial microbiome from the wildling dams to the lab mouse pups. The transferred microbiome was stably maintained, until at least week 10 of age. As shown in Fig. 5c–f, fostering lab mouse pups by wildling dams resulted in statistically significant protection against excessive HFD-induced weight gain during week 10 to week 20 of life in male mice (Fig. 5c,d) with a nonsignificant trend in female mice (Fig. 5e,f).
Fig. 5 |. Microbiota exposure in early-life programmes the response to HFD.
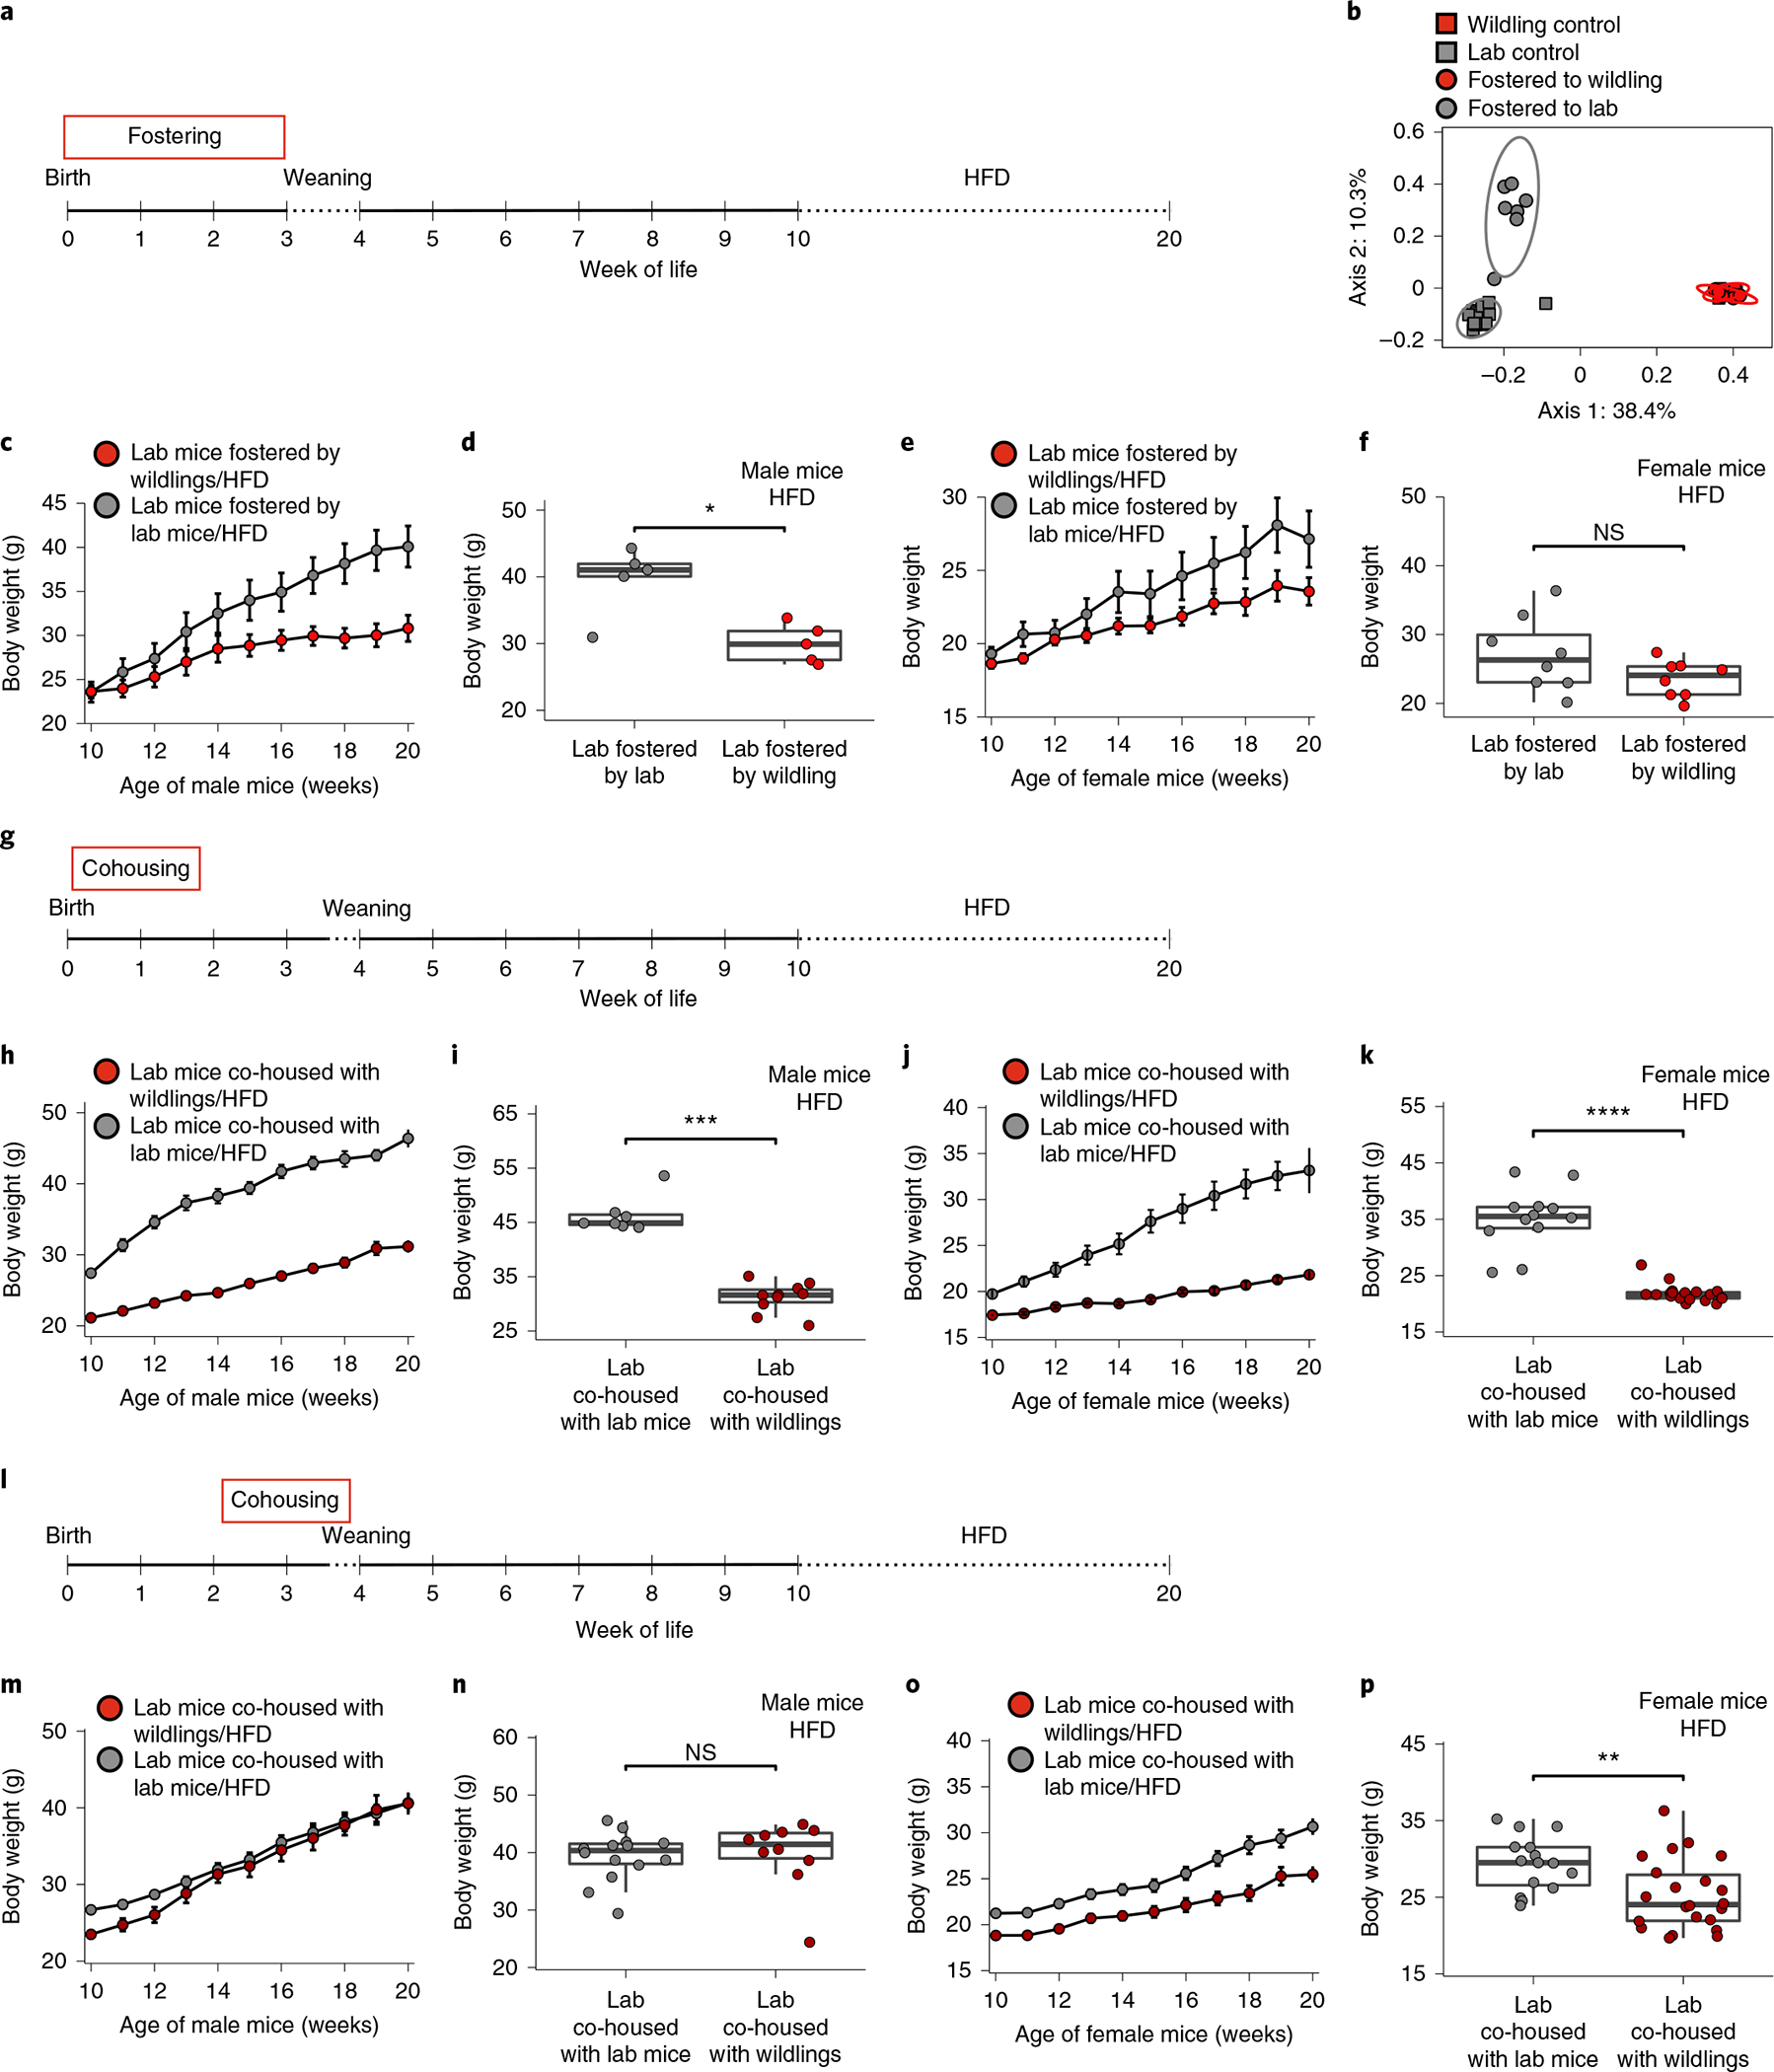
a, Experimental design. Lab mice were delivered via sterile C-section, fostered by either lab or wildling dams and subjected to HFD from week 10 to 20 of age. b, PCoA (Jaccard distance) of 16S rRNA gene-profiling data of faecal samples; ellipses show 95% confidence interval. c,d, Weight of fostered male lab mice (n = 5 per group) during (c) and after 10 weeks (d) of HFD. e,f, Weight of fostered female lab mice (n = 8 per group) during (e) and after 10 weeks (f) of HFD. Data were collected over two independent experiments (b–f). g, Experimental design: at day 2 of age, lab and wildling litters and their respective dams were cohoused for a period of 11 d. As controls, two lab litters and their respective dams were cohoused for the same period of time. After 11 d of cohousing, lab litters and their dams were separated from wildling litters and their dams. The pups were weaned at day 26 of age and subjected to HFD. h,i, Weight of male lab mice (n = 10 had been cohoused with wildlings, n = 7 had been cohoused with lab mice) during (h) and after (i) the 10-week course of HFD. j,k, Weight of female lab mice (n = 19 had been cohoused with wildlings, n = 13 had been cohoused with lab mice) during (j) and after (k) the 10-week course of HFD. l, Experimental design: at day 15 of age, lab and wildling litters and their respective dams were cohoused for a period of 11 d. As controls, two lab litters and their respective dams were cohoused for the same period of time. After 11 d of cohousing, lab litters and their dams were separated from wildling litters and their dams. The pups were weaned at day 26 of age and subjected to HFD. m,n, Weight of male lab mice (n = 10 had been cohoused with wildlings, n = 15 had been cohoused with lab mice) during (m) and after (n) the 10-week course of HFD. o,p, Weight of female lab mice (n = 22 had been cohoused with wildlings, n = 15 had been cohoused with lab mice) during (o) and after (p) the 10-week course of HFD. Mean ± s.e.m. are shown (c,e,h,j,m,o). Box plots show median (centre line), 75th (upper limit of box) and 25th percentiles (lower limit of box) and outliers (whiskers) if values do not exceed 1.5 × interquartile range (d,f,i,k,n,p). Two-sided Wilcoxon rank sum test (d,f,i,k,n,p). *P < 0.05, **P < 0.01, ***P < 0.001, ****P < 0.0001; exact P values are provided in the Source Data.
To confirm that the wildlings’ protection against HFD-induced obesity is programmed after birth and to define the period during which exposure to the wild-type microbiome has to occur, we designed two sets of cohousing experiments. In the first set of experiments, we cohoused pairs of lab and wildling dams with age-matched 2-day-old litters (Fig. 5g). As control, we cohoused pairs of lab mouse dams and their 2-day-old litters. After 11 d of cohousing, wildling dams and wilding litters were separated from lab dams and lab litters. Starting at week 10 of age the offspring were subjected to a 10-week course of HFD (Fig. 5g). As shown in Fig. 5h–k, the protective phenotype was clearly transferred to both female and male lab mice. Eleven days of cohousing lab mice with wildlings (from day 2 to day 12 of age) were sufficient to significantly reduce weight gain upon HFD as compared with lab mice that had been cohoused with lab mice. In fact, male lab mice that had been cohoused with wildlings from day 2 of age had low weight at week 10 of HFD (Fig. 5k), as did male wildlings (Fig. 1c). Female lab mice that had been cohoused with wildlings from day 2 of age had even lower weight at week 10 of HFD (Fig. 5n) than female wildlings (Fig. 1e; 21.8 g ± 1.6 g versus 26.3 g ± 4.6 g, P < 0.0001).
In the second set of experiments, we cohoused pairs of lab and wildling dams with age-matched 15-day-old litters (Fig. 5l). Male lab litters that were cohoused with wildlings from day 15 to day 26 of age were not protected from HFD-induced weight gain. After 10 weeks on HFD, they had gained the same amount of weight as male lab litters that had been cohoused with lab mice (Fig. 5m,n). Similar weight trajectories were observed in the corresponding female lab mice that had been cohoused with lab or wildling litters. Differential absolute starting weight resulted in differential absolute weight at week 10 on HFD (Fig. 5o,p), but the relative weight gain of female lab mice cohoused with either lab or wildling litters did not differ (P = 0.05485).
Collectively, these results show that exposure to the wild-type microbiome within the first 2 weeks of life is key to confer protection against the adverse effects of HFD later in life.
Energy expenditure is increased in wildlings.
After successfully inducing the protective phenotype in lab mice via fostering and early-life cohousing, we set out to determine how the wild-type microbiome rendered mice resistant to excessive weight gain during HFD. We first measured food intake and found that wildling mice consumed the same (on HFD) or more (on chow diet) kcal of food per day than lab mice. This held true for both female and male mice (Extended Data Fig. 2a,b), and for lab mice that had acquired the wildling microbiome during adult age through oral gavage or cohousing (Extended Data Fig. 2). Antibiotic-treated female wildlings and lab mice and lab mice that had been cohoused with wildlings from day 2 of life showed a slightly deceased food intake, but this did not extend to male mice (Extended Data Fig. 2) and thus could not explain the sex-independent protective phenotype. Overall, these data exclude a wild-type microbiome-induced reduction in food intake as potential explanation of the differential weight gain of wildlings and lab mice.
Next, we asked how much of the consumed energy was lost through faeces. By performing faecal bomb calorimetry, we found a slightly higher faecal energy loss in wildlings than in lab mice irrespective of diet. However, faecal energy loss was relatively small compared with the energy intake through food (Extended Data Fig. 3a,b). Based on bomb calorimetry data of energy in faeces and the caloric content of the diet, we calculated the calories that each mouse absorbed per day. As shown in Fig. 6a, wildlings and lab mice absorbed the same number of calories per day, irrespective of diet.
Fig. 6 |. Energy expenditure is increased in wildlings.
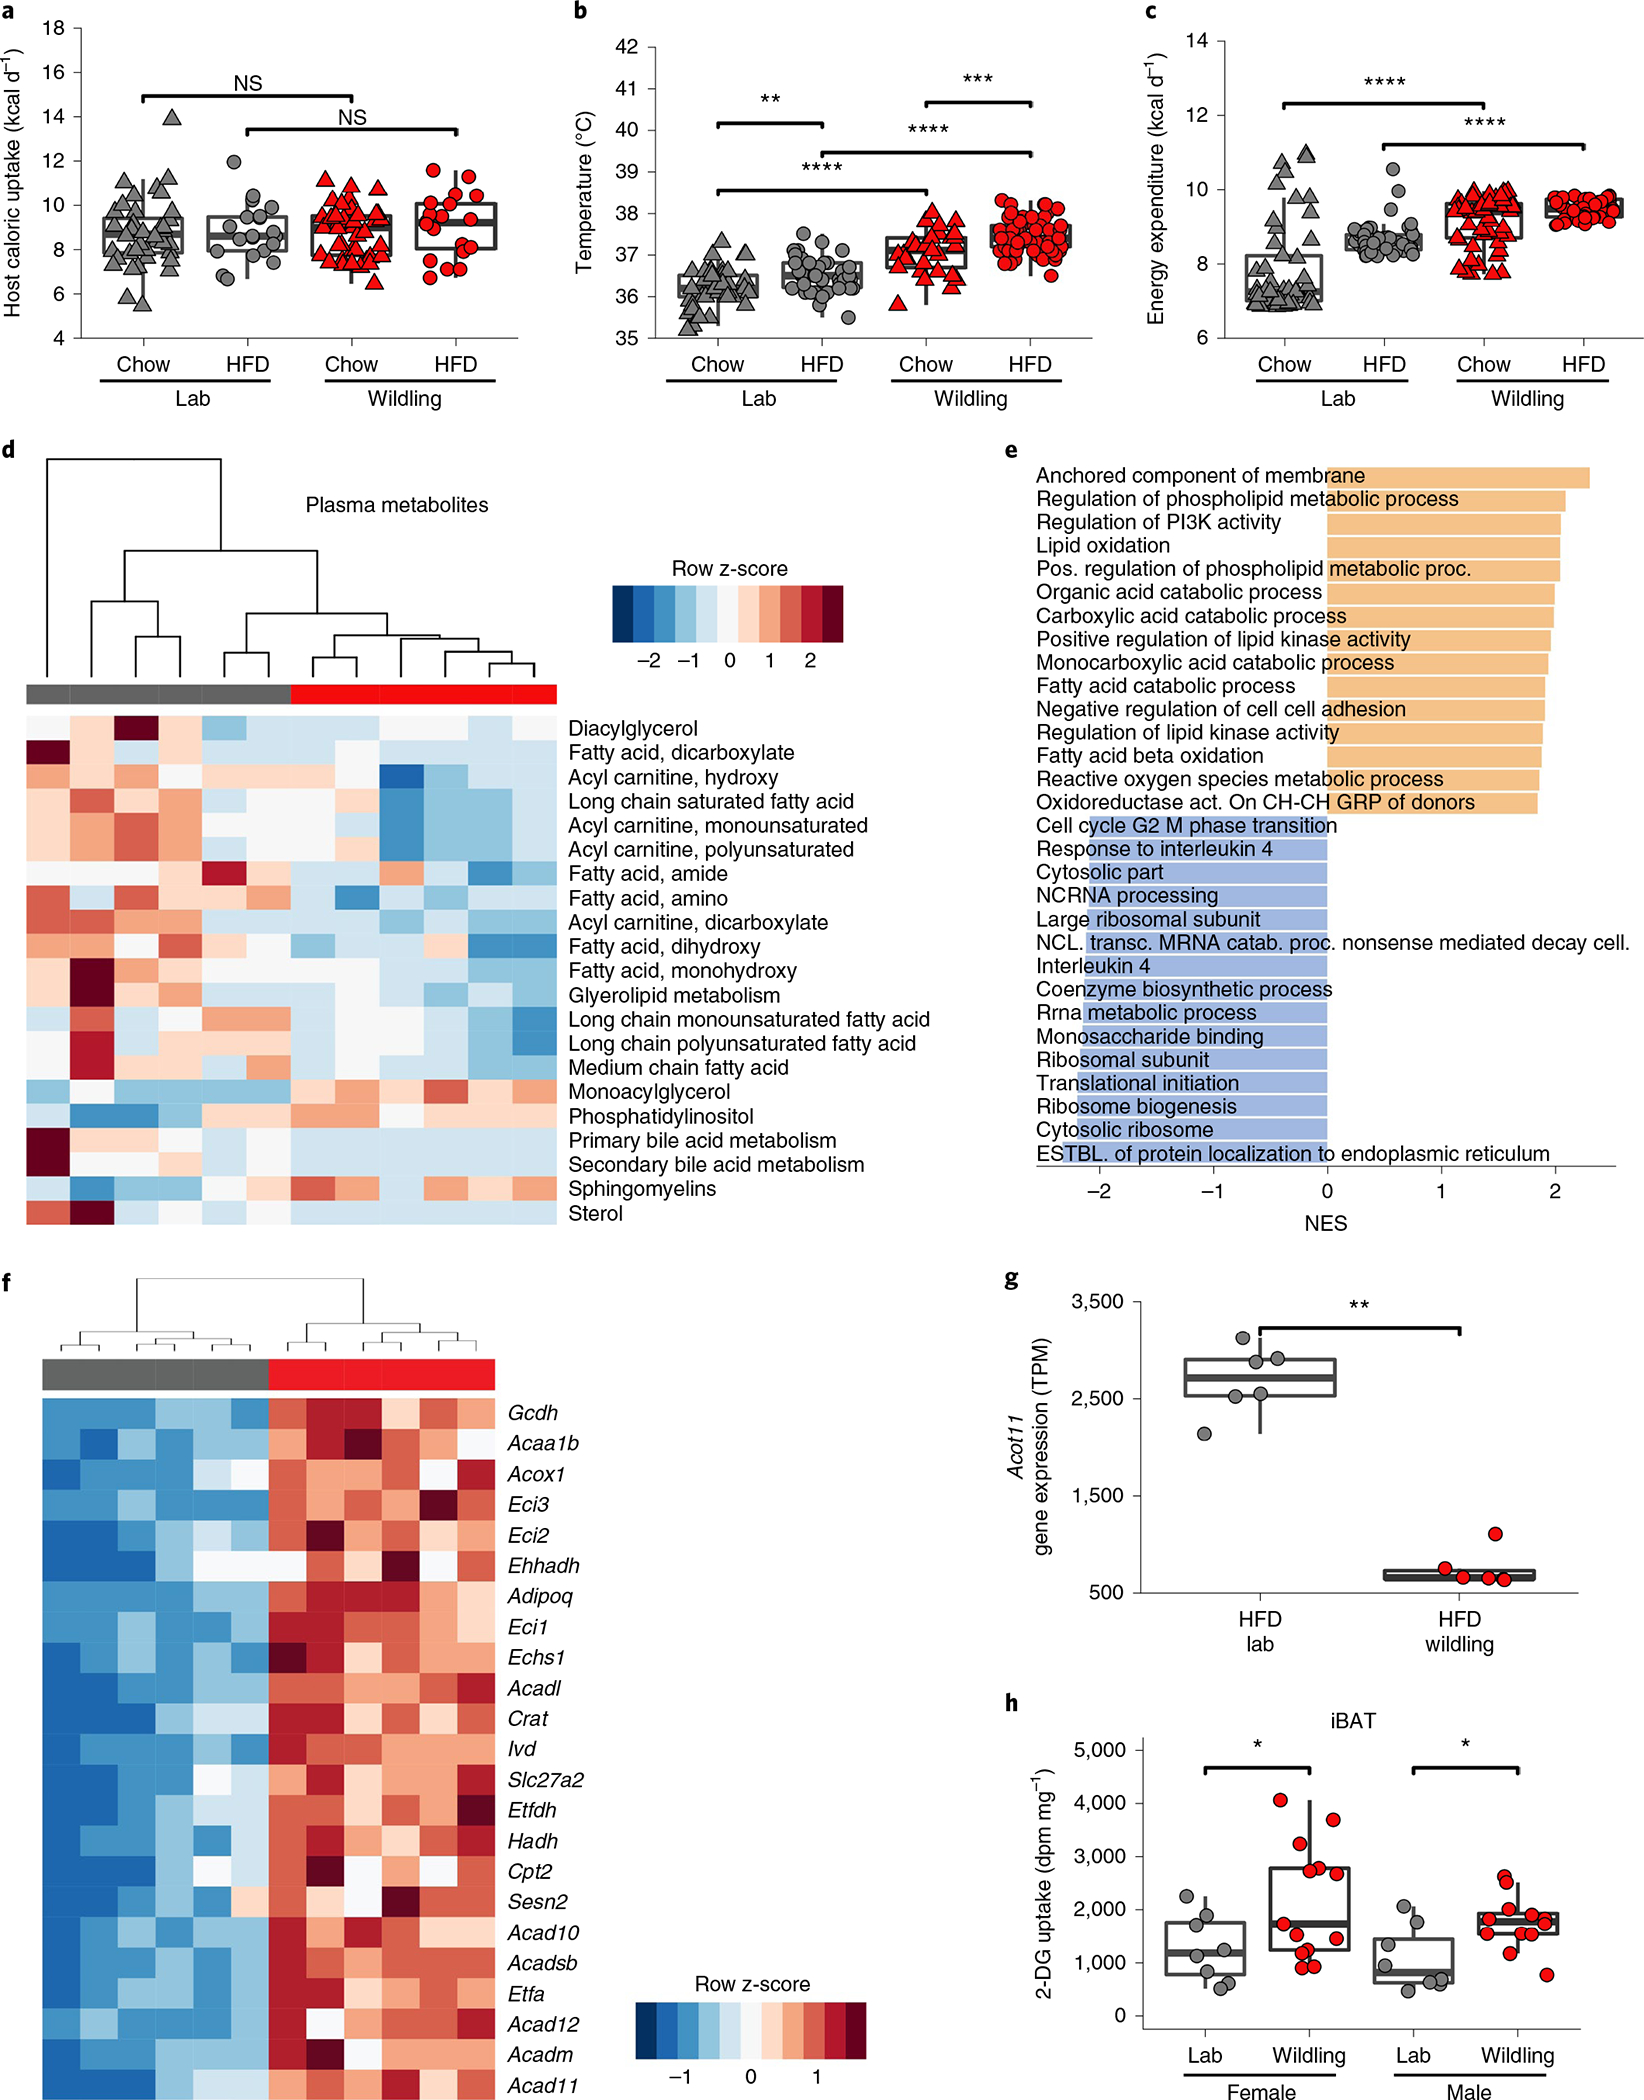
a, Caloric uptake calculated by subtracting faecal energy loss (bomb calorimetry) from energy of consumed food. n = 40 lab mice on chow, n = 20 lab mice on HFD; n = 40 wildlings on chow, n = 20 wildlings on HFD (all female mice) examined over two independent experiments. b, Rectal temperature of female lab or wildling mice on chow or HFD. Each data point represents the mean of weekly measurements of a single mouse at weeks 7–9 of diet. n = 42 lab mice on chow, n = 55 lab mice on HFD; n = 42 wildlings on chow, n = 60 wildlings on HFD (all female mice) examined over three independent experiments. c, Energy expenditure during 10 weeks on the respective diet (means of overall energy expenditure per mouse) as calculated using a virtual calorimetry chamber algorithm. n = 42 lab mice on chow, n = 55 lab mice on HFD; n = 30 wildlings on chow, n = 60; wildlings on HFD examined over 3 independent experiments. d, Unsupervised clustering of subpathways classified as lipid-related, based on metabolite analysis (using the Metabolon HD4 Panel) of plasma from n = 6 lab mice (grey) and n = 5 wildling mice (red) examined after 10 weeks of HFD over two independent experiments. e–g RNA-seq data from iBAT from n = 6 female lab mice (grey) and n = 6 female wildling mice (red) after 10 weeks of HFD. Gene set enrichment analysis showing the 15 most strongly upregulated (orange) or downregulated (grey) gene sets in wildling iBAT compared with lab mouse iBAT, sorted by maximum normalized enrichment score (NES) (e). Unsupervised clustering of transcripts from the gene ontology group ‘fatty acid beta-oxidation’ that are differentially expressed in BAT from wildling versus lab mice (f). Acot11 mRNA level; TPM, transcripts per kilobase million (g). h, 2-DG uptake per milligram of iBAT from lab and wildling mice at 18 °C. n = 8 female lab mice, n = 13 female wildlings; n = 8 male lab mice, n = 12 male wildlings. All data are from female mice in a–g; male and female mice are shown h. Box plots show median (centre line), 75th (upper limit of box) and 25th percentiles (lower limit of box) and outliers (whiskers) if values do not exceed 1.5 × interquartile range (a–c,g,h). Two-sided Wilcoxon rank sum test (a–c,g,h). *P < 0.05, **P < 0.01, ***P < 0.001, ****P < 0.0001; exact P values are provided in the Source Data. dpm, disintegrations per minute.
We therefore hypothesized that the differential weight gain of wildlings and lab mice on HFD was rooted in an increased energy expenditure in wildlings. Indeed, when performing weekly rectal temperature measurements, we found a significantly higher body temperature in wildlings than in lab mice irrespective of sex (females, Fig. 6b; males, Extended Data Fig. 3c). HFD induced significantly higher body temperature than chow diet in both wildlings and lab mice (female mice, Fig. 6b; male mice, Extended Data Fig. 3c).
To assess the cause of the increased rectal temperature we determined total energy expenditure. Because mice with wild-type microbiomes were not permitted in SPF-animal core facilities, we calculated energy usage based on food intake, faecal energy loss and weight gain using an algorithm that was developed by Guo and Hall29. This analysis clearly demonstrated increased energy expenditure in wildlings as compared with lab mice, and these results extended to both HFD and chow diet (Fig. 6c).
Lipid metabolism and brown adipose tissue (BAT) activity are increased in wildlings.
As most calories in the HFD are derived from fat, we analysed the plasma lipid content and composition of both wildlings and lab mice. The plasma concentrations of almost all major lipid classes were lower in wildlings than in lab mice on HFD (Fig. 6d). As wildlings and lab mice consumed equal quantities of calories (Fig. 6a), we asked whether increased lipid usage in wildling mice or increased lipogenesis in lab mice explained this finding. Because the liver is one of the major sites of lipid metabolism in the body30, we performed RNA sequencing (RNA-seq) on bulk liver tissue to assess liver metabolism. The overall hepatic transcriptome was vastly different between lab mice and wildlings on HFD (Extended Data Fig. 4a,b). Among all differently expressed transcripts of metabolism-related enzymes, those that concern lipogenesis were exclusively upregulated in lab mice (Extended Data Fig. 4c). Among these were transcripts of ACACA and ACACB, which encode acetyl-CoA-carboxylase 1 and 2. These enzymes catalyse the rate-limiting step of de novo fatty acid biosynthesis.
Next, we asked which tissue may be responsible for the increased energy expenditure of wildlings. BAT is important for energy homoeostasis as it can generate heat in a process called nonshivering thermogenesis31. Thus, we performed RNA-seq analysis on interscapular BAT (iBAT) of female wildlings and lab mice after 10 weeks of HFD. A gene set enrichment analysis with annotation by gene ontology terms revealed that many upregulated pathways in wildlings were related to lipid oxidation (Fig. 6e). Specifically, all genes of the fatty acid beta-oxidation pathway were increased in wildlings compared with lab mice (Fig. 6f). In contrast, transcripts of acyl-coenzyme A thioesterase 11 (Acot11) were strongly reduced in wildling mice on HFD (Fig. 6g), which is posited to increase substrate availability for uncoupling protein 1 (UCP1). Reduced Acot11 expression was previously shown to protect against diet-induced obesity in mice32.
To provide further functional evidence for an increased activity of BAT we performed 2-deoxy-d-[1–14C] glucose (2-DG) uptake studies. As shown in Fig. 6h, iBAT of both male and female wildlings took up significantly more 2-DG than that of lab mice after 1 week on HFD when mice were kept at 18 °C (relatively cold conditions). When mice were kept at 28 °C, 2-DG uptake into iBAT was significantly reduced and the difference between lab and wildling mice was abrogated (Extended Data Fig. 5a,b). Increased 2-DG uptake was also observed in iWAT and pgWAT of female wildlings, but not male wildlings, compared with their lab counterparts (Extended Data Fig. 5c–f). Despite clear evidence of increased BAT activity, UCP1 and AMPKα1 protein expression was not increased in iBAT of wildling compared with lab mice and only tyrosine hydroxylase expression was increased in male lab mice (Extended Data Fig. 6).
When analysing hormones implicated in energy homoeostasis, we found several important regulators of overall energy expenditure to be differently expressed (Extended Data Fig. 7a). The blood concentration of peptide YY (PYY), a peptide hormone released from entero-endocrine cells in the intestine, was increased in female and male wildlings compared with lab mice at baseline (week 10 of age) and at weeks 1 and 10 on HFD. PYY is known to be produced in early life33 and has been shown to impact metabolic health34. While this effect is often mediated by reduced food intake35, PYY also affects energy expenditure via induction of thyrotropin-releasing hormone36, which in turn induces the production of thyroid-stimulating hormone (TSH). Indeed, TSH was increased in female and male wildlings compared with lab mice at baseline, and in male wildlings compared with male lab mice additionally at week 1 on HFD (Extended Data Fig. 7). Thus, the wildling bacterial gut microbiome appears to be capable of increasing PYY release from the gut37. In addition to PYY, glucagon and GLP1 concentrations were increased in female and male wildlings compared with lab mice, but only at week 10 on HFD (Extended Data Fig. 7). Glucagon plays a role in overall energy expenditure38 and may specifically affect BAT thermogenesis39.
These results demonstrate that wild-type microbiota induce the secretion of metabolically active hormones and increase the capacity for fatty acid beta-oxidation in the BAT of wildlings. This prevents the increased lipogenesis and the weight gain that is observed in lab mice on HFD.
Transfer of modified microbiome induces obesity resistance.
To explore the specific components of the microbiome that contribute to the metabolic phenotype, we exposed wildlings to a 3-week course of quadruple antibiotic treatment (vancomycin, neomycin, ampicillin, metronidazole) and thereafter transferred the modified microbiome to lab mice via cohousing. After 2 weeks of cohousing, we separated the lab mice and started breeding them. This strategy allowed their offspring to be exposed to the modified microbiome during early life but prevented direct exposure to the antibiotics (Fig. 7a). A PCoA analysis of 16S rRNA gene-profiling data demonstrated that these offspring did not maintain the original lab mouse microbiome and did not acquire the wildling microbiome (Fig. 7b) because the latter was modified by antibiotic treatment before cohousing. Rather, the lab mouse offspring had a modified microbiome (MM) and are therefore termed MM-lab mice hereafter. Importantly, when we placed the MM-lab mice on HFD, their weight gain was identical to that of wildlings (Fig. 7c,d). Thus, the ‘obesity-resistant’ phenotype was transferred.
Fig. 7 |. Transfer of modified microbiome induces obesity resistance.
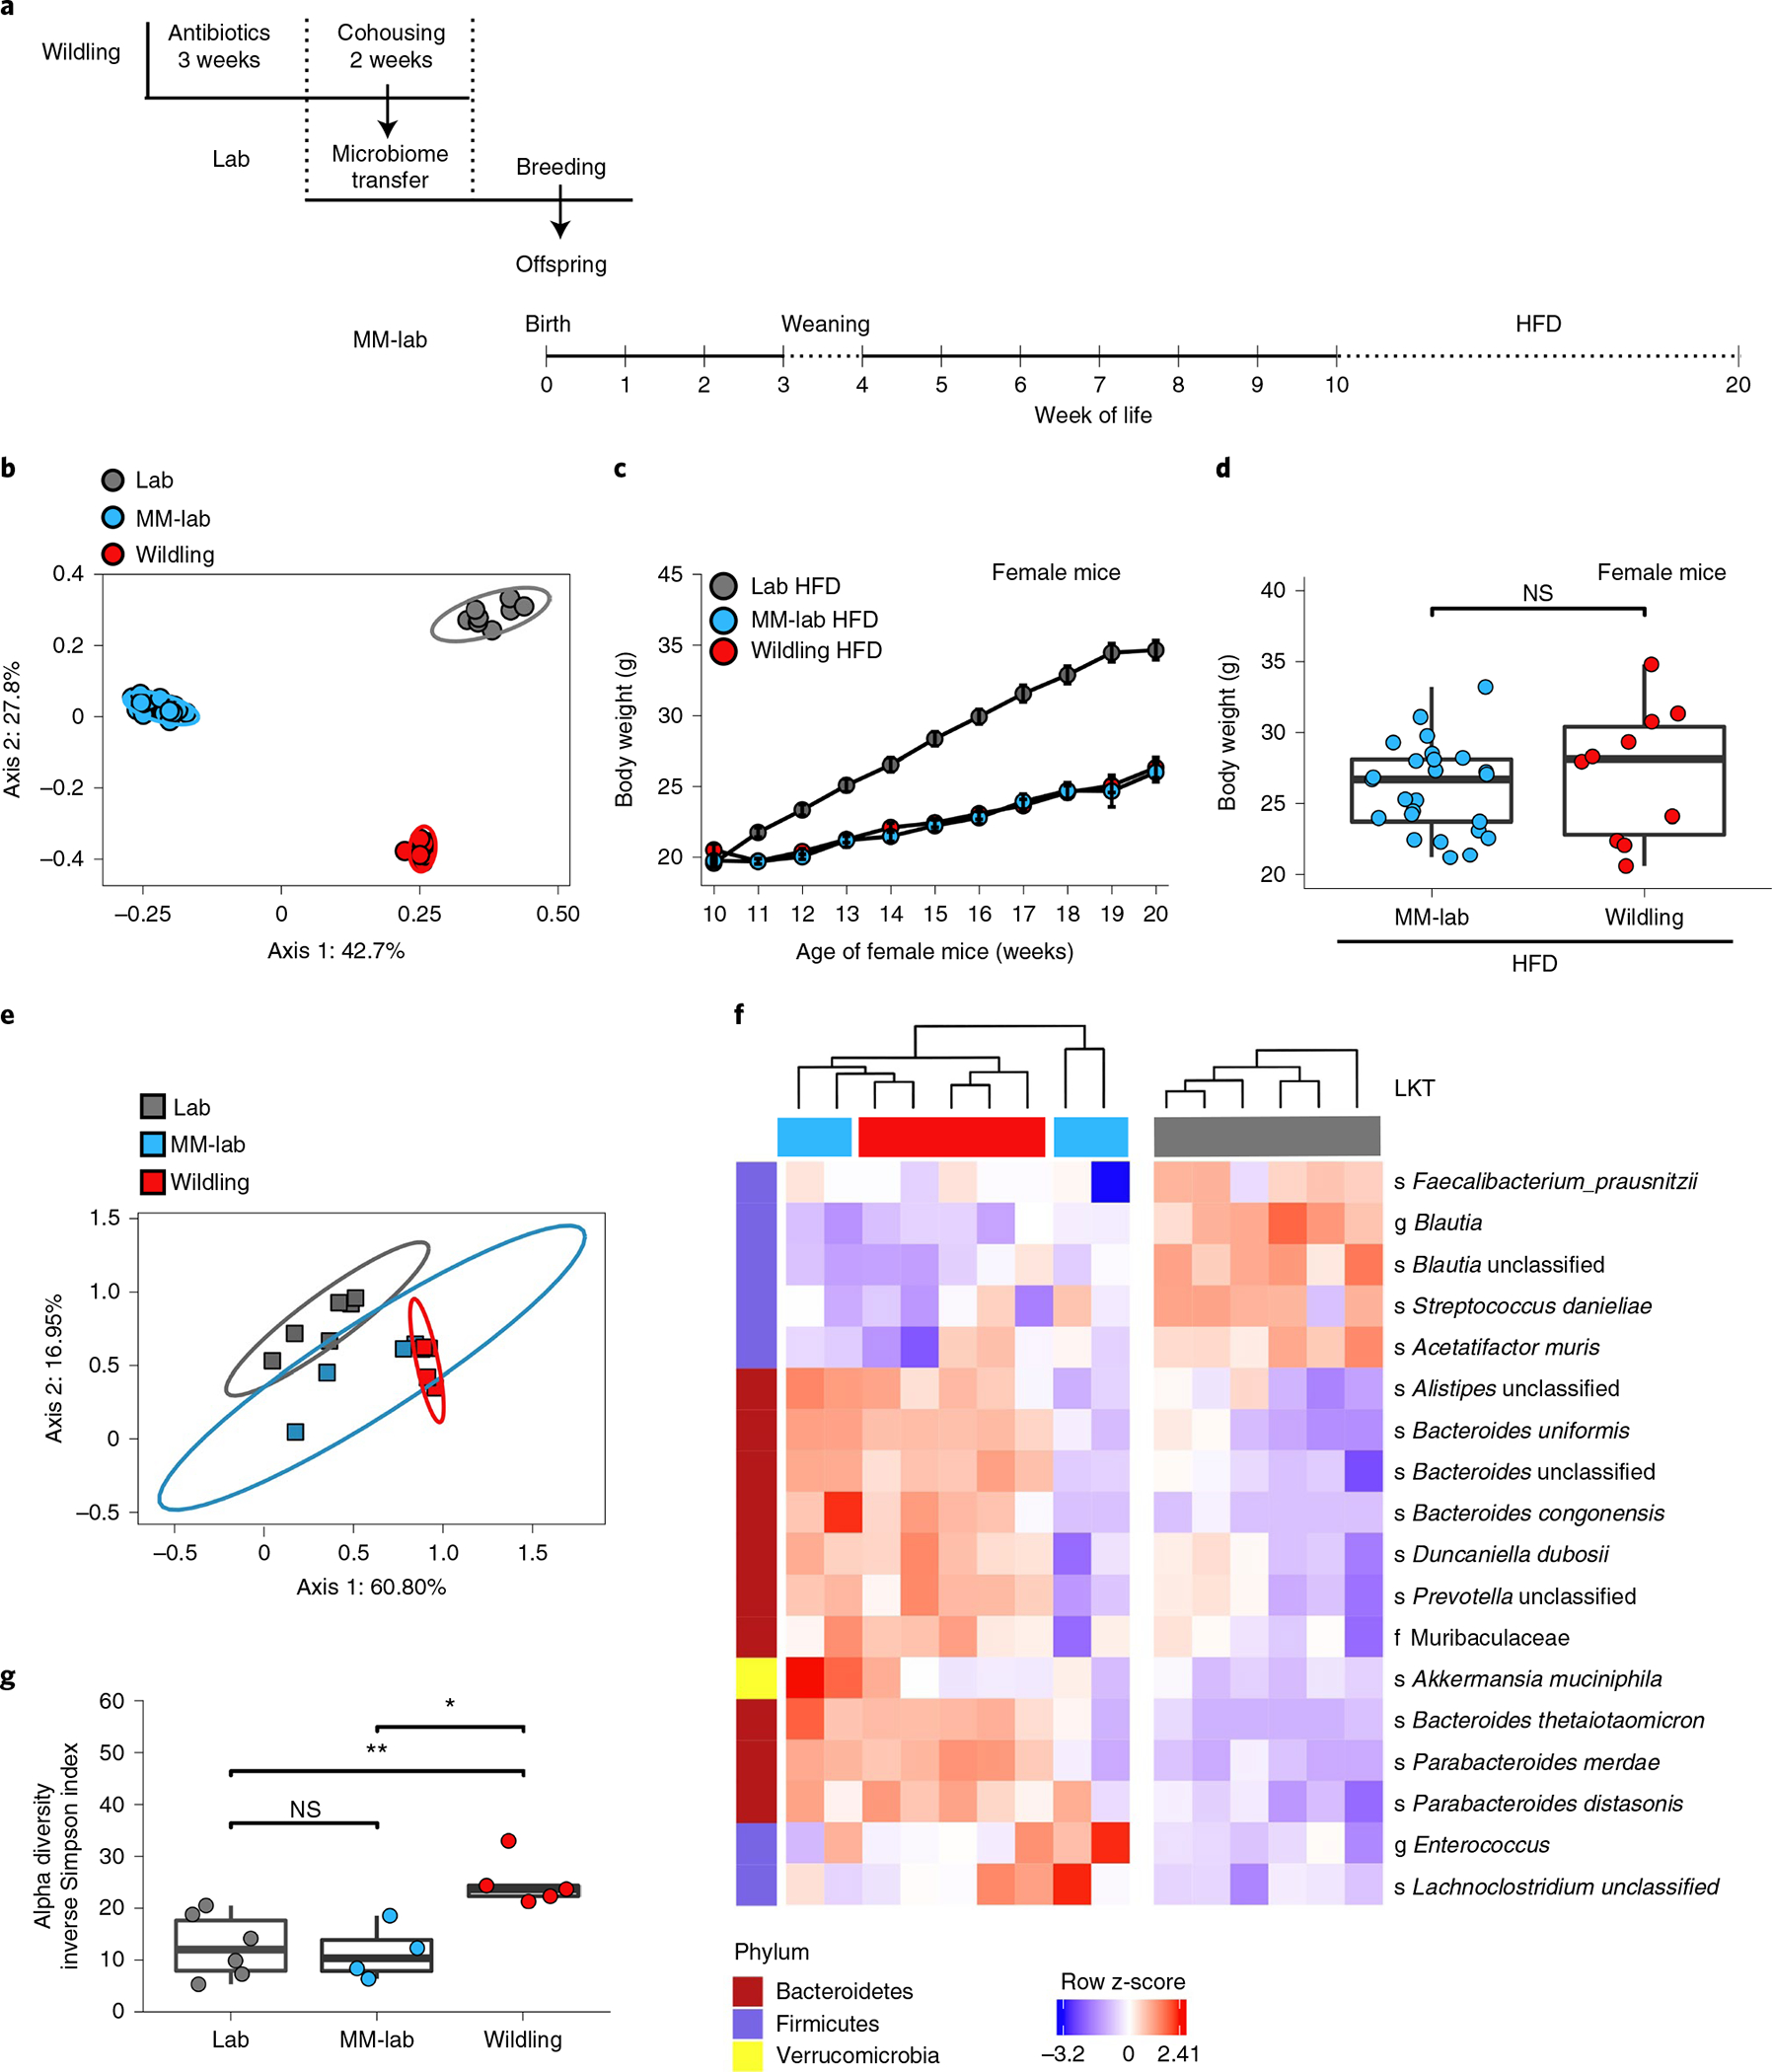
a, Experimental design. Lab mice were cohoused with antibiotic-treated wildlings for 2 weeks and then separated and bred. Their offspring (MM-lab) were used for experiments. b, PCoA (Jaccard distance) of 16S rRNA gene-profiling data of faecal samples from wildlings, lab mice and MM-lab mice. c, Weight gain of female wildlings, lab mice and MM-lab mice on HFD. Data from lab mice and wildling mice are from Fig. 1b; n = 25 MM-lab mice on HFD, n = 55 lab mice on HFD, n = 60 wildlings on HFD. Data are presented as mean values ± s.e.m. d, Weight of n = 25 female MM-lab mice and n = 10 wildlings after 10 weeks of HFD. Box plot shows median, IQR (box), and 75th and 25th percentiles (whiskers) (two-sided Mann–Whitney U test). e–g, Shotgun metagenomic sequencing data of the caecal microbiome from 12-day-old pups (n = 5 wildlings, n = 4 MM-lab mice, n = 6 lab mice): PCoA (e); heat map showing microbial LKTs that are equally shared between MM-lab mice and wildlings and significantly different to lab mice (f); alpha diversity expressed as inverse Simpson index (g). Ellipses show 95% confidence interval (b, e). Box plots show median (centre line), 75th (upper limit of box) and 25th percentiles (lower limit of box) and outliers (whiskers) if values do not exceed 1.5 × interquartile range (d,g). Two-sided Wilcoxon rank sum test. *P < 0.05, **P < 0.01; exact P values are provided in the Source Data.
Because microbiome transfer was limited during the 2-week cohousing period, we were able to reduce the number of pathogens that may contribute to the ‘obesity-resistant’ phenotype. Specifically, we were able to exclude an effect of pinworms (not transferred; Supplementary Table 1). With regard to protozoa, we were able to exclude an effect of Entamoeba muris (detected in wildlings, lab mice and microbiome-modified lab mice) and Tritrichomonas muris (not transferred) (Supplementary Table 1). With regard to viruses, we were able to exclude an effect of lymphocytic choriomeningitis virus (LCMV), mouse parvovirus, mouse rotavirus and mouse theilovirus (not detected in any of the three groups of mice) and mouse norovirus (detected in all groups of mice) (Supplementary Table 1).
Because we had previously established that exposure to the microbiome of wildling mice needs to occur during the first 2 weeks of life, we decided to compare the caecal content of 12-day-old pups of wildings, lab mice and MM-lab mice via shotgun metagenomic sequencing. While the samples from wildlings and lab mouse pups still clustered apart, those of MM-lab mouse pups were not as clearly separated (Fig. 7e). Indeed, based on unsupervised clustering of the most variant taxa, MM-lab mice were interspersed with lab mice and wildlings (Extended Data Fig. 8a). At day 12 of age, the number of unique taxa was reduced (Extended Data Fig. 8b), compared with adult age (Extended Data Fig. 1a). In addition, the diversity of the bacterial microbiome of MM-lab mouse pups was significantly lower than that of wildling pups and at the same level as that of lab mouse pups (Fig. 7 and Extended Data Fig. 8c,d). Only a few taxa were shared among pups of mice with the obesity-resistant phenotype (wildlings and MM-lab mice) yet were significantly different from lab mice (Fig. 7f). Most of them classified as Bacteroides. Akkermansia muciniphila was the sole representative of the phylum Verrucomicrobia in MM-lab and wildling pups and it was significantly more abundant than in lab mouse pups (Fig. 7f). In contrast, in adult life A. muciniphila was more abundant in lab mice than in wildlings and increased further in abundance after HFD exposure (Extended Data Fig. 1d). Another example of this inverse relationship is Faecalibacterium prausnitzii, which was more abundant in 12-day-old lab pups compared with wildling and MM-lab pups (Fig. 7f) but enriched in adult wildlings on HFD (Extended Data Fig. 1d).
Collectively, these results identify a modified microbiome of reduced complexity and diversity that transfers an obesity-resistant phenotype in a short window of early life (Extended Data Fig. 9).
Conclusions
The influence of the microbiota on host physiology is extensive, affecting the development of the immune system5,40, metabolism9,41 and the pathogenesis of diseases42. Here, we show that a wild-type microbiome exerts strong effects on the host response to HFD that are not observed in mice with a standard laboratory microbiome. Despite identical C57BL/6 background, wildlings displayed significantly reduced weight gain compared with conventional laboratory mice on HFD. This phenotype was present in both male and female mice. Whereas liver injury, liver fat accumulation and fasting glucose levels were all significantly lower in wildlings on HFD compared with lab mice on HFD, there was still a significant increase in liver fat accumulation and fasting glucose levels in wildlings on HFD compared with wildlings on chow. This suggests that the beneficial effect of the wild-type microbiota is mediated through reduced weight gain, rather than through a direct effect on glucose homoeostasis or liver adipogenesis. This places the focus on obesity as the underlying condition for those diseases.
With similar energy intake (food consumption) and energy loss (faecal bomb calorimetry) as lab mice, wildlings displayed an elevated metabolism as indicated by virtual caloric chamber assessment and increased rectal temperature. The increased energy expenditure of wildlings was associated with higher activity of BAT. This is evidenced by a transcriptomic signature of increased fatty acid beta-oxidation and elevated 2-deoxyglucose uptake in iBAT of wildlings compared with lab mice. While UCP1 protein expression was similar in iBAT of wildlings and lab mice, greater substrate availability through the observed increase in Acot11 expression may contribute to the higher activity of wildling iBAT32. Higher BAT activity was associated with an increase in gut-derived metabolic hormones such as PYY, which regulates secretion of thyroid hormones34,36, and glucagon39. An intriguing result of this study was the definition of a narrow window in early life during which the wild-type microbiome had to be present to induce the obesity-resistant phenotype. Interestingly, proliferation of brown adipocytes in mice is greatest until roughly 2 weeks after birth and then quickly diminishes43. This suggests a window of 2 weeks after birth during which brown adipocyte development can be influenced by the wildling microbiome, resulting in increased BAT activity that extends well into adulthood, possibly for life, and protects from diet-induced obesity. Collectively, these data demonstrate that the wild-type microbiota affect host metabolism in tissues that are distant from the gut.
Recent studies emphasized the importance of microbiota in early life for physiologic development44 and reported long-lasting negative effects if this critical period is disturbed40,41. Here, we asked whether the wild-type microbiota can be employed as a therapeutic measure to exert long-term beneficial effects. While we demonstrated effective transfer of microbiota in adult mice via multiple measures (oral gavage, cohousing), we were not able to induce protection from the negative effects of HFD. Vice versa, severely impacting the bacterial wild-type microbiome of adult wildlings through a 3-week-long quadruple antibiotic therapy did not abrogate protection from the adverse effects of HFD. Solely in experiments where laboratory mice were exposed to wild-type microbiota early in life (fostering, cohousing) were we able to induce protection from weight gain. This highlights two important aspects: first, the wildlings’ metabolic phenotype is dominant over the lab metabolic phenotype. Second, the first 2 weeks of life are a critical window, during which programming of the metabolic activity for adult life occurs.
To explore the specific components of the microbiome underlying the metabolic phenotype, we established microbiome-modified lab mice and demonstrated that their offspring were protected against HFD-induced obesity. At day 12 of life, these offspring shared specific taxa with wildlings that were significantly less abundant in lab mice. These shared taxa were enriched in members of the phylum Bacteroidetes, which were also enriched in adult wildling mice on HFD as compared with adult lab mice on HFD (Fig. 3d), pointing to a beneficial host–bacteria interaction28. Among the shared taxa that were specifically present in early life in mice (wildlings and MM-lab mice) with obesity-resistant phenotype was A. muciniphila—a species that has been demonstrated to limit weight gain45. However, this effect would have to be initiated in a specific period of life, because adult lab mice had even greater abundance of A. muciniphila than adult wildling mice on HFD (Fig. 3f) and were not protected from developing obesity.
While members of other nonbacterial kingdoms of the microbiome cannot be excluded from contributing to the obesity-resistant phenotype, it is notable that the pathogen profile of the protected MM-lab mice was much reduced. Further studies will have to address this complex question in more detail.
In addition to the inability to change the metabolic response of lab mice via microbiota transfer after the first 2 weeks of life, any influence of the microbiota during pregnancy appears to be dispensable for the particular phenotype in our study. Thus, early life is critical, as the microbiome-induced protective effect can neither be induced nor taken away later on in life. These data define a specific postnatal period that will be important for further investigation towards the development of new therapies.
Methods
Mice.
Male and female wildling mice with wild mouse microbiome and pathogens were sourced from a colony of mice (called wildlings) that we had started by transfer of C57BL/6NTac embryos into pseudopregnant female wild mice as previously reported21. The wildling colony was housed and bred at the National Institute of Diabetes and Digestive and Kidney Diseases (NIDDK), NIH under Biosafety Level-2 (BSL-2) conditions with BSL-3 practices in an animal facility room separate from the standard SPF facilities. To minimize potential divergence of microbiota within the colony, pups from several wildling breeding cages were combined into large mouse cages (1,355-cm2 interior floor area; Lab Products) upon weaning at week 4 of age. Subsequent wildling breeders were sourced from different large cages to facilitate constant microbial cross-exposure of mice within the colony. Bedding of breeder cages was transferred regularly to weaned mice until week 10 of age or until experiments (fostering, cohousing, gavage, diet studies) were started.
SPF C57BL/6NTac mice were purchased from Taconic Biosciences. They were shipped to the NIH in cages holding up to 15 mice, and randomly moved to standard, regular-size cages after arrival at the NIH. Sex- and age-matched mice were used for all experiments.
All mice were housed under 12:12 h light-dark cycles in ventilated cages at ambient room temperatures (20–24 °C) and 30–70% humidity with bedding material (wood chips) and nesting material (cat. no. 7090; Envigo). Mice were provided with either autoclaved chow diet (NIH-Formula 31) or a high-fat, choline-deficient diet with 45% of the calories coming from fat (cat. no. D05010402; Research Diets)46, and received autoclaved tap water ad libitum. Weight, food consumption and rectal temperature were recorded weekly. All procedures were performed in accordance with the Guide for the Care and Use of Laboratory Animals under an animal study protocol approved by the NIDDK Animal Care and Use Committee.
Faecal microbiota transplantation.
The caecum was removed from euthanized donor mice and opened longitudinally. Caecal content was extracted into O2-free, sterile, warm PBS, pushed through a 70-μm strainer and immediately gavaged into recipient mice (200 μl volume per mouse). The ratio of donor-to-recipient mice was 1:2. After each gavage, the mice were transferred to a new cage.
Fostering.
Timed pregnancies of wildling mice were set up at the NIH and timed-pregnant SPF C57BL/6NTac mice were purchased from Taconic Biosciences. At 2 d before delivery (embryonic day 16), the pregnant mice were injected with 4.5 mg medroxyprogesterone. On embryonic day 19, mice were anaesthetized and euthanized via cervical dislocation. The pups were delivered via sterile C-section, moved to a preheated, sterile, damp gauze and carefully monitored for onset of regular breathing. Next, mice were brought into contact with bedding from the cage from the dam that they would be fostered to. The age-matched pups of the foster mother were marked via clipping of the tail to distinguish them from the fostered pups that were placed in the same cage. Cages were left undisturbed for at least 2 d to facilitate acceptance of foster pups. Pups were weaned at 4 weeks of age unless otherwise stated.
Cohousing.
For cohousing starting at week 5 of age, five female lab mice were moved into a large mouse cage (1,355-cm2 interior floor area; Lab Products) together with seven age-matched female wildlings. Wildlings were marked either by tail clipping or by ear punch. After 5 weeks of cohousing, mice were separated and moved into small cages for the HFD studies.
For early-life cohousing, two female dams and their age-matched litters were moved into a large mouse cage (1,355-cm2 interior floor area; Lab Products). To distinguish litters, one set was marked by tail clipping. After 11 d of cohousing, lab mice and their pups were moved back into separate cages.
Antibiotic treatment.
Mice were treated with antibiotics (1 g l−1 metronidazole, 1 g l−1 neomycin, 1 g l−1 ampicillin and 0.5 g l−1 vancomycin) in the drinking water for 2 or 3 weeks as specified in the individual experiments according to previously described protocols47. Water bottles were changed twice per week, and cages were changed at the same time to minimize exposure to previously excreted faecal matter.
Generation of microbiome-modified lab mice.
Female and male wildlings were treated with antibiotics (1 g l−1 metronidazole, 1 g l−1 neomycin, 1 g l−1 ampicillin and 0.5 g l−1 vancomycin) in the drinking water for 3 weeks as described above, then cohoused with laboratory mice for a period of 2 weeks. During that time, cage changes were performed four times a week. During each cage change, wildlings were gavaged with 200 μl of diluted caecal content from lab mice. After 2 weeks of cohousing, lab mice were separated from wildlings and housed as breeding pairs. Offspring of those mice were placed on HFD at week 10 of age.
Oral glucose tolerance tests.
Mice were fasted for 6 h before administration of a body-weight-adjusted (2 mg per kg of body weight) glucose bolus via oral gavage. Glucose measurements were performed on tail blood using a OneTouch Ultra 2 glucometer before and 15, 30, 60 and 120 min after gavage.
Body composition analysis.
Body composition (fat mass and fat-free mass) was measured using an Echo MRI 3-in-1 (Echo Medical Systems).
Faecal bomb calorimetry.
Mice were housed in pairs of two for at least 1 week before the start of the experiment. Each experiment was started at 12:00 for a duration of 48 h. At the start of each experiment, the bedding was replaced, and the feed was weighed. At the end of each experiment, the bedding was removed entirely, and the feed was again weighed. Faecal pellets were manually selected from the bedding, weighed and preserved at −80 °C. Faecal bomb calorimetry was performed at the University of Michigan Animal Phenotyping Core (Ann Arbor, MI, USA). Information on the caloric content of the diet, as reported by the manufacturer, was used to calculate faecal energy loss.
Plasma metabolomics.
Mice were euthanized after 10 weeks of HFD. Blood was collected via cardiac puncture. All mice had access to food and water until sample collection, and all samples were collected within 1 h of each other. Blood was immediately moved into a collection tube (S-Monovette 2.6 ml, K2 EDTA, 65 × 13 mm2; Sarstedt), and centrifuged at 500g for 10 min. Plasma from three female mice was pooled for analysis. Samples were analysed at Metabolon (Research Triangle Park, NC, USA). In brief, sample preparation involved protein precipitation and removal with methanol, shaking and centrifugation. The resulting extracts were profiled on an accurate mass global metabolomics platform consisting of multiple arms differing by chromatography methods and mass spectrometry ionization modes to achieve broad coverage of compounds differing by physiochemical properties such as mass, charge, chromatographic separation and ionization behaviour. The details of this platform have previously been described48,49. Metabolites were identified by automated comparison of the ion features in the experimental samples with a reference library of chemical standard entries that included retention time, molecular weight (m/z), preferred adducts and in-source fragments as well as associated MS spectra, and were curated by visual inspection for quality control using software developed at Metabolon50,51.
Metabolic hormones.
The plasma concentration of metabolic hormones was determined with the Mescoscale Mouse Metabolic Combo 1 multiplex assay (Mesoscale) following the manufacturer’s instruction. TSH was quantitated using an enzyme immunoassay (EIA) (Abbkine).
Virtual caloric chamber.
Energy expenditure was calculated using a virtual caloric chamber algorithm (https://sourceforge.net/projects/virtual-calorimeter/) with food intake, faecal energy loss and weight gain as input as described29.
DNA extraction, 16S rRNA gene sequencing and compositional analysis.
Faecal DNA was extracted with the MagAttract PowerMicrobiome DNA/RNA kit (Qiagen) following the manufacturer’s instructions. All steps were automated on liquid-handling robots (Eppendorf; epMotion 5075 and epMotion 5073). The gene-specific sequences used in this protocol target the 16S V4 region (515F–806R). Nextgeneration 16S sequencing was performed on the Illumina MiSeq platform, generating paired-end 2 × 300-basepair reads. The 16S (V4) data were analysed using DADA2 (v.1.14.0)52 to obtain sequence variants, which were analysed and visualized using the R package phyloseq (v.1.36.0)53. Differences between mouse groups were visualized using PCoA (via phyloseq 1.36.0)54 and the significance of group differences was estimated by PERMANOVA (via vegan 2.5.7)55. Differential abundance of taxa was analysed using DESeq2 (v.1.32.0)56. Additionally, multiple other helper functions and graphing tools were utilized in the R environment.
DNA extraction, shotgun metagenomics and compositional analysis.
After euthanizing mice according to the NIH protocol, the caecum was located and transferred to a sterile petri dish. With sterile forceps and scissors, caecal content was carefully pushed out of caecum. For ceca of pups, due to the limited size of each caecum, three mice were pooled per sample. Material was frozen on dry ice and kept at −80 °C until DNA extraction. Each experimental group included mice from at least two different cages.
Shotgun sequencing reads were generated by sequencing Nextera FLEX (Illumina) paired-end libraries built from DNA sample extracts on the Illumina NovaSeq Standard S2 platform. Bioinformatic analysis was done using the in-house-developed JAMS v.1.5.0 pipeline (https://github.com/johnmcculloch/JAMS_BW). Briefly, after trimming reads for quality using Trimmomatic (v.0.39)57, reads were aligned to the Mus musculus genome (Genome Reference Consortium Mouse Build 38, GenBank assembly accession GCA_000001635.2) using Bowtie2 (v.2.4.1)58, and reads that did not align were then used for de novo assembly into contigs using Megahit (v.1.2.9)59. Contigs were annotated using Prokka (v.1.14)60, generating the predicted proteome for each sample.
Contigs were classified taxonomically using kraken (v.2.0.9)61 with a custom-built database built in April 2020 containing the complete and draft genomes of all Bacteria, Archaea, Viruses, Fungi and Protozoa deposited in GenBank, plus the human and mouse genomes (available for downloading at: https://hpc.nih.gov/~mccullochja/JAMSdbApr2020_32Gbk2db.tar.gz).
Sequences were classified to their last known taxon (LKT), which is the lowest taxonomic level with a valid taxon for that query. The sequencing depth of each contig was obtained by re-aligning the trimmed sequencing reads to the metagenomic contigs using Bowtie2 (v.2.4.1). Basepair coverages were computed for each contig, and, therefore, for each LKT and gene. Basepair abundances, in parts per million, were obtained by dividing the number of basepairs covering a feature by the total number of basepairs used for assembly for that sample, multiplied by 106. The R programming language (v.4.0.5) was used to integrate all metagenomic data. Heat maps were plotted using the ComplexHeatmap package (v.2.6.2)62 via the JAMS function plot_relabund_heatmap.
Transcriptome analysis of liver and adipose tissue.
Fresh liver tissue was snap-frozen in liquid nitrogen and stored at −80 °C until further use. Liver tissue was crushed at −80 °C using a cryoPREP Manual Dry Pulverizer and dissolved in TRI Reagent (Sigma-Aldrich). RNA was extracted using the Direct-zol RNA Miniprep Plus kit (Zymo Research) according to the manufacturer’s instructions.
Adipose tissue was collected from euthanized mice, weighed, snap-frozen in liquid nitrogen and stored at −80 °C until further use. Adipose tissue was pulverized with a cryoPREP Manual Dry Pulverizer at −80 °C. After addition of TRI Reagent (Sigma-Aldrich), samples were vortexed for 1 min at high speed and then further dissolved in a TissueLyzer (Qiagen) with one metal beat per tube at 50 Hz for 1 min with one repeat. The solution was centrifuged at 10,000g for 5 min at room temperature, the oil layer on top was carefully removed and the debris at the bottom of the tube discarded. The remaining liquid was used for RNA extraction with Direct-zol RNA Miniprep Plus kit (Zymo Research) according to the manufacturer’s instructions.
Sequencing was performed in paired-end 75-basepair mode on a NextSeq 500 (Illumina), yielding 13.5 × 10⁶ to 25.2 × 10⁶ reads per sample. Raw data were quality-controlled with FastQC63 and processed by removing lower-quality bases and adaptors using Trimmomatic (v.0.38)57. Processed reads were mapped to the GENCODE mouse reference genome (release M22) using the STAR aligner (v.2.7.2a) with 2-pass mapping64. Transcripts from RNA-seq data were quantified using Subread featureCounts (v.1.6.3)65 with GENECODE mouse reference (release M22). Differential gene expression was evaluated with DESeq2 (v.1.14.1) R package56.
In vivo uptake of 2-DG in tissues.
In vivo tissue glucose uptake studies were carried out using 11-week-old female and male mice that had been maintained on HFD for 1 week at 22 °C. One group of mice was tested at 28–29 °C (near thermoneutral condition) and the other group at 17–18 °C (modest cold exposure). Mice were allowed to adapt to the new ambient temperature for 2 h (with food and water ad libitum), injected with a trace amount (10 μCi) of 2-DG (cat. no. NEC495; PerkinElmer) and euthanized for tissue collection 60 min later. Samples were homogenized and 2-deoxyglucose-6-phosphate was separated from 2-DG using an ion exchange column (Chromatography Columns no. 731–6211; Bio Rad). The amount of tracer in the eluates was counted using a Tri-Carb 2810 TR Liquid Scintillation Analyzer (PerkinElmer). 2-DG uptake was expressed as dpm per mg of tissue.
Western blot of BAT.
iBAT was collected after mice were euthanized according to NIH guidelines. Tissue was trimmed off white adipose tissue and immediately submerged in liquid nitrogen and stored at −80 °C until further use. iBAT was pulverized at −80 °C using a cryoPREP Manual Dry Pulverizer (Covaris). Tissue was homogenized after addition of RIPA buffer (Pierce Biotechnology), Samples were vortexed for 1 min at high speed and dissolved in a TissueLyzer (Qiagen) with one metal beat per tube at 50 Hz for 1 min with one repeat. The solution was centrifuged at 16,000g for 10 min at 4 °C, the top oil layer was carefully removed and the debris at the bottom of the tube discarded. The remaining liquid was used for western blotting. Protein concentration was determined using the BCA Protein Kit (Pierce) according to the manufacturer’s instructions. We applied 30 μg of protein per well of a 4–12% NuPAGE Bis-Tris gel (Invitrogen) and run it at 180 Hz for 55 min. The protein samples were transferred to iBlot2 Transfer Stacks (Thermo Scientific) with an iBlot2 Dry Blotting System. After blocking with the blocking buffer (LI-COR) for 1 h at room temperature, membranes were incubated with antibodies against tyrosine hydroxylase (no. PA5–85167, 1:1,000; Invitrogen), AMPKalpha1 (no. ab3759, 1:1,000; Abcam) or UCP1 (no. ab10983, 1:1,000; Abcam) at 4 °C overnight, washed and incubated with an antibody against GAPDH overnight (no. CB1001, clone 6C5, 1:1,000; Sigma-Aldrich), followed by incubation with infrared fluorescent dye-conjugated secondary antibodies IRDye 800CW (no. 926–32211, 1:5,000; Li-Cor) or IRDye 680RD (no. 926–68070, 1:1,000; Li-Cor) for 1 h at room temperature. Blot signals were detected with an Odyssey CLx (LI-COR) and quantified with Image Studio software (LI-COR; v.5.2.5).
Statistics.
Statistical analysis was performed in RStudio v.1.1.463. Data were analysed for normal distribution via Shapiro–Wilk test or with the help of a normal probability plot. If normal distribution was confirmed, Student’s t-test was used to test for significance. If data were not normally distributed, the Wilcoxon signed rank test was used. All statistical tests were two-sided. Significance is indicated as *P < 0.05, **P < 0.01, ***P < 0.001 and ****P < 0.0001 in the figures, with exact P values provided in the Source Data. The number of mice (n) and number of independent experiments are reported for each experiment in the figure legend.
Extended Data
Extended Data Fig. 1 |. HFD-induced changes in the cecal microbiome of lab and wildling mice.
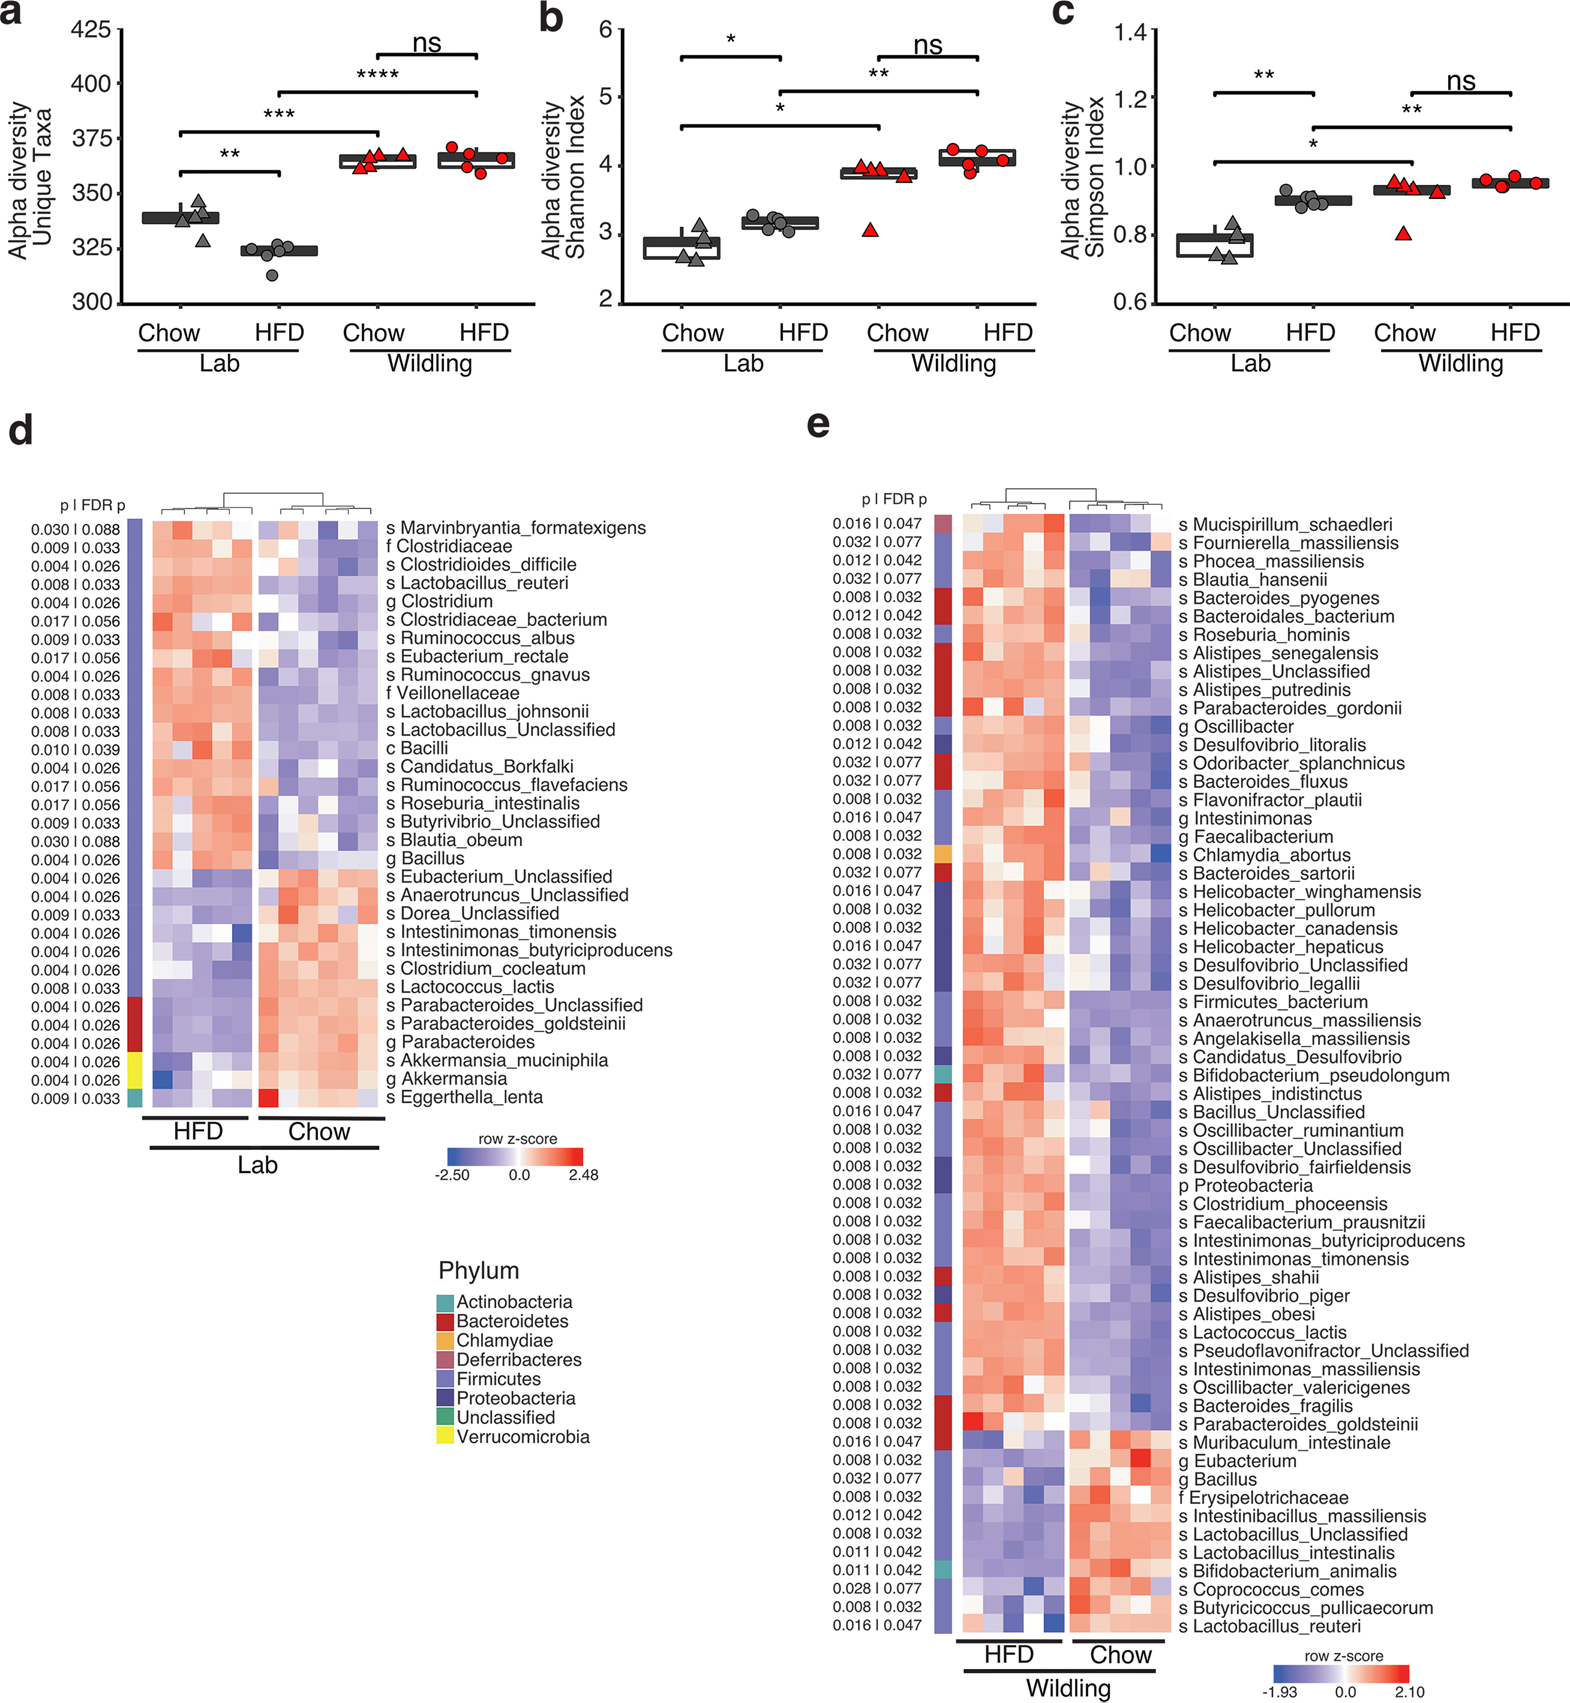
Shotgun metagenomics data comparing the cecal microbiome of female wildling and lab mice at week 10 of chow or HFD. Lab mice on HFD: n = 5; lab mice on chow: n = 6; wildlings on HFD: n = 5; wildlings on chow: n = 5. a-c, Alpha-diversity, measured as number of observed unique taxa (a), Shannon index (b) and Simpson index (c) based on last-known taxa identified by shotgun metagenomics analysis of cecal microbiome of female wildling and lab mice at week 10 of chow diet or HFD. Box plots show median (center line), 75th (upper limit of box) and 25th percentile (lower limit of box) and outliers (whiskers) if values do not exceed 1.5-times interquartile range. Unpaired two-tailed Student’s t test (Gaussian model) (a), Two-sided Wilcoxon signed rank test (b, c). (NS, not significant; * p < 0.05, ** p < 0.01, *** p < 0.001, **** p < 0.0001). d, e, Heat maps generated by unsupervised clustering within lab (d) and wildling (e), showing the most variant last-known taxa (FDR-adjusted p < 0.05 by Mann Whitney Wilcoxon test) after filtering based on taxon genome completeness of >10% in at least 5% of samples and abundance of >250 parts per million in at least 15% of samples. Relative abundances are shown as z-scores, letters in front of last-known taxa describe taxonomy (s = species, f=family, g=genus, o=order, p=phylum).
Extended Data Fig. 2 |. Food consumption of wildling and lab mice on chow and HFD.
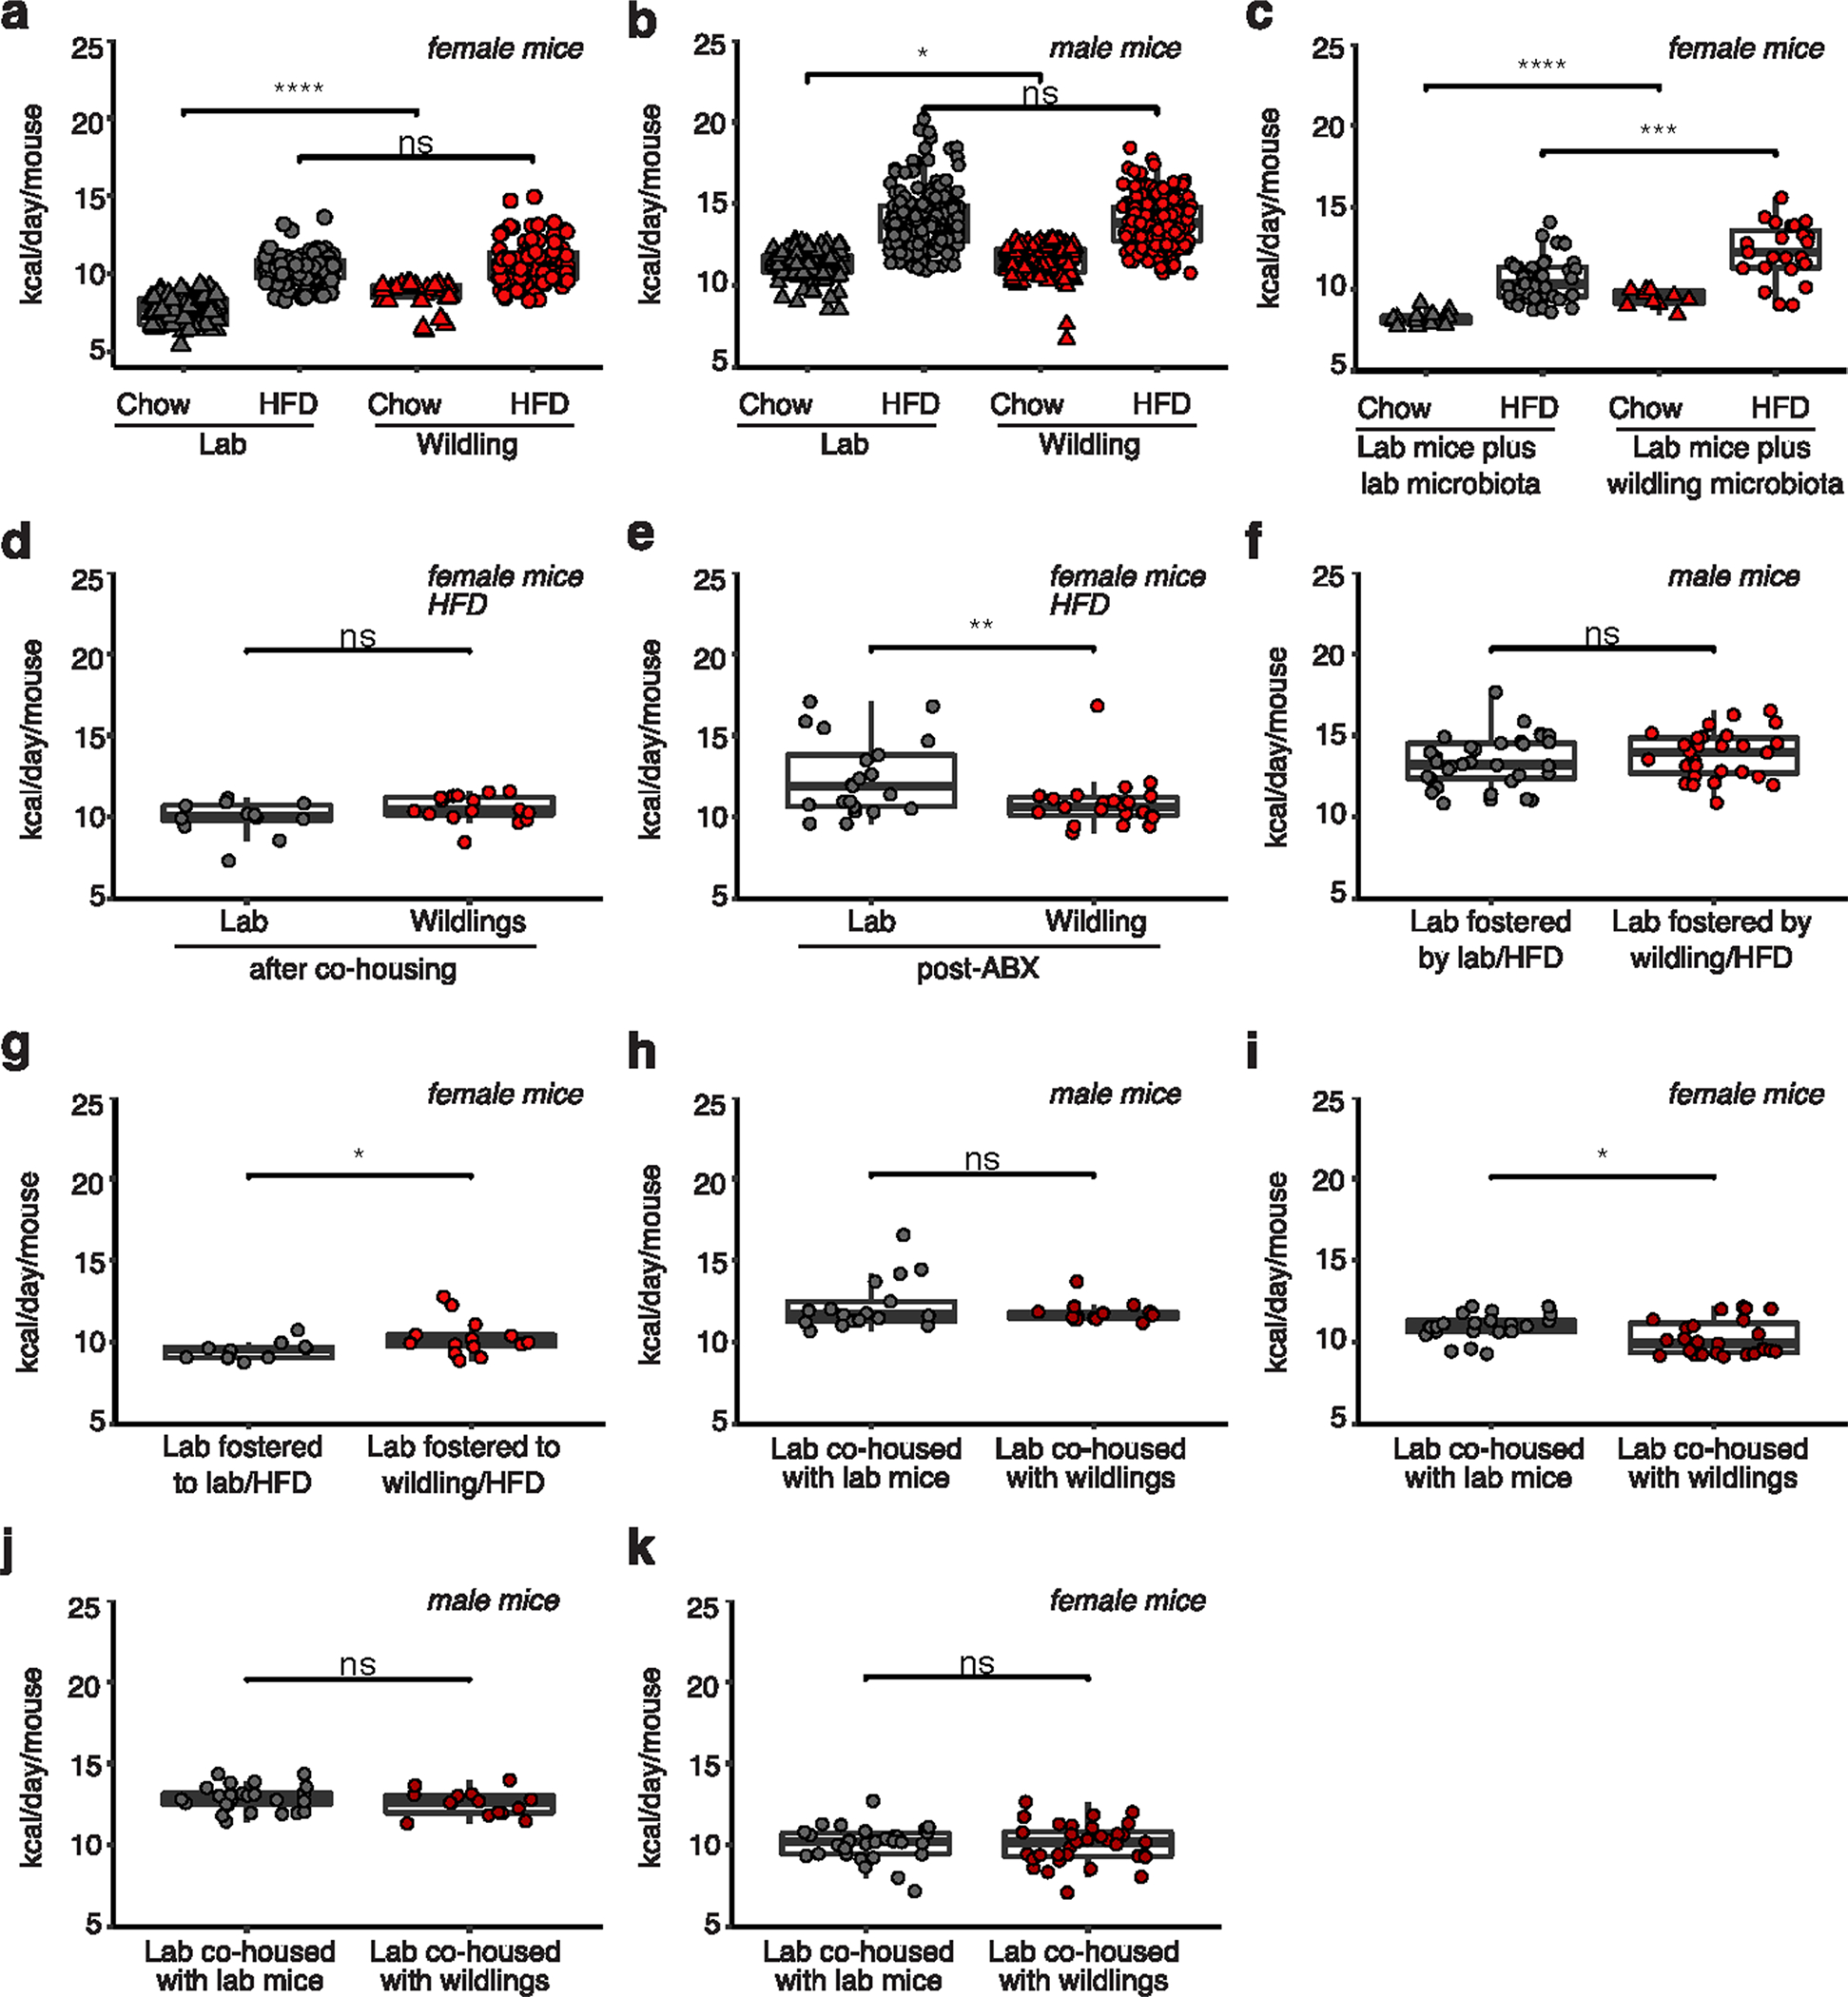
Data points represent daily kcal consumption per mouse, based on weekly measurements per cage over the course of chow or HFD diet. a, Data set refers to food consumption during experiments described in Fig. 1b; n = 55 lab mice on HFD, n = 42 lab mice on chow, n = 60 wildlings on HFD, n = 30 wildlings on chow. b, refers to Fig. 1d, n = 20 lab mice on HFD, n = 15 lab mice on chow, n = 23 wildlings on HFD, n = 17 wildlings on chow. c, refers to Fig. 4b, lab mice plus lab microbiota: n = 10 lab mice on chow, n = 24 lab mice on HFD; lab mice plus wildling microbiota: n = 10 mice on chow, n = 25 mice on HFD. d, refers to Fig. 4f; n = 10 lab mice, n = 10 wildlings. e, refers to Fig. 4j, n = 18 lab mice, n = 20 for wildlings. f, refers to Fig. 5c, n = 5 lab mice fostered by lab mice, n = 5 lab mice fostered by wildlings. g, refers to Fig. 5e, n = 8 lab mice fostered by lab mice, n = 8 lab mice fostered by wildlings. h, refers to Fig. 5h, n = 7 lab mice co-housed with lab mice, n = 10 lab mice co-housed with wildlings. i, refers to Fig. 5j, n = 13 lab mice co-housed with lab mice, n = 19 lab mice co-housed with wildlings. j, refers to Fig. 5m, n = 15 lab mice co-housed with lab mice, n = 10 lab mice co-housed with wildlings. k, refers to Fig. 5n, n = 15 lab mice co-housed with lab mice, n = 22 lab mice co-housed with wildlings. Box plots show median (center line), 75th (upper limit of box) and 25th percentile (lower limit of box) and outliers (whiskers) if values do not exceed 1.5-times interquartile range. Unpaired two-tailed Student’s t test (Gaussian model) (c, d, f, g, h, i), two-sided Wilcoxon rank sum test (a, b, e, j, k). (NS, not significant; * p < 0.05, ** p < 0.01, *** p < 0.001, **** p < 0.0001, exact p-values are shown in the Source Data).
Extended Data Fig. 3 |. Fecal bomb calorimetry and rectal temperature of lab and wildling mice on chow and HFD.

a, b, Food energy intake (a) and fecal energy loss (bomb calorimetry) (b) in female lab or wildling mice on chow or HFD. N = 40 mice on chow and n = 40 mice on HFD examined per group over two independent experiments. c, Rectal temperature of male lab or wildling mice at week 9 of chow or HFD. N = 15 lab mice on chow, n = 20 lab mice on HFD, n = 17 wildlings on chow, n = 21 wildlings on HFD examined over two independent experiments. Box plots show median (center line), 75th (upper limit of box) and 25th percentile (lower limit of box) and outliers (whiskers) if values do not exceed 1.5-times interquartile range. Two-sided Wilcoxon rank sum test (NS, not significant; * p < 0.05, ** p < 0.01, *** p < 0.001, **** p < 0.0001, exact p-values are shown in the Source Data).
Extended Data Fig. 4 |. liver transcriptome of lab and wildling mice on HFD.
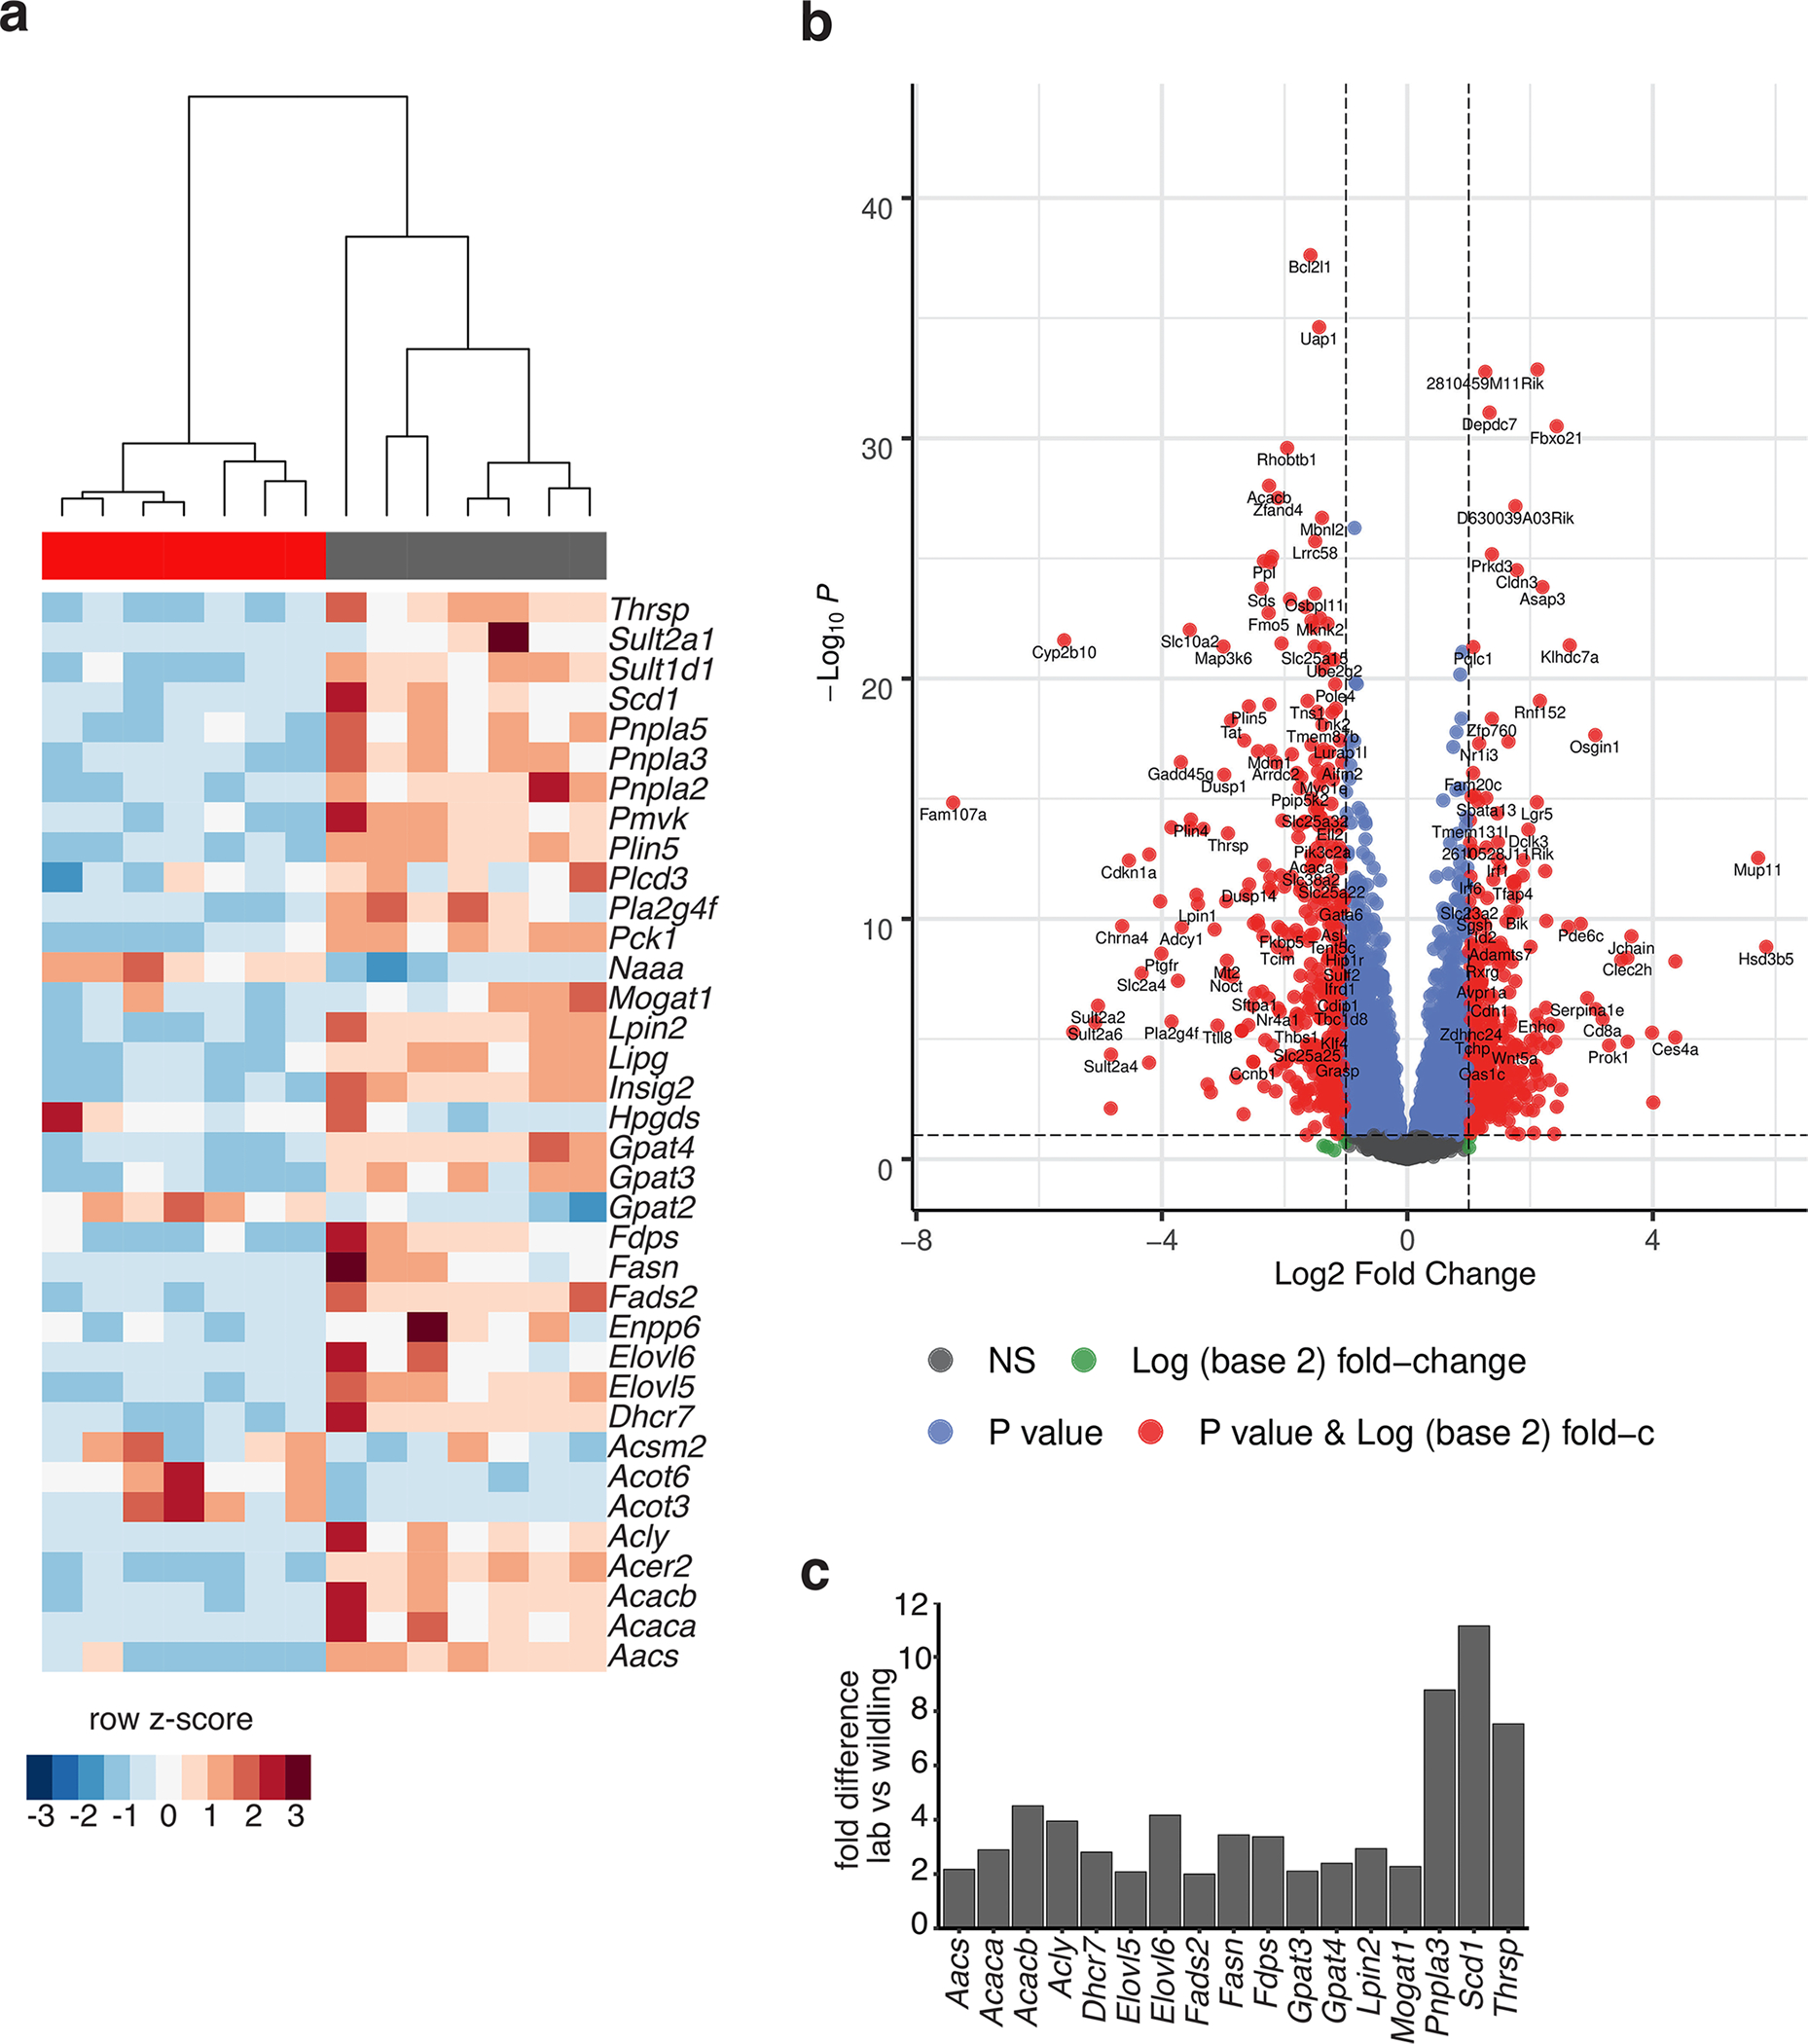
Bulk RNA sequencing of liver tissue from n = 7 lab mice (grey) and n = 7 wildlings (red) after 10 weeks of HFD. a, Unsupervised clustering of all metabolism-related gene transcripts that are significantly differently expressed. b, Volcano Plot. c, Comparison of lipogenesis-related gene transcripts (log2-fold expression) in liver tissue of the two groups of mice. Significance was determined as FDR ≤ 0.1.
Extended Data Fig. 5 |. Tissue-specific 2-deoxyglucose (2-DG) uptake in lab and wildling mice housed at 18 °C or 28 °C.
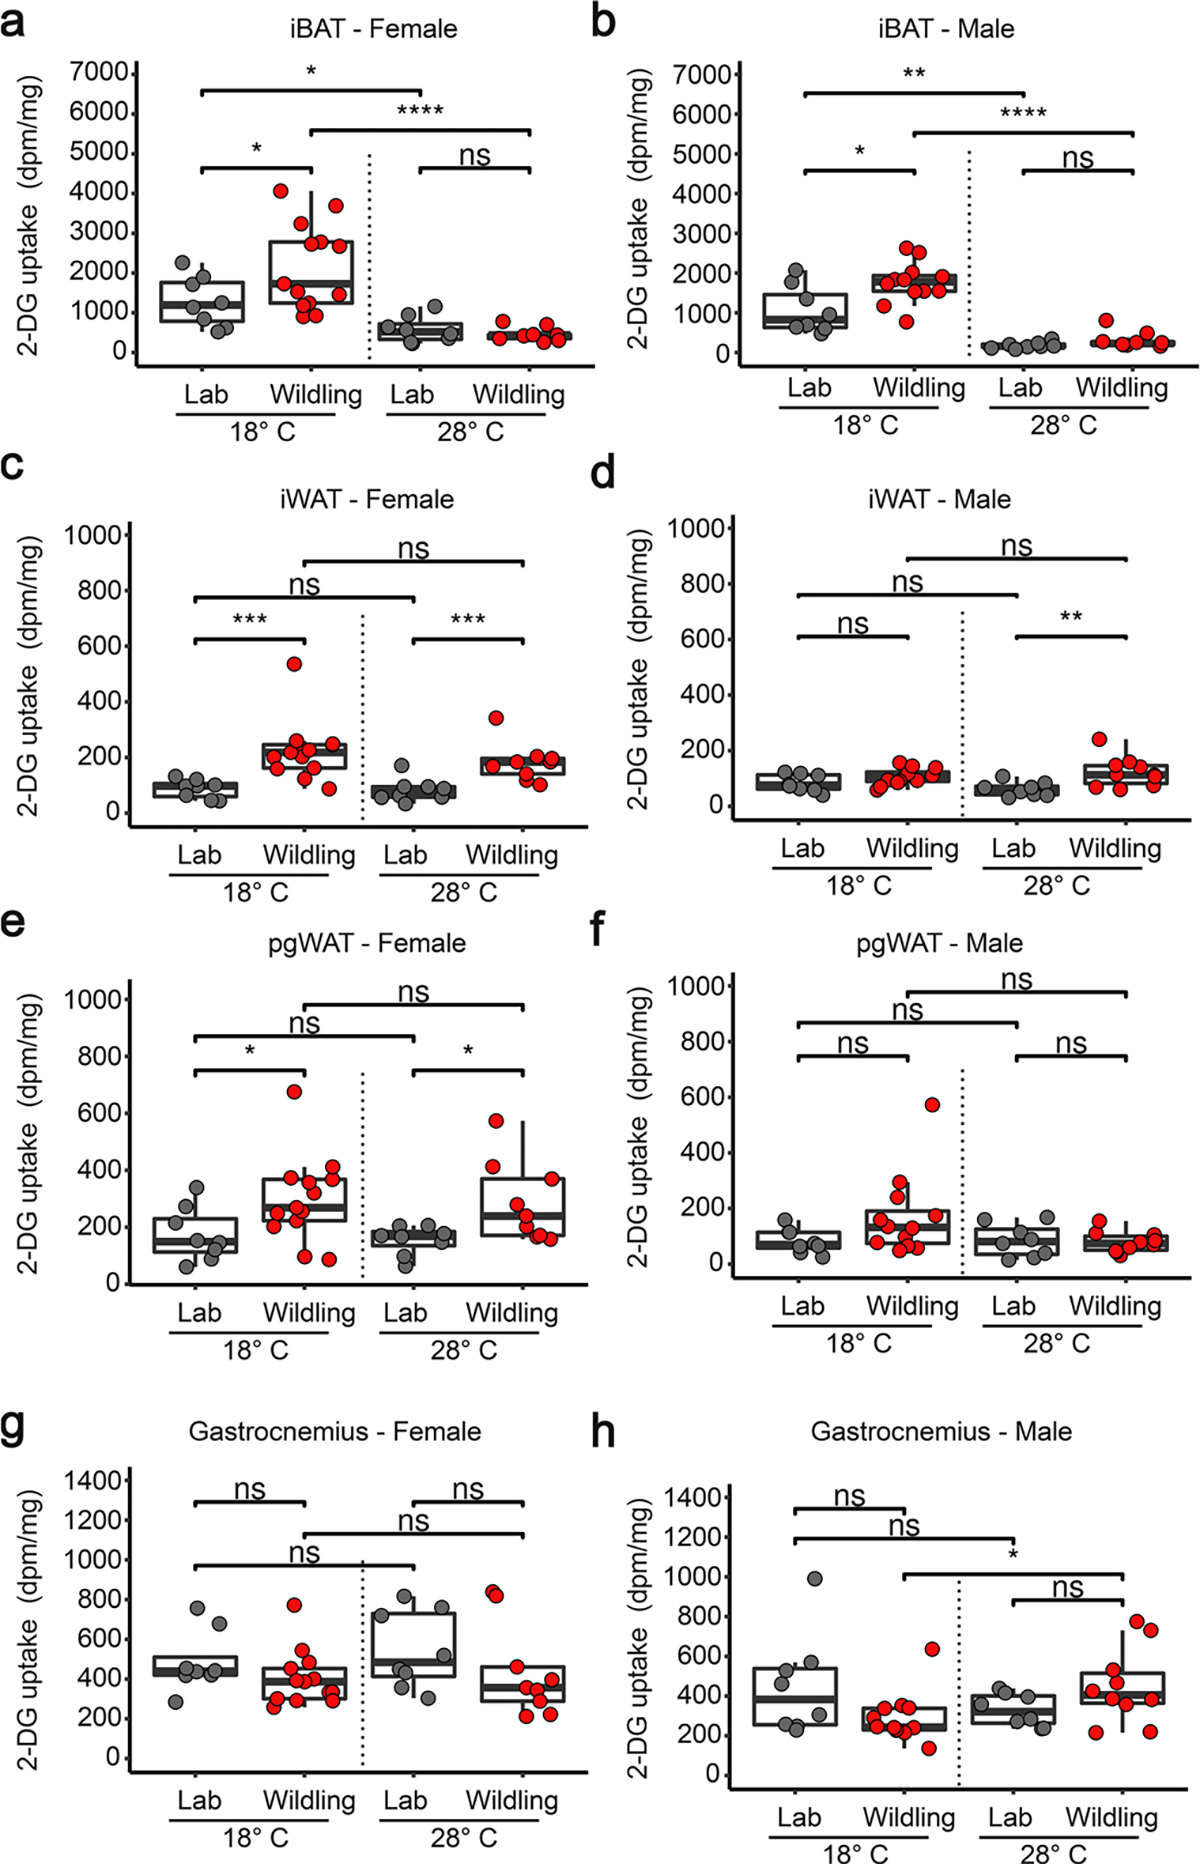
a, b, 2-DG uptake per milligram iBAT in female (a) or male (b) lab mice and wildlings at either 18 °C or 28 °C. c-h, 2-DG uptake in iWAT (c, d), pgWAT (e, f) or gastrocnemius muscle (g, h) in female (a, c, e, g) or male (b, d, f, h) lab or wildling mice held at 18 °C and 28 °C. N = 8 lab mice and n = 13 wildlings at 18 °C, n = 8 lab mice and n = 10 wildlings at 28 °C (a, c, e, g). N = 8 lab mice and n = 12 wildlings at 18 °C, n = 8 lab mice and n = 10 wildlings at 28 °C (b, d, f, h). Box plots show median (center line), 75th (upper limit of box) and 25th percentile (lower limit of box) and outliers (whiskers) if values do not exceed 1.5-times interquartile range. NS, not significant. Unpaired two-sided Student’s t test (Gaussian model) (a, b, d, e), two-sided Wilcoxon rank sum test (c, f, g, h). (NS, not significant; * p < 0.05, ** p < 0.01, *** p < 0.001, **** p < 0.0001, exact p-values are shown in the Source Data).
Extended Data Fig. 6 |. Western Blot analysis of AMPKalpha1, tyrosine hydroxylase and UCP1 in iBAT.
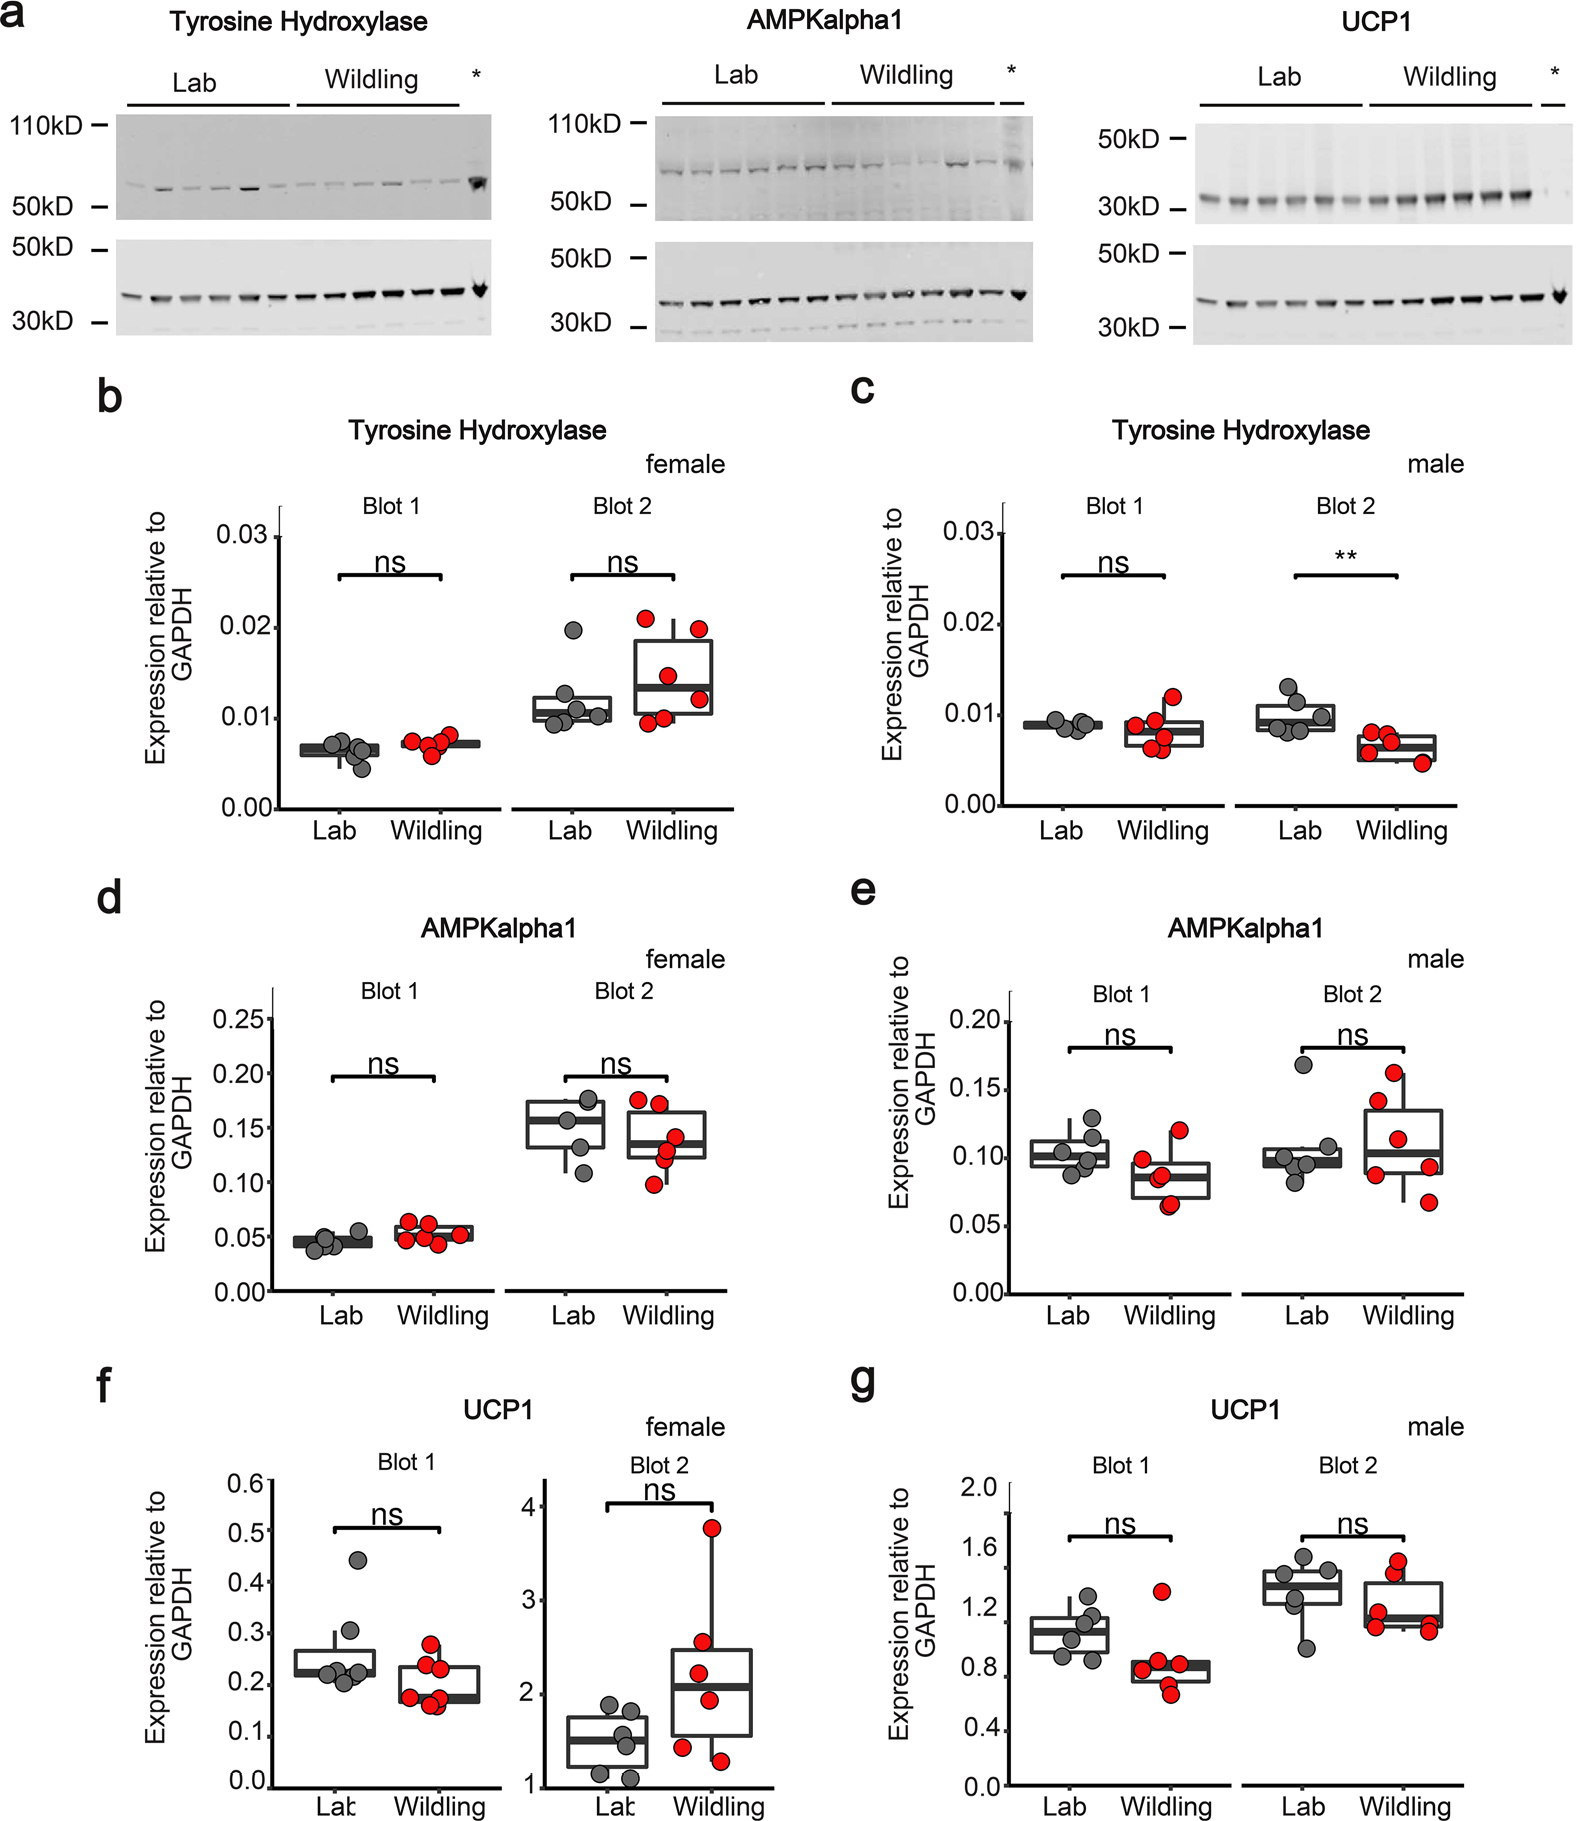
a, iBAT from lab and wildling mice at week 10 of HFD was analyzed by Western blot to quantitate the expression of tyrosine hydroxylase, AMPKalpha1 and UCP1 (upper bands) relative to GAPDH (lower bands). Brain lysate was used in the right lane (marked by asterisk). Representative Western Blot images for male mice (n = 6 mice per group). Unprocessed Western Blots are shown in Source Data. The experiment was independently repeated once for males and twice for females with similar results. b-g, The density of Western blot bands was quantified and normalized to each sample’s respective GAPDH band. Normalized expression levels are shown for tyrosine hydroxylase (b, c), AMPKalpha1 (d, e) and UCP1 (f, g) for female (b, d, f) and male (c, e, g) mice. N = 12 mice per group (b, c, e, g); n = 6 mice per group except n = 5 for the lab mouse group in blot 2 (d), n = 7 mice per group in blot 1, n = 6 mice per group in blot 2 (f). Box plots show median (center line), 75th (upper limit of box) and 25th percentile (lower limit of box) and outliers (whiskers) if values do not exceed 1.5-times interquartile range. Two-sided Wilcoxon signed rank test (NS, not significant; ** p = 0.007538).
Extended Data Fig. 7 |. Metabolic hormones of lab and wildling mice on chow and HFD.
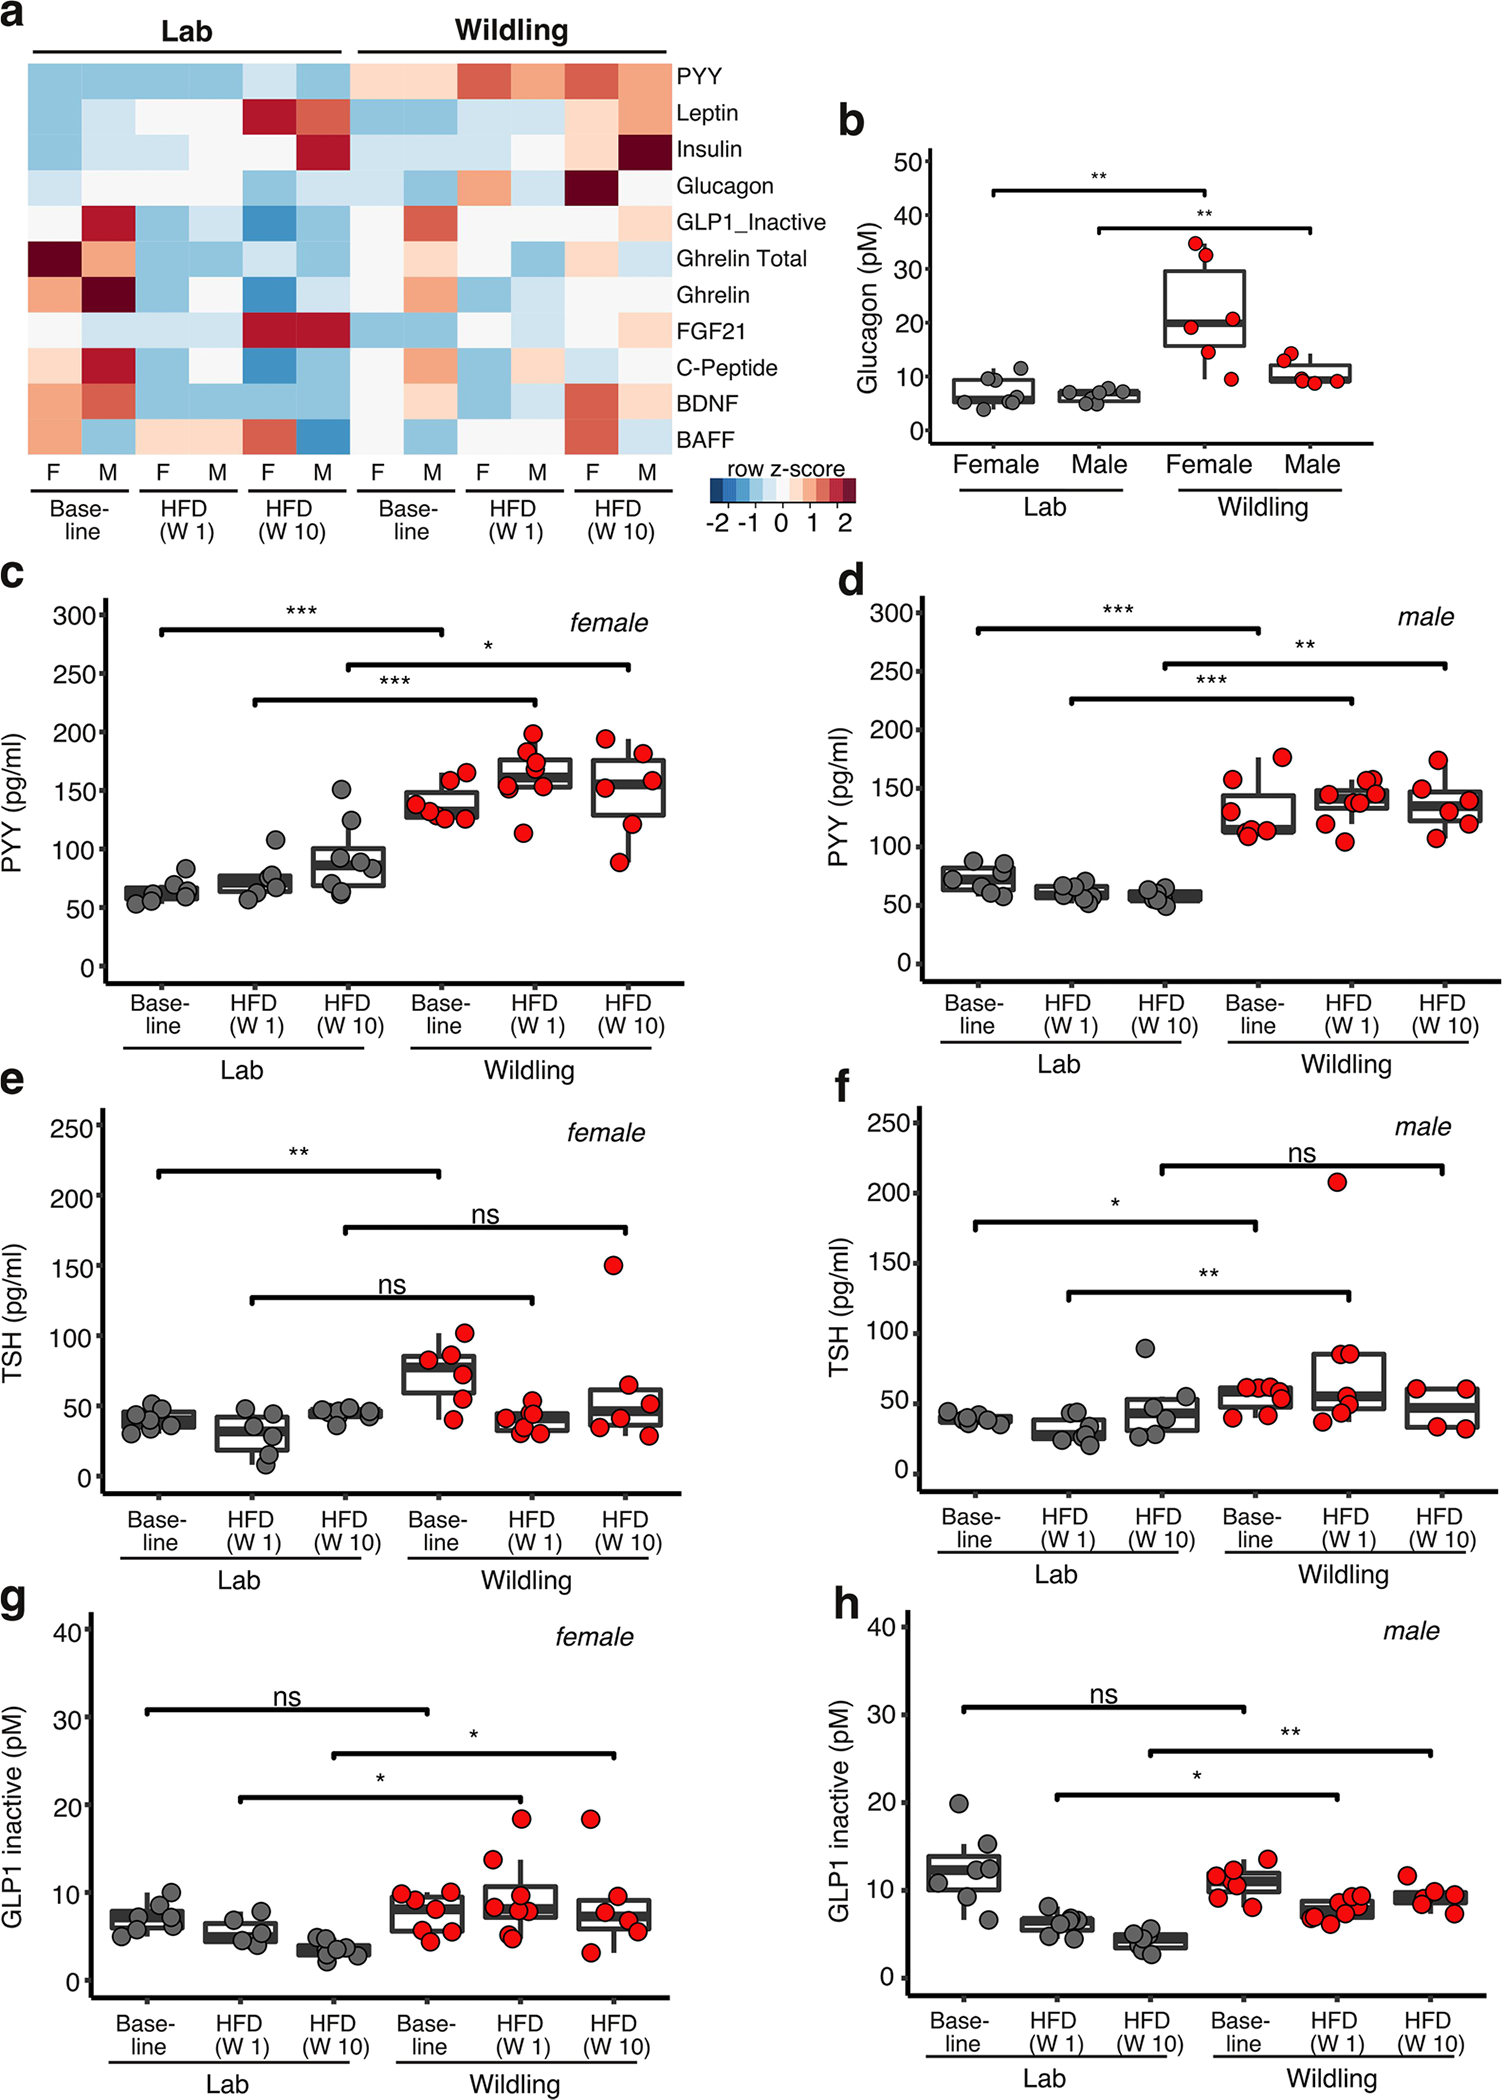
Serum concentration of metabolic hormones of lab mice and wildlings at baseline (week 10 of age on chow diet) and after 1 week and 10 weeks of HFD (weeks 11 and 20 of age, respectively). Each sample was pooled from two mice. Female lab mice at baseline, n = 14; at week 1 of HFD, n = 12; at week 10 of HFD, n = 16; male lab mice at baseline, n = 14; at week 1 of HFD, n = 14; at week 10 of HFD, n = 14; female wildlings at baseline, n = 14; at week 1 on HFD, n = 16; at week 10 of HFD, n = 12; male wildlings at baseline, n = 14; at week 1 of HFD, n = 16; at week 10 of HFD, n = 12. a Heatmap displaying median value of each group presented as z-score. BDNF, brain derived neurotropic factor; BAFF, B-cell activating factor. The Mesoscale Mouse Metabolic Combo 1 multiplex assay was used. b-h Serum concentration of glucagon (b), peptide YY (PYY) (c, d), thyroid stimulating hormone (TSH) (e, f), and the inactive form of glucagon like peptide 1 (GLP1) (g, h) at the indicated time points on chow or HFD as determined by multiplex Mesoscale Mouse Metabolic Combo 1 multiplex assay (b, c, d, g, h) or ELISA (e, f). Box plots show median (center line), 75th (upper limit of box) and 25th percentile (lower limit of box) and outliers (whiskers) if values do not exceed 1.5-times interquartile range. Two-sided Wilcoxon signed rank test (NS, not significant; * p < 0.05, ** p < 0.01, *** p < 0.001, **** p < 0.0001, exact p-values are shown in the Source Data).
Extended Data Fig. 8 |. increased diversity of wildling microbiome with interspersed clustering of MM-lab mice.
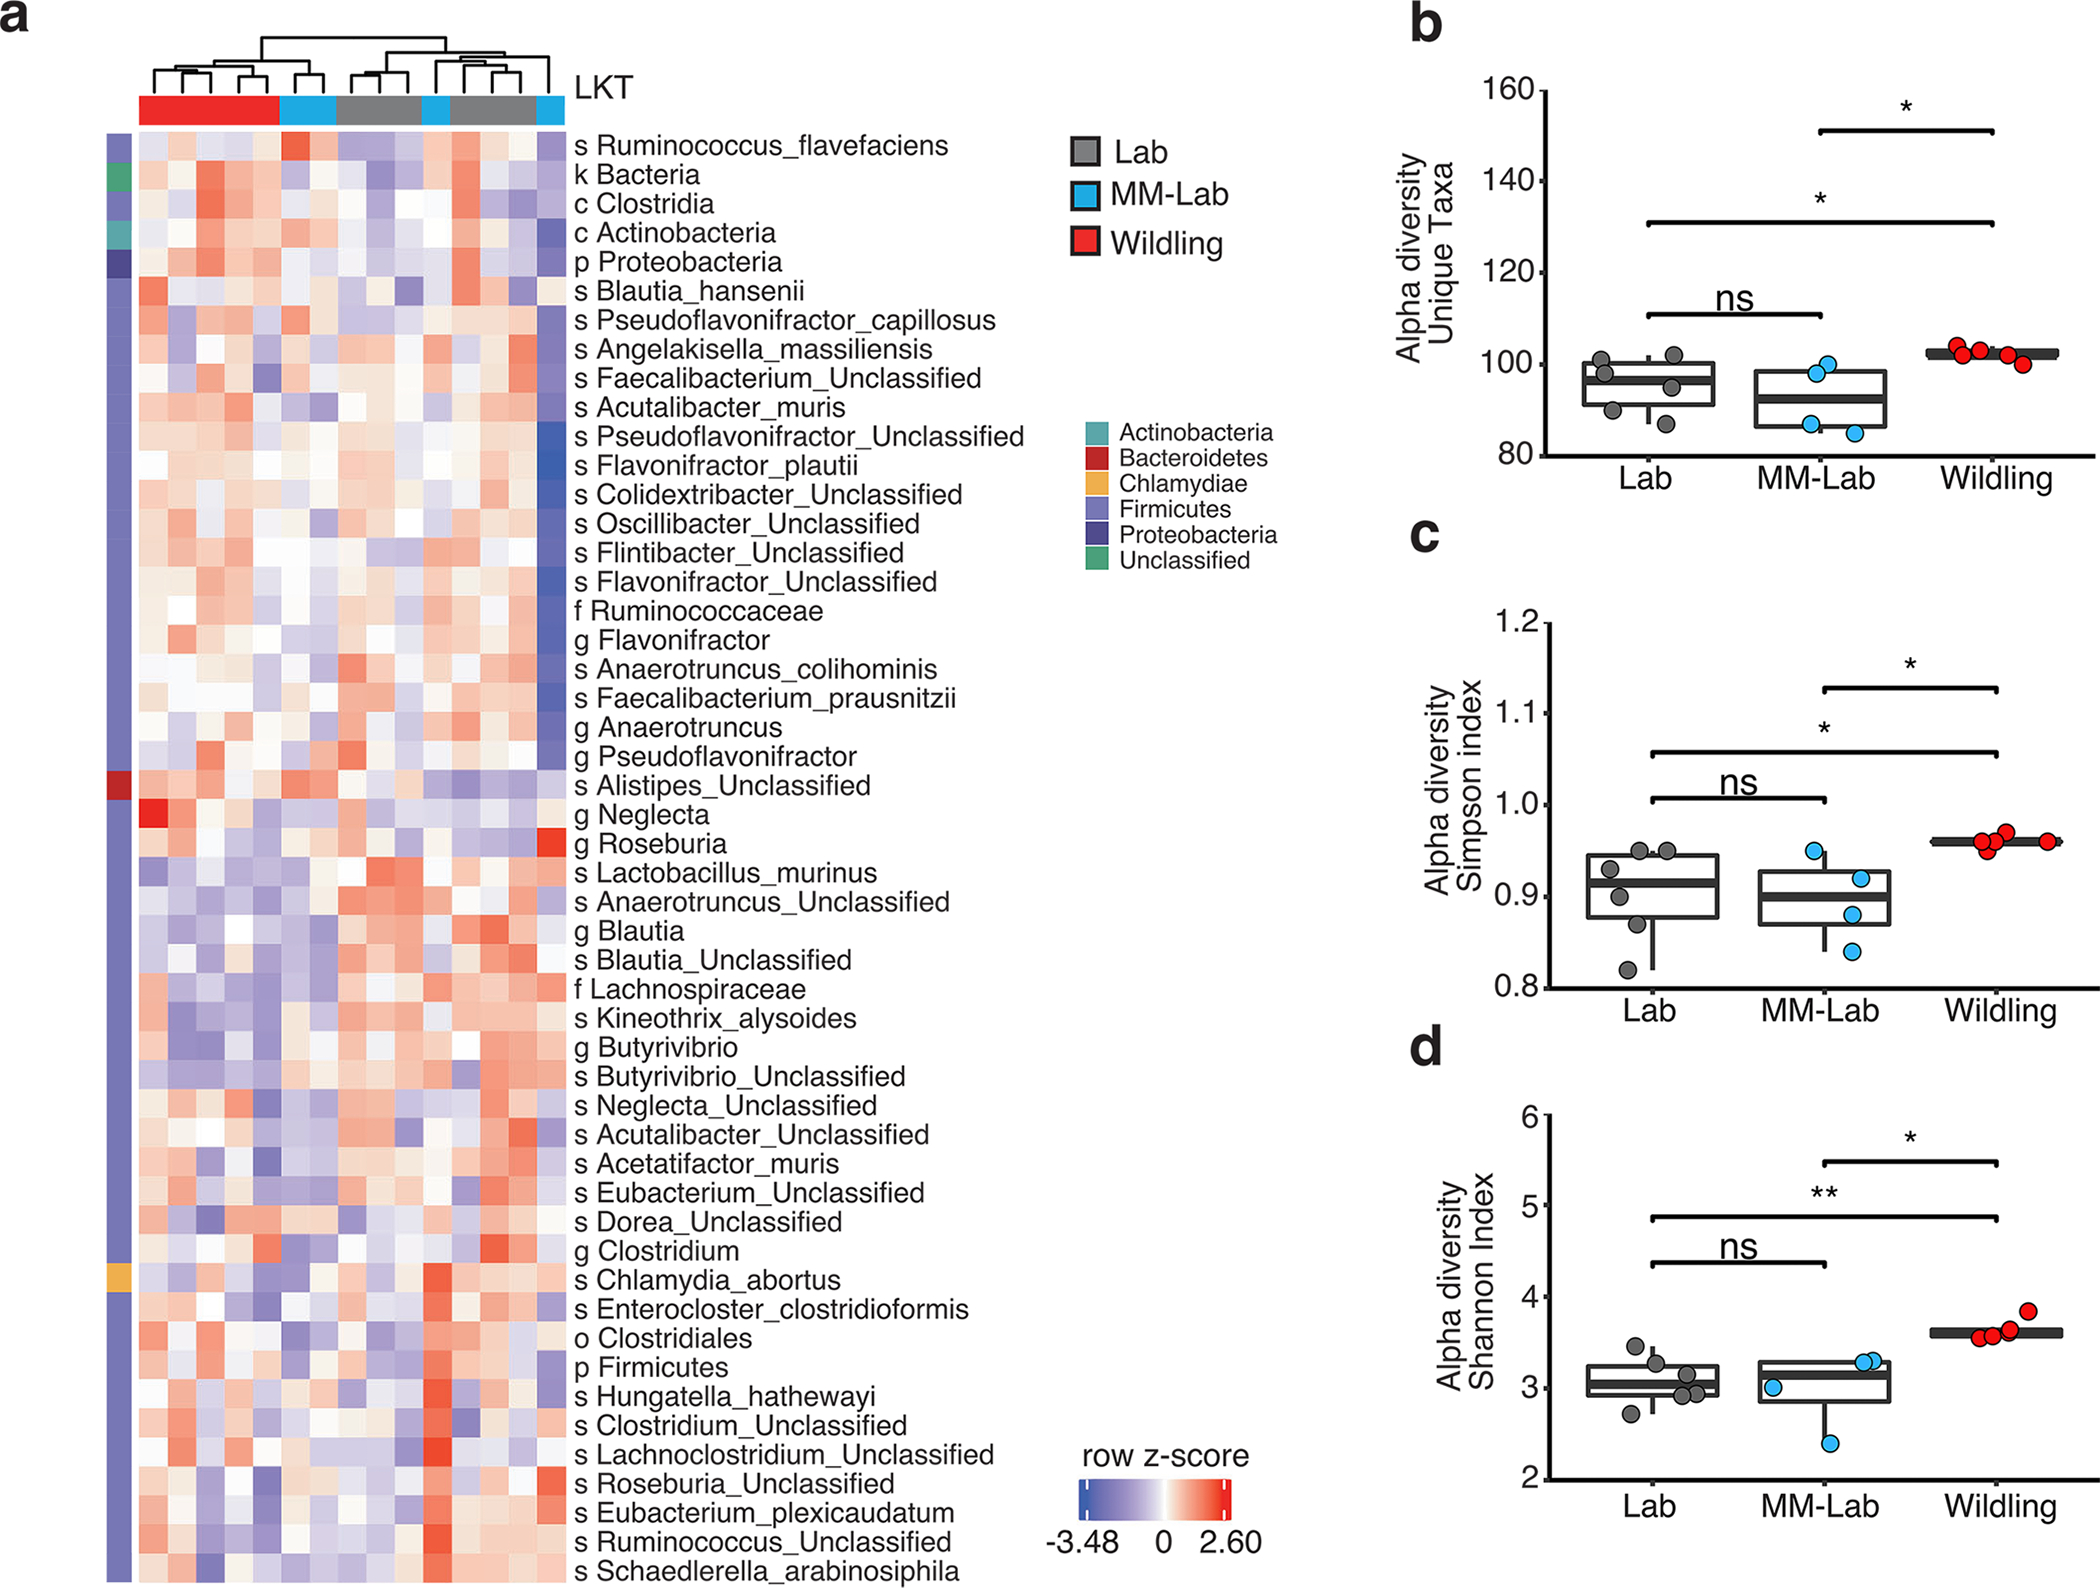
Shotgun metagenomics analysis of cecal microbiome from 12-day-old lab (n = 6), MM-lab (n = 4) and wildling (n = 5) pups. MM-lab mice were generated by co-housing lab mice with antibiotic-treated wildlings for 2 weeks and then separating and breeding these lab mice. Their offspring (microbiome modified (MM)-lab) were used for these experiments. a, Heat map generated by unsupervised clustering, showing the most variant last known taxa (LKT) after filtering based on taxon genome completeness of >10% in at least 5% of samples and abundance of >250 parts per million in at least 15% of samples. Relative abundances are shown as z-scores. Letters in front of LKT describe taxonomy (s = species, f=family, g=genus, o=order, p=phylum). b-d, Alpha-diversity, measured as number of observed unique taxa (b), Simpson index (c) and Shannon index (d) based on LKT. Box plots show median (center line), 75th (upper limit of box) and 25th percentile (lower limit of box) and outliers (whiskers) if values do not exceed 1.5-times interquartile range. Two-sided Wilcoxon signed rank test (NS, not significant; * p < 0.05, ** p < 0.01, exact p-values are shown in the Source Data).
Extended Data Fig. 9 |. Graphical Summary.
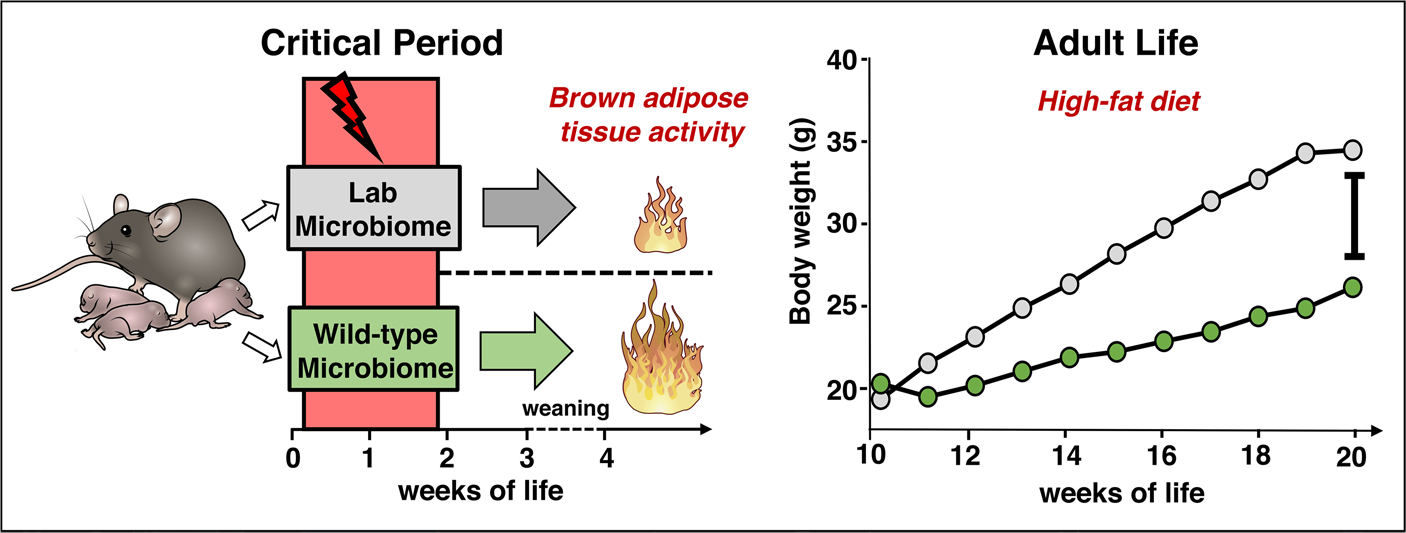
Exposure to a wildling microbiome resulting in increased brown adipose tissue activity that protects from diet-induced obesity later-on in life.
Supplementary Material
Acknowledgements
We thank Y. Ma, Mouse Metabolism Core, NIDDK, for assistance with 14C-DG uptake studies; M. Walters and Yuhai Dai, NIDDK Clinical Core, for assistance with the Mesoscale assay; C. Ohuigin, W. Yuan, G. Wallace and V. Thovarai (Cancer Inflammation Program Microbiome and Genetics Core, NCI) for 16S rRNA gene sequencing; B. Tran (Sequencing Facility at Leidos Biomedical Research, Inc./Frederick National Laboratory for Cancer Research) for sequencing; A. M. Cypress, R. Wess, J. Pydi (NIDDK) and R. Das Neves (NCI) for discussion; and the University of Michigan Animal Phenotyping Core for faecal bomb calorimetry. This study was funded by the intramural research programmes of the NIDDK and NCI, NIH; and by the NIH Director’s Challenge Award program and the DDIR Innovation Award program (B.R.). B.H. was supported by research fellowship no. HI 2088/1-1 from the Deutsche Forschungsgemeinschaft (DFG), Bonn, Germany.
Footnotes
Competing interests
The authors declare no competing interests.
Additional information
Extended data is available for this paper at https://doi.org/10.1038/s42255-021-00439-y.
Supplementary information The online version contains supplementary material available at https://doi.org/10.1038/s42255-021-00439-y.
Peer review information Primary handling editor: George Caputa. Nature Metabolism thanks Gerard Eberl, Cathryn Nagler and the other, anonymous, reviewer(s) for their contribution to the peer review of this work.
Reporting Summary.
Further information on research design is available in the Nature Research Reporting Summary linked to this article.
Code availability
JAMS v.1.5.0 (https://github.com/johnmcculloch/JAMS_BW); virtual caloric chamber (https://sourceforge.net/projects/virtual-calorimeter/).
Data availability
Raw sequence data from all 16S, shotgun metagenomics and RNA-sequencing experiments are deposited in the NCBI Sequence Read Archive under BioProject accession number PRJNA735448. Source data for the western blot are provided with this paper. Additional information and materials will be made available upon reasonable request.
References
- 1.WHO. The Global Health Observatory https://www.who.int/data/gho/data/themes/mortality-and-global-health-estimates/ghe-leading-causes-of-death (2020).
- 2.Flegal KM, Kruszon-Moran D, Carroll MD, Fryar CD & Ogden CL Trends in obesity among adults in the united states, 2005 to 2014. JAMA 315, 2284–2291 (2016). [DOI] [PMC free article] [PubMed] [Google Scholar]
- 3.Ogden CL et al. Trends in obesity prevalence among children and adolescents in the united states, 1988–1994 through 2013–2014. JAMA 315, 2292–2299 (2016). [DOI] [PMC free article] [PubMed] [Google Scholar]
- 4.Shreiner AB, Kao JY & Young VB The gut microbiome in health and in disease. Curr. Opin. Gastroenterol. 31, 69–75 (2015). [DOI] [PMC free article] [PubMed] [Google Scholar]
- 5.Belkaid Y & Hand TW Role of the microbiota in immunity and inflammation. Cell 157, 121–141 (2014). [DOI] [PMC free article] [PubMed] [Google Scholar]
- 6.Beura LK et al. Normalizing the environment recapitulates adult human immune traits in laboratory mice. Nature 532, 512–516 (2016). [DOI] [PMC free article] [PubMed] [Google Scholar]
- 7.Clemente JC, Ursell LK, Parfrey LW & Knight R The impact of the gut microbiota on human health: an integrative view. Cell 148, 1258–1270 (2012). [DOI] [PMC free article] [PubMed] [Google Scholar]
- 8.Tilg H, Zmora N, Adolph TE & Elinav E The intestinal microbiota fuelling metabolic inflammation. Nat. Rev. Immunol. 20, 40–54 (2020). [DOI] [PubMed] [Google Scholar]
- 9.Turnbaugh PJ et al. An obesity-associated gut microbiome with increased capacity for energy harvest. Nature 444, 1027–1031 (2006). [DOI] [PubMed] [Google Scholar]
- 10.Kuang Z et al. The intestinal microbiota programs diurnal rhythms in host metabolism through histone deacetylase 3. Science 365, 1428–1434 (2019). [DOI] [PMC free article] [PubMed] [Google Scholar]
- 11.Ridaura VK et al. Gut microbiota from twins discordant for obesity modulate metabolism in mice. Science 341, 1241214 (2013). [DOI] [PMC free article] [PubMed] [Google Scholar]
- 12.Ferretti P et al. Mother-to-infant microbial transmission from different body sites shapes the developing infant gut microbiome. Cell Host Microbe 24, 133–145 e135 (2018). [DOI] [PMC free article] [PubMed] [Google Scholar]
- 13.Moeller AH et al. Cospeciation of gut microbiota with hominids. Science 353, 380–382 (2016). [DOI] [PMC free article] [PubMed] [Google Scholar]
- 14.Sonnenburg ED et al. Diet-induced extinctions in the gut microbiota compound over generations. Nature 529, 212–215 (2016). [DOI] [PMC free article] [PubMed] [Google Scholar]
- 15.Clemente JC et al. The microbiome of uncontacted Amerindians. Sci. Adv. 10.1126/sciadv.1500183 (2015). [DOI] [PMC free article] [PubMed] [Google Scholar]
- 16.Pasolli E et al. Extensive unexplored human microbiome diversity revealed by over 150,000 genomes from metagenomes spanning age, geography, and lifestyle. Cell 176, 649–662.e620 (2019). [DOI] [PMC free article] [PubMed] [Google Scholar]
- 17.Sonnenburg JL & Sonnenburg ED Vulnerability of the industrialized microbiota. Science 10.1126/science.aaw9255 (2019). [DOI] [PubMed] [Google Scholar]
- 18.Collaborators GBDRF Global, regional, and national comparative risk assessment of 79 behavioural, environmental and occupational, and metabolic risks or clusters of risks, 1990–2015: a systematic analysis for the Global Burden of Disease Study 2015. Lancet 388, 1659–1724 (2016). [DOI] [PMC free article] [PubMed] [Google Scholar]
- 19.Blaser MJ The theory of disappearing microbiota and the epidemics of chronic diseases. Nat. Rev. Immunol. 17, 461–463 (2017). [DOI] [PubMed] [Google Scholar]
- 20.Sonnenburg ED & Sonnenburg JL The ancestral and industrialized gut microbiota and implications for human health. Nat. Rev. Microbiol 17, 383–390 (2019). [DOI] [PubMed] [Google Scholar]
- 21.Rosshart SP et al. Laboratory mice born to wild mice have natural microbiota and model human immune responses. Science 10.1126/science.aaw4361 (2019). [DOI] [PMC free article] [PubMed] [Google Scholar]
- 22.Rosshart SP et al. Wild mouse gut microbiota promotes host fitness and improves disease resistance. Cell 171, 1015–1028.e1013 (2017). [DOI] [PMC free article] [PubMed] [Google Scholar]
- 23.Chung H et al. Gut immune maturation depends on colonization with a host-specific microbiota. Cell 149, 1578–1593 (2012). [DOI] [PMC free article] [PubMed] [Google Scholar]
- 24.Abdelaal M, le Roux CW & Docherty NG Morbidity and mortality associated with obesity. Ann. Transl. Med. 5, 161 (2017). [DOI] [PMC free article] [PubMed] [Google Scholar]
- 25.Janochova K, Haluzik M & Buzga M Visceral fat and insulin resistance—what we know? Biomed. Pap. Med. Fac. Univ. Palacky Olomouc Czech Repub. 163, 19–27 (2019). [DOI] [PubMed] [Google Scholar]
- 26.Deng F, Li Y & Zhao J The gut microbiome of healthy long-living people. Aging (Albany NY) 11, 289–290 (2019). [DOI] [PMC free article] [PubMed] [Google Scholar]
- 27.Duvallet C, Gibbons SM, Gurry T, Irizarry RA & Alm EJ Meta-analysis of gut microbiome studies identifies disease-specific and shared responses. Nat. Commun. 8, 1784 (2017). [DOI] [PMC free article] [PubMed] [Google Scholar]
- 28.Bisanz JE, Upadhyay V, Turnbaugh JA, Ly K & Turnbaugh PJ Meta-analysis reveals reproducible gut microbiome alterations in response to a high-fat diet. Cell Host Microbe 26, 265–272 e264 (2019). [DOI] [PMC free article] [PubMed] [Google Scholar]
- 29.Guo J & Hall KD Estimating the continuous-time dynamics of energy and fat metabolism in mice. PLoS Comput. Biol. 5, e1000511 (2009). [DOI] [PMC free article] [PubMed] [Google Scholar]
- 30.Rui L Energy metabolism in the liver. Compr. Physiol. 4, 177–197 (2014). [DOI] [PMC free article] [PubMed] [Google Scholar]
- 31.von Essen G, Lindsund E, Cannon B & Nedergaard J Adaptive facultative diet-induced thermogenesis in wild-type but not in UCP1-ablated mice. Am. J. Physiol. Endocrinol. Metab. 313, E515–E527 (2017). [DOI] [PubMed] [Google Scholar]
- 32.Zhang Y et al. Targeted deletion of thioesterase superfamily member 1 promotes energy expenditure and protects against obesity and insulin resistance. Proc. Natl Acad. Sci. USA 109, 5417–5422 (2012). [DOI] [PMC free article] [PubMed] [Google Scholar]
- 33.Boushey RP & Drucker DJ Encyclopedia of Endocrine Disease (ed. Martini L.) 183–188 (Elsevier, 2004). [Google Scholar]
- 34.Kirchner H, Tong J, Tschop MH & Pfluger PT Ghrelin and PYY in the regulation of energy balance and metabolism: lessons from mouse mutants. Am. J. Physiol. Endocrinol. Metab. 298, E909–E919 (2010). [DOI] [PubMed] [Google Scholar]
- 35.Vrang N, Madsen AN, Tang-Christensen M, Hansen G & Larsen PJ PYY(3–36) reduces food intake and body weight and improves insulin sensitivity in rodent models of diet-induced obesity. Am. J. Physiol. Regul. Integr. Comp. Physiol. 291, R367–R375 (2006). [DOI] [PubMed] [Google Scholar]
- 36.Boey D et al. PYY transgenic mice are protected against diet-induced and genetic obesity. Neuropeptides 42, 19–30 (2008). [DOI] [PubMed] [Google Scholar]
- 37.Breton J et al. Gut commensal E. coli proteins activate host satiety pathways following nutrient-induced bacterial growth. Cell Metab. 23, 324–334 (2016). [DOI] [PubMed] [Google Scholar]
- 38.Kleinert M, Sachs S, Habegger KM, Hofmann SM & Muller TD Glucagon regulation of energy expenditure. Int. J. Mol. Sci. 10.3390/ijms20215407 (2019). [DOI] [PMC free article] [PubMed] [Google Scholar]
- 39.Kinoshita K et al. Glucagon is essential for adaptive thermogenesis in brown adipose tissue. Endocrinology 155, 3484–3492 (2014). [DOI] [PubMed] [Google Scholar]
- 40.Al Nabhani Z et al. A weaning reaction to microbiota is required for resistance to immunopathologies in the adult. Immunity 50, 1276–1288 e1275 (2019). [DOI] [PubMed] [Google Scholar]
- 41.Cox LM et al. Altering the intestinal microbiota during a critical developmental window has lasting metabolic consequences. Cell 158, 705–721 (2014). [DOI] [PMC free article] [PubMed] [Google Scholar]
- 42.Lynch SV & Pedersen O The human intestinal microbiome in health and disease. N. Engl. J. Med. 375, 2369–2379 (2016). [DOI] [PubMed] [Google Scholar]
- 43.Negron SG, Ercan-Sencicek AG, Freed J, Walters M & Lin Z Both proliferation and lipogenesis of brown adipocytes contribute to postnatal brown adipose tissue growth in mice. Sci. Rep. 10, 20335 (2020). [DOI] [PMC free article] [PubMed] [Google Scholar]
- 44.Dominguez-Bello MG, Godoy-Vitorino F, Knight R & Blaser MJ Role of the microbiome in human development. Gut 68, 1108–1114 (2019). [DOI] [PMC free article] [PubMed] [Google Scholar]
- 45.Ribo S et al. Increasing breast milk betaine modulates Akkermansia abundance in mammalian neonates and improves long-term metabolic health. Sci. Transl. Med. 10.1126/scitranslmed.abb0322 (2021). [DOI] [PMC free article] [PubMed] [Google Scholar]
- 46.Wolf MJ et al. Metabolic activation of intrahepatic CD8+ T cells and NKT cells causes nonalcoholic steatohepatitis and liver cancer via cross-talk with hepatocytes. Cancer Cell 26, 549–564 (2014). [DOI] [PubMed] [Google Scholar]
- 47.Rakoff-Nahoum S, Paglino J, Eslami-Varzaneh F, Edberg S & Medzhitov R Recognition of commensal microflora by toll-like receptors is required for intestinal homeostasis. Cell 118, 229–241 (2004). [DOI] [PubMed] [Google Scholar]
- 48.Evans AM et al. High resolution mass spectrometry improves data quantity and quality as compared to unit mass resolution mass spectrometry in high-throughput profiling metabolomics. Metabolomics (Los Angel.) 2014, 2 (2014). [Google Scholar]
- 49.Ford L et al. Precision of a clinical metabolomics profiling platform for use in the identification of inborn errors of metabolism. J. Appl. Lab. Med. 5, 342–356 (2020). [DOI] [PubMed] [Google Scholar]
- 50.Dehaven CD, Evans AM, Dai H & Lawton KA Organization of GC/MS and LC/MS metabolomics data into chemical libraries. J. Cheminform. 2, 9 (2010). [DOI] [PMC free article] [PubMed] [Google Scholar]
- 51.Evans AM, DeHaven CD, Barrett T, Mitchell M & Milgram E Integrated, nontargeted ultrahigh performance liquid chromatography/electrospray ionization tandem mass spectrometry platform for the identification and relative quantification of the small-molecule complement of biological systems. Anal. Chem. 81, 6656–6667 (2009). [DOI] [PubMed] [Google Scholar]
- 52.Callahan BJ et al. DADA2: high-resolution sample inference from Illumina amplicon data. Nat. Methods 13, 581–583 (2016). [DOI] [PMC free article] [PubMed] [Google Scholar]
- 53.McMurdie PJ & Holmes S phyloseq: an R package for reproducible interactive analysis and graphics of microbiome census data. PLoS ONE 8, e61217 (2013). [DOI] [PMC free article] [PubMed] [Google Scholar]
- 54.Gower JC Some distance properties of latent root and vector methods used in multivariate analysis. Biometrika 53, 325–338 (1966). [Google Scholar]
- 55.Anderson MJ A new method for non-parametric multivariate analysis of variance. Austral. Ecol. 26, 32–46 (2001). [Google Scholar]
- 56.Love MI, Huber W & Anders S Moderated estimation of fold change and dispersion for RNA-seq data with DESeq2. Genome Biol. 15, 550 (2014). [DOI] [PMC free article] [PubMed] [Google Scholar]
- 57.Bolger AM, Lohse M & Usadel B Trimmomatic: a flexible trimmer for Illumina sequence data. Bioinformatics 30, 2114–2120 (2014). [DOI] [PMC free article] [PubMed] [Google Scholar]
- 58.Langmead B & Salzberg SL Fast gapped-read alignment with Bowtie 2. Nat. Methods 9, 357–359 (2012). [DOI] [PMC free article] [PubMed] [Google Scholar]
- 59.Li D, Liu CM, Luo R, Sadakane K & Lam TW MEGAHIT: an ultra-fast single-node solution for large and complex metagenomics assembly via succinct de Bruijn graph. Bioinformatics 31, 1674–1676 (2015). [DOI] [PubMed] [Google Scholar]
- 60.Seemann T Prokka: rapid prokaryotic genome annotation. Bioinformatics 30, 2068–2069 (2014). [DOI] [PubMed] [Google Scholar]
- 61.Wood DE & Salzberg SL Kraken: ultrafast metagenomic sequence classification using exact alignments. Genome Biol. 15, R46 (2014). [DOI] [PMC free article] [PubMed] [Google Scholar]
- 62.Gu S et al. Mechanisms for complex chromosomal insertions. PLoS Genet. 12, e1006446 (2016). [DOI] [PMC free article] [PubMed] [Google Scholar]
- 63.Andrews S FastQC: A quality control tool for high throughput sequence data. http://www.bioinformatics.babraham.ac.uk/projects/fastqc/ (2010).
- 64.Dobin A et al. STAR: ultrafast universal RNA-seq aligner. Bioinformatics 29, 15–21 (2013). [DOI] [PMC free article] [PubMed] [Google Scholar]
- 65.Liao Y, Smyth GK & Shi W featureCounts: an efficient general purpose program for assigning sequence reads to genomic features. Bioinformatics 30, 923–930 (2014). [DOI] [PubMed] [Google Scholar]
Associated Data
This section collects any data citations, data availability statements, or supplementary materials included in this article.
Supplementary Materials
Data Availability Statement
Raw sequence data from all 16S, shotgun metagenomics and RNA-sequencing experiments are deposited in the NCBI Sequence Read Archive under BioProject accession number PRJNA735448. Source data for the western blot are provided with this paper. Additional information and materials will be made available upon reasonable request.


