

Abstract
Background and aims
Low-density lipoprotein (LDL) plasma concentration decline is a biomarker for acute inflammatory diseases, including coronavirus disease-2019 (COVID-19). Phenotypic changes in LDL during COVID-19 may be equally related to adverse clinical outcomes.
Methods
Individuals hospitalized due to COVID-19 (n = 40) were enrolled. Blood samples were collected on days 0, 2, 4, 6, and 30 (D0, D2, D4, D6, and D30). Oxidized LDL (ox-LDL), and lipoprotein-associated phospholipase A2 (Lp-PLA2) activity were measured. In a consecutive series of cases (n = 13), LDL was isolated by gradient ultracentrifugation from D0 and D6 and was quantified by lipidomic analysis. Association between clinical outcomes and LDL phenotypic changes was investigated.
Results
In the first 30 days, 42.5% of participants died due to Covid-19. The serum ox-LDL increased from D0 to D6 (p < 0.005) and decreased at D30. Moreover, individuals who had an ox-LDL increase from D0 to D6 to over the 90th percentile died. The plasma Lp-PLA2 activity also increased progressively from D0 to D30 (p < 0.005), and the change from D0 to D6 in Lp-PLA2 and ox-LDL were positively correlated (r = 0.65, p < 0.0001). An exploratory untargeted lipidomic analysis uncovered 308 individual lipids in isolated LDL particles. Paired-test analysis from D0 and D6 revealed higher concentrations of 32 lipid species during disease progression, mainly represented by lysophosphatidyl choline and phosphatidylinositol. In addition, 69 lipid species were exclusively modulated in the LDL particles from non-survivors as compared to survivors.
Conclusions
Phenotypic changes in LDL particles are associated with disease progression and adverse clinical outcomes in COVID-19 patients and could serve as a potential prognostic biomarker.
Keywords: Oxidized low-density lipoprotein, Lipoprotein-associated phospholipase A2, Quantitative lipidomics, COVID-19
1. Introduction
A seemingly disproportionate lethality for a subset of patients with coronavirus disease-2019 (COVID-19) is one of the most striking features of this disease. Identification of high-risk individuals is, therefore, crucial for the design of effective coping strategies. Reduction in plasma low-density lipoprotein (LDL) cholesterol was recently identified as a high mortality risk predictive biomarker [1]. A significant decline in plasma LDL-cholesterol (LDL-C) concentration has also been reported in the acute inflammatory phase of several diseases, such as myocardial infarction [[2], [3], [4], [5]], pancreatitis [6], and bacterial or viral sepsis [7,8]. Under these conditions, as well as in COVID-19, LDL-C decrease is related to adverse clinical outcomes [9].
Although it is not fully understood how an acute decline of plasma LDL-C could impact the severity of COVID-19, increased lipoprotein catabolism from the bloodstream has been suggested as a putative mechanism [10]. The current concept is that the cellular accumulation of cholesterol in the acute phase benefits the host, conserving biosynthetic resources and favoring the general immune response to infections or wound healing [11]. In respiratory infections such as COVID-19, increased removal of LDL may also result from the uptake of this lipoprotein by alveolar cells to supply cholesterol for the production of surfactant components [12,13]. Cellular lipidomic studies revealed that human coronavirus can modify both lipid signaling and metabolism in vitro to benefit its replication [11]. Also, virus replication sometimes requires lipids for their assembly, intracellular traffic, and also to serve as a source of energy [14].
Phenotypic changes in LDL, such as oxidation and reduction of its size and density, have also been reported in clinical conditions associated with an acute inflammatory response [15]. With the increased LDL turnover and systemic oxidative stress, changes in the LDL lipid composition are expected to occur during COVID-19, which may impact the clinical outcome. Hence, the present study was designed to investigate the change in oxidative and lipid composition of LDL during the acute phase of COVID-19 and its potential association with clinical outcomes.
2. Patients and methods
2.1. Study population
Patients enrolled in this study were the Brazilian subgroup of patients who participated in the RIC in COVID-19 trial [16], for whom a remote ischemia and reperfusion stimulus on the brachial artery was neutral on both inflammatory and clinical outcomes [17]. The study protocol was registered on the public trials database clinicaltrials.gov NCT04699227. It was approved by the Ethics Committee of the State University of Campinas (CAAE: 33.709.320.4.0000.5404) and all participants signed informed consent before entering the study.
All details regarding the inclusion and exclusion criteria and tests performed were previously described [16]. Briefly, inclusion criteria included: (i) adult patients (≥18 to 80 years of age) with a diagnosis of COVID-19 infection; (ii) clinical features of respiratory distress (respiratory rate > 30 bpm or use of accessory muscles); (iii) peripheral oxygen saturation SaO2 < 95% or requiring oxygen supplementation; (iv) clinically unwell with reduced mobility, raised temperature/heart rate, and/or deranged biochemical laboratory results. Exclusion criteria included: (i) contraindication for the use of a brachial cuff; (ii) intercurrent disease with an expected life expectancy of <24 h; (iii) cardiac arrest; (iv) pregnant or breastfeeding women; (v) bleeding disorder or platelet count below 50 × 109 cells/L; (vi) currently enrolled in another research study; (vii) end-stage renal disease requiring renal replacement therapy; (viii) chronic liver disease; (ix) significant immunodeficiency states; (x) any active underlying malignancy; (xi) baseline stage C chronic heart failure; (xii) critical illness requiring invasive ventilation. Plasma was obtained on the first day of admission (D0) and every two days until the sixth day (D2, D4 and D6), thereafter on the thirtieth day (D30) of study participation. Aliquots were stored in liquid nitrogen.
2.2. Laboratory methods
Oxidized LDL (ox-LDL) was assessed by ELISA kits from Mercodia (Uppsala, Sweden), according to the manufacturer's instructions. This test is based on monoclonal antibodies directed against separate antigenic determinants on the oxidized apolipoprotein B molecule. The ox-LDL measurements were performed in samples from 40 hospitalized patients on days 0, 2, 4, 6, and 30 (D0, D2, D4, D6, and D30, respectively). These kits were kindly provided by Mercodia.
Lipoprotein-associated phospholipase A2 (Lp-PLA2) also known as platelet-activating factor acetylhydrolase (PAF-AH) was evaluated by an activity assay kit from Cayman Chemical (Ann Arbor, MI, United States), according to the manufacturer's instructions. The Lp-PLA2 measurements were performed in samples from 40 hospitalized patients on days 0, 6, and 30 (D0, D6, and D30, respectively).
2.3. Lipidomic analysis of isolated total LDL
In a sequential and exploratory analysis, we search for changes in LDL lipidome composition between day 0 (D0) at admission and day 6 (D6) the peak of ox-LDL concentration in approximately 30 % of the patients admitted in the study. The selection criteria were patients of the sham group (n = 20), non-diabetic (n = 16) and from whom plasma samples were available at D0 and D6 (n = 13). These two days were selected because they represented ox-LDL's baseline and peak plasma concentrations, respectively. The rationale for selecting the sham group was to avoid possible effects of the intervention group, since, at the time of sample collection, we could not certify the intervention would be neutral. Finally, the decision related to not including diabetic patients was to avoid any putative diabetes-related effects in COVID-19 patients' lipidomic analysis. All of these steps are shown in supplemental Fig. 4.”
Supplemental Fig. 4.

Flowchart of the samples used in the lipidomic analysis.
Total LDL was isolated from 1.7 mL of plasma adjusted to a density of 1.21 g/mL with potassium bromide (KBr). KBr solutions were added to make a gradient with the aid of a mini peristaltic pump: (i) 1.3 ml saline (1.063 g/ml), (ii) 1.3 ml saline (1.019 g/ml) and (iii) 1.1 ml saline (1.006 g/ml). The gradient formed was ultracentrifuged at 55,000 rpm for 15 h and 30 min at 15 °C in an SW-55 rotor (Beckman L8-70M, Beckman Coulter Inc.). After ultracentrifugation, the lipoprotein fractions in the sequence very-low-density lipoprotein (VLDL) and intermediate-density lipoprotein (IDL), LDL, and high-density lipoprotein (HDL) were extracted in 1.2 mL, 1.7 mL, and 1.0 mL volumes.
Isolated bulk LDL (n = 26 samples in total, 200 μL aliquots) was analyzed by an untargeted lipidomic method as previously described [18]. In brief, the isolated LDL samples were spiked with a mix of internal standards (detailed in Table S1) before total lipid extraction with a modified MTBE method [19]. Total lipid extracts were evaporated to dryness and resuspended in 200 μL isopropanol and measured by liquid chromatography (C18 column, reverse phase) tandem electrospray time-of-flight mass spectrometry. The 400 most abundant ions from MS/MS experiments in negative and positive ionization modes were manually annotated and identified exclusively based on their fragmentation patterns in three randomly selected samples from D0 and D6. A list of exact masses and retention time for lipid species was thereby generated and compounds were quantified as peak areas of precursor ions in MS1 experiments. Peak areas of lipid species were compared to those of the respective class-specific internal standard (a semi-quantitative approach; according to 18), and the molar concentration for each lipid was calculated. For data normalization, three distinct procedures were performed: 1) total volume of plasma used for LDL isolation; 2) total lipids (sum of all lipid species); 3) total cholesterol (sum of free and esterified cholesterol). Applying multivariate analysis (not shown here), a great similarity between total lipids and total cholesterol normalization was observed, and the former was adopted in this study. Finally, a pooled sample containing an aliquot of total lipid extracts from each experimental sample was used as quality control. This pooled sample was injected before and after a batch of 5–6 experimental samples and the coefficient of variance (CV) was calculated. Using a CV < 20% as the cutoff, we identified eight compounds above this threshold, which were excluded from statistical analyses.
2.4. Statistics
Data are presented as mean ± standard deviation (SD) when normally distributed or median and interquartile range (IQR) when nonparametric. Kolmogorov-Smirnov test was used to check normality. Continuous variables were compared between groups using the Student's t-test or Wilcoxon-Mann-Whitney U test. Lipidomic data were log-transformed to achieve normal distribution. For univariate analysis, a paired t-test was applied with a false discovery rate (FDR; as control of Type-I error or false positives) to identify differences between sampling time points (D0 versus D6). Significantly altered compounds were plotted as a heatmap (represented by the fold-change of the average for each compound) together with hierarchical clustering of compounds (y-axis) and samples (x-axis). To compare the most relevant changes in compound concentrations (here as percentage of total lipids) among survivors and non-survivors (i.e., D0 versus D6), a Venn diagram was generated taking into account the paired t-tests (p < 0.05) and fold-changes higher than 2 to identify common and unique altered lipid species. The associations between lipid subclasses (i.e., the sum of lipid species concentrations within a subclass) and ox-LDL or Lp-PLA2 were verified through Spearman Rank correlation. Statistical analyses of LDL lipidome data were conducted using Metaboanalyst (www.metaboanalyst.ca), following protocols in Xia and Wishart (2016) [20].
3. Results
3.1. The changes in Lp-PLA2 and ox-LDL
A total of 40 adult individuals hospitalized due to COVID-19 were analyzed in this study. The demographic and clinical characteristics of the participants are presented in Table 1 . None of the patients were vaccinated for COVID before hospitalization. A total of 17 patients (42.5%) died during the first 30 days. The remote ischemic conditioning intervention tested in the RIC in COVID-19 trial was neutral for the trial and it was equally not associated with any clinical or laboratory characteristics obtained in the present study [17].
Table 1.
Demographic and clinical parameters.
| Patients with Covid-19 (n = 40) | Survivors (n = 23) | Non-survivors (n = 17) | p-value | |
|---|---|---|---|---|
| Age | 58 ± 11.8 | 57 ± 12.2 | 60 ± 11.3 | 0.379 |
| Female | 18 (45.0) | 11 (47.8) | 7 (41.1) | 0.676 |
| Ethnicity | 0.497 | |||
| White | 32 (80.0) | 19 (82.6) | 13 (76.5) | |
| Black | 1 (2.5) | 1 (4.3) | 0 (0.0) | |
| Other | 7 (17.5) | 3 (13.0) | 4 (23.5) | |
| Physical examination at admission | ||||
| SBP, mmHg | 133 ± 15.9 | 135 ± 12.6 | 130 ± 19.6 | 0.361 |
| DBP, mmHg | 73 ± 9.4 | 75 ± 8.3 | 70 ± 10.2 | 0.081 |
| Heart rate, bpm | 89 ± 14.4 | 87 ± 13.6 | 91 ± 15.6 | 0.412 |
| Oxygen saturation, % | 95 ± 2.8 | 95 ± 2.9 | 96 ± 2.6 | 0.322 |
| Respiratory rate, breaths/min | 24 ± 3.7 | 23 ± 3.4 | 25 ± 3.9 | 0.123 |
| Temperature, °C | 37 ± 0.4 | 37 ± 0.4 | 37 ± 0.5 | 0.419 |
| Symptoms at admission | ||||
| Fever | 29 (72.5) | 17 (73.9) | 12 (70.6) | 0.816 |
| Fatigue | 26 (65.0) | 15 (65.2) | 11 (64.7) | 0.973 |
| Cough | 34 (85.0) | 20 (87.0) | 14 (82.4) | 0.687 |
| Anorexia | 7 (17.5) | 3 (13.0) | 4 (23.5) | 0.388 |
| Myalgia | 12 (30.0) | 10 (43.5) | 2 (11.8) | 0.030 |
| Dyspnea | 35 (87.5) | 21 (91.3) | 14 (82.4) | 0.397 |
| Sputum | 2 (5.0) | 1 (4.3) | 1 (5.9) | 0.826 |
| Diarrhea | 4 (10.0) | 1 (4.3) | 3 (17.6) | 0.166 |
| Medical history | ||||
| Arterial Hypertension | 20 (50.0) | 11 (47.8) | 9 (52.9) | 0.749 |
| Diabetes Mellitus | 11 (27.5) | 7 (30.4) | 4 (23.5) | 0.629 |
| Chronic kidney disease | 1 (2.5) | 1 (4.3) | 0 (0.0) | 0.384 |
| Heart Failure | 2 (5.0) | 1 (4.3) | 1 (5.9) | 0.826 |
| Prior acute coronary syndrome | 2 (5.0) | 2 (8.7) | 0 (0.0) | 0.212 |
| Prior Ischemic Stroke | 2 (5.0) | 1 (4.3) | 1 (5.9) | 0.826 |
| COPD | 2 (5.0) | 1 (4.3) | 1 (5.9) | 0.826 |
| Current Smoker | 0 (0.0) | 0 (0.0) | 0 (0.0) | na |
| Former Smoker | 8 (20.0) | 3 (13.0) | 5 (29.4) | 0.201 |
| Obesity | 22 (55.0) | 11 (47.8) | 11 (64.7) | 0.289 |
| Dyslipidemia | 8 (20.0) | 5 (21.7) | 3 (17.6) | 0.749 |
| HIV | 0 (0.0) | 0 (0.0) | 0 (0.0) | n/a |
| Prior tuberculosis | 0 (0.0) | 0 (0.0) | 0 (0.0) | n/a |
| Medications in use | ||||
| Steroids | 24 (60.0) | 7 (30.4) | 17 (100.0) | 0.001 |
| Statins | 8 (20.0) | 5 (21.7) | 3 (17.6) | 0.749 |
| ARB | 15 (37.5) | 7 (30.4) | 8 (47.1) | 0.283 |
| ACEi | 4 (10.0) | 3 (13.0) | 1 (5.9) | 0.455 |
| Beta-blockers | 6 (15.0) | 4 (17.4) | 2 (11.8) | 0.622 |
| Diuretic | 5 (12.5) | 2 (8.7) | 3 (17.6) | 0.397 |
| Metformin | 8 (20.0) | 6 (26.1) | 2 (11.8) | 0.096 |
| Insulin | 4 (10.0) | 1 (4.3) | 3 (17.6) | 0.166 |
| Biochemical analysis | ||||
| RT-PCR Covid-19 | 40 (100.0) | 23 (100.0) | 17 (100.0) | n/a |
| Hemoglobin, g/dL | 13 ± 1.4 | 13 ± 1.3 | 13 ± 1.5 | 0.514 |
| White cell count, per thousand | 9 (6.69) | 8 (6.02) | 13.37 (7.55) | 0.001 |
| Creatinine, mg/dL | 0.86 (0.63) | 0.78 (0.28) | 1.18 (1.02) | 0.211 |
| ALT, U/L | 64 (26) | 69 (84) | 48 (26) | 0.229 |
| C-reactive protein, mg/dL | 129 (155) | 111 (140) | 143 (116) | 0.122 |
| Dimer D (ng/dl) | 1631 (3007) | 1189 (2583) | 2811 (1867) | 0.714 |
| Clinical outcomes | ||||
| Clinical deterioration | 21 (52.5) | 4 (17.4) | 17 (100.0) | 0.001 |
| Intubation | 24 (60.0) | 7 (30.4) | 17 (100.0) | 0.001 |
| Death | 17 (42.5) | 0 (0.0) | 17 (100.0) | 0.001 |
| Pulmonary embolism | 3 (7.5) | 2 (8.7) | 1 (5.9) | 0.738 |
| RRT | 11 (27.5) | 1 (4.3) | 10 (58.8) | 0.001 |
| Time to outcome, days | ||||
| Time of symptoms until admission | 10 (4.5) | 10 (5.0) | 10 (2.5) | 0.745 |
| Clinical deterioration | 1 (0.0) | 2 (8.8) | 1 (0.0) | 0.237 |
| Discharge | 8 (13.0) | 8 (13.0) | n/a | n/a |
| Death | 14 (12.0) | n/a | 14 (12.0) | n/a |
| Pulmonary embolism | 14 6.4) | 15 (1.4) | 4 (0.0) | 0.667 |
| RRT initiation | 9 (9.0) | 6 (0.0) | 10 (9.8) | 0.727 |
| Days on RRT | 9 (13.0) | 10 (0.0) | 8 (15.0) | 0.727 |
Continuous data are reported as mean ± standard deviation or median (IQR). Categorical data are n (%). All were applied to the total number of individuals (n = 40). SBP, systolic blood pressure; DBP, diastolic blood pressure; CPOD, chronic obstructive pulmonary disease; HIV, human immunodeficiency virus; ARB, angiotensin receptor blockers; ACEi, angiotensin-converting enzyme inhibitors; RT-PCR, real-time polymerase chain reaction; ALT, alanine aminotransferase; RRT, renal replacement therapy.
Serum and plasma samples were obtained in all enrolled patients on D0 and D6 and in 25 of those who survived until the D30. As depicted in Fig. 1, we found an increase in the serum concentration of ox-LDL from D0 to D6 (p < 0.005). As depicted in Fig. 2, the plasma Lp-PLA2 activity increased progressively from D0 to D30, but the difference reached statistical significance only in D30 (p < 0.005). Since we lost statistical power at D30 due to the early mortality of some patients, we used the change from D0 to D6 for correlation analyses and these same two time-points for LDL lipidomics. The change from D0 to D6 in Lp-PLA2 and ox-LDL were positively correlated (r = 0.65, p < 0.0001) (Fig. 3). We also included the data comparing survivors and non-survivors' patients in supplemental data. The only difference found between the groups was ox-LDL concentration comparing D0 vs. D6 (Supplemental Fig. 1). Regarding the analysis of Lp-PLA2 activity or change in ox-LDL as a function of change in LP-PLA2 activity from D0 to D6 the results were consistent with the main cohort with all patients (Supplemental Fig. 2, Supplemental Fig. 3).
Fig. 1.

Oxidized Low-density Lipoprotein (ox-LDL) measurements (U/L). The measurements were performed in plasma samples from 40 hospitalized patients on days 0, 2, 4, 6, and 30 (D0, D2, D4, D6, and D30, respectively). Ox-LDL was assessed by enzyme-linked immunosorbent assay kits according to the manufacturer's instructions. Data were analyzed through the Wilcoxon-Mann-Whitney U test.
Fig. 2.

Lipoprotein-associated phospholipase A2 (Lp-PLA2) activity measurements in plasma samples (mmol/min/ml). The measurements were performed in plasma samples from 40 hospitalized patients on days 0, 6, and 30 (D0, D6, and D30, respectively). Lp-PLA2 was assessed by enzyme-linked immunosorbent assay kits according to the manufacturer's instructions. Data were analyzed through paired t-tests.
Fig. 3.

Linear regression of the change in oxidized low-density lipoprotein (ox-LDL) and lipoprotein-associated phospholipase A2 (Lp-PLA2). Data expressed the change in ox-LDL and Lp-PLA2 from D0 to D6 were positively correlated (r = 0.65, p < 0.0001) verified through Spearman Rank correlation.
Supplemental Fig. 1.

Ox-LDL levels at each timepoint among survivors and non-survivors. One-way ANOVA with multiple comparison with Sidak adjustment reported no significant change from baseline among survivors, but ox-LDL levels varied significantly from baseline to D6 in non-survivors.
Supplemental Fig. 2.

LP-LPA activity at each timepoint according to survival status. One-way ANOVA with multiple comparison with Sidak adjustment reported no significant change from baseline in both groups.
Supplemental Fig. 3.

Linear regression of change in ox-LDL as a function of change in LP-PLA2 activity from D0 to D6. The curves represent the linear regression of survivors (light gray) and non-survivors (darker gray). The equations were y = 2979*x-3.33 for survivors (R2 linear = 0.640) and y = 4148*x + 20.4 for non-survivors (R2 linear = 0.637).
3.2. LDL lipidome characteristics
As commented above, LDL particles obtained at D0 and D6 from 13 patients enrolled in the study underwent lipidomic analysis. Baseline characteristics of this subset of patients are summarized in supplemental Table 1. A total of 308 individual lipid molecular species were described in isolated LDL particles through untargeted lipidomic analysis (Supplemental Table 2). These lipid species were distributed into 21 subclasses as shown in supplemental Table 2, from which triglycerides (TG) and phosphatidylcholine (PC) displayed the highest number of individual compounds, followed by ceramide (CE), and sphingomyelin (SM). For quantitative comparison of LDL lipidome, data were normalized to total lipids and log-transformed. The compounds displaying a coefficient of variance higher than 20% were excluded from statistical analyses. Paired t-test analysis from D0 and D6 revealed higher concentrations of 32 lipid species with disease progression (Fig. 4A). The great majority of these altered lipids were represented by phospholipids, in particular, significant contributions of lysophospholipids (8 out of 18 total lysophospholipids; Fig. 4B) from both PC and PE (LPC and LPE, respectively) and phosphatidylinositol (PI, 7 out of 13 total PI) species.
Fig. 4.

Heatmap of main LDL lipidome alterations between days 0 and 6. Heatmap representing the 32 lipid species from LDL displaying significant differences in concentration (as percentage of total lipids) between days 0 and 6 for 13 patients (A). The sum of LPC and LPE concentration as a percentage (%) of total lipids in the log scale and significant differences between days 0 and 6 (B). Data analyses were log-transformed and compared using the student's t-test. X: Y where X = carbon and Y = double bonds.
3.3. LDL phenotype changes and clinical outcome
The association between LDL's phenotypic changes and mortality was evaluated and none of the baseline parameters were related to this outcome. While all individuals who presented ox-LDL change from D0 to D6 above the 90th percentile died during hospitalization, only 31% of those who were below this cutoff point had the same adverse outcome (p = 0.04). In an exploratory analysis based on the LDL lipidome alterations from D0 to D6, we compared individuals who survived (n = 4) with those who died (n = 9). It is worth noticing that differences between survivors and non-survivors were not apparent on D0 or D6 (unpaired t-test, using FDR; data not shown). In contrast, paired t-test conducted in survivors and non-survivors comparing D0 versus D6 revealed that concentrations of 19 lipid species were increased in both groups with disease progression (Supplemental Table 3). The majority of these commonly modulated lipids between survivors and non-survivors were represented by lysophospholipids (6 out of 19 total altered lipids), followed by 4 and 5 species of PC and TG, respectively (Supplemental Table 3). Nonetheless, whereas the concentrations of only 8 lipid species in LDL from survivors were found uniquely altered with disease progression, the data revealed 69 lipid species in LDL exclusively modulated in non-survivors (Fig. 5), from which all species displayed increased concentrations with disease progression (Supplemental Table 3). Of note, altered LDL lipid species exclusively found in non-survivors were mostly represented by phospholipids, SM, vitamin E (Vit E), and coenzyme Q-10 (Q10) (Supplemental Table 3). Among the altered phospholipids exclusively found in LDL from non-survivors, PC was the most numerically abundant, followed by PE and their monoether counterparts (i.e., plasmanyl and plasmenyl; oPE and pPE), lysophospholipids and PI species (Supplemental Table 3).
Fig. 5.
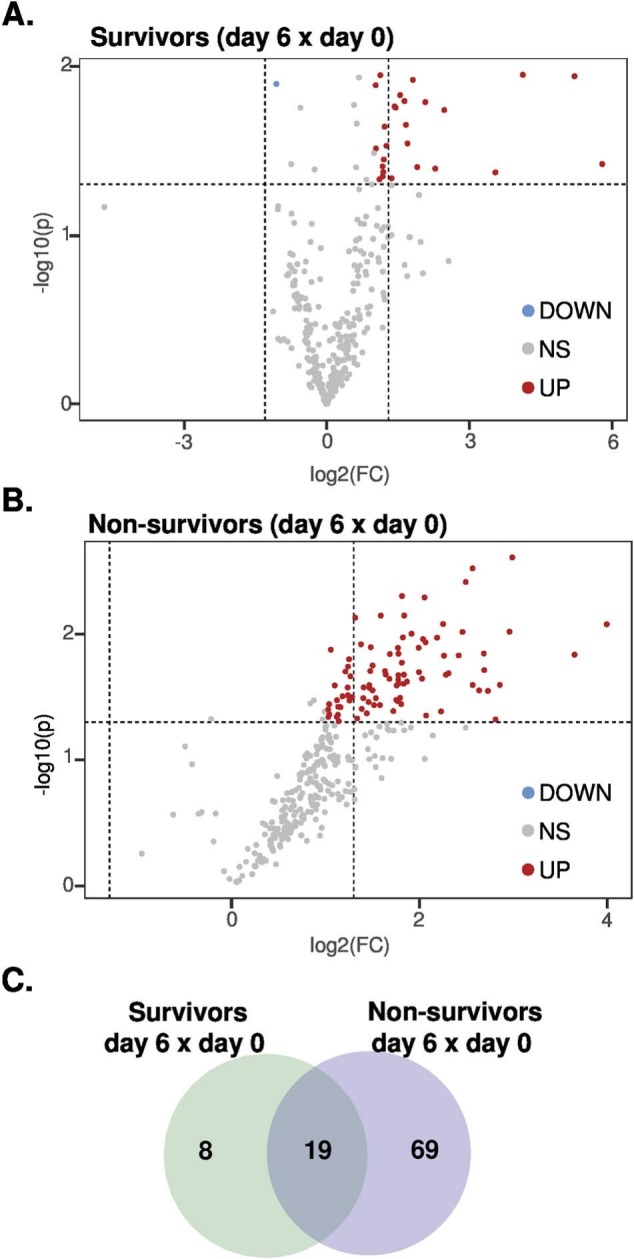
Volcano plots and Venn diagram. Volcano plots of paired data in survivors (A) and non-survivors (B) on day 6 versus day 0. Venn diagram displaying modulated lipids in survivors and non-survivors on day 6 versus day 0 (C). See Supplemental Table 3 for detailed information.
Volcano plots and Venn diagram. Volcano plots of paired data in survivors (A) and non-survivors (B) on day 6 versus day 0. Venn diagram displaying modulated lipids in survivors and non-survivors on day 6 versus day 0 (C). See Supplemental Table 3 for detailed information.
4. Discussion
The main finding of this study is that LDL oxidation and the change in its lipidome occur during the acute phase of COVID-19 and are likely related to adverse clinical outcomes. To the best of our knowledge, this is the first study to provide quantitative data on lipoprotein-specific lipidome composition in COVID-19-infected patients.
Increased lipoprotein oxidation is a feature of acute inflammatory diseases. Although there are many gaps in the understanding of this phenomenon, during the acute inflammatory response, a marked increase in the production of free radicals and reactive oxygen species occurs and is believed to be a part of the innate immune system response [21]. This same pattern of oxidative response has also been described in patients with COVID-19 and appears to play a role in viral replication and injury response [[22], [23], [24]]. In in vitro experiments, infection by SARS-CoV-2 increases mitochondrial production of reactive oxygen species (mtROS) that favor viral replication by increasing the stability of hypoxia-inducible factor 1-alpha (HIF-1α) [25]. HIF-1α can induce the expression of glycolytic and inflammatory genes, stimulating glycolysis and favoring viral replication and tissue damage. Indeed, inhibition of complex I or the use of antioxidants inhibits viral replication [25]. In the present study, we found the oxidation of apolipoprotein B present in LDL as a marker of systemic oxidative stress. Such ox-LDL particles lose their ability to bind to the LDL receptor and may favor the immuno-inflammatory response [26,27].
Although present in trace amounts, oxidized lipids concentrations remained unaltered in LDL during disease progression. Since a positive correlation between Lp-PLA2 activity and ox-LDL concentration was found in this study, we hypothesize that the lack of alteration in the content of oxidized lipids in LDL was due to increased Lp-PLA2 activity. This enzyme is predominantly found (80%) on LDL and is responsible for catalyzing the hydrolysis of fatty acids at the sn-2 position of the glycerol backbone of phospholipids [28]. Of note, Lp-PLA2 may hydrolyze oxidized phospholipids from ox-LDL to produce lysophosphatidylcholine (LPC) and oxidized non-esterified fatty acids (ox-NEFA), both lipids with the potential of playing a pro-inflammatory role [29].
Changes in LDL lipidome composition during the course of COVID-19 infection may have potential clinical implications. Firstly, there was an overall increase in LDL phospholipid content (examined as percentage of total lipids) from D0 to D6. Among the altered species of phospholipids in LDL during the COVID-19 course, LPC, LPE, and PI were by far the most representative (i.e., altered species relative to the total number of species within a lipid subclass). A potential source for such increased concentrations of LPC and LPE in LDL during COVID-19 may be the enhanced activity of Lp-PLA2 or LCAT. Enhanced activity of LCAT in LDL particles would result in increased concentrations of cholesteryl esters, which was not observed in our data. Secondly, in an exploratory analysis, a greater enrichment of LDL phospholipid concentrations was observed in individuals who died than those who survived during hospitalization. In agreement with our findings, changes in whole plasma lipidome profiles have been reported in COVID-19 patients. In general, these reports indicate the involvement of several lipid classes, including free fatty acids, glycerolipids such as TG, phospholipids and lysophospholipids, sphingolipids, and lipid mediators [[30], [31], [32], [33], [34]].
From a mechanistic standpoint, increased concentrations of lysophospholipids and PI as a general signature of disease progression could modulate both biophysical and electrostatic properties of LDL particles, interfering with insertion, conformation, and activity of membrane-bound proteins [35]. For instance, PI is the most abundant anionic or negatively charged lipid in blood plasma [18] and is deemed to influence the interaction of lipoproteins with lipid transfer proteins and enzymes (e.g., LCAT and hepatic lipase [36]). As opposed to phospholipids containing two hydrocarbon tails, lysophospholipids, such as LPE and LPC, tend to form monolayers with positive curvature [35], which could directly influence LDL's particle size and perhaps its function. As commented above, increased LPC content in LDL is strongly associated with lipoprotein oxidation. As major components of ox-LDL, LPC enrichment has been directly linked to monocyte migration and cytokine expression in smooth muscle cells, inhibition of vasodilatation, and exacerbation of nitric oxide production coupled to increased oxidative stress in endothelial cells [[37], [38], [39]].
Apart from phospholipids, we found that Q10 and vitamin E contents in LDL were also associated with mortality, and the former correlated with ox-LDL levels (data not shown). The possible mechanisms by which phospholipids, Q10, and vitamin E concentrations increased in LDL during COVID-19 progression are still elusive and beyond the scope of this study. Nevertheless, a potential route for such phospholipid enrichment in LDL particles may include, among others, the exchange of structural lipids, including free cholesterol and phospholipids, between LDL and VLDL under conditions of low lipoprotein lipase activity [40]. In line with this possibility, increased content of total TG, FC and phospholipids was exclusively observed in most VLDL fractions, along with LDL-2 and -6 fractions analyzed by nuclear magnetic resonance as a signature of COVID-19 in a robust number of patients (n = 246) [41]. While a substantial enrichment in TG was also observed in all LDL fractions from infected patients, similar to our results, the latter study reported a significant decrease in concentrations of phospholipids and FC in several LDL fractions. Although somewhat contrasting with our data, the results of both studies performed in distinct contexts and applying different analytical methods suggest that LDL lipidome undergoes considerable changes during disease progression [41].
In conclusion, in addition to the change in plasma LDL-C concentration evidenced in acute inflammatory diseases, we found that COVID-19 infection resulted in a series of alterations in the lipidome of LDL particles. The results obtained in this study provide strong support for a future larger study to determine whether the phenotypic changes in LDL particles can potentially serve as a biomarker for the adverse clinical outcome of COVID-19.
5. Study limitation
The Brazilian subgroup of the RIC in COVID-19 trial was calculated for a sample size of 40 patients, and ox-LDL analysis performed for all patients revealed a peak in plasma concentrations on day 6 of hospitalization. To avoid the effects of intervention and diabetes, LDL lipidomic analysis was limited to the sham group and non-diabetic patients with available samples on days 0 and 6. Despite the low number of patients, a strong association of specific molecular species within several lipid classes of LDL with disease progression was found with robust statistical significance (including the use of false discovery rate to minimize Type-I errors and fold-change higher than 2), independent of the clinical outcome. Although exploratory, we believe that main alterations in LDL lipidome as reported here have potential relevance for future studies focused on lipoprotein lipid changes in acute inflammatory diseases.
Financial support
H.R.P.C. and A.R.C. were awarded a scholarship from the Fundação de Amparo à Pesquisa do Estado de São Paulo (FAPESP), grants: 2018/17792–0 and 2020/12649–5, respectively. A.C.S. was supported by a Research Career Awards grant (304,257/2021–4) from the Brazilian National Research Council (CNPq). S.M. was supported by FAPESP grant (13/07937–8). J.L.P.-M. was supported by FAPESP (2016/00194–8, 2020/04558–0), CNPq (305,628/2020–8) and “Fundo de Apoio ao Ensino, Pesquisa e Extensão” of UNICAMP (FAEPEX-UNICAMP 2266/20).
The following are the supplementary data related to this article.
Demographic and clinical parameters. Continuous data are reported as mean ± standard deviation or median (IQR). Categorical data are n (%). All were applied to the total number of individuals under lipidomic analysis (n = 13). SBP, systolic blood pressure; DBP, diastolic blood pressure; CPS, clinical progression scale; CPOD, chronic obstructive pulmonary disease; HIV, human immunodeficiency virus; ARB, angiotensin receptor blockers; ACEi, angiotensin-converting enzyme inhibitors; RT-PCR, real-time polymerase chain reaction; ALT, alanine aminotransferase; RRT, renal replacement therapy.
Lipid subclasses, number of identified species, and internal standards used for quantitative assessment. * Abbreviations: 1H and 2H (mono- and di-hexosyl), Cer (ceramide), PE (phosphatidylethanolamine), Sulf (sulfatide), FFA (free fatty acids), LPC and LPE (lysophosphatidyl-choline and ethanolamine), oPC and pPC (plasmanyl and plamenyl phosphatidylcholine), PC (phosphatidylcholine), oPE and pPE (plasmanyl and plamenyl phosphatidylethanolamine), PE (phosphatidylethanolamine), PI (phosphatidylinositol), SM (sphingomyelin), CE (cholesteryl ester), FC (free cholesterol), DG (diacylglycerol), Q-10 (coenzime Q10), VitE (vitamin E), TG (triacylglycerol).
Altered lipids in survivors and non-survivors. Significantly altered lipids displayed in Fig. 5 (paired t-test with fold-change >2).
Declaration of Competing Interest
Dr. Miguel Sáinz-Jaspeado works at Mercodia company (Mercodia AB, Uppsala, Sweden) as product Manager & Medical Science Liaison and, kindly provided the enzyme-linked immunoassay (ELISA) kits for oxidized low-density lipoprotein measures.
Acknowledgments
We thank Clarissa Jones for assisting with oxidized LDL kits from company Mercodia (Uppsala, Sweden).
Data availability
Data will be made available on request.
References
- 1.Mahat R.K., Rathore V., Singh N., Singh N., Singh S.K., Shah R.K., et al. Lipid profile as an indicator of COVID-19 severity: a systematic review and meta-analysis. Clin Nutr ESPEN. 2021;45:91–101. doi: 10.1016/j.clnesp.2021.07.023. [DOI] [PMC free article] [PubMed] [Google Scholar]
- 2.Rott D., Klempfner R., Goldenberg I., Leibowitz D. Cholesterol levels decrease soon after acute myocardial infarction. The Israel Med. Associat. J. IMAJ. 2015;17(6):370–373. [PubMed] [Google Scholar]
- 3.Cheng K.H., Chu C.S., Lin T.H., Lee K.T., Sheu S.H., Lai W.T. Lipid paradox in acute myocardial infarction-the association with 30-day in-hospital mortality. Crit. Care Med. 2015;43(6):1255–1264. doi: 10.1097/CCM.0000000000000946. [DOI] [PubMed] [Google Scholar]
- 4.Reddy V.S., Bui Q.T., Jacobs J.R., Begelman S.M., Miller D.P., French W.J., et al. Relationship between serum low-density lipoprotein cholesterol and in-hospital mortality following acute myocardial infarction (the lipid paradox) Am. J. Cardiol. 2015;115(5):557–562. doi: 10.1016/j.amjcard.2014.12.006. [DOI] [PubMed] [Google Scholar]
- 5.Acikgoz E., Acikgoz S.K., Yaman B., Kurtul A. Lower LDL-cholesterol levels associated with increased inflammatory burden in patients with acute ST-segment elevation myocardial infarction. Rev Assoc Med Bras(1992) 2021;67(2):224–229. doi: 10.1590/1806-9282.67.02.20200548. [DOI] [PubMed] [Google Scholar]
- 6.Khan J., Nordback I., Sand J. Serum lipid levels are associated with the severity of acute pancreatitis. Digestion. 2013;87(4):223–228. doi: 10.1159/000348438. [DOI] [PubMed] [Google Scholar]
- 7.Golucci A., Marson F.A.L., Ribeiro A.F., Nogueira R.J.N. Lipid profile associated with the systemic inflammatory response syndrome and sepsis in critically ill patients. Nutrition. 2018;55-56:7–14. doi: 10.1016/j.nut.2018.04.007. [DOI] [PubMed] [Google Scholar]
- 8.Sharma N.K., Ferreira B.L., Tashima A.K., Brunialti M.K.C., Torquato R.J.S., Bafi A., et al. Lipid metabolism impairment in patients with sepsis secondary to hospital acquired pneumonia, a proteomic analysis. Clin. Proteomics. 2019;16:29. doi: 10.1186/s12014-019-9252-2. [DOI] [PMC free article] [PubMed] [Google Scholar]
- 9.Zinellu A., Paliogiannis P., Fois A.G., Solidoro P., Carru C., Mangoni A.A. Cholesterol and triglyceride concentrations, COVID-19 severity, and mortality: a systematic review and Meta-analysis with Meta-regression. Front. Public Health. 2021;9 doi: 10.3389/fpubh.2021.705916. [DOI] [PMC free article] [PubMed] [Google Scholar]
- 10.Sorokin A.V., Karathanasis S.K., Yang Z.H., Freeman L., Kotani K., Remaley A.T. COVID-19—associated dyslipidemia: implications for mechanism of impaired resolution and novel therapeutic approaches. FASEB J. 2020;34(8):9843–9853. doi: 10.1096/fj.202001451. [DOI] [PMC free article] [PubMed] [Google Scholar]
- 11.Yan B., Chu H., Yang D., Sze K.H., Lai P.M., Yuan S., et al. Characterization of the Lipidomic profile of human coronavirus-infected cells: implications for lipid metabolism remodeling upon coronavirus replication. Viruses. 2019;11(1) doi: 10.3390/v11010073. [DOI] [PMC free article] [PubMed] [Google Scholar]
- 12.Qin C., Minghan H., Ziwen Z., Yukun L. Alteration of lipid profile and value of lipids in the prediction of the length of hospital stay in COVID-19 pneumonia patients. Food Sci. Nutrit. 2020;8(11):6144–6152. doi: 10.1002/fsn3.1907. [DOI] [PMC free article] [PubMed] [Google Scholar]
- 13.Fessler M.B., Summer R.S. Surfactant lipids at the host-environment Interface. Metabolic sensors, suppressors, and effectors of inflammatory lung disease. Am. J. Respir. Cell Mol. Biol. 2016;54(5):624–635. doi: 10.1165/rcmb.2016-0011PS. [DOI] [PMC free article] [PubMed] [Google Scholar]
- 14.Theken K.N., Tang S.Y., Sengupta S., FitzGerald G.A. The roles of lipids in SARS-CoV-2 viral replication and the host immune response. J. Lipid Res. 2021;62 doi: 10.1016/j.jlr.2021.100129. [DOI] [PMC free article] [PubMed] [Google Scholar]
- 15.Khovidhunkit W., Kim M.S., Memon R.A., Shigenaga J.K., Moser A.H., Feingold K.R., et al. Effects of infection and inflammation on lipid and lipoprotein metabolism: mechanisms and consequences to the host. J. Lipid Res. 2004;45(7):1169–1196. doi: 10.1194/jlr.R300019-JLR200. [DOI] [PubMed] [Google Scholar]
- 16.Davidson S.M., Lukhna K., Gorog D.A., Salama A.D., Castillo A.R., Giesz S., et al. RIC in COVID-19-a clinical trial to investigate whether remote ischemic conditioning (RIC) can prevent deterioration to critical Care in Patients with COVID-19. Cardiovasc. Drugs Ther. 2022 Oct;36(5):925–930. doi: 10.1007/s10557-021-07221-y. [DOI] [PMC free article] [PubMed] [Google Scholar]
- 17.Lukhna K., Do Carmo H.R.P., Castillo A.R., Davidson S.M., Geffen H., Giesz S., et al. Effect of remote ischaemic conditioning on the inflammatory cytokine cascade of COVID-19 (RIC in COVID-19): a randomized controlled trial. Cardiovasc. Drugs Ther. 2022 Nov 29;1–13 doi: 10.1007/s10557-022-07411-2. [DOI] [PMC free article] [PubMed] [Google Scholar]
- 18.Yoshinaga M.Y., Quintanilha B.J., Chaves-Filho A.B., Miyamoto S., Sampaio G.R., Rogero M.M. Postprandial plasma lipidome responses to a high-fat meal among healthy women. J. Nutr. Biochem. 2021;97 doi: 10.1016/j.jnutbio.2021.108809. [DOI] [PubMed] [Google Scholar]
- 19.Matyash V., Liebisch G., Kurzchalia T.V., Shevchenko A., Schwudke D. Lipid extraction by methyl-tert-butyl ether for high-throughput lipidomics. J. Lipid Res. 2008;49(5):1137–1146. doi: 10.1194/jlr.D700041-JLR200. [DOI] [PMC free article] [PubMed] [Google Scholar]
- 20.Xia J., Wishart D.S. Using MetaboAnalyst 3.0 for comprehensive metabolomics data analysis. Curr. Protoc. Bioinformatics. 2016;55 doi: 10.1002/cpbi.11. 14 0 1–0 91. [DOI] [PubMed] [Google Scholar]
- 21.Memon R.A., Staprans I., Noor M., Holleran W.M., Uchida Y., Moser A.H., et al. Infection and inflammation induce LDL oxidation in vivo. Arterioscler. Thromb. Vasc. Biol. 2000;20(6):1536–1542. doi: 10.1161/01.atv.20.6.1536. [DOI] [PubMed] [Google Scholar]
- 22.Pincemail J., Cavalier E., Charlier C., Cheramy-Bien J.P., Brevers E., Courtois A., et al. Oxidative stress status in COVID-19 patients hospitalized in intensive care unit for severe pneumonia. A pilot study. Antioxidants (Basel). 2021;10(2) doi: 10.3390/antiox10020257. [DOI] [PMC free article] [PubMed] [Google Scholar]
- 23.Muhammad Y., Kani Y.A., Iliya S., Muhammad J.B., Binji A., El-Fulaty Ahmad A., et al. Deficiency of antioxidants and increased oxidative stress in COVID-19 patients: a cross-sectional comparative study in Jigawa, Northwestern Nigeria. SAGE Open Med. 2021;9 doi: 10.1177/2050312121991246. 2050312121991246. [DOI] [PMC free article] [PubMed] [Google Scholar]
- 24.Mohiuddin M., Kasahara K. The emerging role of oxidative stress in complications of COVID-19 and potential therapeutic approach to diminish oxidative stress. Respir. Med. 2021;187 doi: 10.1016/j.rmed.2021.106605. [DOI] [PMC free article] [PubMed] [Google Scholar]
- 25.Codo A.C., Davanzo G.G., Monteiro L.B., de Souza G.F., Muraro S.P., Virgilio-da-Silva J.V., et al. Elevated glucose levels favor SARS-CoV-2 infection and monocyte response through a HIF-1alpha/glycolysis-dependent Axis. Cell Metab. 2020 Sep 1;32(3) doi: 10.1016/j.cmet.2020.07.015. 437-446.e5. [DOI] [PMC free article] [PubMed] [Google Scholar]
- 26.Huang Y.H., Schäfer-Elinder L., Wu R., Claesson H.E., Frostegård J. Lysophosphatidylcholine (LPC) induces proinflammatory cytokines by a platelet-activating factor (PAF) receptor-dependent mechanism. Clin. Exp. Immunol. 1999;116(2):326–331. doi: 10.1046/j.1365-2249.1999.00871.x. [DOI] [PMC free article] [PubMed] [Google Scholar]
- 27.Miller Y.I., Choi S.H., Wiesner P., Fang L., Harkewicz R., Hartvigsen K., et al. Oxidation-specific epitopes are danger-associated molecular patterns recognized by pattern recognition receptors of innate immunity. Circ. Res. 2011;108(2):235–248. doi: 10.1161/CIRCRESAHA.110.223875. [DOI] [PMC free article] [PubMed] [Google Scholar]
- 28.Silva I.T., Mello A.P., Damasceno N.R. Antioxidant and inflammatory aspects of lipoprotein-associated phospholipase a(2) (Lp-PLA(2)): a review. Lipids Health Dis. 2011;10:170. doi: 10.1186/1476-511X-10-170. [DOI] [PMC free article] [PubMed] [Google Scholar]
- 29.Liu P., Zhu W., Chen C., Yan B., Zhu L., Chen X., et al. The mechanisms of lysophosphatidylcholine in the development of diseases. Life Sci. 2020;247 doi: 10.1016/j.lfs.2020.117443. [DOI] [PubMed] [Google Scholar]
- 30.Shen C., Wang Z., Zhao F., Yang Y., Li J., Yuan J., et al. Treatment of 5 critically ill patients with COVID-19 with convalescent plasma. JAMA. 2020;323(16):1582–1589. doi: 10.1001/jama.2020.4783. [DOI] [PMC free article] [PubMed] [Google Scholar]
- 31.Wu F., Zhao S., Yu B., Chen Y.M., Wang W., Song Z.G., et al. A new coronavirus associated with human respiratory disease in China. Nature. 2020;579(7798):265–269. doi: 10.1038/s41586-020-2008-3. [DOI] [PMC free article] [PubMed] [Google Scholar]
- 32.Overmyer K.A., Shishkova E., Miller I.J., Balnis J., Bernstein M.N., Peters-Clarke T.M., et al. Large-scale multi-omic analysis of COVID-19 severity. Cell Syst. 2021;12(1):23–40 e7. doi: 10.1016/j.cels.2020.10.003. [DOI] [PMC free article] [PubMed] [Google Scholar]
- 33.Sindelar R., Nakanishi H., Stanford A.H., Colaizy T.T., Klein J.M. Respiratory management for extremely premature infants born at 22 to 23 weeks of gestation in proactive centers in Sweden, Japan, and USA. Semin. Perinatol. 2022;46(1) doi: 10.1016/j.semperi.2021.151540. [DOI] [PubMed] [Google Scholar]
- 34.Schwartz I.V.D., Randon D.N., Monsores N., Moura de Souza C.F., Horovitz D.D.G., Wilke M., et al. SARS-CoV-2 pandemic in the Brazilian community of rare diseases: a patient reported survey. Am. J. Med. Genet. C: Semin. Med. Genet. 2021;187(3):301–311. doi: 10.1002/ajmg.c.31883. [DOI] [PMC free article] [PubMed] [Google Scholar]
- 35.Fuller N., Rand R.P. The influence of lysolipids on the spontaneous curvature and bending elasticity of phospholipid membranes. Biophys. J. 2001;81(1):243–254. doi: 10.1016/S0006-3495(01)75695-0. [DOI] [PMC free article] [PubMed] [Google Scholar]
- 36.Boucher Y., Labbate M., Koenig J.E., Stokes H.W. Integrons: mobilizable platforms that promote genetic diversity in bacteria. Trends Microbiol. 2007;15(7):301–309. doi: 10.1016/j.tim.2007.05.004. [DOI] [PubMed] [Google Scholar]
- 37.Matsumoto T., Kobayashi T., Kamata K. Role of lysophosphatidylcholine (LPC) in atherosclerosis. Curr. Med. Chem. 2007;14(30):3209–3220. doi: 10.2174/092986707782793899. [DOI] [PubMed] [Google Scholar]
- 38.Schmitz G., Ruebsaamen K. Metabolism and atherogenic disease association of lysophosphatidylcholine. Atherosclerosis. 2010;208(1):10–18. doi: 10.1016/j.atherosclerosis.2009.05.029. [DOI] [PubMed] [Google Scholar]
- 39.Yea K., Kim J., Yoon J.H., Kwon T., Kim J.H., Lee B.D., et al. Lysophosphatidylcholine activates adipocyte glucose uptake and lowers blood glucose levels in murine models of diabetes. J. Biol. Chem. 2009;284(49):33833–33840. doi: 10.1074/jbc.M109.024869. [DOI] [PMC free article] [PubMed] [Google Scholar]
- 40.Kontush A. HDL and reverse remnant-cholesterol transport (RRT): relevance to cardiovascular disease. Trends Mol. Med. 2020;26(12):1086–1100. doi: 10.1016/j.molmed.2020.07.005. [DOI] [PubMed] [Google Scholar]
- 41.Ghini V., Meoni G., Pelagatti L., Celli T., Veneziani F., Petrucci F., et al. Profiling metabolites and lipoproteins in COMETA, an Italian cohort of COVID-19 patients. PLoS Pathog. 2022;18(4) doi: 10.1371/journal.ppat.1010443. [DOI] [PMC free article] [PubMed] [Google Scholar]
Associated Data
This section collects any data citations, data availability statements, or supplementary materials included in this article.
Supplementary Materials
Demographic and clinical parameters. Continuous data are reported as mean ± standard deviation or median (IQR). Categorical data are n (%). All were applied to the total number of individuals under lipidomic analysis (n = 13). SBP, systolic blood pressure; DBP, diastolic blood pressure; CPS, clinical progression scale; CPOD, chronic obstructive pulmonary disease; HIV, human immunodeficiency virus; ARB, angiotensin receptor blockers; ACEi, angiotensin-converting enzyme inhibitors; RT-PCR, real-time polymerase chain reaction; ALT, alanine aminotransferase; RRT, renal replacement therapy.
Lipid subclasses, number of identified species, and internal standards used for quantitative assessment. * Abbreviations: 1H and 2H (mono- and di-hexosyl), Cer (ceramide), PE (phosphatidylethanolamine), Sulf (sulfatide), FFA (free fatty acids), LPC and LPE (lysophosphatidyl-choline and ethanolamine), oPC and pPC (plasmanyl and plamenyl phosphatidylcholine), PC (phosphatidylcholine), oPE and pPE (plasmanyl and plamenyl phosphatidylethanolamine), PE (phosphatidylethanolamine), PI (phosphatidylinositol), SM (sphingomyelin), CE (cholesteryl ester), FC (free cholesterol), DG (diacylglycerol), Q-10 (coenzime Q10), VitE (vitamin E), TG (triacylglycerol).
Altered lipids in survivors and non-survivors. Significantly altered lipids displayed in Fig. 5 (paired t-test with fold-change >2).
Data Availability Statement
Data will be made available on request.