

Abstract
Background:
Peripheral inflammation is associated with increased risk for dementia. Neutrophil to lymphocyte ratio (NLR), red cell distribution width (RDW), and mean platelet volume (MPV), are easily measured circulating blood cell phenotypes reflecting chronic peripheral inflammation, but their association with dementia status is unclear.
Objective:
We sought to investigate the cross-sectional association of these inflammatory measures with neuropsychological (NP) test performance, and brain Magnetic Resonance Imaging (MRI) measures in the Framingham Heart Study (FHS) Offspring, Third-generation and Omni cohorts.
Methods:
We identified FHS participants who attended an exam that included a complete blood cell count (CBC) and underwent NP testing (n = 3396) or brain MRI (n = 2770) within five years of blood draw. We investigated the association between NLR, RDW, and MPV and NP test performance and structural MRI-derived volumetric measurements using linear mixed effect models accounting for family relationships and adjusting for potential confounders.
Results:
Participants were on average 60 years old, 53% female, and about 80% attended some college. Higher NLR was significantly associated with poorer performance on visual memory, and visuospatial abilities, as well as with larger white matter hyperintensity volume. We also observed associations for higher RDW with poorer executive function and smaller total cerebral brain volume.
Conclusions:
Chronic peripheral inflammation as measured by NLR and RDW was associated with worse cognitive function, reduced brain volume, and greater microvascular disease in FHS participants. If confirmed in other samples, CBC may provide informative and cost-effective biomarkers of abnormal brain aging in the community.
Keywords: Biomarkers, cognitive aging, complete blood count, inflammation
INTRODUCTION
Neuroinflammation is recognized as a key contributor to the pathogenesis of dementia, including Alzheimer’s disease (AD) dementia. Neuroinflammation can be induced by both central nervous system (CNS)-intrinsic factors and systemic factors outside the brain [1,2]. While it has been shown that chronic peripheral inflammation increases risk for AD dementia [3], it is becoming increasingly recognized that neuroinflammation includes a complex interplay of immune cells from both the innate and adaptive immune system [2,4]. The complete blood count (CBC) provides an easy, inexpensive way to measure neutrophils, reflecting innate immunity, and lymphocytes, reflecting adaptive immunity, in the peripheral circulation [5,6]. Additionally, the CBC provides mean platelet volume (MPV), a marker of platelet activation linked to pro-inflammatory processes[7,8] and red cell distribution width (RDW), a measure of red blood cell size heterogeneity linked to inflammation in persons with and without underlying infection and inflammatory disease [9–12].
Blood cell phenotypes reflective of peripheral inflammation, including the neutrophil to lymphocyte ratio (NLR), the RDW, and MPV, have been associated with dementia [13–15]. Case-control and cross-sectional studies have reported an association between an elevated NLR and cognitive impairment including from AD [16–18]. Higher NLR is also associated with higher white matter hyperintensity (WMH) volumes [19]. The RDW is associated with poor cognitive performance in middle-aged adults [14,15] as well as with larger periventricular WMH volumes and smaller bilateral hippocampal volumes (HPV) [20,21]. The MPV is positively correlated with mini-mental state examination (MMSE) score and is lower in patients with AD dementia as compared with patients with mild cognitive impairment (MCI) or healthy cognitively normal controls [7]. However, to understand the role of the immune system in risk for dementia, studies of the association of these blood cell markers to changes that occur earlier in the course of the disease are needed and the findings need further confirmation in larger studies conducted in community-based samples across a wide age range.
Our aim is to investigate the cross-sectional association between the NLR, RDW and MPV with cognitive function and Magnetic Resonance Imaging (MRI)-derived measures of brain volume and microvascular disease in the Framingham Heart Study (FHS). We hypothesized that the effect of peripheral inflammation on cognitive performance and brain MRI will differ between younger and older participants, with older participants showing stronger associations.
MATERIALS AND METHODS
Study Sample
The Framingham Heart Study is a community-based prospective cohort study that was launched in 1948, when the study first recruited 5209 participants as the Original cohort to investigate risk factors of cardiovascular disease (CVD) [22]. The Offspring cohort, recruited in 1971, consists of 5124 adults who have at least one parent in the Original cohort or Offspring spouses [23,24]. The Third Generation (the Gen 3 cohort), enrolled between 2002 and 2005, includes 4095 children of the Offspring cohort and has completed three exam visits [25]. In 1994 and 2003, the FHS added two multi-ethnic cohorts, respectively the Omni 1 cohort (n = 506, recruited in 1994, four examinations completed) and the Omni 2 cohort (n = 410, recruited in 2003, three examinations completed) [26]. All cohorts have received examinations once every 4–8 years. Offspring and Omni 1 cohort participants who attended the ninth and fourth examination respectively, and Gen 3 and Omni 2 cohort participants who attended exam 2 after 2009 provided a blood sample for a CBC were eligible for this study (n = 2541 Offspring/Omni 1, 2772 Gen 3/Omni 2). Details of the sample selection for NP and MRI study are provided below and in a flow chart in Figure 1. All participants provided written informed consent at each attended examination; FHS exams are reviewed by the Institutional Review Board at Boston University Medical Center.
Figure 1.

Study sample for the NP testing outcomes and the brain MRI measures outcomes. The blood draw sample was collected from the Offspring cohort examination 9, the Omni cohort examination 4 (2011 – 2014) and the Gen 3 cohort and Omni 2 cohort examination 2 (2008 – 2011). NP testing batteries were included if they were within five years and were the closest to the examination dates, with a range of time from 2006 to 2017. Brain MRI scans were also included if they were collected within five years and were the closest to the examination dates; date range for the MRI data are between 2006 and 2018. Participants with missing APOE genotype information and prevalent stroke at the examination were excluded. Additionally, for the MRI study, participants were excluded if a 3T or unknown strength scanner was used to obtain the imaging.
NP = neuropsychological; MRI = magnetic resonance imaging.
Circulating blood cell phenotypes
Starting in 2009, hematology testing, performed on a Beckman Coulter HmX hematology analyzer, was added to the routine laboratory tests performed in the FHS Research Center Laboratory. Measures of circulating blood cell phenotypes, including neutrophil counts, lymphocyte counts, RDW, and MPV, were measured from the CBC. We excluded 2 participants who had lymphocyte count ≥15 ×103/uL. For the remaining 5311 participants with CBC, the range of values in lymphocyte count, neutrophil counts, RDW, and MPV were 0.3–8.1 ×10³/uL, 0.2–20.9 ×10³/uL, 11.0–23.7 percent, and 5.6–13.6 fL, respectively. NLR, is calculated as the ratio of neutrophils to lymphocytes based on the absolute counts, with a range of value as 0.3–13.2.
Neuropsychological Tests
As part of an ancillary study, Offspring cohort participants who attended at least one examination between the fifth (1991–1995) and the seventh (1998–2001) examinations were invited to take a battery of NP tests, administered by a trained psychometrician using standard administration protocols [27]. The Omni 1, Gen 3, and Omni 2 cohort participants were also invited to take a NP test battery starting from 2000, 2007, and 2009, respectively. All FHS participants were invited to take follow-up NP tests, typically every five to six years, to help detect changes in their cognitive functioning [28]. NP testing batteries could be administered in English or Spanish. Participants who tested in Spanish all come from the Omni 1 or Omni 2 cohorts (n=70).
In this study, we identified 3527 participants from the Offspring, Omni 1, Gen 3, and Omni 2 cohorts who had a CBC sample described above along with a battery of NP tests within five years of the CBC blood draw; we excluded 109 participants due to prevalent chronic leukemia or lymphoma, or who were on immunosuppressants, systemic corticosteroids, or antineoplastic agents at the blood draw; of these, we also excluded 128 participants with missing APOE ε4 genotype, leaving a sample of 3290. We included eight NP tests from the NP battery which are representative of the following cognitive domains: verbal and visual episodic memory, attention and executive function, language, and visuospatial abilities (eTable 1). The Wechsler Memory Scale (WMS) Logical Memory-II, Paired Association learning, and Visual Reproduction, delayed recall components (LMD, PASD, and VRD) were used to assess verbal and visual episodic memory [29]. The attention and executive function domains were assessed using Trails Making Tests Parts A and B, Wechsler Adult Intelligence Scale Fourth Edition (WAIS-IV) Digit Symbol test (DS), and the Similarities (SIM) subtest from WAIS-IV [30–32]. The Hooper Visual Organization Test (HVOT) measured visuoperceptual skills, and the 30-item Boston Naming Test (BNT30) assessed language functions, specifically confrontation naming [33,34].
NP test scores from the Trails Making tests (combined as Trails B - Trails A [35], denoted as TRAILSBA) were recorded as time to finish the tests in minutes; whereas for other tests, scores represent total correct points earned. Therefore, higher values in the TRAILSBA score indicates poorer performance, whereas higher scores in all other tests reflect better performance. Scores from all NP tests included were inverse normal transformed so that they are normally distributed with a mean 0 and a standard deviation 1. Some participants received NP testing at several timepoints, which can lead to practice effects [36]. The distribution of testing instance (the NP battery included was the 1st, 2nd, 3rd, or 4th or greater) in our sample is in eTable20). In this sample, the NP test instance used was not the first NP test for 1703 out of 3290 (52%) participants. Therefore, we adjusted all analyses for an indicator “retest” of whether the NP battery was the first received by the participant.
General cognitive status for the Offspring and Omni cohorts has been monitored and assessed using the MMSE beginning with Offspring exam 5 (1991–1995) and the corresponding Omni exam. The MMSE was not administered to the Gen 3 and Omni 2 cohorts.
Brain Imaging
Brain MRI techniques used in the FHS have been reported in detail elsewhere [37–41]. Briefly, brain MRI images were obtained on a 1.5 Tesla Magnetom Siemens scanner using 3D T1-weighted coronal spoiled gradient-recalled echo acquisition for all participants and T2 fluid-attenuated inversion recovery (FLAIR) sequences with standard MRI parameters. All images were centrally read, blind to participants’ demographic and clinical characteristics. The segmentation and the protocols for quantifying total and regional brain volumes, as well as WMH volumes, have been described elsewhere [39,40,42]. Briefly, the segmentation of brain volumes is based on an Expectation-Maximization algorithm [43]. HPV is computed using a semi-automated multiatlas hippocampal segmentation algorithm [44]. The quantification of WMH is performed on a combination of FLAIR sequences and 3D T1 images using a modified Bayesian probability structure based on a previously published method of histogram fitting [45].
In this study, we identified 3000 participants from the four FHS cohorts who had a CBC and participated in brain MRI scan within five years of the blood draw. Of these, 84 participants were excluded due to prevalent stroke at the corresponding examination. We further excluded 17 participants who were not imaged on a 1.5-Tesla scanner, 75 participants due to prevalent chronic leukemia or lymphoma, or reported use of immunosuppressants, systemic corticosteroids, or antineoplastic agents at the blood draw, and 111 with missing APOE ε4, yielding a final sample of 2713 participants.
Our primary brain imaging outcomes included total cerebral brain volume (TCBV), HPV, and WMH. Neuroimaging markers for AD dementia include regional variation in structure and function of the brain. [46–52] We hypothesized that the role of inflammation in neuronal degeneration and vascular damage may have different regional gray matter associations, therefore, our secondary outcomes included cerebral gray matter volume (CGV), frontal gray matter volume (FGV), temporal gray matter volume (TGV), parietal gray matter volume (PGV), and occipital gray matter volume (OGV). Total and regional brain volumes included in the study were computed as percentage of total intracranial volume (TCV) to correct for differences in head size [38,43,45,53]. In addition, WMH was log transformed to normalize population variance.
Statistical Analysis
Associations of CBC phenotypes with Neuropsychological Testing Scores
For each individual NP test, we used a single linear mixed effect model to estimate the cross-sectional association between the three CBC phenotypes (NLR, RDW, MPV) simultaneously and the test score, adjusting for Model 1 covariates: age at NP test, sex, education level, cohort, time between blood draw and when the cognitive function measures were collected, prevalent CVD, C-reactive protein (CRP) level [54], APOE ε4 status, and a retest indicator. Correlations among the three CBC phenotypes were small (below 0.15). We accounted for correlation among related individuals using a random effect with the kinship matrix. We used a threshold of p ≤ 0.01 to present results. This threshold approximately accounts for the number of correlated neuropsychological test outcomes, as p<0.01 yields a family-wise error rate of ~0.05 for each CBC phenotype when using the p values adjusted for correlated tests (pACT) proposed by Conneely and Boehnke[55]. We hypothesized that the associations between NLR, RDW, and MPV with the performance in NP testing were different between younger participants versus older participants. Incident dementia studies typically exclude participants younger than 60 years of age [28], therefore we employed interaction terms between NLR, RDW, MPV and a cutoff at age of 60 years (i.e., age ≥ 60 years versus age < 60 years) to test for different effects in the two age groups. We reported separately on the two age subgroups if we observed significant differences.
We performed the following sensitivity analyses: 1) additional adjustment for CVD risk factors (Model 2), including all Model 1 covariates plus systolic and diastolic blood pressures (mmHg), treatment for hypertension, body-mass index (kg/m2), current smoking status, diabetes status, high density lipoprotein cholesterol levels (HDL, measured in mg/dL), and use of lipid-lowering agents all measured at the CBC blood draw exam, to understand if associations are mediated by (acting through) CVD risk factors; 2) removal of the adjustment for the APOE ε4 status variable (Model 3) on both the original study sample as well as an enlarged sample including participants with missing APOE genotype information (n = 3418); 3) exclusion of the 19 participants who had prevalent dementia at the blood draw; 4) exclusion of the 65 participants for which the NP test battery was conducted in Spanish; 5) exclusion of 155 participants with anemia, i.e. with hemoglobin and hematocrit below normal range (hemoglobin < 10.5 g/dl and hematocrit < 33% for female; hemoglobin < 12.6 g/dl and hematocrit < 37% for male) for analysis of RDW; 6) including an interaction term between CBC phenotypes and APOE ε4 status to test for differences between carriers and non-carriers.
Associations of CBC Phenotypes with Brain MRI Measures
For each individual brain MRI measure (TCBV, HPV, and WMH, as percentage of TCV to account for difference in head sizes), we tested the three CBC phenotypes (NLR, RDW, MPV) for association using a linear mixed effect model and Model 1 covariates (age at MRI scan, sex, education level, cohort, time between blood draw and when the MRI measures were collected, prevalent CVD, CRP level, and APOE ε4 status), accounting for familial correlation using a random effect of the kinship matrix. For MRI outcomes, age2 and an age-sex interaction term were also included in Model 1 due to evidence that the loss in brain volumes show quadratic patterns with aging and relatively more rapid age-related differences were observed for men than women, especially in total brain and temporal lobe volumes [38]. We employed interaction terms between NLR, RDW, MPV and a cutoff at age of 60 years (i.e., age ≥ 60 years versus age < 60 years) to test for different effects of the CBC measures on the MRI measures in the two age groups.
In secondary analyses, we investigated the association between the three CBC phenotypes and six gray matter volumes (CGV, FGV, OGV, PGV, and TGV, as percentage of TCV) adjusting for Model 1 covariates. The same sensitivity analyses as described for the NP test outcomes were performed for the MRI outcomes. We used a p ≤ 0.01 threshold for reporting to approximately account for multiple testing within the correlated MRI phenotypes. This threshold approximately controlled 0.05 family-wise error rate when accounting for the correlation among gray matter volumes using the pACT values.
Covariates
All covariates except APOE ε4 status was directly measured at the same FHS exam as the CBC blood draw. We previously demonstrated an association between CRP and AD dementia. [3] Therefore, we included CRP in the models because we hypothesized that we could identify associations not mediated through CRP. CRP is primarily produced by the liver and not secreted by the CBC phenotypes of interest. Education level was defined as a four-category variable (did not graduate high school; high school graduate; some college; college graduate). APOE genotypes were determined by utilizing the polymerase chain reaction and restriction isotyping.[56] APOE ε4 status was dichotomized into carrier (at least one APOE ε4 allele) versus non-carrier (0 APOE ε4 alleles). Prevalent cardiovascular disease was defined at the exam of the blood draw based on current or previous diagnosis of coronary heart disease (myocardial infarction, angina pectoris, coronary insufficiency), transient ischemic attack, intermittent claudication, congestive heart failure, and for the NP study stroke (cerebral embolism, intracerebral hemorrhage, subarachnoid hemorrhage, cerebrovascular accident).
For CVD risk factor covariates included in Model 2, presence of diabetes was determined if any of the following were satisfied: fasting blood glucose level of 126 mg/dL or higher, random blood glucose level of 200 mg/dL or higher or use of antidiabetic medications. Model 2 covariates were included to understand whether CBC phenotype associations are mediated by (acting through) CVD risk factors. All analyses were implemented using the lmekin function in the coxme package in R [57].
RESULTS
Participant characteristics
As shown in Figure 1, 3290 participants were included in the NP sample, and 2713 were included in the MRI sample, with 2697 participants contributing to both. Table 1 shows the participant demographics for the two samples. The NP and MRI samples have similar age, (60 vs 59 years), and prevalence of CVD (11% vs 9%). Mean and SD for the CBC measures were also similar in the two overlapping samples. For both study samples, the NP testing battery or brain MRI data included were measured on average 1 year after the CBC blood draw; and the mean percentage of APOE ε4 carriers in both samples was 23%. Average total score on the MMSE was 29 (SD = 2) for the Offspring and the Omni 1 cohort participants included in the NP and MRI study samples. MMSE was not administered to Gen 3 and Omni 2 participants.
Table 1.
Characteristics of the neuropsychological testing study sample and the MRI study sample.
| NP study sample | MRI study sample | |||
|---|---|---|---|---|
| Demographics | Age >= 60 (n=1732) | Total sample (n=3290) | Age >= 60 (n=1262) | Total sample (n=2713) |
| Age, years, mean (sd) | 71 (8) | 60 (14) | 71 (7) | 59 (14) |
| Female, n (%) | 944 (55%) | 1735 (53%) | 689 (55%) | 1427 (53%) |
| Attended, college n (%) | 1331 (77%) | 2648 (80%) | 900 (71%) | 2124 (78%) |
| Omni cohorts n (%) | 178 (10%) | 304 (9%) | 148 (12%) | 272 (10%) |
| NLR, mean (sd) | 2.6 (1.2) | 2.4 (1.1) | 2.5 (1.2) | 2.4 (1.1) |
| RDW, %, mean (sd) | 13.2 (1.0) | 13.0 (0.9) | 13.1 (0.9) | 13.0 (0.9) |
| MPV, fL, mean (sd) | 8.9 (1.0) | 8.7 (1.0) | 8.9 (1.0) | 8.7 (1.0) |
| Years from blood draw, mean (sd) | 1.0 (2.0) | 1.2 (1.7) | 1.2 (1.9) | 1.3 (1.6) |
| APOE ε4 carrier, n (%) | 406 (23%) | 763 (23%) | 299 (24%) | 638 (24%) |
| Prevalent CVD, n (%) | 188 (11%) | 212 (6%) | 112 (9%) | 130 (5%) |
| BMI, kg/m2, mean (sd) | 28 (5) | 28 (5) | 28 (5) | 28 (5) |
| SBP, mmHg, mean (sd) | 127 (16) | 122 (16) | 126 (16) | 121 (15) |
| DBP, mmHg, mean (sd) | 72 (10) | 73 (10) | 72 (10) | 74 (10) |
| HDL, mg/dL, mean (sd) | 62 (19) | 61 (19) | 62 (19) | 61 (19) |
| Current Smoking, n (%) | 77 (4%) | 232 (7%) | 56 (4%) | 196 (7%) |
| Diabetes, n (%) | 262 (15%) | 344 (10%) | 183 (15%) | 254 (9%) |
| Hypertension RX, n (%) | 964 (56%) | 1221 (37%) | 681 (54%) | 916 (34%) |
| LIPID RX, n (%) | 903 (52%) | 1159 (35%) | 648 (51%) | 882 (33%) |
| First NP test, n (%) | 267 (15%) | 1703 (52%) | -- | -- |
NLR = Neutrophil-to-lymphocyte ratio; RDW = red cell distribution width; MPV = mean platelet volume; CVD = cardiovascular disease; BMI = body mass index; SBP = systolic blood pressure; DBP = diastolic blood pressure; HDL = high-density lipoprotein cholesterol level; HRX = treatment for hypertension; LIPRX = use of lipid-lowering agents; NP = neuropsychological; MRI = magnetic resonance imaging.
Distribution of the NP testing scores, and the brain MRI measurements are summarized in the supplementary materials (eTable 2).
Associations of CBC Phenotypes with Neuropsychological Testing Scores
Table 2 shows the estimated effects, 95% confidence intervals, and the p-values of the associations of the three CBC phenotypes: NLR, RDW, and MPV for each of the eight NP test scores, adjusting for Model 1 covariates. eTable 18 summarizes the pACT values adjusting for the correlated NP tests for each CBC phenotype. An illustration of the estimated effect directions with p-values for which significant associations were observed are summarized in Figure 2.
Table 2.
Cross-sectional association of CBC phenotypes with Neuropsychological testing scores using linear mixed effect models. a
| Age >= 60 (n=1732) | Total sample (n=3290) | Age interaction | |||||||
|---|---|---|---|---|---|---|---|---|---|
| Domain | Test b | CBC measures | Effect | 95% CI | p-value c | Effect d | 95% CI | p-value | p-value |
| Verbal Memory | LMD | NLR | −0.010 | (−0.06, 0.04) | 0.62 | −0.019 | (−0.06, 0.02) | 0.22 | 0.74 |
| RDW | −0.010 | (−0.07, 0.05) | 0.67 | −0.010 | (−0.06, 0.04) | 0.61 | 0.38 | ||
| MPV | −0.005 | (−0.07, 0.06) | 0.83 | −0.021 | (−0.07, 0.02) | 0.23 | 0.43 | ||
| PASD | NLR | −0.001 | (−0.05, 0.04) | 0.96 | −0.003 | (−0.04, 0.03) | 0.83 | 0.70 | |
| RDW | −0.001 | (−0.06, 0.05) | 0.95 | −0.007 | (−0.05, 0.03) | 0.66 | 0.85 | ||
| MPV | −0.023 | (−0.08, 0.03) | 0.29 | −0.009 | (−0.05, 0.03) | 0.57 | 0.16 | ||
| Visual Memory | VRD | NLR | −0.042 | (−0.09, 0.01) | 0.023 | −0.041 | (−0.08, −0.01) | 0.0032 | 0.74 |
| RDW | −0.050 | (−0.11, 0.01) | 0.029 | −0.032 | (−0.08, 0.01) | 0.064 | 0.020 | ||
| MPV | 0.008 | (−0.05, 0.07) | 0.71 | −0.018 | (−0.06, 0.02) | 0.27 | 0.31 | ||
| Executive Function | TRAILSBA | NLR | 0.034 | (−0.02, 0.08) | 0.079 | 0.036 | (−0.00, 0.07) | 0.015 | 0.43 |
| RDW | 0.039 | (−0.02, 0.10) | 0.11 | -- | (−0.03, 0.07) | 0.35 | 0.0084 | ||
| MPV | −0.044 | (−0.10, 0.02) | 0.058 | −0.026 | (−0.07, 0.02) | 0.12 | 0.28 | ||
|
SIM |
NLR | −0.037 | (−0.09, 0.01) | 0.045 | −0.029 | (−0.07, 0.01) | 0.053 | 0.013 | |
| RDW | −0.021 | (−0.08, 0.04) | 0.35 | −0.028 | (−0.08, 0.02) | 0.13 | 0.24 | ||
| MPV | 0.019 | (−0.04, 0.08) | 0.39 | 0.010 | (−0.03, 0.05) | 0.54 | 0.74 | ||
| DS | NLR | −0.039 | (−0.09, 0.01) | 0.056 | −0.033 | (−0.07, 0.00) | 0.019 | 0.31 | |
| RDW | −0.060 | (−0.12, 0.00) | 0.015 | −0.055 | (−0.10, −0.01) | 0.0012 | 0.27 | ||
| MPV | −0.010 | (−0.07, 0.05) | 0.67 | 0.019 | (−0.02, 0.06) | 0.22 | 0.068 | ||
| Visuospatial | HVOT | NLR | −0.049 | (−0.10, 0.00) | 0.011 | −0.048 | (−0.09, −0.01) | 0.0012 | 0.12 |
| RDW | −0.030 | (−0.09, 0.03) | 0.22 | −0.023 | (−0.07, 0.03) | 0.23 | 0.27 | ||
| MPV | 0.035 | (−0.03, 0.10) | 0.14 | -- | (−0.06, 0.03) | 0.29 | 0.0038 | ||
| Language | BNT30 | NLR | −0.019 | (−0.06, 0.03) | 0.27 | −0.022 | (−0.06, 0.01) | 0.11 | 0.17 |
| RDW | 0.009 | (−0.05, 0.07) | 0.67 | 0.013 | (−0.03, 0.06) | 0.48 | 0.029 | ||
| MPV | 0.016 | (−0.04, 0.07) | 0.45 | −0.008 | (−0.05, 0.03) | 0.62 | 0.23 | ||
CBC = complet blood count; CI = confidence interval; NLR = Neutrophil-to-lymphocyte ratio; RDW = red cell distribution width; MPV = mean platelet volume; LMD = Logical Memory - delayed recall; PASD = Paired Association learning - delayed recall; VRD = Visual Reproduction - delayed recall; TRAILSBA = Trails Making test B - Trails Making test A; SIM = Similarities subtest; DS = Digit Symbol coding test; HVOT = Hooper Visual Organization Test; BNT30 = 30 - item Boston Naming Test.
Model 1 covariates (age, sex, education level, cohort, time between blood draw and when the cognitive functioning were collected, prevalent CVD, C-reactive protein level, and APOE ε4 status, and retest indicator) were included.
Inverse normal transformation was applied on all Neuropsychological test scores.
p ≤ 0.01threshold to approximately account for the number of correlated neuropsychological test outcomes tested for each CBC measure.
The effect in the total sample without age interaction terms were reported. When significant age interaction terms between two groups were identified, effect estimates for the total sample were not reported.
Figure 2.

Effect estimates (color) and unadjusted p-values (numbers) for the cross-sectional associations of CBC phenotypes with Neuropsychological testing scores. Each color block shows the estimated effect per standard deviation unit for each pair of associations investigated in the primary study adjusting for the covariates from Model 1. P-values are shown for associations where p ≤ 0.01. When the age interaction term is significant, the effect estimates for the total sample are hidden, and the p-values for associations in the age subgroups are also included.
CBC = complet blood count; CI = confidence interval; NLR = Neutrophil-to-lymphocyte ratio; RDW = red cell distribution width; MPV = mean platelet volume; LMD = Logical Memory – delayed recall; PASD = Paired Association learning – delayed recall; VRD = Visual Reproduction – delayed recall; TRAILSBA = Trails Making test B – Trails Making test A; SIM = Similarities subtest; DS = Digit Symbol coding test; HVOT = Hooper Visual Organization Test; BNT30 = 30 – item Boston Naming Test.
In the total sample, we observed significant associations for NLR with NP test performance in the visual memory and visuospatial domains. We also observed significant association between RDW and cognitive functioning in the attention and executive function domain (digit symbol test). Specifically, adjusting for covariates, RDW, and MPV, higher NLR is significantly associated with poorer performance in VRD test (p = 0.0032), and with a poorer score on the HVOT test (p = 0.0012). Similarly, we observed that higher RDW was associated with poorer performance on the digit symbol test (p = 0.0012) and visual memory (Table 2).
The age interaction terms indicated significantly different effects for the < 60 versus ≥ 60 age group participants for the association of RDW with Trails B - Trails A, and for the association of MPV with HVOT. Higher RDW was associated with longer Trails B - Trails A time (β = 0.039, p = 0.11) for participants in the ≥ 60 age group. For HVOT, higher MPV is significantly associated with lower score for the < 60 years of age group (β = −0.075, p = 0.0053, See eTable 3 for detail); whereas for age ≥ 60 group, the association between MPV and the HVOT score was in the opposite direction, but not significant (β = 0.035, p = 0.14).
Results from sensitivity analyses
For the NP test score outcomes, when adjusting for additional CVD risk factors (Model 2), the associations for the total sample became less significant, yet the effect estimates remained within 10% of the effects observed from the primary analysis (eTable 5). We observed the same pairs of associations and very similar effect estimates as the primary analyses on the full sample when removing the APOE ε4 status from the covariates (Model 3), for both the original study sample in the primary analyses (eTable 6), and an enlarged sample that included the 131 participants with no APOE genotype information (n = 3418, eTable 7). When focusing on the dementia-free subsample (n = 3271), results summarized in eTable 8 demonstrate that the association between NLR and VRD became less significant, with a similar effect size. In addition, the results were very similar to the primary analysis for the subsample who took their NP testing battery in English but not Spanish (n = 3225, eTable 9). When excluding participants with anemia, we observed that the association between higher RDW with lower score in the digit symbol test retained significance; however, the difference between younger adults versus older adults in RDW with Trail making test performance was no longer significant (n = 3135, eTable 10). Finally, associations between the CBC phenotypes and NP test scores were not significantly different between APOE ε4 carriers versus non-carriers (eTable 11).
Associations of CBC Phenotypes with Total Cerebral Brain Volume, Hippocampal Volume and White Matter Hyperintensity Brain MRI Measures
Table 3 shows the estimated effects, 95% confidence intervals, and the p-values of the three CBC phenotypes on the three primary brain MRI measures: TCBV, HPV, and WMH. Figure 3 shows the estimated effect directions; p-values for significant associations are labeled.
Table 3.
Cross-sectional association of CBC phenotypes with brain MRI measures using linear mixed effect models. a
| Age >= 60 (n=1262) | Total sample (n=2713) | |||||||
|---|---|---|---|---|---|---|---|---|
| brain MRI measures b | CBC measures | Effect | 95% CI | p-value c | Effect d | 95% CI | p-value | |
| Primary outcomes | TCBV | NLR | −0.063 | (−0.18, 0.05) | 0.16 | −0.052 | (−0.14, 0.03) | 0.11 |
| RDW | −0.135 | (−0.28, 0.01) | 0.014 | −0.131 | (−0.23, −0.03) | 0.00098 | ||
| MPV | 0.113 | (−0.03, 0.25) | 0.035 | 0.069 | (−0.02, 0.16) | 0.058 | ||
| HPV | NLR | −0.000 | (−0.00, 0.00) | 0.71 | −0.000 | (−0.00, 0.00) | 0.71 | |
| RDW | −0.003 | (−0.01, 0.00) | 0.016 | −0.002 | (−0.01, 0.00) | 0.045 | ||
| MPV | 0.001 | (−0.00, 0.00) | 0.59 | 0.001 | (−0.00, 0.00) | 0.24 | ||
| WMH | NLR | 0.061 | (−0.01, 0.13) | 0.020 | 0.056 | (0.01, 0.10) | 0.0024 | |
| RDW | 0.059 | (−0.02, 0.14) | 0.058 | 0.018 | (−0.04, 0.08) | 0.43 | ||
| MPV | −0.017 | (−0.09, 0.06) | 0.57 | −0.030 | (−0.08, 0.02) | 0.14 | ||
| Secondary outcomes | CGV | NLR | −0.145 | (−0.25, −0.04) | 0.00030 | −0.143 | (−0.21, −0.07) | 0.0000003 |
| RDW | −0.125 | (−0.25, 0.00) | 0.011 | −0.133 | (−0.22, −0.04) | 0.00011 | ||
| MPV | 0.056 | (−0.07, 0.18) | 0.24 | 0.049 | (−0.03, 0.13) | 0.12 | ||
| FGV | NLR | −0.052 | (−0.10, −0.01) | 0.0047 | −0.058 | (−0.09, −0.02) | 0.000012 | |
| RDW | −0.034 | (−0.09, 0.02) | 0.13 | −0.037 | (−0.08, 0.01) | 0.024 | ||
| MPV | 0.011 | (−0.05, 0.07) | 0.63 | 0.019 | (−0.02, 0.06) | 0.21 | ||
| OGV | NLR | −0.022 | (−0.05, 0.00) | 0.032 | −0.026 | (−0.04, −0.01) | 0.00077 | |
| RDW | −0.014 | (−0.05, 0.02) | 0.27 | −0.020 | (−0.04, 0.00) | 0.036 | ||
| MPV | 0.022 | (−0.01, 0.05) | 0.079 | 0.014 | (−0.01, 0.04) | 0.100 | ||
| PGV | NLR | −0.047 | (−0.08, −0.02) | 0.000058 | −0.031 | (−0.05, −0.01) | 0.00020 | |
| RDW | −0.053 | (−0.09, −0.02) | 0.00019 | −0.043 | (−0.07, −0.02) | 0.000038 | ||
| MPV | 0.003 | (−0.03, 0.04) | 0.83 | 0.002 | (−0.02, 0.03) | 0.81 | ||
| TGV | NLR | −0.030 | (−0.07, 0.01) | 0.030 | −0.030 | (−0.06, −0.01) | 0.0013 | |
| RDW | −0.037 | (−0.08, 0.01) | 0.027 | −0.044 | (−0.07, −0.01) | 0.00018 | ||
| MPV | 0.030 | (−0.01, 0.07) | 0.064 | 0.023 | (−0.00, 0.05) | 0.030 | ||
CBC = complete blood count; CI = confidence interval; NLR = Neutrophil-to-lymphocyte ratio; RDW = red cell distribution width; MPV = mean platelet volume; TCBV = total cerebral brain volume; TCV = total intracranial volume; HPV = hippocampal volume; WMH = white matter hyperintensity; CGV = cerebrum gray matter volume; FGV = frontal gray matter volume; OGV = occipital gray matter volume; PGV = parietal gray matter volume; TGV = temporal gray matter volume; MRI = magnetic resonance imaging.
Model 1 covariates (age, age2, sex, ager-sex interaction, education level, cohort, time between blood draw and when the MRI measures were collected, prevalent CVD, C-reactive protein level, and APOE ε4 status) were included.
All brain MRI measures were computed as percentage of total intracranial volume. WMH was further log transformed.
p ≤ 0.01threshold to approximately account for multiple testing within the correlated MRI phenotypes.
The models for the age ≥ 60 (n=1313) subgroup and the total sample (n=2770) were fitted separately. The effect in the total sample without age interaction terms were reported. No age interaction is significant, so were not presented.
Figure 3.
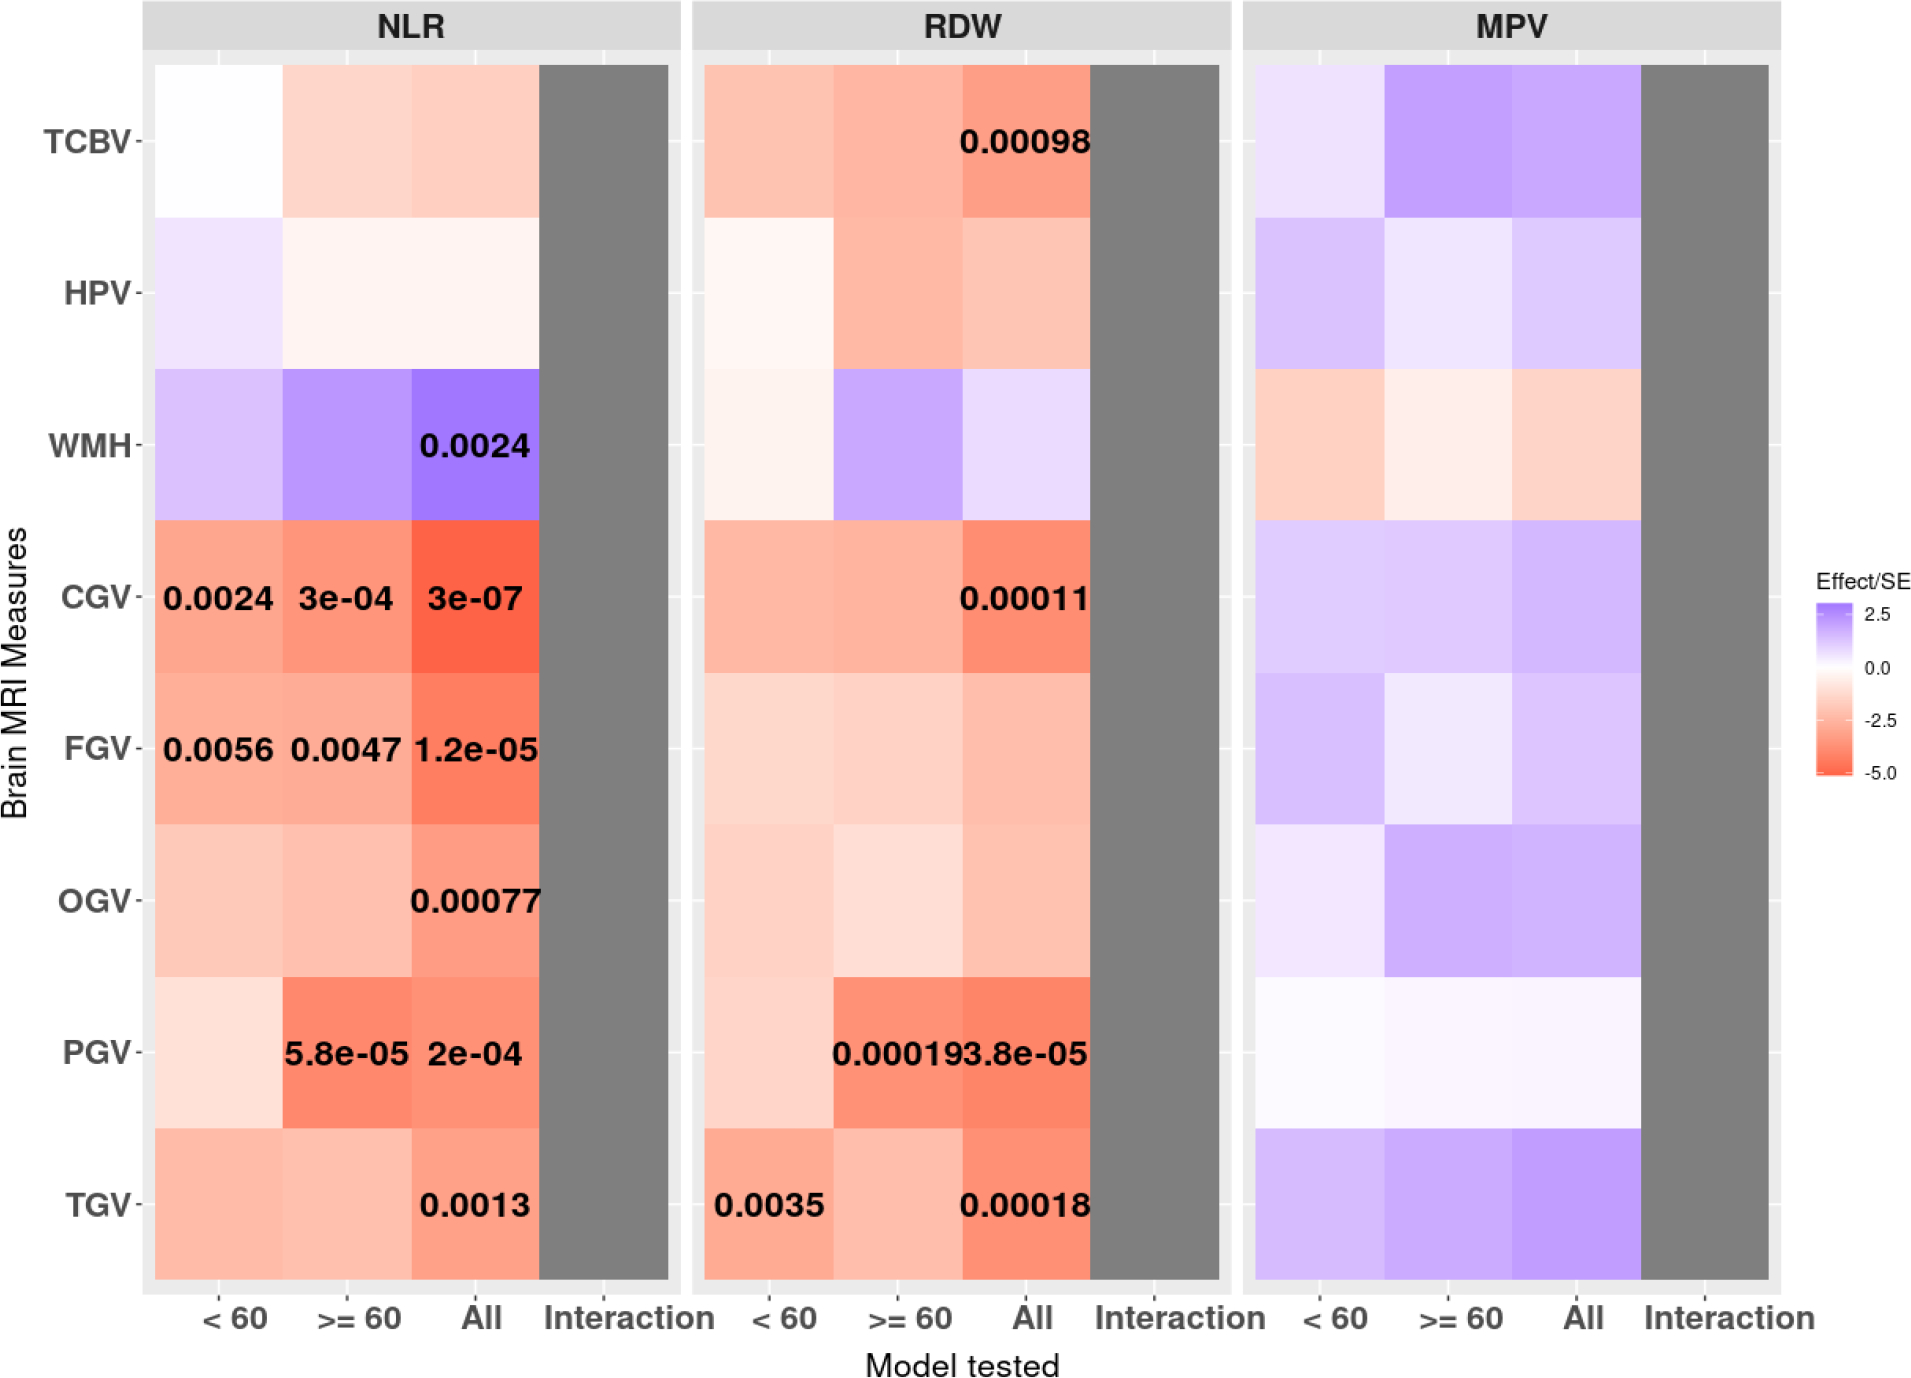
Effect estimates(color) and unadjusted p-values (numbers) for the cross-sectional association of CBC phenotypes with brain MRI measures. Each color block shows the estimated effect per standard deviation unit for each pair of associations investigated in the primary study, adjusting for the covariates from Model 1. P-values are shown for associations where p ≤ 0.01). The age interaction was not significant for any test.
CBC = complete blood count; CI = confidence interval; NLR = Neutrophil-to-lymphocyte ratio; RDW = red cell distribution width; MPV = mean platelet volume; TCBV = total cerebral brain volume; TCV = total intracranial volume; HPV = hippocampal volume; WMH = white matter hyperintensity; CGV = cerebrum gray matter volume; FGV = frontal gray matter volume; OGV = occipital gray matter volume; PGV = parietal gray matter volume; TGV = temporal gray matter volume; MRI = magnetic resonance imaging.
In the total sample, significant associations were observed between RDW and TCBV, and between NLR and WMH. Specifically, adjusting for covariates, NLR, and MPV, higher RDW was significantly associated with smaller total brain volumes (p = 0.00098). Similarly, we observed that holding Model 1 covariates, RDW, and MPV constant, higher NLR was significantly associated with higher WMH volumes (p = 0.0024). The differences in effect sizes of the CBC phenotypes with TCBV, HPV, and WMH between the two age groups (< 60 versus ≥ 60 years of age) were not significant. (eTable 4).
Results from sensitivity analyses
For the brain MRI measure primary outcomes, with adjustment for additional CVD risk factors (Model 2), significance of both pairs of association (higher NLR with larger WMH, and higher RDW with smaller TCBV) remained with similar effect size0073 (eTable 12). Removal of the APOE ε4 status covariate (Model 3) resulted in the same pairs of associations for both the original study sample (eTable 13) and the enlarged sample that included 111 participants with missing APOE genotype information (n = 2824, eTable 14). Similar results were observed on the sensitivity analysis by excluding 4 participants who had prevalent dementia at the blood draw (eTable 15). After excluding participants with anemia (eTable 16), the same associations between CBC phenotypes and brain imaging phenotypes remained. Finally, we did not observe significantly different effects between APOE ε4 carriers and non-carriers for the cross-sectional association of CBC phenotypes and the brain volumes (eTable 17).
Associations of CBC Phenotypes with Brain MRI Gray Matter Volume measures
We observed significant associations between NLR and all five gray matter volumes, as well as for RDW with CGV, PGV, and TGV, in the total sample. Specifically, while adjusting for covariates, RDW, and MPV, higher NLR is significantly associated with smaller CGV, FGV, OGV, PGV, and TGV. Similarly, significant association between higher RDW and smaller PGV, and TGV were also observed. The effect estimates, 95% confidence intervals, and the p-values are summarized in Table 3. eTable 19 summarizes the pACT that accounted for the correlated gray matter volumes for each CBC phenotype. Estimated effect directions and p-values for significant associations are also illustrated in Figure 3.
We did not observe significantly different effects for the < 60 versus ≥ 60 age group participants for the association of CBC phenotypes with the gray matter volumes (all age interaction p>0.01). However, we observed a trend toward larger effect sizes and higher significance of findings in the older age group (age ≥ 60 years) compared to the younger age group (eTable 4).
DISCUSSION
In our cross-sectional investigation of the association of NLR, RDW, and MPV with NP test performance and structural MRI-derived volumetric indices in a large community-based cohort of adults across a wide age range, we observed several key findings. First, a higher NLR and RDW were associated with poorer performance on neuropsychological tests of episodic memory, executive function, and visuospatial abilities. Second, elevated NLR and RDW were also associated with smaller total and regional brain volumes and greater burden of WMH, with a trend toward stronger effects in participants 60 years and older. Higher RDW also trended toward association with smaller hippocampal volume in participants in the older age group. Our findings were robust to adjustment for important covariates including prevalent CVD, measures of inflammation (CRP) and APOE ε4 carrier status and were not significantly different in APOE ε4 carriers compared to non-carriers. Finally, the MPV was related to visuospatial ability differently for participants in the ≥ 60 versus < 60 years age groups. Higher MPV was significantly associated with poorer performance in the visuospatial domain in younger participants, whereas MPV was not significantly associated with visuospatial performance in older participants. Overall, our findings support peripheral inflammation as measured by NLR, RDW and MPV as associated with cognitive and brain aging in the FHS cohort. While these data are cross-sectional and do not infer causality, they show a link between measures of peripheral inflammation and brain aging. Further studies examining the trajectory of CBC measures with incident dementia are needed to explore the possibility that increases in these markers of peripheral inflammation over time may provide an early, inexpensive indicator that more in-depth cognitive testing may be warranted.
In the Rotterdam Study, a higher granulocyte count (proxy for the neutrophil count) was associated with increased dementia risk, and a higher lymphocyte count was associated with a lower dementia risk, while the granulocyte to lymphocyte ratio (GLR) was associated with an increased risk for all cause dementia [58]. These CBC measures also associated with blood-based biomarkers of AD: higher GLR was associated with higher Aβ42 and Aβ40, lower Aβ42/40 ratio, and higher neurofilament light chain [59]. Further, a higher genetic predisposition to AD was associated with higher GLR [59]. Among persons with mild AD, neutrophil related inflammatory factors associate with declines in executive function.[60] Here, we have extended the investigation of readily available inexpensive blood-based biomarkers to a comprehensive battery of neuropsychological measures that can identify the cognitive impairment that precedes dementia. The NLR in the FHS cohorts was associated with visuospatial performance, a measure that was shown in the Baltimore Longitudinal Study of Aging to be the earliest to change in rates of decline at 15 years prior to AD diagnosis [61]. Furthermore, the NLR also associates with the memory domain known to be a key feature of AD. Visual memory is reported to be largely preserved compared with verbal learning and memory in mild cognitive impairment and mild AD, making it important to include cognitive testing that captures different aspects of memory processes in assessing patients for AD [62]. Our work adds to the growing body of evidence that supports a role of the immune system and peripheral inflammation in the pathogenesis of dementia.
Vascular disease occurs in up to 80% of people with MCI and dementia including those with AD pathology [63]. Considerable evidence suggests that risk factors for CVD also incur risk for dementia, including AD [64,65]. Chronic inflammation contributes to vascular disease, and the NLR is associated with atherosclerosis and subclinical measures of cerebrovascular disease [19,66]. WMH is a neuroimaging marker of subclinical vascular brain injury reflecting microvascular disease. We observed an association between a higher NLR and higher WMH volumes, which was diminished after adjustment for CVD risk factors. A recent report used a large, harmonized brain MRI database that included over 10,000 subjects and found that high WMH volumes was associated with increased likelihood of amyloid beta (Aβ) in older adults [67]. In that report, WMH predicted cognition better than age in individuals with mild cognitive impairment and AD [67].
In the community dwelling older adult participants of the Chicago Health and Aging Project, higher RDW increased the odds of prevalent dementia and prevalent AD, especially in older adults free of anemia [68]. The RDW was also associated with cognitive performance and brain imaging markers of preclinical disease. Among middle-aged urban adults, a higher RDW was associated with poorer verbal memory and attention, [14] and with higher WMH volumes[21,69] and smaller regional brain volumes including smaller hippocampal volume [21]. Our work confirms and extends these findings using a large community sample across a wide age range. We observed an association between higher RDW and poorer cognitive performance in executive function domain as well as smaller brain volumes. Higher RDW is associated with inflammation in persons with underlying infection and inflammatory illness and may reflect the role of inflammation in neurodegeneration.[70] Recent work using a Mendelian Randomization approach suggests the relation between RDW and measures of cognitive performance to be causal [71]. If confirmed, measures to reverse increases in RDW and other red cell parameters may have preventive implications.
Platelets have been proposed to represent a promising circulating biomarker to detect molecular changes related to AD as they share many biochemical similarities with neurons and platelet physiology includes an inflammatory component [72]. While platelet count and MPV are inversely associated, MPV has been reported to associate with vascular dementia and AD[7,8] while platelet count does not. This is most likely because homeostasis maintains the relative number of circulating platelets but size, an indication of the age and activation of the platelet, which is reflected in the MPV, varies with inflammatory processes. MPV is a measure of the size of the platelets, with larger platelets being “young” and recently released from the bone marrow, while smaller platelets are “old”. Low MPV may indicate loss of bone marrow platelet production, while high MPV may indicate excessive use of platelets causing increased platelet release from the bone marrow. MPV associates in cross-sectional studies with cognitive screening tests and AD [7]. Interestingly among the younger participants (age < 60 years) in our study, we identified an association with the visuospatial domain, a domain known to be impacted early in the disease process.
This study is strengthened by using the FHS, a community-based sample in which cognitive functioning was well characterized with a wide array of NP tests relative to other cohorts, as well as the use of quantitative MRI techniques. All covariates and potential confounders specified in our analysis, such as prevalent CVD and C reactive protein levels, were directly measured or validated with medical records in the FHS. In addition, we were able to include APOE genotype and used analytical methods to account for familial correlation between participants from the FHS. There are also several limitations of this study. NP testing and brain MRI did not occur on the same day as the blood draw for CBC, which may result in higher variability of our estimates. However, we included an indicator of the time between blood draw and assessment of neurological outcomes in our models. In addition, only cross-sectional associations were investigated, hence directionality or causality cannot be inferred. The NLR was measured at a single time point and therefore does not entirely reflect the complexity of the immune system. The NLR is influenced by many factors including age, race, medication, chronic disease and stress. However, the NLR has proven useful for diagnosis/stratification of systemic infection, sepsis, bacteremia as well as its robust predictive and prognostic value, when measured over time.[73] There are factors that influence RDW (nutritional deficiency including iron, folate and B12 deficiency, telomere length) and that result in high neutrophil counts (bacterial infection, excessive exercise, and stress) and low lymphocytes counts (HIV) that we did not consider in our analyses. Hence, we cannot rule out residual confounding. However, associations with RDW persisted when we removed participants with anemia. Due to limited follow up time after the blood draw, incident dementia was not examined. Finally, although we included the more diverse FHS Omni cohort participants, our sample is ~90% white; therefore, the results may not be generalizable to persons of other race or ethnic backgrounds.
This cross-sectional study conducted in a large community-based sample suggests an association between easily measured blood cell markers of immunity and inflammation with preclinical measures of dementia derived from cognitive testing and brain imaging. The NLR and RDW relate to the memory, executive function, and visuospatial cognitive testing domains, as well as global and regional MRI markers of brain atrophy and WMH burden. Further confirmation of our findings in diverse samples is needed along with investigation of the associations of these CBC phenotypes with incident dementia, and with longitudinal change in cognitive function and MRI markers of abnormal brain aging to inform on the usefulness of these blood-based biomarkers over the course of the disease.
Supplementary Material
ACKNOWLEDGEMENT
This work was supported by the National Heart, Lung, and Blood Institute and the Boston University School of Medicine, Framingham Heart Study (contract number 75N92019D00031); and by the National Institute of Aging (grant number R01AG067457, U19AG068753, P30AG072978); and National Institutes of Neurological Disorders and Stroke (grant number K23NS102399). The Neuropsychological testing data and brain MRI data were collected with funding from the National Institutes of Aging and Neurological Disorders and Stroke grants (grant number R01AG016495, R01AG008122, R01AG033040, R01AG054076, R01AG049607, R01AG033193, and R01NS017950).
The authors thank the Framingham Heart Study participants, as well as the study team for their contributions.
Footnotes
CONFLICT OF INTEREST
The authors have no conflict of interest to report.
REFERENCES
- [1].Heppner FL, Ransohoff RM, Becher B (2015) Immune attack: the role of inflammation in Alzheimer disease. Nature Reviews Neuroscience 2015 16:6 16, 358–372. [DOI] [PubMed] [Google Scholar]
- [2].Schwartz M, Deczkowska A (2016) Neurological Disease as a Failure of Brain–Immune Crosstalk: The Multiple Faces of Neuroinflammation. Trends in Immunology 37, 668–679. [DOI] [PubMed] [Google Scholar]
- [3].Tao Q, Ang TFA, DeCarli C, Auerbach SH, Devine S, Stein TD, Zhang X, Massaro J, Au R, Qiu WQ (2018) Association of Chronic Low-grade Inflammation With Risk of Alzheimer Disease in ApoE4 Carriers. JAMA Network Open 1, e183597–e183597. [DOI] [PMC free article] [PubMed] [Google Scholar]
- [4].Le Page A, Dupuis G, Frost EH, Larbi A, Pawelec G, Witkowski JM, Fulop T (2018) Role of the peripheral innate immune system in the development of Alzheimer’s disease. Experimental Gerontology 107, 59–66. [DOI] [PubMed] [Google Scholar]
- [5].Iwasaki A, Medzhitov R (2010) Regulation of adaptive immunity by the innate immune system. Science 327, 291–295. [DOI] [PMC free article] [PubMed] [Google Scholar]
- [6].Elzey BD, Sprague DL, Ratliff TL (2005) The emerging role of platelets in adaptive immunity. Cellular Immunology 238, 1–9. [DOI] [PubMed] [Google Scholar]
- [7].tao Wang R, Jin D, Li Y, cheng Liang Q (2013) Decreased mean platelet volume and platelet distribution width are associated with mild cognitive impairment and Alzheimer’s disease. Journal of Psychiatric Research 47, 644–649. [DOI] [PubMed] [Google Scholar]
- [8].Liang QC, Jin D, Li Y, Wang RT (2014) Mean platelet volume and platelet distribution width in vascular dementia and Alzheimer’s disease. http://dx.doi.org/103109/095371042013831064 25, 433–438. [DOI] [PubMed] [Google Scholar]
- [9].Salvagno GL, Sanchis-Gomar F, Picanza A, Lippi G (2015) Red blood cell distribution width: A simple parameter with multiple clinical applications. Critical Reviews in Clinical Laboratory Sciences 52, 86–105. [DOI] [PubMed] [Google Scholar]
- [10].Horta-Baas G, Romero-Figueroa M del S (2019) Clinical utility of red blood cell distribution width in inflammatory and non-inflammatory joint diseases. International Journal of Rheumatic Diseases 22, 47–54. [DOI] [PubMed] [Google Scholar]
- [11].Zhang Z, Chew GM, Shikuma CM, Gangcuangco LMA, Souza SA, Shiramizu B, Nakamoto BK, Gong T, Mannem SR, Mitchell BI, Kallianpur KJ, Ndhlovu LC, Chow DC (2018) Red blood cell distribution width as an easily measurable biomarker of persistent inflammation and T cell dysregulation in antiretrovirally treated HIV-infected adults. HIV clinical trials 19, 172. [DOI] [PMC free article] [PubMed] [Google Scholar]
- [12].Hornick A, Tashtish N, Osnard M, Shah B, Bradigan A, Albar Z, Tomalka J, Dalton J, Sharma A, Sekaly RP, Hejal R, Simon DI, Zidar DA, Al-Kindi SG (2020) Anisocytosis is Associated With Short-Term Mortality in COVID-19 and May Reflect Proinflammatory Signature in Uninfected Ambulatory Adults. Pathogens and Immunity 5, 312. [DOI] [PMC free article] [PubMed] [Google Scholar]
- [13].Sayed A, Bahbah EI, Kamel S, Barreto GE, Ashraf GM, Elfil M (2020) The neutrophil-to-lymphocyte ratio in Alzheimer’s disease: Current understanding and potential applications. Journal of Neuroimmunology 349, 577398. [DOI] [PubMed] [Google Scholar]
- [14].Beydoun MA, Hossain S, Beydoun HA, Shaked D, Weiss J, Evans MK, Zonderman AB (2020) Red Cell Distribution Width Is Directly Associated with Poor Cognitive Performance among Nonanemic, Middle-Aged, Urban Adults. The Journal of Nutrition 150, 128–139. [DOI] [PMC free article] [PubMed] [Google Scholar]
- [15].Dagistan E, Cosgun Z (2019) Could hemogram parameters be predictors of dementia in elderly patients? The Aging Male 22, 192–197. [DOI] [PubMed] [Google Scholar]
- [16].An P, Zhou X, Du Y, Zhao J, Song A, Liu H, Ma F, Huang G (2020) Association of Neutrophil-Lymphocyte Ratio with Mild Cognitive Impairment in Elderly Chinese Adults: A Case-control Study. Current Alzheimer Research 16, 1309–1315. [DOI] [PubMed] [Google Scholar]
- [17].Kuyumcu ME, Yesil Y, Oztürk ZA, Kizilarslanoğlu C, Etgül S, Halil M, Ulger Z, Cankurtaran M, Arıoğul S (2012) The Evaluation of Neutrophil-Lymphocyte Ratio in Alzheimer’s Disease. Dementia and Geriatric Cognitive Disorders 34, 69–74. [DOI] [PubMed] [Google Scholar]
- [18].Liu JH, Zhang YJ, Ma QH, Sun HP, Xu Y, Pan CW (2020) Elevated blood neutrophil to lymphocyte ratio in older adults with cognitive impairment. Archives of Gerontology and Geriatrics 88, 104041. [DOI] [PubMed] [Google Scholar]
- [19].Nam K-W, Kwon H-M, Jeong H-Y, Park J-H, Kim SH, Jeong S-M, Yoo TG, Kim S (2017) High neutrophil to lymphocyte ratio is associated with white matter hyperintensity in a healthy population. Journal of the Neurological Sciences 380, 128–131. [DOI] [PubMed] [Google Scholar]
- [20].Wang M, Feng H, Zhang S, Luo Z, Liang Y, Xu Y, Mei B, Kong Z, Liu Y (2020) Association between red blood cell distribution width and white matter hyperintensities: A large-scale cross-sectional study. Brain and Behavior 10, e01739. [DOI] [PMC free article] [PubMed] [Google Scholar]
- [21].Beydoun MA, Hossain S, MacIver PH, Srinivasan D, Beydoun HA, Maldonado AI, Katzel LI, Davatzikos C, Gullapalli RP, Seliger SL, Erus G, Evans MK, Zonderman AB, Waldstein SR (2021) Red Cell Distribution Width, Anemia, and Brain Volumetric Outcomes Among Middle-Aged Adults. Journal of Alzheimer’s Disease 81, 711–727. [DOI] [PMC free article] [PubMed] [Google Scholar]
- [22].Dawber T, Kannel W (1966) The Framingham study. An epidemiological approach to coronary heart disease. Circulation 34, 553–555. [DOI] [PubMed] [Google Scholar]
- [23].Feinleib M, Kannel WB, Garrison RJ, McNamara PM, Castelli WP (1975) The framingham offspring study. Design and preliminary data. Preventive Medicine 4, 518–525. [DOI] [PubMed] [Google Scholar]
- [24].Kannel WB, Feinleib M, McNamara Patricia M, Garrison RJ, Castelli WP (1979) An investigation of coronary heart disease in families: the Framingham Offspring Study. American Journal of Epidemiology 110, 281–290. [DOI] [PubMed] [Google Scholar]
- [25].Splansky GL, Corey D, Yang Q, Atwood LD, Cupples LA, Benjamin EJ, D’Agostino RB, Fox CS, Larson MG, Murabito JM, O’Donnell CJ, Vasan RS, Wolf PA, Levy D (2007) The Third Generation Cohort of the National Heart, Lung, and Blood Institute’s Framingham Heart Study: Design, Recruitment, and Initial Examination. American Journal of Epidemiology 165, 1328–1335. [DOI] [PubMed] [Google Scholar]
- [26].Tsao CW, Vasan RS (2015) Cohort Profile: The Framingham Heart Study (FHS): overview of milestones in cardiovascular epidemiology. International Journal of Epidemiology 44, 1800–1813. [DOI] [PMC free article] [PubMed] [Google Scholar]
- [27].Au R, Seshadri S, Wolf PA, Elias MF, Elias PK, Sullivan L, Beiser A, D’Agostino RB (2010) New Norms for a New Generation: Cognitive Performance in the Framingham Offspring Cohort. Experimental Ageing Research 30, 333–358. [DOI] [PubMed] [Google Scholar]
- [28].Satizabal CL, Beiser AS, Chouraki V, Chêne G, Dufouil C, Seshadri S (2016) Incidence of Dementia over Three Decades in the Framingham Heart Study. New England Journal of Medicine 374, 523–532. [DOI] [PMC free article] [PubMed] [Google Scholar]
- [29].Wechsler DLB (1945) Wechsler memory scale.
- [30].Crowe SF (1998) The Differential Contribution of Mental Tracking, Cognitive Flexibility, Visual Search, and Motor Speed to Performance on Parts A and B of the Trail Making Test. J Clin Psychol 54, 585–591. [DOI] [PubMed] [Google Scholar]
- [31].Tombaugh TN (2004) Trail Making Test A and B: Normative data stratified by age and education. Archives of Clinical Neuropsychology 19, 203–214. [DOI] [PubMed] [Google Scholar]
- [32].Wechsler D (2008) Wechsler adult intelligence scale--Fourth Edition (WAIS--IV). San Antonio, TX: NCS Pearson; 22, 816–827. [Google Scholar]
- [33].Hooper EHLB (1983) Hooper visual organization test (VOT).
- [34].Mack WJ, Freed DM, Williams BW, Henderson VW (1992) Boston Naming Test: Shortened Versions for Use in Alzheimer’s Disease. Journal of Gerontology 47, P154–P158. [DOI] [PubMed] [Google Scholar]
- [35].SÁNCHEZ-CUBILLO I, PERIÁÑEZ JA, ADROVER-ROIG D, RODRÍGUEZ-SÁNCHEZ JM, RÍOS-LAGO M, TIRAPU J, BARCELÓ F (2009) Construct validity of the Trail Making Test: Role of task-switching, working memory, inhibition/interference control, and visuomotor abilities. Journal of the International Neuropsychological Society 15, 438–450. [DOI] [PubMed] [Google Scholar]
- [36].Scharfen J, Peters JM, Holling H (2018) Retest effects in cognitive ability tests: A meta-analysis. Intelligence 67, 44–66. [Google Scholar]
- [37].Seshadri S, Wolf PA, Beiser A, Elias MF, Au R, Kase CS, D’Agostino RB, DeCarli C (2004) Stroke risk profile, brain volume, and cognitive function. Neurology 63, 1591–1599. [DOI] [PubMed] [Google Scholar]
- [38].DeCarli C, Massaro J, Harvey D, Hald J, Tullberg M, Au R, Beiser A, D’Agostino R, Wolf PA (2005) Measures of brain morphology and infarction in the framingham heart study: establishing what is normal. Neurobiology of Aging 26, 491–510. [DOI] [PubMed] [Google Scholar]
- [39].Debette S, Wolf PA, Beiser A, Au R, Himali JJ, Pikula A, Auerbach S, DeCarli C, Seshadri S (2009) Association of parental dementia with cognitive and brain MRI measures in middle-aged adults. Neurology 73, 2071–2078. [DOI] [PMC free article] [PubMed] [Google Scholar]
- [40].Murabito JM, Beiser AS, DeCarli C, Seshadri S, Wolf PA, Au R (2014) Parental longevity is associated with cognition and brain ageing in middle-aged offspring. Age and Ageing 43, 358–363. [DOI] [PMC free article] [PubMed] [Google Scholar]
- [41].Spartano NL, Davis-Plourde KL, Himali JJ, Andersson C, Pase MP, Maillard P, DeCarli C, Murabito JM, Beiser AS, Vasan RS, Seshadri S (2019) Association of Accelerometer-Measured Light-Intensity Physical Activity With Brain Volume: The Framingham Heart Study. JAMA Network Open 2, e192745–e192745. [DOI] [PMC free article] [PubMed] [Google Scholar]
- [42].Sarnowski C, Satizabal CL, DeCarli C, Pitsillides AN, Cupples LA, Vasan RS, Wilson JG, Bis JC, Fornage M, Beiser AS, DeStefano AL, Dupuis J, Seshadri S, Consortium NT-O for PM (TOPMed) (2018) Whole genome sequence analyses of brain imaging measures in the Framingham Study. Neurology 90, e188–e196. [DOI] [PMC free article] [PubMed] [Google Scholar]
- [43].Fletcher E, Singh B, Harvey D, Carmichael O, Decarli C (2012) Adaptive image segmentation for robust measurement of longitudinal brain tissue change. Proceedings of the Annual International Conference of the IEEE Engineering in Medicine and Biology Society, EMBS 5319–5322. [DOI] [PMC free article] [PubMed] [Google Scholar]
- [44].Aljabar P, Heckemann RA, Hammers A, Hajnal J v., Rueckert D (2009) Multi-atlas based segmentation of brain images: Atlas selection and its effect on accuracy. NeuroImage 46, 726–738. [DOI] [PubMed] [Google Scholar]
- [45].DeCarli C, Miller BL, Swan GE, Reed T, Wolf PA, Garner J, Jack L, Carmelli D (1999) Predictors of Brain Morphology for the Men of the NHLBI Twin Study. Stroke 30, 529–536. [DOI] [PubMed] [Google Scholar]
- [46].Scahill RI, Schott JM, Stevens JM, Rossor MN, Fox NC (2002) Mapping the evolution of regional atrophy in Alzheimer’s disease: Unbiased analysis of fluid-registered serial MRI. Proceedings of the National Academy of Sciences of the United States of America 99, 4703. [DOI] [PMC free article] [PubMed] [Google Scholar]
- [47].Burton EJ, Barber R, Mukaetova-Ladinska EB, Robson J, Perry RH, Jaros E, Kalaria RN, O’Brien JT (2009) Medial temporal lobe atrophy on MRI differentiates Alzheimer’s disease from dementia with Lewy bodies and vascular cognitive impairment: a prospective study with pathological verification of diagnosis. Brain 132, 195–203. [DOI] [PubMed] [Google Scholar]
- [48].McDonald CR, Gharapetian L, McEvoy LK, Fennema-Notestine C, Hagler DJ, Holland D, Dale AM (2012) Relationship between regional atrophy rates and cognitive decline in mild cognitive impairment. Neurobiology of aging 33, 242. [DOI] [PMC free article] [PubMed] [Google Scholar]
- [49].Byun MS, Kim SE, Park J, Yi D, Choe YM, Sohn BK, Choi HJ, Baek H, Han JY, Woo JI, Lee DY (2015) Heterogeneity of Regional Brain Atrophy Patterns Associated with Distinct Progression Rates in Alzheimer’s Disease. PLOS ONE 10, e0142756. [DOI] [PMC free article] [PubMed] [Google Scholar]
- [50].Chételat G (2018) Multimodal Neuroimaging in Alzheimer’s Disease: Early Diagnosis, Physiopathological Mechanisms, and Impact of Lifestyle. Journal of Alzheimer’s Disease 64, S199. [DOI] [PMC free article] [PubMed] [Google Scholar]
- [51].Jack CR, Bennett DA, Blennow K, Carrillo MC, Dunn B, Haeberlein SB, Holtzman DM, Jagust W, Jessen F, Karlawish J, Liu E, Molinuevo JL, Montine T, Phelps C, Rankin KP, Rowe CC, Scheltens P, Siemers E, Snyder HM, Sperling R, Elliott C, Masliah E, Ryan L, Silverberg N (2018) NIA-AA Research Framework: Toward a biological definition of Alzheimer’s disease. Alzheimer’s & dementia : the journal of the Alzheimer’s Association 14, 535. [DOI] [PMC free article] [PubMed] [Google Scholar]
- [52].Illán-Gala I, Falgàs N, Friedberg A, Castro-Suárez S, Keret O, Rogers N, Oz D, Nigro S, Quattrone A, Quattrone A, Wolf A, Younes K, Santos-Santos M, Borrego-Écija S, Cobigo Y, Dols-Icardo O, Lladó A, Sánchez-Valle R, Clarimon J, Blesa R, Alcolea D, Fortea J, Lleó A, Grinberg LT, Spina S, Kramer JH, Rabinovici GD, Boxer A, Gorno Tempini ML, Miller BL, Seeley WW, Rosen HJ, Perry DC (2021) Diagnostic Utility of Measuring Cerebral Atrophy in the Behavioral Variant of Frontotemporal Dementia and Association With Clinical Deterioration. JAMA Network Open 4,. [DOI] [PMC free article] [PubMed] [Google Scholar]
- [53].DeCarli C, Fletcher E, Ramey V, Harvey D, Jagust WJ (2005) Anatomical Mapping of White Matter Hyperintensities (WMH). Stroke 36, 50–55. [DOI] [PMC free article] [PubMed] [Google Scholar]
- [54].Wilson PWF, Nam B-H, Pencina M, D’Agostino RB, Benjamin EJ, O’Donnell CJ (2005) C-Reactive Protein and Risk of Cardiovascular Disease in Men and Women From the Framingham Heart Study. Archives of Internal Medicine 165, 2473–2478. [DOI] [PubMed] [Google Scholar]
- [55].Conneely KN, Boehnke M (2007) So Many Correlated Tests, So Little Time! Rapid Adjustment of P Values for Multiple Correlated Tests. American Journal of Human Genetics 81, 1158. [DOI] [PMC free article] [PubMed] [Google Scholar]
- [56].Lahoz C, Schaefer EJ, Cupples LA, Wilson PWF, Levy D, Osgood D, Parpos S, Pedro-Botet J, Daly JA, Ordovas JM (2001) Apolipoprotein E genotype and cardiovascular disease in the Framingham Heart Study. Atherosclerosis 154, 529–537. [DOI] [PubMed] [Google Scholar]
- [57].Therneau TM (2020) coxme: Mixed Effects Cox Models. R package version 2.2–16. [Google Scholar]
- [58].van der Willik KD, Fani L, Rizopoulos D, Licher S, Fest J, Schagen SB, Ikram MK, Ikram MA (2019) Balance between innate versus adaptive immune system and the risk of dementia: a population-based cohort study. Journal of Neuroinflammation 2019 16:1 16, 1–9. [DOI] [PMC free article] [PubMed] [Google Scholar]
- [59].Fani L, Ahmad S, Ikram MK, Ghanbari M, Ikram MA (2021) Immunity and amyloid beta, total tau and neurofilament light chain: Findings from a community-based cohort study. Alzheimer’s & Dementia 17, 446–456. [DOI] [PMC free article] [PubMed] [Google Scholar]
- [60].Bawa KK, Krance SH, Herrmann N, Cogo-Moreira H, Ouk M, Yu D, Wu CY, Black SE, Lanctôt KL, Swardfager W (2020) A peripheral neutrophil-related inflammatory factor predicts a decline in executive function in mild Alzheimer’s disease. Journal of Neuroinflammation 17,. [DOI] [PMC free article] [PubMed] [Google Scholar]
- [61].Williams OA, An Y, Armstrong NM, Kitner-Triolo M, Ferrucci L, Resnick SM (2020) Profiles of Cognitive Change in Preclinical and Prodromal Alzheimer’s Disease Using Change-Point Analysis. Journal of Alzheimer’s Disease 75, 1169–1180. [DOI] [PMC free article] [PubMed] [Google Scholar]
- [62].Meyer SRA, Boelaarts L, Lindeboom J, Jonghe JFM De, Ponds R (2019) Episodic recognition memory based on incidental learning of visual associations is largely preserved compared to recall in amnestic mild cognitive impairment and mild Alzheimer’s disease. Applied Neuropsychology: Adult. [DOI] [PubMed] [Google Scholar]
- [63].Gorelick PB, Scuteri A, Black SE, DeCarli C, Greenberg SM, Iadecola C, Launer LJ, Laurent S, Lopez OL, Nyenhuis D, Petersen RC, Schneider JA, Tzourio C, Arnett DK, Bennett DA, Chui HC, Higashida RT, Lindquist R, Nilsson PM, Roman GC, Sellke FW, Seshadri S (2011) Vascular Contributions to Cognitive Impairment and Dementia. Stroke 42, 2672–2713. [DOI] [PMC free article] [PubMed] [Google Scholar]
- [64].Pase MP, Beiser A, Enserro D, Xanthakis V, Aparicio H, Satizabal CL, Himali JJ, Kase CS, Vasan RS, DeCarli C, Seshadri S (2016) Association of Ideal Cardiovascular Health With Vascular Brain Injury and Incident Dementia. Stroke 47, 1201–1206. [DOI] [PMC free article] [PubMed] [Google Scholar]
- [65].Pase MP, Satizabal CL, Seshadri S (2017) Role of Improved Vascular Health in the Declining Incidence of Dementia. Stroke 48, 2013–2020. [DOI] [PMC free article] [PubMed] [Google Scholar]
- [66].Balta S, Celik T, Mikhailidis DP, Ozturk C, Demirkol S, Aparci M, Iyisoy A (2015) The Relation Between Atherosclerosis and the Neutrophil–Lymphocyte Ratio: Clinical and Applied Thrombosis/Hemostasis 22, 405–411. [DOI] [PubMed] [Google Scholar]
- [67].Habes M, Pomponio R, Shou H, Doshi J, Mamourian E, Erus G, Nasrallah I, Launer LJ, Rashid T, Bilgel M, Fan Y, Toledo JB, Yaffe K, Sotiras A, Srinivasan D, Espeland M, Masters C, Maruff P, Fripp J, Völzk H, Johnson SC, Morris JC, Albert MS, Miller MI, Bryan RN, Grabe HJ, Resnick SM, Wolk DA, Davatzikos C (2021) The Brain Chart of Aging: Machine-learning analytics reveals links between brain aging, white matter disease, amyloid burden, and cognition in the iSTAGING consortium of 10,216 harmonized MR scans. Alzheimer’s & Dementia 17, 89–102. [DOI] [PMC free article] [PubMed] [Google Scholar]
- [68].Weuve J, Leon CFM de, Bennett DA, Dong X, Evans DA (2014) The red cell distribution width and anemia in association with prevalent dementia. Alzheimer disease and associated disorders 28, 99. [DOI] [PMC free article] [PubMed] [Google Scholar]
- [69].Beydoun MA, Shaked D, Hossain S, Weiss J, Beydoun HA, Maldonado AI, Katzel LI, Davatzikos C, Gullapalli RP, Seliger SL, Erus G, Evans MK, Zonderman AB, Waldstein SR (2021) Red cell distribution width, anemia and their associations with white matter integrity among middle-aged urban adults. Neurobiology of Aging 105, 229–240. [DOI] [PMC free article] [PubMed] [Google Scholar]
- [70].Al-Kindi SG, Zidar DA, McComsey GA, Longenecker CT (2017) Association of Anisocytosis with Markers of Immune Activation and Exhaustion in Treated HIV. Pathogens & Immunity 2, 138. [DOI] [PMC free article] [PubMed] [Google Scholar]
- [71].Winchester LM, Powell J, Lovestone S, Nevado-Holgado AJ (2018) Red blood cell indices and anaemia as causative factors for cognitive function deficits and for Alzheimer’s disease. Genome Medicine 2018 10:1 10, 1–12. [DOI] [PMC free article] [PubMed] [Google Scholar]
- [72].Veitinger M, Varga B, Guterres SB, Zellner M (2014) Platelets, a reliable source for peripheral Alzheimer’s disease biomarkers? Acta Neuropathologica Communications 2014 2:1 2, 1–15. [DOI] [PMC free article] [PubMed] [Google Scholar]
- [73].Zahorec R (2021) Neutrophil-to-lymphocyte ratio, past, present and future perspectives. Bratislava Medical Journal 122, 474–488. [DOI] [PubMed] [Google Scholar]
Associated Data
This section collects any data citations, data availability statements, or supplementary materials included in this article.