FIGURE 2.

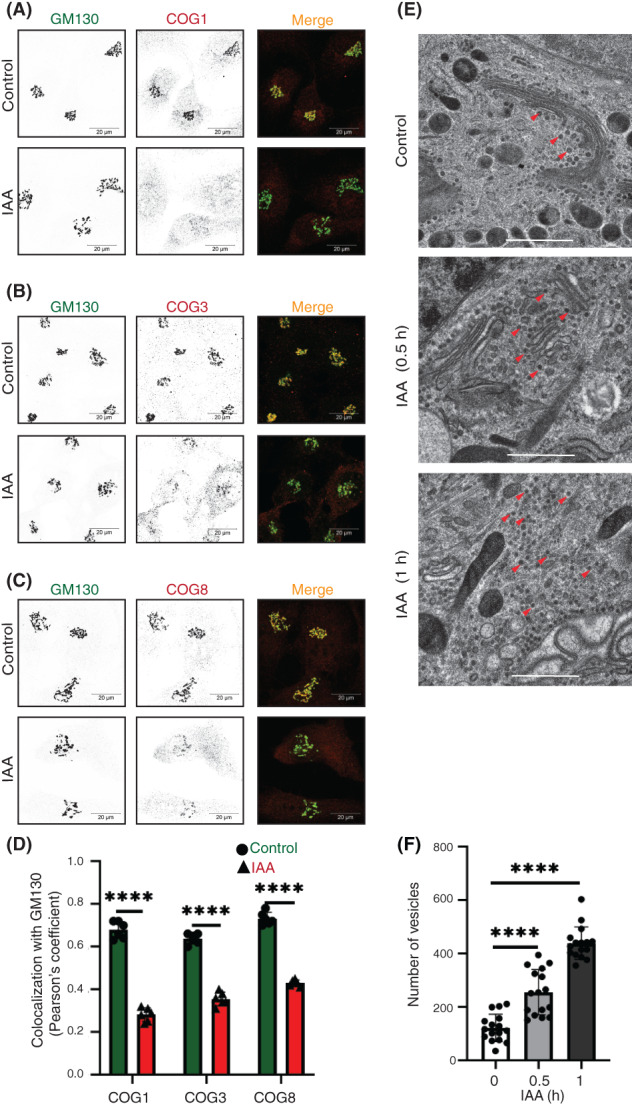
COG4 depletion affects other conserved oligomeric Golgi (COG) subunits and causes rapid accumulation of COG complex‐dependent (CCD) vesicles. (A) Airyscan superresolution IF analysis of untreated (control) or IAA treated COG4‐mAID cells stained for (A) GM130 (green) and COG1 (red), (B) GM130 (green) and COG3 (red) (C) GM130 (green) and COG8 (red). Scale bars, 20 μm. For better presentation, green and red channels are shown in inverted black and white mode whereas the merged view is shown in RGB mode. (D) Colocalization of COG subunits with GM130 in control and IAA treated cells was determined using Pearson's correlation coefficient and >60 cells were analyzed. Statistical significance was calculated by GraphPad Prism 8 using paired t‐test. Here, ****P < 0.0001 (significant). Error bar represents mean ± SD. (E) Transmission electron microscopy has been performed on 50 nm thick sections of the high‐pressure frozen COG4‐mAID cells grown on sapphire discs before and after the IAA treatment (0.5 and 1 h). The scale bar is 1 μm. The red arrows indicate vesicles. (F) The graph represents the quantification of the total number of vesicles (50–60 nm) in the Golgi vicinity before and after IAA treatment. Two independent experiments with >10 fields were analyzed. Statistical significance was calculated by GraphPad Prism 8 using paired t‐test. Here ***p ≤ 0.001 (significant). Error bar represents mean ± SD
