Abstract
Background and Objectives
Spontaneous intracranial hypotension (SIH) is characterized by loss of CSF volume. We hypothesize that in this situation of low volume, a larger CSF flow and spinal cord motion at the upper spine can be measured by noninvasive phase contrast MRI.
Methods
A prospective, age-, sex-, and body mass index (BMI)-matched controlled cohort study on patients with SIH presenting with spinal longitudinal extradural fluid collection (SLEC) was conducted from October 2021 to February 2022. Cardiac-gated 2D phase contrast MRI sequences were acquired at segment C2/C3, and C5/C6 for CSF flow, and spinal cord motion analysis. Data processing was fully automated. CSF flow and spinal cord motion were analyzed by peak-to-peak amplitude and total displacement per segment and heartbeat, respectively. Clinical data included age, height, BMI, duration of symptoms, Bern score according to Dobrocky et al., and type of the spinal CSF leak according to Schievink et al. Groups were compared via the Mann-Whitney U test; multiple linear regression analysis was performed to address possible relations.
Results
Twenty patients with SIH and 40 healthy controls were analyzed; each group consisted of 70% women. Eleven patients with SIH presented with type 1 leak, 8 with type 2, and 1 was indeterminate. CSF flow per heartbeat was increased at C2/C3 (peak-to-peak amplitude 65.68 ± 18.3 vs 42.50 ± 9.8 mm/s, total displacement 14.32 ± 3.5 vs 9.75 ± 2.7 mm, p < 0.001, respectively). Craniocaudal spinal cord motion per heartbeat was larger at segment C2/C3 (peak-to-peak amplitude 7.30 ± 2.4 vs 5.82 ± 2.0 mm/s, total displacement 1.01 ± 0.4 vs 0.74 ± 0.4 mm, p = 0.006, respectively) and at segment C5/C6 (total displacement 1.41 ± 0.7 vs 0.97 ± 0.4 mm, p = 0.021).
Discussion
SLEC-positive patients with SIH show higher CSF flow and higher spinal cord motion at the upper cervical spine. This increased craniocaudal motion of the spinal cord per heartbeat might produce increased mechanical strain on neural tissue and adherent structures, which may be a mechanism leading to cranial nerve dysfunction, neck pain, and stiffness in SIH. Noninvasive phase contrast MRI of CSF flow and spinal cord motion is a promising diagnostic tool in SIH.
Trial Registration Information
German Clinical Trials Register, identification number: DRKS00017351.
Classification of Evidence
This study provides Class III evidence that noninvasive phase contrast MRI of the upper spine identifies differences in CSF flow and spinal cord motion in patients with SIH compared with healthy controls.
Spontaneous intracranial hypotension (SIH) is most often caused by spinal CSF leaks that might lead to an orthostatic headache syndrome.1 The headache, if present, is most pronounced in the back of the head, which has been hypothesized to be the result of the following causal sequence: low CSF volume—sagging of the brain—tension on the cranial nerves and dura mater, which in the posterior fossa is sensitive to tension.2,3
Current diagnostic criteria include CSF opening pressure <60 mm H2O measured by lumbar puncture in lateral decubitus position and/or evidence of CSF leak on imaging.4 However, only 1/3 of patients have a low CSF pressure,5-7 symptoms are variable,2 and evidence of CSF leak might involve invasive diagnostics.1 Intracranial CSF pressure cannot yet be noninvasively measured reliably, for example, by MRI. Also, the CSF volume is difficult to assess noninvasively due to the high variability of the thecal sac and the lack of data in healthy controls.
The ratio of changes in pressure and volume defines the term compliance. In a physiologic state, the spinal compartment is favored as being the site of major volume compliance8-12: The spinal compartment serves as an elastic buffer zone (Windkessel) that stabilizes the change in pressure caused by pulsatile in- and outflow of blood into the CSF- and CNS-filled cranium.10-13 In patients with SIH, this mechanism is disturbed due to the loss of CSF volume. Especially in the upright position, the CSF volume shifts in higher proportion toward the spinal canal and causes a decrease in intracranial pressure.8
In the supine position, CSF pressure in the cranial and spinal compartments is equal. According to the law of Bernoulli, in such a system of even pressure, a loss of volume (=CSF) should lead to an increase of volume change (=CSF flow, spinal cord/CNS motion, respectively). This effect is expected to be largest at the transition from the larger, rather round-shaped cranium to the smaller, and tube-like spinal canal.
Cardiac-gated phase contrast MRI measures the velocity of moving spins using bipolar gradients that create phase shifts proportional to their velocities.14,15 Amplitude, duration, and spacing of the bipolar gradients determine the degree of sensitivity to slow or fast flows adjusted with a prespecified parameter called velocity encoding (VENC). The VENC in centimeters per second is chosen to encompass the highest velocities to be encountered within the region of interest (ROI): If it is too high, the range of flows imaged will only span a limited phase shift range. If it is too low, velocity aliasing will occur, in which faster spins are displayed with an opposite phase, the so-called aliasing.14,15 With adapted VENC, time-resolved, quantitative interpretation of the velocity curve per heartbeat is feasible, and the pulse-synchronous, craniocaudal CSF flow16,17 and spinal cord motion can be assessed.18
The primary research question of this trial was to investigate CSF flow and spinal cord motion at the spinal canal among patients with SIH. We hypothesize that patients with SIH with evidence of CSF leaks can be separated from healthy controls by increased spinal cord motion and CSF flow as identified with phase contrast MRI.
Methods
A prospective controlled, single-center, observational study was performed on patients with SIH fulfilling the ICHD-3 criteria4 between October 2021 and February 2022. Patients were required to show evidence of a CSF leak on spine MRI (spinal longitudinal extradural fluid collection [SLEC]).10,11
An age- and sex-matched cohort of healthy controls in a ratio of 1:2 was derived from a cohort of 64 healthy controls aged 20–80 years. Controls had been recruited via in-house advertisements (June 2019–February 2020) and had received 30 Euros compensation. Healthy controls were required to have no history and/or clinical signs of cervical spinal canal degeneration, no CNS or psychiatric disease, nor any other impairment of daily life activities by other illnesses, especially headaches. Controls had received a neurologic examination before admission to exclude asymptomatic signs of CNS disease. Participants were excluded in case of incidental finding of a relevant spinal canal stenosis defined as diminished anterior and/or posterior CSF space.
Standard Protocol Approvals, Registrations, and Patient Consents
The local ethic committee approved the trial (Ethics Committee University of Freiburg, Vote number: 338/17). Written informed consent was obtained from each participant. The study was registered at the German Clinical Trials Register, identification number: DRKS00017351.
MRI Acquisition
Patients and controls were scanned on a 3 Tesla MRI scanner (3T, SIEMENS MAGNETOM Prisma, SIEMENS Erlangen) using a 64-channel head-neck coil. Patients were scanned prior to further invasive diagnostics.
The imaging protocol comprised a standard T2-weighted 3D sequence of the cervical spine (spatial resolution 0.6 × 0.6 × 1.0 mm). Within a second step, axial, 2D phase contrast MRI sequences were administered perpendicular to the spinal canal during free, steady breathing. Phase contrast MRI sequences were acquired subsequently at the cervical segments C2/C3 and C5/C6 (prospective ECG triggering, spatial resolution 0.9 × 0.9 × 5 mm, PEAK-GRAPPA acceleration,19 velocity encoding parameter 5 cm/s for spinal cord motion, velocity encoding parameter 10 cm/s for CSF flow, and assessment of about 40 time points per heartbeat depending on the duration of the heartbeat). The acquisition time was approximately 1.5 minutes per axial sequence. The average duration of the heartbeat was recorded automatically per sequence and individual allowing further analysis of the time-resolved data. Further details of the sequences are available in the eMethods (links.lww.com/WNL/C475).
MRI Data
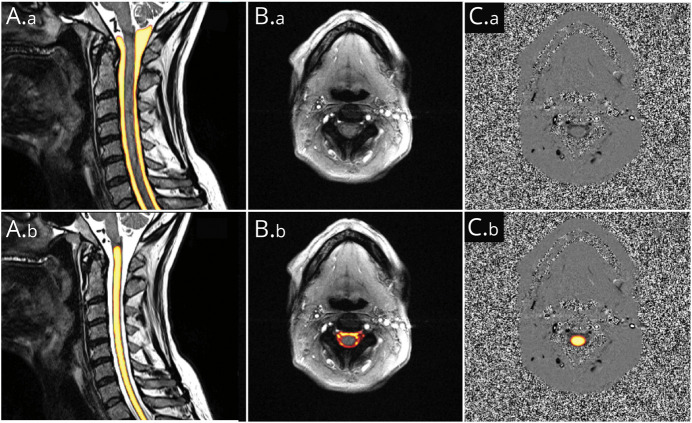
Data postprocessing was performed using an automated pipeline implied within the in-house platform NORA.20 Segmentation was based on separately trained hierarchical deep convolutional neural networks (CNNs). The training procedure and implementation of the segmentation within the 3D T2-weighted images were previously described.18,21 The training and implementation procedures were performed analogously for the CNN on the axial phase contrast images. The output of each CNN was a voxel-wise likelihood value (0–1) that indicated the probability of the voxel to be a part of the structure in question (Figure 1).
Figure 1. Example of Automated Segmentations.
Yellow color indicates high likelihood of a voxel to be a part of the structure in question. (A.a and A.b) Identical, 3D T2-weighted image of the cervical spine used for further measurements of anatomic parameters. A1: segmentation of CSF space. A.b: segmentation of spinal cord tissue. (B.a and B.b) Identical axial magnitude and (C.a and C.b) corresponding phase images at segment C2/C3. B.b: segmentation of CSF space for further CSF flow analysis; C.b.: overlayed segmentation of spinal cord tissue for spinal cord motion analysis.
Processing of T2-Weighted 3D Sequences/Anatomic Data
CSF space and spinal cord tissue were automatically segmented by a 0.8 probability margin for further analysis of anatomic data, respectively (Figure 1). Correct segmentation was verified visually. The software automatically detected the spinal vertebrae C2 to T1. Analog to our previously reported method,18 1 ROI per cervical segment C2/C3 to C7/T1 was generated covering the central 1/3 of CSF space and spinal cord tissue between 2 vertebras, respectively. The mean CSF space cross-sectional area (CSA) (mm2) and the mean spinal canal CSA (mm2) were generated per each cervical segment.
Processing of Phase Contrast MRI Sequences/Dynamic Data
Automated ROIs covered all voxels within the axial images identified to belong to CSF space and spinal cord tissue by a 0.9 probability margin, respectively (Figure 1). All phase-contrast MRI data were adjusted for phase drifts by subtraction of the median velocity of each curve. Also, automated correction of the so-called aliasing artifacts was implied within the pipeline.22,23
All phase contrast images were inspected visually on typical MRI artifacts before entering further analysis (e.g., movement, metal, infolding, and flow artifacts by vessels). CNN-based segmentation of phase contrast images was manually verified within each image and rejected from further analysis, if a likelihood of ≥0.9 was given within non-CSF space, or nonspinal cord tissue, respectively (eFigure 1, links.lww.com/WNL/C473).
For visual comparison of CSF flow and spinal cord motion behavior, the velocity curves were interpolated and plotted over a standardized heartbeat. The following dynamic parameters of CSF flow and spinal cord motion curves per segment C2/C3 and C5/C7 were automatically generated per heart cycle and individual (Figure 2): peak-to-peak amplitude (mm/s) and total displacement (mm).
Figure 2. Interpretation of Time-Resolved Velocity Data Curves.
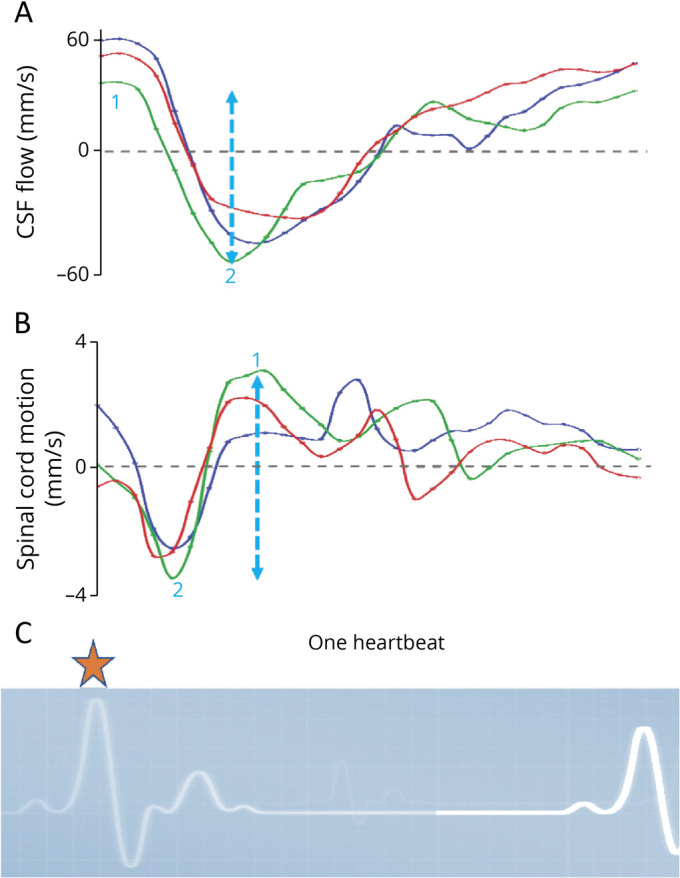
Curves of 3 exemplary velocity measurements (y-axis) of CSF flow (A) and spinal cord motion (B) at C2/C3 over 1 standardized heartbeat (x-axis). The beginning of measurements is triggered by R-peaks of the ECG (C, orange star). Thus, the displayed curves start shortly after the beginning of the cardiac systolic phase and shortly before the arrival of the maximum pulse wave at the cranium. While CSF continues to flow in caudal direction shortly after the R-peak of the ECG (negative values), the spinal cord motion is redirected towards the cranium (positive values). Two main parameters are analyzed per each individual curve: The peak-to-peak amplitude (mm/s, blue dotted arrow marking the green velocity curve) is calculated by maximum velocity in the cranial direction (1 = positive value) minus maximum velocity in the caudal direction (2 = negative value). It gives information on the maximum extent of craniocaudal CSF flow and spinal cord motion, respectively. The individual's duration of the heartbeat in milliseconds is used to derive the entire area under the curve (mm), which is added irrespective of the positive or negative values. The value is called total displacement (mm) and gives information of the absolute distance the chosen Region of interest of CSF and spinal cord tissue is moved in cranial and caudal direction over a heartbeat, respectively. It comprises information of the entire curve within a value.
The peak-to-peak amplitude of the velocity curve gives information on the extent of the maximum cranial and maximum caudal velocity. The parameter is robust to offset errors. The total displacement comprises information of the entire area under the curve over the duration of a heartbeat irrespective of the positive and negative values. It resembles the distance the chosen ROI volume (CSF or spinal cord) covers in the caudocranial and craniocaudal direction during 1 heartbeat (Figure 2). Thus, the total displacement gives more information on the overall dynamics but is less robust on offset errors.
Although a peak-to-peak amplitude might be identical, change of the total displacement would indicate changes of the duration of CSF flow and spinal cord motion, respectively. Vice versa, total displacement might be identical, whereas differences in the peak-to-peak amplitude would indicate a difference in acceleration. In addition, the peak-to-peak amplitude of CSF volume flow in milliliters per second and the total CSF volume shift per heartbeat (mL) was approximated by multiplication of the velocity data with the CSF space CSA (mm2) at the corresponding segment.
Clinical Parameter
The following clinical parameters were assessed: sex, age (years), height (cm), body mass index (BMI) (kg/m2), and, among patients, Bern score of the head.24 The type of the CSF leak was recorded according to Schievink et al.,1 if identified during further diagnostics after performance of the MRI following the algorithm as proposed by Luetzen et al.25 Duration of symptoms, any prior treatment, and time since last treatment were reported.
Data Validity
For calculation of the test-retest reliability and consistency of the following data processing in NORA, the axial phase-contrast MRI sequences were consecutively repeated within 25 healthy controls. To demonstrate the test-test reliability of the pipeline itself and its implied data processing, the pipeline was run twice on the first 30 scans of the participants sorted by pseudonym.
Statistics
Statistical analysis was performed using IBM SPSS Statistics (IBM Corporation, Released 2020. IBM SPSS Statistics for Macintosh, Version 27.0. Armonk, New York). Data were given as mean and SD. Reliability of repeated measurements was determined via intraclass correlation coefficient (ICC, single measures, 2-way mixed-effects model, and absolute agreement) and classified as poor for <0.5, moderate for 0.50 to 0.74, good for 0.75 to 0.9, and excellent for >0.9.26 ICC <0.5 of the test-retest reliability and ICC <0.9 of the test-test reliability were not considered acceptable. Comparison of groups, unrelated values, was conducted via the Mann-Whitney U test. Relation of clinical parameter on CSF flow and spinal cord measurements was rated via multiple regression analysis. p < 0.05 was considered significant. The area under the curve of receiver operating characteristic (AUROC) analysis was calculated, and possible optimum limits as defined by maximum Youden index (sensitivity + specificity −1) were approximated in case of an AUROC >0.7.
Data Availability
Anonymized data not provided in the article may be shared at the request of any qualified investigator for purposes of replicating procedures and results.
Results
Study Population
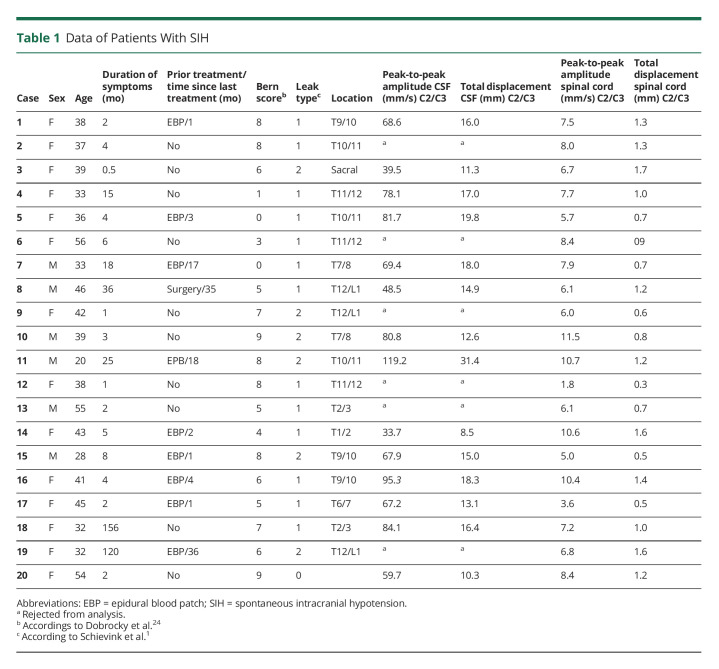
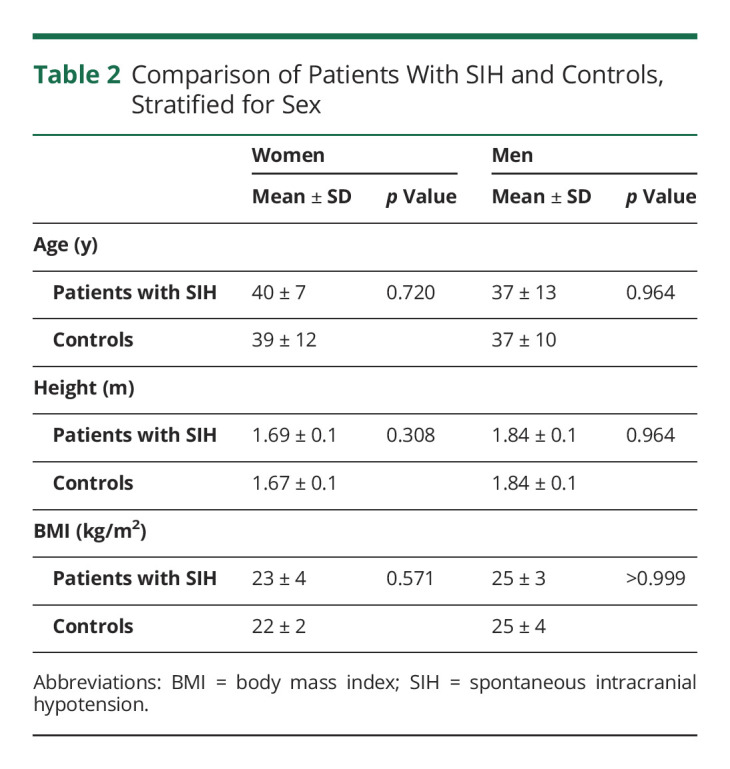
Twenty patients with SIH, 14 women, entered the study (Table 1). Eleven patients had a type 1 CSF leak, and 8 had a type 2 leak. In 1 woman, the exact leak site could not be located (Table 1). The mean duration of symptoms was 21 ± 42 months due to 2 cases with a very long history of SIH-related symptoms (Table 1). Nine patients (45%) had been treated prior to enrollment by epidural blood patch, 1 had an attempted dural leak surgery 3 years in advance to the study, and 10 patients (50%) were without prior treatment. The control cohort contained 40 participants, 28 women. Controls and patients did not differ in age, height, and BMI (Table 2).
Table 1.
Data of Patients With SIH
Table 2.
Comparison of Patients With SIH and Controls, Stratified for Sex
Anatomic Data
Patients and controls differed in the size of the CSF space at C2/C3 and in the size of the spinal cord at C7/T1 (eFigure 2, links.lww.com/WNL/C474): The CSF space CSA at segment C2/C3 was significantly smaller in patients with SIH (controls: 192 ± 31 mm2, patients: 162 ± 42 mm2, p = 0.007). The spinal cord CSA at segment C7/T1 was larger in patients with SIH (controls: 49 ± 6 mm2, patients: 54 ± 7 mm2, p = 0.015, exclusion of 1 outlier among patients with SIH, eFigure 2). Anatomic data did not differ at any other cervical segment (C3/C4 to C6/C7).
CSF Flow and Spinal Cord Motion
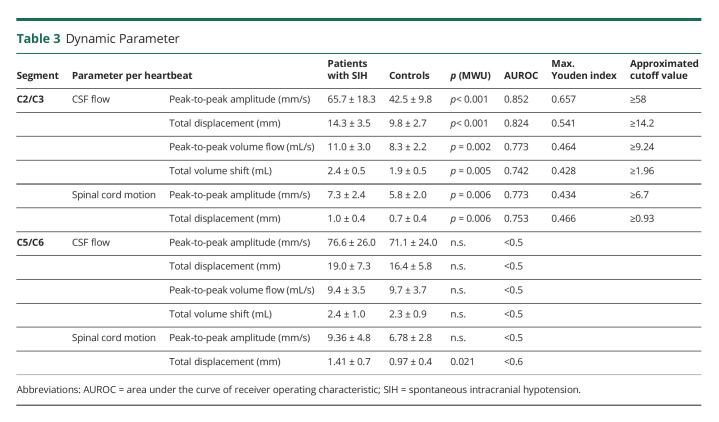
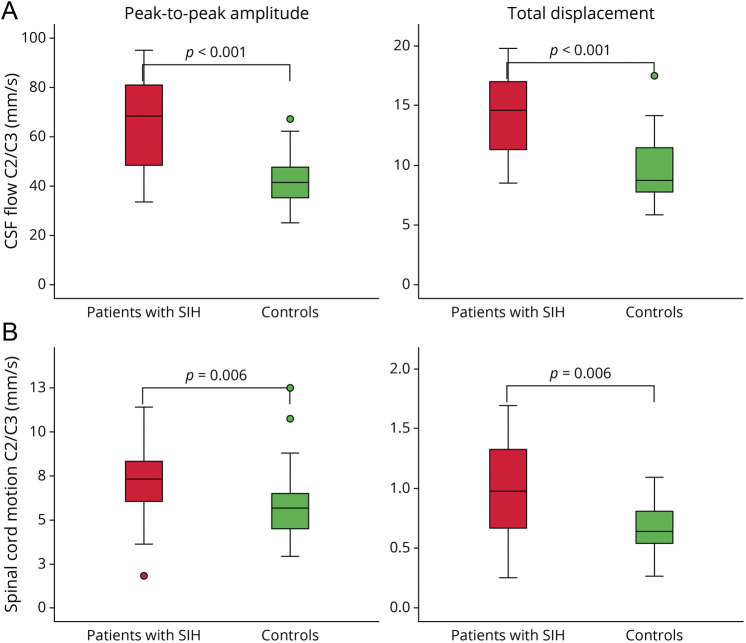
Craniocaudal CSF flow per heartbeat was higher among patients with SIH at C2/C3: peak-to-peak amplitude 65.68 ± 18.3 vs 42.50 ± 9.8 mm/s, p < 0.001, total displacement per heartbeat 14.32 ± 3.5 vs 9.75 ± 2.7 mm, p < 0.001, approximated peak-to-peak volume flow 11.02 ± 3.0 vs 8.27 ± 2.2 mL/s, p = 0.002, and approximated total volume shift 2.40 ± 0.5 vs 1.89 ± 0.5 mL, p = 0.005. There was no difference in CSF flow at the lower segment C5/C6. The extent of the craniocaudal spinal cord motion over 1 heartbeat was increased at C2/C3 and at C5/C6: peak-to-peak amplitude C2/C3 7.30 ± 2.4 vs 5.82 ± 2.0 mm/s, p = 0.006, total displacement per heartbeat C2/C3 1.01 ± 0.4 vs 0.74 ± 0.37 mm, p = 0.006, and total displacement per heartbeat C5/C6 1.41 ± 0.7 vs 0.97 ± 0.4 mm, p = 0.021 (Table 3 and Figure 3).
Table 3.
Dynamic Parameter
Figure 3. Boxplots of CSF Flow (A) and Spinal Cord Motion (B) in Patients With SIH (Red) Compared With Healthy Controls (Green) at Segment C2/C3.
The extent of the craniocaudal peaks of the velocity curves (peak-to-peak amplitude—left) and the absolute distance of CSF flow and spinal cord motion over 1 heartbeat (total displacement—right) are significantly higher in patients with SIH. SIH = spontaneous intracranial hypotension
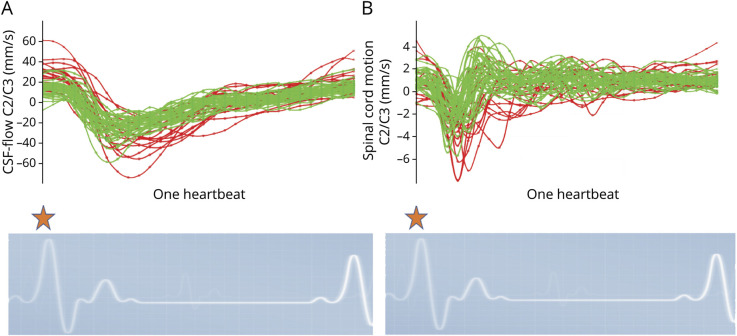
Within the plots of the velocity curves (Figure 4), it can be observed that spinal cord tissue was moved caudal alongside the main, caudal CSF flow shortly after the beginning of the cardiac systolic phase. While CSF continued to flow in caudal direction, the spinal cord showed an early, compensatory, cranial motion. During the cardiac diastolic phase, CSF flows slowly backward toward the cranium, and the spinal cord is rather still (Figure 4). Higher peak-to-peak amplitudes and a prolonged spinal cord motion and CSF flow in patients with SIH can be observed (Figure 4).
Figure 4. Velocity Curves, Interpolated Data.
All velocity measurements (mm/s, y-axis) of CSF flow (A) and spinal cord motion (B) plotted over 1 standardized heartbeat (x-axis). Measurements of healthy controls are displayed in green color; patients with SIH are displayed in red color. The beginning of the measurements is triggered by the R-peak of the ECG (orange star). Patients show higher craniocaudal peaks and prolonged CSF flow and spinal cord motion over 1 heartbeat. SIH = spontaneous intracranial hypotension.
Among patients with SIH, increasing age related to lower CSF dynamics at C2/C3 (peak-to-peak amplitude: B = −0.511, p = 0.008, total displacement: B = −0.354, p = 0.004), for example, each 10 years in age was associated with a decrease of 3.5 mm CSF total displacement per heartbeat. There was no relation of other clinical or anatomic parameters to CSF flow and spinal cord motion (sex, height, BMI, Bern score, cause of leak, CSF space at segment, and duration of symptoms).
According to current data, the following possible optimum cutoff values were approximated for CSF flow and spinal cord motion to indicate probable abnormality (Table 3): CSF flow C2/3: peak-to-peak amplitude ≥58 mm/s and total displacement ≥14.2 mm; spinal cord motion at C2/C3: peak-to-peak amplitude ≥6.7 mm/s and total displacement ≥0.93 mm.
Data Validity
The test-test reliability of repeated data processing within the automated pipeline was excellent for all parameters (CSAs: ICC >0.99; spinal cord motion: ICC = 0.924–0.999; CSF flow: 0.985–0.995). Test-retest reliability of repeated phase contrast MRI measurements including consecutive data processing was excellent for all data on spinal cord motion (ICC = 0.955–0.965), excellent for CSF flow data at C2/C3 (ICC = 0.951–0.957), and good for CSF flow data at C5/C6 (ICC = 0.833–0.877).
Among patients with SIH with SLEC, CNN-based segmentation was challenged due to SIH-related engorgements of epidural veins and constriction of the dura (eFigure 1, links.lww.com/WNL/C473). Spinal cord segmentation at C2/C3 was within anatomic boundaries in all patients with SIH. Segmentation was rejected, and data sets were accordingly withdrawn in 30% CSF flow measurements at C2/C3, 35% CSF flow measurements at C5/C6, and 20% spinal cord motion measurements at C5/C6.
Classification of Evidence
This study provides Class III evidence that noninvasive phase-contrast MRI of the upper spine identifies differences in CSF flow and spinal cord motion in patients with SIH compared with healthy controls.
Discussion
Patients with SIH with evidence of SLEC have a larger CSF flow and higher spinal cord motion at the segment C2/C3. An increased craniocaudal motion of the spinal cord per heartbeat is also seen at segment C5/C6. Given an approximated number of 86.000 heartbeats per day, this repetitive larger motion of the spinal cord might produce the hypothesized mechanism of increased strain on neural tissue and adherent structures in patients with SIH that leads to symptoms of lower neck pain, neck stiffness, and cranial nerve dysfunction.
During systole, the blood volume increases within the calvarium and forces a craniocaudal shift of CSF volume (Monro Kellie doctrine10). In the diastolic phase, the intracranial volume decreases, and CSF flows in a reverse direction.16,27-29 The pulsatile change of volumes is compensated by the compliance of the spinal compartment. The passive spinal cord motion depends on the pulsatile changes of volume within the intracranial and intraspinal compartments as well.30 These codependent dynamics can be observed within the current plots of velocity curves (Figures 3 and 4).
We hypothesize that the measured changes of CSF flow among patients with SIH are caused by a loss of CSF volume, leading to a faster and prolonged CSF flow between the cranial and spinal compartments, which is in accordance with the expected fluid behavior by the law of Bernoulli. Furthermore, this loss of CSF volume, especially within the spinal compartment, might cause a reduced dampening of the craniocaudal spinal cord motion and might explain the current results.
The observed difference in CSF space at C2/C3 might be caused by the expansion of epidural veins at the higher cervical segments. The increase of spinal cord size at lower segments might reflect the known sagging of the neural structures (slight caudal shifting of the intumescent spinal cord among patients with SIH, eFigure 2, links.lww.com/WNL/C474), rather than other changes of spinal cord tissue, for example, edema.
Increased CSF flow and cervical spinal cord motion can be noninvasively measured with phase contrast MRI. As phase-contrast sequences are short (∼1.5 minutes) and noninvasive, they can be easily integrated into the workup of patients with SIH.25,31 Analysis of CSF flow seemed most promising to possibly detect patients with SIH on further validation compared with analysis of spinal cord motion (Figure 3 and Table 3). However, in patients with SIH, automated spinal cord segmentation seems to be more reliable than automated CSF space segmentation, especially when CSF volume is low and enlarged epidural veins impede the definition of the external border of the CSF space. Thus, we suggest acquiring both sequences.
One may argue that the Bern score is already a sensitive surrogate parameter for the presence of a spinal CSF leak. However, 4 patients (4/20, 20%) with a low Bern score (0–3 points) demonstrated high CSF flow and/or spinal cord motion values. Thus, phase contrast MRI of CSF flow and spinal cord motion might serve as a promising diagnostic tool in SIH and should be considered for further investigation including the entire spectrum of patients with SIH and leak types, respectively. It could be a piece of the puzzle in patients with equivocal clinical presentations and head and spine MRI findings.
Further analysis of the entire CSF flow and spinal cord motion pattern per heart cycle might allow to derive further, indirect information on disease-specific dynamics. It might add to the understanding of symptomatic patients with typical MRI signs but no evidence of CSF leak despite thorough and repeated diagnostic workup. As a possible, internal cause, an assumably higher compliance of the spinal compartment has been hypothesized to cause an increased shift of CSF volume from the cranial to the spinal compartment leading to intracranial hypotension.8 In this case, higher overall CSF dynamics and spinal cord motion should be assumed. Another possibility might be intermittent or small CSF-venous fistulas that are not detected among these patients. Within these types of leaks (type 3), the intraspinal dynamics should most likely be different to type 1 and type 2 leaks due to the drainage into the venous system. This might possibly lead to alterations in the CSF flow and spinal cord motion pattern during the diastolic phase, which should be investigated. Also, we see potential for posttreatment monitoring, as well as for diagnostics in other disease entities, for example, (idiopathic) intracranial hypertension. A reversed mechanism of less CSF flow and less spinal cord motion could be hypothesized in patients with increased CSF volume and therefore dampening of the dynamics.
Few studies have investigated CSF flow in patients with SIH focusing on CSF flow through the aqueduct.32-35 One study reported lower CSF flow at C2/C3 among 23 patients with definite SIH and 4 patients with assumed SIH (controls: 1.2 ± 0.3 mL/s, patients: 0.8 ± 0.4 mL/s, p > 0.001). This is in contrast to current results. Direct comparison is difficult, as it is not clear of which exact data mL/s were derived (e.g., maximum cranial, maximum caudal CSF flow), and as there are several differences of applied methods (control cohort younger, lower time resolution of phase contrast MRI acquisition, correction of phase drifts not reported, and others).
Limits of the study comprise the small sample sizes and the restricted inclusion criteria limiting the study cohort to SLEC-positive patients with SIH. Also, the given thresholds need further evaluations on other influences of CSF leak type, sex, height, and age, and interscanner comparability.
Patients with SIH with SLEC have larger pulsatile CSF flow between the cranial and spinal compartments associated with increased repetitive motion of the spinal cord. CSF flow and spinal cord motion measurements at the upper cervical spine do serve as promising surrogate markers in the diagnosis of SIH.
Glossary
- AUROC
area under the curve of receiver operating characteristic
- BMI
body mass index
- CNN
convolutional neural network
- CSA
cross-sectional area
- ICC
intraclass correlation coefficient
- ICHD
International Classification of Headache Disorders
- SIH
spontaneous intracranial hypotension
- ROI
region of interest
- SLEC
spinal longitudinal extradural fluid collection
- VENC
velocity ENCoding (parameter)
Appendix. Authors
Footnotes
Study Funding
The study was funded by the program “Clinical Studies 2019” of the Faculty of Medicine, University of Freiburg, Germany (number: 3091331904), and by the Research Funding Program (“Forschungskommission”) of the Faculty of Medicine, University of Freiburg, Germany (number: wol2177-21). This project is supported by the Ministry of Science, Research and the Arts Baden-Württemberg.
Disclosure
K. Wolf, N. Lützen, H. Mast, N. Kremers, M. Reisert, S. Beltrán, C. Fung, and J. Beck report no disclosures relevant to the manuscript. H. Urbach: honoraria for lectures from Biogen, Eisai, and mbits; advisory board: Biogen; and Co-editor: Clin Neuroradiol. Go to Neurology.org/N for full disclosures.
References
- 1.Schievink WI, Maya MM, Jean-Pierre S, Nuño M, Prasad RS, Moser FG. A classification system of spontaneous spinal CSF leaks. Neurology. 2016;87(7):673-679. doi: 10.1212/WNL.0000000000002986 [DOI] [PubMed] [Google Scholar]
- 2.Schievink WI. Misdiagnosis of spontaneous intracranial hypotension. Arch Neurol. 2003;60(12):1713-1718. doi: 10.1001/archneur.60.12.1713 [DOI] [PubMed] [Google Scholar]
- 3.Ducros A, Biousse V. Headache arising from idiopathic changes in CSF pressure. Lancet Neurol. 2015;14(6):655-668. doi: 10.1016/S1474-4422(15)00015-0 [DOI] [PubMed] [Google Scholar]
- 4.Headache Classification Committee of the International Headache Society (IHS) The International Classification of Headache Disorders, 3rd ed. Cephalalgia. 2018, 38(1):1-211. doi: 10.1177/0333102417738202 [DOI] [PubMed] [Google Scholar]
- 5.Kranz PG, Tanpitukpongse TP, Choudhury KR, Amrhein TJ, Gray L. How common is normal cerebrospinal fluid pressure in spontaneous intracranial hypotension? Cephalalgia. 2016;36(13):1209-1217. doi: 10.1177/0333102415623071 [DOI] [PubMed] [Google Scholar]
- 6.Beck J, Fung C, Ulrich CT, et al. Cerebrospinal fluid outflow resistance as a diagnostic marker of spontaneous cerebrospinal fluid leakage. J Neurosurg Spine. 2017;27(2):227-234. doi: 10.3171/2017.1.SPINE16548 [DOI] [PubMed] [Google Scholar]
- 7.Häni L, Fung C, Jesse CM, et al. Insights into the natural history of spontaneous intracranial hypotension from infusion testing. Neurology. 2020;95(3):E247–E255. doi: 10.1212/WNL.0000000000009812 [DOI] [PubMed] [Google Scholar]
- 8.Goldberg J, Häni L, Jesse CM, et al. Spontaneous intracranial hypotension without CSF leakage-concept of a pathological cranial to spinal fluid shift. Front Neurol. 2021;12:760081. doi: 10.3389/fneur.2021.760081 [DOI] [PMC free article] [PubMed] [Google Scholar]
- 9.Marmarou A, Shulman K, LaMorgese J. Compartmental analysis of compliance and outflow resistance of the cerebrospinal fluid system. J Neurosurg. 1975;43(5):523-534. doi: 10.3171/jns.1975.43.5.0523 [DOI] [PubMed] [Google Scholar]
- 10.Cushing H. The third circulation and its channels (Cameron Lecture). Lancet. 1925;2:851-857. [Google Scholar]
- 11.Tain RW, Bagci AM, Lam BL, Sklar EM, Ertl-Wagner B, Alperin N. Determination of cranio-spinal canal compliance distribution by MRI: methodology and early application in idiopathic intracranial hypertension. J Magn Reson Imaging. 2011;34(6):1397-1404. doi: 10.1002/jmri.22799 [DOI] [PMC free article] [PubMed] [Google Scholar]
- 12.Dobrocky T, Rebsamen M, Rummel C, et al. Monro-Kellie hypothesis: increase of ventricular CSF volume after surgical closure of a spinal dural leak in patients with spontaneous intracranial hypotension. AJNR Am J Neuroradiol. 2020;41(11):2055-2061. doi: 10.3174/ajnr.A6782 [DOI] [PMC free article] [PubMed] [Google Scholar]
- 13.Schmidt RM, Bauer H, Hanzal F, et al. Der Liquor cerebrospinalis. Untersuchungsmethoden und Diagnostik. [ed.] Rudolf Manfred Schmidt: VEB Verlag Volk und Gesundheit, 1968. [Google Scholar]
- 14.Wymer DT, Patel KP, Burke WF III, Bhatia VK. Phase-contrast MRI: physics, techniques, and clinical applications. Radiographics. 2020;40(1):122-140. doi: 10.1148/rg.2020190039 [DOI] [PubMed] [Google Scholar]
- 15.Johnson KM, Markl M. Improved SNR in phase contrast velocimetry with five-point balanced flow encoding. Magn Reson Med. 2010;63(2):349-355. doi: 10.1002/mrm.22202 [DOI] [PMC free article] [PubMed] [Google Scholar]
- 16.Yamada S, Tsuchiya K, Bradley WG, et al. Current and emerging MR imaging techniques for the diagnosis and management of CSF flow disorders: a review of phase-contrast and time–spatial labeling inversion pulse. Am J Neuroradiol. 2015;36(4):623-630. doi: 10.3174/ajnr.a4030 [DOI] [PMC free article] [PubMed] [Google Scholar]
- 17.Wolf K, Hupp M, Friedl S, et al. In cervical spondylotic myelopathy spinal cord motion is focally increased at the level of stenosis: a controlled cross-sectional study. Spinal Cord. 2018;56:769-776. doi: 10.1038/s41393-018-0075-1 [DOI] [PubMed] [Google Scholar]
- 18.Wolf K, Reisert M, Beltrán SF, et al. Focal cervical spinal stenosis causes mechanical strain on the entire cervical spinal cord tissue—a prospective controlled, matched-pair analysis based on phase-contrast MRI. NeuroImage Clin. 2021;30:102580. doi: 10.1016/j.nicl.2021.102580 [DOI] [PMC free article] [PubMed] [Google Scholar]
- 19.Jung B, Ullmann P, Honal M, Bauer S, Hennig J, Markl M. Parallel MRI with extended and averaged GRAPPA kernels (PEAK-GRAPPA): optimized spatiotemporal dynamic imaging. J Magn Reson Imaging. 2008;28(5):1226-1232. doi: 10.1002/jmri.21561 [DOI] [PubMed] [Google Scholar]
- 20.nora-imaging [Online]. 2022. nora-imaging.org [Google Scholar]
- 21.Zhao B, Zhang X, Li Z, Hu X. A multi-scale strategy for deep semantic segmentation with convolutional neural networks. Neurocomputing. 2019;365:273-284. doi: 10.1016/j.neucom.2019.07.078 [DOI] [Google Scholar]
- 22.Herráez MA, Burton DR, Lalor MJ, Gdeisat MA. Fast two-dimensional phase-unwrapping algorithm based on sorting by reliability following a noncontinuous path. Appl Opt. 2002;41(35):7437-7444. doi: 10.1364/ao.41.007437 [DOI] [PubMed] [Google Scholar]
- 23.Kasim MF. Fast 2D Phase Unwrapping Implementation in MATLAB. GitHub Inc.; 2017. GitHub [Online]. github.com/mfkasim91/unwrap_phase/https://github.com/mfkasim1/unwrap_phase [Google Scholar]
- 24.Dobrocky T, Grunder L, Breiding PS, et al. Assessing spinal cerebrospinal fluid leaks in spontaneous intracranial hypotension with a scoring system based on brain magnetic resonance imaging findings. JAMA Neurol. 2019;76(5):580-587. doi: 10.1001/jamaneurol.2018.4921 [DOI] [PMC free article] [PubMed] [Google Scholar]
- 25.Luetzen N, Dovi-Akue P, Fung C, Beck J, Urbach H. Spontaneous intracranial hypotension: diagnostic and therapeutic workup. Neuroradiology. 2021;63(11):1765-1772. doi: 10.1007/s00234-021-02766-z [DOI] [PMC free article] [PubMed] [Google Scholar]
- 26.Koo TK, Li MY. A guideline of selecting and reporting intraclass correlation coefficients for reliability research. J Chiropractic Med. 2016;201615(42):16346155-16346163. doi: 10.1016/j.jcm.2016.02.012 [DOI] [PMC free article] [PubMed] [Google Scholar]
- 27.Yildiz S, Thyagaraj S, Jin N, et al. Quantifying the influence of respiration and cardiac pulsations on cerebrospinal fluid dynamics using real-time phase-contrast MRI. J Magn Reson Imaging. 2017;46(2):431-439. doi: 10.1002/jmri.25591 [DOI] [PubMed] [Google Scholar]
- 28.Lindstrøm EK, Schreiner J, Ringstad GA, Haughton V, Eide PK, Mardal KA. Comparison of phase-contrast MR and flow simulations for the study of CSF dynamics in the cervical spine. Neuroradiol J. 2018;31(3):292-298. doi: 10.1177/1971400918759812 [DOI] [PMC free article] [PubMed] [Google Scholar]
- 29.Haughton V, Mardal KA. Spinal fluid biomechanics and imaging: an update for neuroradiologists. Am J Neuroradiol. 2014;35(10):1864-1869. doi: 10.3174/ajnr.A4023 [DOI] [PMC free article] [PubMed] [Google Scholar]
- 30.Winklhofer S, Schoth F, Stolzmann P, et al. Spinal cord motion: influence of respiration and cardiac cycle. RoFo Fortschritte auf dem Gebiete der Rontgenstrahlen und der Nuklearmedizin. 2014;186(11):1016-1021. doi: 10.1055/s-0034-1366429 [DOI] [PubMed] [Google Scholar]
- 31.Farb RI, Nicholson PJ, Peng PW, et al. Spontaneous intracranial hypotension: a systematic imaging approach for CSF leak localization and management based on MRI and digital subtraction myelography. Am J Neuroradiol. 2019;40(4):745-753. doi: 10.3174/ajnr.A6016 [DOI] [PMC free article] [PubMed] [Google Scholar]
- 32.Metafratzi Z, Argyropoulou MI, Mokou-Kanta C, Konitsiotis S, Zikou A, Efremidis SC. Spontaneous intracranial hypotension: morphological findings and CSF flow dynamics studied by MRI. Eur Radiol. 2004;14(6):1013-1016. doi: 10.1007/s00330-003-2136-9 [DOI] [PubMed] [Google Scholar]
- 33.Hasiloglu ZI, Albayram S, Gorucu Y, et al. Assessment of CSF flow dynamics using PC-MRI in spontaneous intracranial hypotension. Headache. 2012;52(5):808-819. doi: 10.1111/j.1526-4610.2012.02150.x [DOI] [PubMed] [Google Scholar]
- 34.Tung H, Liao YC, Wu CC, et al. Usefulness of phase-contrast magnetic resonance imaging for diagnosis and treatment evaluation in patients with SIH. Cephalalgia. 2014;34(8):584-593. doi: 10.1177/0333102413519513 [DOI] [PubMed] [Google Scholar]
- 35.Tsai YH, Chen HC, Tung H, et al. Noninvasive assessment of intracranial elastance and pressure in spontaneous intracranial hypotension by MRI. J Magn Reson Imaging. 2018;48(5):1255-1263. doi: 10.1002/jmri.25976 [DOI] [PubMed] [Google Scholar]
Associated Data
This section collects any data citations, data availability statements, or supplementary materials included in this article.
Data Availability Statement
Anonymized data not provided in the article may be shared at the request of any qualified investigator for purposes of replicating procedures and results.


