Abstract
Background and Objectives
Plasma phosphorylated tau at threonine 181 (p-tau181), a well-validated marker of Alzheimer disease (AD) pathologic change, could be a more efficient way to diagnose AD than invasive or expensive biomarkers requiring CSF or PET. In some individuals, neuropsychiatric symptoms (NPS) are the earliest manifestation of AD, observed in advance of clear cognitive decline. However, the few studies assessing AD biomarkers in association with NPS have often had imprecision in capturing behavioral symptoms that represent sequelae of neurodegenerative disease. Thus, the mild behavioral impairment (MBI) construct was developed, framing NPS in a way to improve the precision of risk estimates for disease. MBI core criteria stipulate that NPS emerge de novo in later life and persist for at least 6 months. Here, cross-sectionally and longitudinally, we investigated associations of MBI with p-tau181, neuropsychological test performance, and incident AD.
Methods
Cognitively unimpaired and mild cognitive impairment (MCI) Alzheimer's Disease Neuroimaging Initiative participants were selected. MBI status was derived from the Neuropsychiatric Inventory (NPI) using a published algorithm. NPI total scores at baseline and year 1 visits were used to operationalize MBI (score >0 at both visits), NPS not meeting the MBI criteria (NPS-not-MBI, score >0 at only 1 visit), and no NPS (score = 0 at both visits). Linear regressions were fitted for cross-sectional analyses; multilevel linear mixed-effects and Cox proportional hazards models were implemented to examine the longitudinal associations of MBI with changes in p-tau181 and cognition and incident dementia.
Results
The sample included 571 participants (age 72.2 years, 46.8% female, 64.8% MCI). Cross-sectionally (β = 8.1%, 95% CI 1.4%–15.2%, p = 0.02), MBI was associated with higher plasma p-tau181 levels compared with no NPS; NPS-not-MBI was not. Longitudinally, MBI was associated with higher p-tau181 (β = 0.014%, 95% CI 0.003–0.026, p = 0.02), in addition to a decline in memory and executive function. Survival analyses demonstrated a 3.92-fold greater dementia incidence in MBI, with no significant differences between NPS-not-MBI and no NPS.
Discussion
These findings extend the evidence base that MBI is associated with elevated risk of cognitive decline and dementia and a sequela of emerging Alzheimer-related proteinopathies. MBI offers a substantial improvement over current approaches that explore behavior as a proxy marker for Alzheimer-related proteinopathies, with both clinical and AD trial enrichment implications.
Alzheimer disease (AD) dementia develops over a range of clinical stages, associated with pathologic progression and clinical symptoms. Identifying AD at earlier stages is essential for disease-modifying drug discovery to administer therapies earlier to prevent or delay cognitive decline. As per the National Institute of Aging-Alzheimer's Association (NIA-AA) Framework, stages 1 and 2 on the AD continuum represent preclinical disease; stage 1 is an asymptomatic phase with objectively normal cognition and stage 2 subtle impairment and/or subjective concerns. Stage 3 represents prodromal disease with impaired cognition but maintained functional independence.1 Although cognition is the core feature in stages 2 and 3, mild neurobehavioral changes may coexist, and according to the NIA-AA Framework, the primary complaint may be behavioral rather than cognitive.1 These behavioral changes may offer an accessible opportunity for earlier detection. Mild behavioral impairment (MBI) is a neurobehavioral syndrome characterized by later-life emergent and persistent neuropsychiatric symptoms (NPS) as a high-risk state for incident cognitive decline and dementia.3,4 MBI is associated with cognitive decline and progression to MCI and dementia5,‐,10 and is represented in stages 2 and 3 of the NIA-AA Framework as “mild, recent onset behavioral symptoms… which persist and cannot be explained by life events.” MBI core criteria stipulate that NPS emerge in later life and persist for ≥6 months,4 increasing the likelihood that symptoms represent sequelae of neurodegenerative disease, rather than responses to events independent of the underlying neurodegenerative process.
To confirm the diagnostic and prognostic utility of MBI as a preclinical/prodromal AD marker, exploring associations with known neurobiological changes in preclinical/prodromal disease is essential. MBI in dementia-free older adults has been associated with CSF β-amyloid (Aβ),11 CSF p-tau, tau-PET,12 and neurodegeneration,13–15 consistent with the amyloid/tau/neurodegeneration (A/T/N) model of AD.1,16 Although CSF and PET biomarkers have enabled the in vivo detection of disease, high cost, invasiveness, and poor access limit their use in clinical screening and trials.17 Recent evidence supports the use of blood-based biomarkers as accessible and cost-effective alternatives for screening for AD pathologies. Plasma phosphorylated tau at threonine 181 (p-tau181) is an AD-specific blood-based biomarker strongly associated with the A/T/N profile of AD, with remarkable sensitivity in predicting emerging cognitive decline and AD.18–20 Plasma p-tau181 has demonstrated greater precision than previously established plasma biomarkers (Aβ42/Aβ40,21 neurofilament light [NfL],22 and total tau23) in predicting progression to AD dementia.18
Although MBI has been associated with changes in plasma Aβ and NfL,24,25 the associations between MBI and plasma p-tau181 as an early marker of disease remain unclear.18 Our aim was to determine whether inexpensive and scalable clinical assessments could serve as simple-to-administer proxy markers for tauopathy. Thus, in addition to cognitive risk, we determined whether superimposed stratification by MBI status could (1) cross-sectionally improve detection of prevalent preclinical and prodromal AD and (2) longitudinally predict increasing p-tau, declining cognition, and incident AD dementia. We hypothesized that MBI would be associated with higher p-tau181 and greater cognitive decline and dementia incidence compared with conventional approaches to NPS measurement. The implications are that if MBI were an early-stage AD marker, it might be leveraged to help clinicians determine what workup is required, assist clinical trialists reduce screen failures with sample enrichment for biomarker positivity, and potentially aid public health efforts to determine prevalence and risk.3,24,26
Methods
Participants
Participants were from the Alzheimer's Disease Neuroimaging Initiative (ADNI: adni.loni.usc.edu). The ADNI is a nonrandomized natural history nontreatment study launched in 2003 as a public-private partnership, led by Principal Investigator Michael W. Weiner, MD. The ADNI started recruiting participants in 2004 at 50 study sites across North America. Participants were followed up at regular intervals from baseline. Baseline MCI participants were followed up every 6 months for the first 3 years and then yearly thereafter. Baseline normal participants were followed up every 6 months for the first year and then yearly thereafter. The ADNI has the following participant inclusion criteria: Hachinski Ischemic score ≤4; age 55–90 years; Geriatric Depression Scale score <6; adequate visual and auditory acuity for neuropsychological testing; good general health with no diseases precluding enrollment; and minimum sixth-grade education. Tracking the rate of conversion from normal cognition to MCI and MCI to AD is a primary outcome measure of the ADNI protocol. The ADNI Conversion Committee reviews individual participant reports and provides a consensus diagnosis. Details of clinical diagnoses have been previously described elsewhere.27
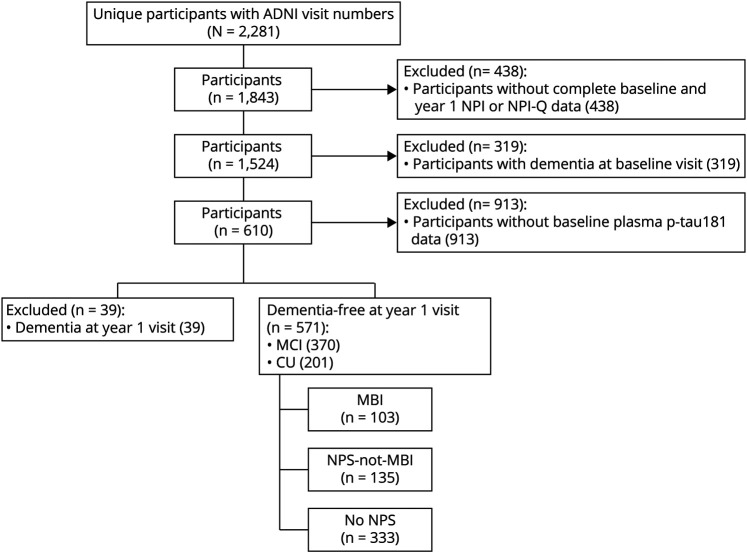
Based on ADNI clinical diagnoses, cognitively unimpaired (CU) participants or those with MCI were included in the sample. Participants with MCI at baseline who progressed to AD dementia at year 1 were classified as AD and not included in the analysis. Only participants with available Neuropsychiatric Inventory (NPI) or NPI Questionnaire (NPI-Q) data at baseline and 1-year visit were included in the study, as this information was required to determine MBI status based on 2 time points. Figure 1 illustrates the step-by-step process for participant inclusion/exclusion.
Figure 1. Flowchart Illustrating the Step-by-Step Process of Inclusion/Exclusion Criteria of the Present Study.
ADNI = Alzheimer's Disease Neuroimaging Initiative; CU = cognitively unimpaired; MBI = mild behavioral impairment; MCI = mild cognitive impairment; NPI = Neuropsychiatric Inventory; NPI-Q = Neuropsychiatric Inventory Questionnaire; NPS = neuropsychiatric symptoms.
NPS Operationalization
The primary measure was MBI, operationalized as persistent NPS at baseline and 1 year captured by the NPI28 and NPI-Q.29 Previous research has used the NPI/NPI-Q to determine MBI status using a mapping algorithm.6,30 The 5 domains of MBI incorporate 10 items of the NPI/NPI-Q as follows: (1) decreased motivation (apathy/indifference); (2) emotional dysregulation (depression/dysphoria, anxiety, and elation/euphoria); (3) impulse dyscontrol (agitation/aggression, irritability/lability, and aberrant motor behavior); (4) social inappropriateness (disinhibition); and (5) abnormal perception or thoughts (delusions and hallucinations). MBI total scores are then obtained by summing the scores from the 5 transformed MBI domains to give a total score of 0–30. MBI criteria require symptom persistence for at least 6 months. However, because NPI and NPI-Q both have a reference frame of 4 weeks, NPS status across 2 consecutive visits was used to assess symptom persistence in the present study. Transformed NPS total scores from baseline and 1-year visits were used to describe NPS profiles. A transformed NPS total score >0 at both baseline and 1-year visit was classified as persistent NPS (i.e., MBI); an NPS score >0 at only 1 visit was considered transient NPS (i.e., NPS-not-MBI), and NPS reported at neither visit was classified as no NPS.
Plasma Measurements
Annually sampled plasma p-tau181 measurements were performed using single molecule array technology, as previously described.19 Participants with missing p-tau181 data were excluded from the study. Participants with and without available p-tau181 data did not differ in terms of NPS profiles.
Neuropsychological Assessment
The Rey Auditory Verbal Learning Test (RAVLT)31 was used to assess episodic memory. The RAVLT measures of interest to the longitudinal models included scores in immediate recall, learning, and delayed recall captured as percent forgetting. Scores in the Trail Making B test were used to assess executive function. Details about each of these neuropsychological tests and their implementation in the ADNI have been previously described elsewhere.32
Statistical Analysis
All statistical analyses were performed in RStudio v1.2.5033. Plasma p-tau181 values were log transformed due to skewness. Univariate tests were used to identify significant differences in demographic variables across NPS groups. The p values were calculated based on 2-sample t tests for continuous variables and the χ2 test for categorical variables. A violin plot of the distribution of the log-transformed plasma p-tau181 values per NPS category was produced using the ggplot package.
Linear regression models were fitted to test the cross-sectional association between NPS profiles as independent variable (exposure) and p-tau181 levels as the dependent variable (outcome) adjusted for age, sex, education, Mini-Mental State Examination (MMSE) score, and NPS instrument (NPI, NPI-Q, or both). T-statistics were used to test for statistical significance. Linear regression assumptions were tested using the ggfortify package in R.
Longitudinal analyses used multilevel linear mixed-effect (MLME) models to assess the associations over 4 years between NPS changes and plasma p-tau181 levels and between NPS changes and performance on neuropsychological tests. For the first MLME model, annual measures of plasma p-tau181 over 4 years were considered outcome variables, with concurrent measures of NPS over 4 years as predictor variables. Additional model covariates included age, sex, years of education, MMSE, and NPS instrument. Then, a series of 4 MLME models were implemented to assess the associations over 4 years between NPS changes and performance on (1) RAVLT immediate recall, (2) RAVLT learning, (3) RAVLT percent forgetting, and (4) Trail Making B. Additional covariates for each of the 4 models included age, sex, years of education, MMSE, and NPS instrument. For all MLME models, the longitudinal change in NPS was operationalized as a time-varying covariate for between- and within-person effects, as per previously published methods.33 Annual measures of NPS over 4 years were captured at 2 levels to inform about both the within-person fluctuations of NPS (NPS-not-MBI) and the persistent between-person NPS differences (MBI). NPS severity across all visits of a single participant compared with all other study participants was considered persistent NPS (i.e., MBI), defined as the mean NPS total score across all visits for each participant. Visit-to-visit changes in NPS that occurred within a single participant over time were considered within-person variability (i.e., NPS-not-MBI), defined as the NPS total score per visit minus the average score across all visits for that participant. T-statistics tested for significance in all MLME models using the Satterthwaite method.
To explore the associations of MBI with risk of dementia, Kaplan-Meier survival curves were generated, comparing dementia-free survival across NPS profiles, with log-rank tests applied to assess between-group differences. Furthermore, a Cox proportional hazards model was implemented to examine the associations between NPS profiles and the risk of dementia, while controlling for baseline age, sex, education, and MMSE score. An additional Cox proportional hazards model was implemented to explore potential interactions between NPS profiles and dichotomized plasma p-tau181 levels based on a published threshold of 17.7 pg/mL for this assay in the ADNI.19 For this exploratory interaction analysis, a categorical variable was defined based on NPS profiles at each stratum of p-tau181 status (positive or negative). The Wald test was used to test for significance in Cox models. The survival package of R was used to implement survival and Cox analyses, and proportional hazard assumptions were tested using the cox.zph function of R.
Standard Protocol Approvals, Registrations, and Patient Consents
All ADNI participants provided informed consent to participate in the study, and the ethics committee approval to conduct this study was received at contributing ADNI sites.
Data Availability
All data used in preparing this article are publicly available on request from the ADNI platform (adni.loni.usc.edu/).
Results
Demographic Characteristics
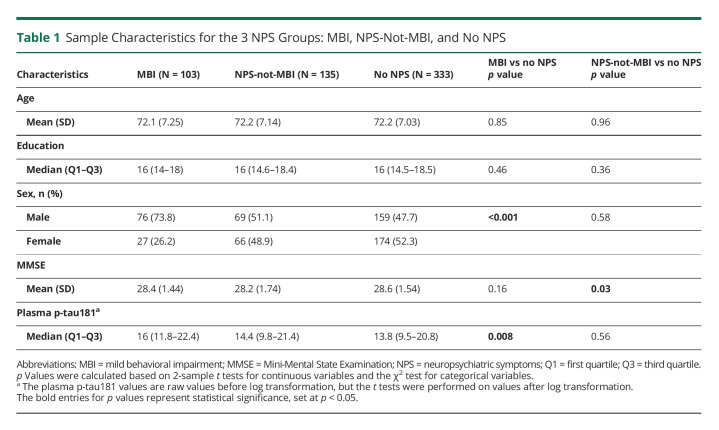
Of the 571 participants included in the study, 201 were CU, and 370 had MCI. Across the entire sample, 103 participants had MBI, 135 had NPS-not-MBI, whereas 333 had no NPS. No significant difference was found between the MBI and no NPS groups in terms of age, years of education, or MMSE score. However, differences were found for sex (p < 0.001) and plasma p-tau181 levels (p = 0.008). The MBI group had a lower percentage of females than no NPS (26.2% females in MBI vs 52.3% in no NPS). Compared with no NPS, plasma p-tau181 levels were higher in MBI (median [interquartile range] 16 [10.6] in MBI vs 13.8 [11.3] in no NPS). Figure 2 illustrates a violin plot of the distribution of unadjusted log-transformed plasma p-tau181 values at baseline across NPS categories, along with the median, 25th, and 75th percentiles marked in blue. No significant difference was found between NPS-not-MBI and no NPS in terms of age, years of education, sex, or plasma p-tau181 levels. The mean MMSE score did differ, with the NPS-not-MBI group having a lower mean MMSE score than no NPS (28.2 ± 1.74 for NPS-not-MBI vs 28.6 ± 1.54 for no NPS, p = 0.03). See Table 1 for detailed sample characteristics and univariate comparisons.
Figure 2. Violin Plot of the Distribution of Unadjusted Log-Transformed Plasma p-tau181 Values at Baseline Across NPS Categories.
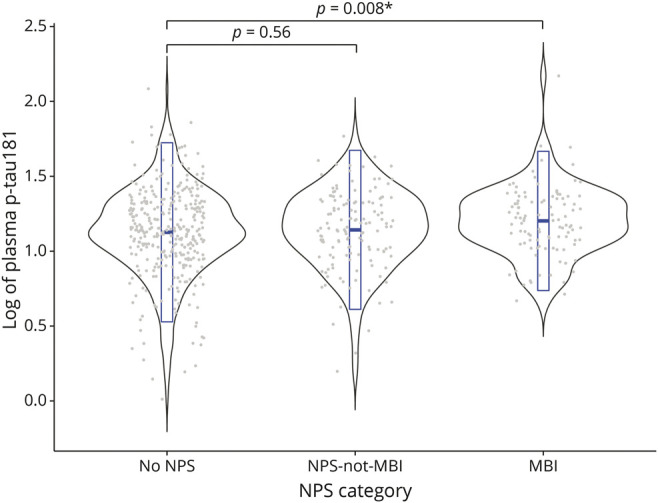
In each NPS category, gray dots represent individual data points of log-transformed p-tau181 values, and the embedded box plot in blue represents the median, 25th, and 75th percentiles. MBI = mild behavioral impairment; NPS = neuropsychiatric symptoms.
Table 1.
Sample Characteristics for the 3 NPS Groups: MBI, NPS-Not-MBI, and No NPS
Cross-sectional Association of MBI and Plasma P-Tau181
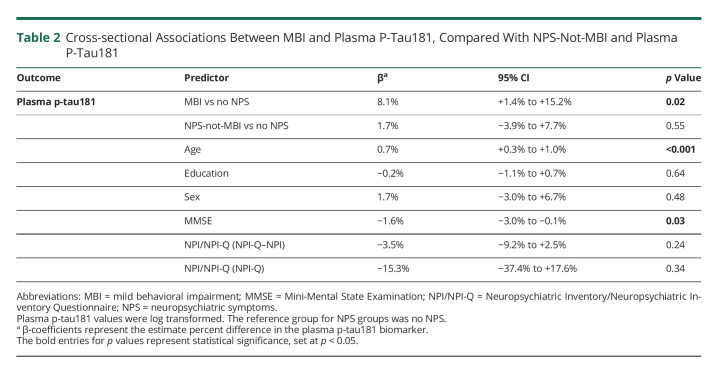
Participants with MBI at baseline had 8.1% higher baseline levels of plasma p-tau181 (95% CI 1.4%–15.2%, p = 0.02) compared with no NPS after multivariable adjustment. NPS-not-MBI was not associated with a difference in p-tau181 levels compared with no NPS (β = 1.7%, 95% CI −3.9% to 7.7%, p = 0.55) (Table 2). Among other covariates, baseline age and MMSE score were also associated with baseline levels of plasma p-tau181. Older participants had higher plasma p-tau181 levels (β = 0.7%, 95% CI 0.3%–1.0%, p < 0.001), and lower MMSE scores were associated with higher plasma p-tau181 (β = −1.6%, 95% CI −3.0% to −0.1%, p = 0.03).
Table 2.
Cross-sectional Associations Between MBI and Plasma P-Tau181, Compared With NPS-Not-MBI and Plasma P-Tau181
Longitudinal Association of MBI With Changes in Plasma P-Tau181
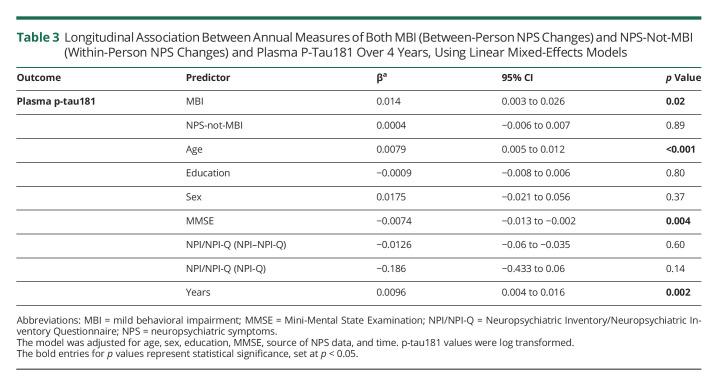
Adjusted MLME models revealed that MBI was associated with increasing levels of plasma p-tau181, both measured annually over 4 years (β = 0.014, 95% CI 0.003 to 0.026, p = 0.02). However, NPS-not-MBI was not associated with any significant changes in p-tau181 levels (β = 0.0004, 95% CI −0.006 to 0.007, p = 0.89). Moreover, higher levels of plasma p-tau181 over 4 years were associated with lower MMSE scores over 4 years (β = −0.007, 95% CI −0.013 to −0.002, p = 0.004) (Table 3). eFigure 1 (links.lww.com/WNL/C461) illustrates changes in raw plasma p-tau181 levels (log transformed) over 4 years across NPS groups (no NPS, NPS-not-MBI, and MBI), showing that although p-tau181 levels were increasing over 4 years in each NPS group, levels were the highest within the MBI group.
Table 3.
Longitudinal Association Between Annual Measures of Both MBI (Between-Person NPS Changes) and NPS-Not-MBI (Within-Person NPS Changes) and Plasma P-Tau181 Over 4 Years, Using Linear Mixed-Effects Models
Longitudinal Association of MBI With Changes in Memory and Executive Function
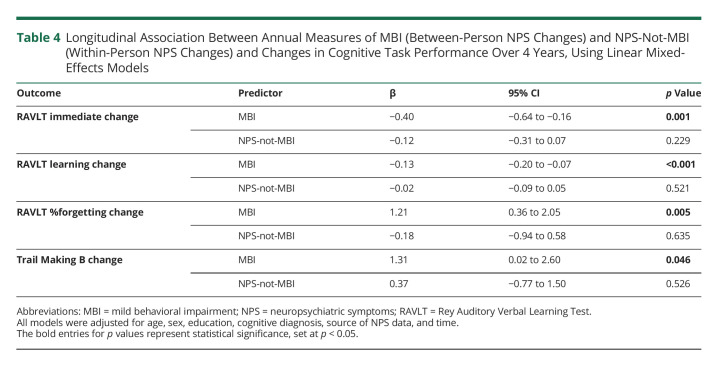
Adjusted MLME models with change in neuropsychological test performance over 4 years as the outcome measure revealed that MBI was associated with decline in the RAVLT immediate recall score (β = −0.4, 95% CI −0.64 to −0.16, p = 0.001) and RAVLT learning score (β = −0.13, 95% CI −0.2 to −0.07, p < 0.001) and an increase in the RAVLT percent forgetting (β = 1.21, 95% CI 0.36 to 2.05, p = 0.005) and Trail Making B completion time (β = 1.31, 95% CI 0.02 to 2.6, p = 0.046). NPS-not-MBI was not associated with any significant changes in cognitive performance in any of the neuropsychological tests examined (Table 4).
Table 4.
Longitudinal Association Between Annual Measures of MBI (Between-Person NPS Changes) and NPS-Not-MBI (Within-Person NPS Changes) and Changes in Cognitive Task Performance Over 4 Years, Using Linear Mixed-Effects Models
Longitudinal Association of MBI and Incident Dementia
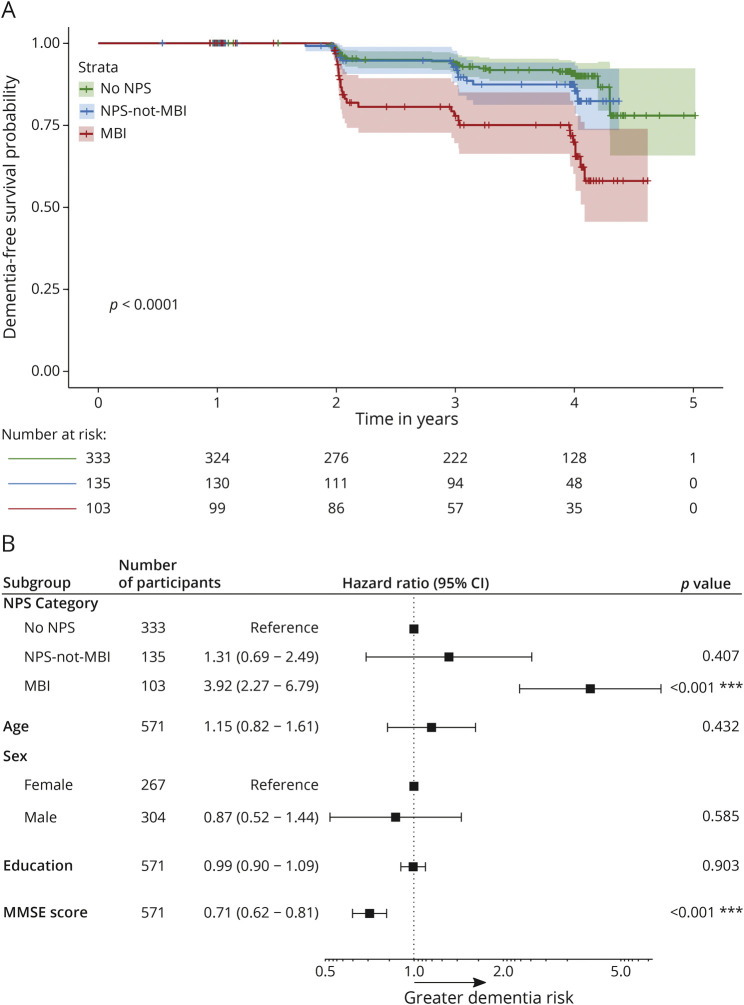
In total, 70 participants progressed to dementia over 5 years (mean follow-up year: 3.2), all diagnosed with AD dementia. Compared with no NPS and NPS-not-MBI, the dementia-free survival was the lowest in MBI (p < 0.0001). No significant differences were found between NPS-not-MBI and no NPS (Figure 3A). Similar findings were demonstrated by the adjusted Cox models. Participants with MBI at baseline had a greater risk of dementia compared with those with no NPS (hazard ratio [HR] 3.92, 95% CI 2.27 to 6.79, p < 0.001), while adjusting for baseline age, sex, education, and MMSE score. The hazard for dementia in participants with NPS-not-MBI did not significantly differ from no NPS (HR 1.31, 95% CI 0.69 to 2.49, p = 0.407). Among other model covariates, higher MMSE scores were associated with lower dementia risk (adjusted HR 0.71, 95% CI 0.62 to 0.81, p < 0.001) (Figure 3B). Interaction analyses between NPS profiles and p-tau181 status revealed that in p-tau181–positive participants, MBI was associated with 2.56 times greater dementia incidence (95% CI 1.28–5.12, p = 0.008) compared with p-tau181–positive status with no NPS. NPS-not-MBI in p-tau181–positive participants was not significantly associated with greater dementia incidence (HR 1.43, 95% CI 0.69 to 2.94, p = 0.34), compared with those with no NPS and positive p-tau181 status (eFigure 2, links.lww.com/WNL/C461).
Figure 3. Kaplan-Meier Survival Curves and Adjusted Hazard Ratios for Dementia Across NPS Categories.
(A) Dementia-free survival curves across NPS categories: no NPS, NPS-not-MBI, and MBI. (B) Forest plot of adjusted hazard ratios for dementia across NPS categories. Error bars represent the 95% CIs. MBI = mild behavioral impairment; MMSE = Mini-Mental State Examination; NPS = neuropsychiatric symptoms.
Discussion
Both cross-sectionally and longitudinally, the presence of MBI in older adults with normal cognition or MCI was associated with higher plasma p-tau181 levels. No difference in levels of p-tau181 was found in those with NPS-not-MBI. MBI was also longitudinally associated with decline in episodic memory and executive function, lower dementia-free survival, and 3.92 times greater risk for AD dementia. Our results extend the evidence base linking MBI with AD biomarkers,11–15,25 supporting the notion that MBI can be a sequela of emerging AD proteinopathies across the disease continuum and a core feature of the AD process even in the absence of cognitive impairment.
In recent years, blood-based biomarkers have provided a feasible alternative for in vivo detection of AD, overcoming the accessibility, cost, and invasiveness issues surrounding PET and CSF biomarkers.34,35 Previously, several other blood-based plasma biomarkers have been investigated as potential AD biomarkers.36 The plasma Aβ42/Aβ40 ratio is a successful plasma measure of cerebral Aβ pathology,37 but differences in plasma are smaller than those observed in CSF, likely due to the peripheral expression of Aβ.38 That said, a recent publication did describe an association between lower Aβ42/Aβ40 ratio and higher MBI score in an ADNI sample of CU and MCI participants.24 NfL, a marker of axonal injury, is a proxy for neurodegeneration and while not specific for AD, NfL is a marker of faster decline and progression to dementia among patients with AD; it can represent the N of the A/T/N framework. One recent study has reported an association between 2-year change in plasma NfL and MBI status.25 More recently, plasma p-tau181 was found to accurately differentiate AD from other neurodegenerative diseases.35,39,40 Higher levels of plasma p-tau181 are associated with Aβ and tau pathologies and imminent brain atrophy across the AD continuum.18,20 Despite the previous studies identifying strong associations between MBI and higher plasma NfL25 and lower plasma Aβ42/Aβ40 ratio,24 the associations of plasma p-tau181 levels with MBI as a noncognitive early marker of the disease are largely unexplored The present study demonstrated that both cross-sectionally and longitudinally, MBI in dementia-free older adults is associated with higher levels of plasma p-tau181.
Past literature on the associations between CSF p-tau181 and NPS has been inconclusive, possibly because transient and persistent NPS were not discriminated, with the former more likely to be a response to life events and the latter neurodegenerative disease. A systematic review of 21 studies on CSF correlates of NPS across the AD continuum confirmed this notion, showing that most studies found no associations between NPS and CSF p-tau181.41 One study reported a longitudinal association between CSF p-tau181 and increasing NPI-Q scores in cognitively normal older adults42 and another found an association between CSF p-tau181 and apathy captured using the Apathy Scale in mild AD.43 In the present study of dementia-free older adults, MBI, characterized by a new-onset persistent NPS profile, was cross-sectionally associated with higher levels of plasma p-tau181.
Longitudinally, only MBI (the between-person NPS difference factor) was associated with increasing levels of plasma p-tau181 over 4 years, whereas NPS-not-MBI (the within-person NPS variability factor) was not. The between-person NPS measure captures interindividual differences by comparing the mean NPS severity of each participant to that of the group. This measure represents prominent and persistent NPS change over time, consistent with MBI criteria, more likely to represent behavioral sequelae of neurodegenerative disease. In contrast, the within-person NPS measure captures NPS variability or impersistence over time within a single participant. The within-person NPS changes may reflect transient, fluctuating, or reactive NPS manifesting due to life events, change, or other medical conditions, independent of the underlying neurodegenerative disease processes.
MBI was also longitudinally associated with 4-year decline in memory, captured by performance in RAVLT battery of neuropsychological tests, and executive function, captured by Trail Making B completion time. NPS-not-MBI showed no significant association with changes in performance in any test over this 4-year period. These findings are consistent with the previous literature on the cognitive profile of MBI.5,9 Memory and executive deficits have been observed in early AD,44,45 and earlier detection of these deficits could help identify an at-risk population for AD. Our findings demonstrate that capturing later-life persistent NPS as per the MBI criteria provides an accessible means for identifying memory and executive deficits earlier in the disease course and identifying those at risk for greater decline in memory and executive function over time. Similarly, our Cox analyses demonstrated that individuals with MBI had a 3.92-fold greater risk for AD compared with those with no NPS, whereas NPS-not-MBI was not associated with greater risk. In our interaction analyses, MBI in p-tau181–positive participants was associated with 2.56 times greater dementia incidence, whereas no significant association was found with NPS-not-MBI. This finding indicates that even in the presence of plasma p-tau181 positivity, a robust biomarker of AD risk, capturing emergent and persistent NPS identifies the stratum of individuals at even greater risk for AD dementia. These findings further validate the utility of assessing the later-life emergence of persistent NPS, a core criterion of MBI, for predicting future cognitive decline and AD dementia. Consistent with NPS-not-MBI, transient or reactive NPS may reflect short-term adjustment to life events rather than the chronic effects of neurodegeneration. Thus, NPS not meeting the MBI criteria may be less specific for neurodegenerative diseases such as AD.
Aβ deposition in the brain has been considered the central event in AD pathology. However, recent findings indicate that tauopathy may indeed precede amyloidosis and tau may be the main factor underlying the development and progression of AD.46–48 MBI is associated with changes in plasma Aβ,24 and the present findings illustrate that MBI is also associated with changes in plasma p-tau181. These findings add to the evidence base supporting MBI as a potential proxy marker for AD proteinopathies in preclinical and prodromal disease; however, the order of events between amyloidopathy and tauopathy cannot be elucidated from these findings because they were derived from a mixed sample of CU and MCI. Future studies could explore the longitudinal associations of MBI with p-tau and Aβ in a CU population to clarify the pathologic development and behavioral changes in the preclinical stages of AD. Nonetheless, our findings add to the body of evidence linking MBI and AD proteinopathies by providing evidence for plasma p-tau181 as an additional biomarker correlate of MBI. Given the association between plasma p-tau181, neurofibrillary tangles, and Aβ aggregates,49 MBI can be considered a proxy marker for AD risk and an accessible approach to identify those with a higher likelihood of having in vivo markers of AD at stage 2 (preclinical) and stage 3 (prodromal) disease.1 Incorporating MBI assessment in population-based studies can increase the likelihood of detecting CU individuals or those with MCI who are at high risk of developing AD. Alternatively, given the ease of determining MBI status, even remotely, this can be an inexpensive and scalable first step in dementia detection, with the MBI group flagged for further clinical and/or biomarker assessment to determine AD status. Both approaches are suitable for AD clinical trial enrichment to increase screening efficiency and decrease cost.26
In the present study, the APOE-ε4 carrier status was not accounted for in any of the statistical models. Although APOE-ε4 is an important risk marker for AD,50 and likely a contributor to variation in modeling dementia biomarkers,51 the aim of our study was not to determine the optimal multimodal marker combination to predict AD. The present study aimed to determine whether assessing MBI in conjunction with cognitive status at baseline could improve detection of preclinical and prodromal AD, with this efficient combined risk marker determined by simple-to-administer clinical assessments in the absence of imaging and biomarker studies. Clinical decisions could then be informed by this risk status. Thus, in this context, the inclusion of multiple baseline biomarkers such as APOE as predictors of prevalent p-tauopathy would be antithetical to the study design and distract from the simple clinical objective of providing evidence for the utility of MBI as an additional proxy marker for p-tau risk.
A limitation of the present study is the use of the NPI/NPI-Q to operationalize MBI. The NPI/NPI-Q has a reference range of 4 weeks, thereby not meeting the MBI criterion of symptom persistence for at least 6 months. Thus, 2 time points were used out of necessity but do not necessarily capture changes that persisted beyond the 4-week reference range of NPI/NPI-Q. Furthermore, the NPI-Q does not fully represent all the symptoms and domains in MBI. Another limitation of requiring 2 visits to determine MBI status is that participants who progressed to AD dementia at the second visit were excluded, as MBI is defined as a predementia construct. Potentially, some of the participants who progressed to AD dementia at the second visit could have had MBI, with their exclusion decreasing the magnitude of the association of MBI with incident dementia. These limitations could have been mitigated through use of the MBI checklist (MBI-C).52,53 The MBI-C is a validated scale that operationalizes measurement of MBI in accordance with the International Society to Advance Alzheimer's Research and Treatment–Alzheimer's Association MBI criteria. The MBI-C has a 6-month reference range and is explicit that only later-life emergent and persistent NPS are considered, allowing MBI status to be determined at a single visit. The MBI-C was developed for use in functionally independent community-dwelling older adults, and also accurately represents the 5 MBI domains of impaired drive and motivation, affective dysregulation, impulse dyscontrol, social inappropriateness, and psychotic symptoms, missing fewer symptoms and having greater sensitivity for the MBI syndrome. The MBI-C as an NPS assessment scale has not yet been incorporated in cohorts such as the ADNI, but once more broadly available, future studies can use this measure to determine MBI status more accurately and to explore the MBI domains.
Both cross-sectionally and longitudinally, MBI in CU and MCI older adults was associated with higher plasma p-tau181 levels. In addition, MBI was longitudinally associated with greater decline in memory and executive function and higher risk for dementia. These findings add to the burgeoning evidence showing that reframing NPS in the context of MBI provides an accessible and clinically relevant approach to better detect at-risk individuals for cognitive decline and dementia. MBI could serve as a proxy marker for underlying AD neuropathology. Incorporating MBI into clinical screening may help to identify those with preclinical or prodromal AD.
Glossary
- Aβ
β-amyloid
- AD
Alzheimer disease
- ADNI
Alzheimer's Disease Neuroimaging Initiative
- A/T/N
amyloid/tau/neurodegeneration
- CU
cognitively unimpaired
- HR
hazard ratio
- MBI
mild behavioral impairment
- MBI-C
MBI checklist
- MLME
multilevel linear mixed effect
- MMSE
Mini-Mental State Examination
- NfL
neurofilament light
- NIA-AA
National Institute of Aging–Alzheimer's Association
- NPI
Neuropsychiatric Inventory
- NPI-Q
NPI Questionnaire
- NPS
neuropsychiatric symptoms
- p-tau181
phosphorylated tau at threonine 181
- RAVLT
Rey Auditory Verbal Learning Test
Appendix 1. Authors

Appendix 2. Coinvestigators

Study Funding
Data collection and sharing for this project was funded by the Alzheimer's Disease Neuroimaging Initiative (ADNI) (NIH grant U01 AG024904) and DOD ADNI (Department of Defense award number W81XWH-12-2-0012). The ADNI is funded by the National Institute on Aging, the National Institute of Biomedical Imaging and Bioengineering, and through generous contributions from the following: AbbVie, Alzheimer's Association, Alzheimer's Drug Discovery Foundation, Araclon Biotech, BioClinica, Inc., Biogen, Bristol-Myers Squibb Company, CereSpir, Inc., Cogstate, Eisai Inc., Elan Pharmaceuticals, Inc., Eli Lilly and Company, Euroimmun, F. Hoffmann-La Roche Ltd. and its affiliated company Genentech, Inc., Fujirebio, GE Healthcare, IXICO Ltd., Janssen Alzheimer Immunotherapy Research & Development, LLC, Johnson & Johnson Pharmaceutical Research & Development LLC, Lumosity, Lundbeck, Merck & Co., Inc., Meso Scale Diagnostics, LLC, NeuroRx Research, Neurotrack Technologies, Novartis Pharmaceuticals Corporation, Pfizer Inc., Piramal Imaging, Servier, Takeda Pharmaceutical Company, and Transition Therapeutics. The Canadian Institutes of Health Research is providing funds to support ADNI clinical sites in Canada. Private sector contributions are facilitated by the Foundation for the NIH (fnih.org). The grantee organization is the Northern California Institute for Research and Education, and the study is coordinated by the Alzheimer's Therapeutic Research Institute at the University of Southern California. ADNI data are disseminated by the Laboratory for Neuro Imaging at the University of Southern California. H. Zetterberg is a Wallenberg Scholar supported by grants from the Swedish Research Council (#2018-02532), the European Research Council (#681712), Swedish State Support for Clinical Research (#ALFGBG-720931), the Alzheimer Drug Discovery Foundation (ADDF), USA (#201809-2016862), the Alzheimer's Disease Strategic Fund and the Alzheimer's Association (#ADSF-21-831376-C, #ADSF-21-831381-C, and #ADSF-21-831377-C), the Olav Thon Foundation, the Erling-Persson Family Foundation, Stiftelsen för Gamla Tjänarinnor, Hjärnfonden, Sweden (#FO2019-0228), the European Union's Horizon 2020 Research and Innovation Programme under the Marie Skłodowska-Curie grant agreement No. 860197 (MIRIADE), and the UK Dementia Research Institute at UCL. Z. Ismail is supported by the Canadian Institutes of Health Research (BCA2633). M. Ghahremani is supported by an award from the Mathison Centre for Mental Health Research & Education at the University of Calgary, Alberta, Canada.
Disclosure
M. Ghahremani, H.-Y. Chen, M. Wang, and E. Smith report no disclosures relevant to this manuscript. H. Zetterberg has served at scientific advisory boards and/or as a consultant for AbbVie, Alector, Annexon, Artery Therapeutics, AZTherapies, CogRx, Denali, Eisai, Nervgen, Pinteon Therapeutics, Red Abbey Labs, Passage Bio, Roche, Samumed, Siemens Healthineers, Triplet Therapeutics, and Wave, has given lectures in symposia sponsored by Cellectricon, Fujirebio, Alzecure, and Biogen, and is a cofounder of Brain Biomarker Solutions in Gothenburg AB (BBS), which is a part of the GU Ventures Incubator Program. Z. Ismail has served at scientific advisory boards and/or consultant to Lundbeck/Otsuka. His institution has received funds from Acadia, Biogen, Roche, and Sunovion. Go to Neurology.org/N for full disclosures.
References
- 2.Jack CR Jr, Bennett DA, Blennow K, et al. NIA-AA Research Framework: toward a biological definition of Alzheimer's disease. Alzheimers Dement. 2018;14(4):535-562. doi: 10.1016/j.jalz.2018.02.018. [DOI] [PMC free article] [PubMed] [Google Scholar]
- 3.Creese B, Ismail Z. Mild behavioral impairment: measurement and clinical correlates of a novel marker of preclinical Alzheimer's disease. Alzheimers Res Ther. 2022;14(1):2. doi: 10.1186/s13195-021-00949-7. [DOI] [PMC free article] [PubMed] [Google Scholar]
- 4.Ismail Z, Smith EE, Geda Y, et al. Neuropsychiatric symptoms as early manifestations of emergent dementia: provisional diagnostic criteria for mild behavioral impairment. Alzheimers Demen. 2016;12(2):195-202. doi: 10.1016/j.jalz.2015.05.017. [DOI] [PMC free article] [PubMed] [Google Scholar]
- 5.Kassam F, Chen H, Nosheny RL, et al. Cognitive profile of people with mild behavioral impairment in Brain Health Registry participants. Int Psychogeriatr. 2022;Feb 8:1-10. doi: 10.1017/S1041610221002878. Online ahead of print. [DOI] [PMC free article] [PubMed] [Google Scholar]
- 6.Ismail Z, McGirr A, Gill S, Hu S, Forkert ND, Smith EE. Mild behavioral impairment and subjective cognitive decline predict cognitive and functional decline. J Alzheimers Dis. 2021;80(1):459-469. doi: 10.3233/JAD-201184. [DOI] [PMC free article] [PubMed] [Google Scholar]
- 7.Taragano FE, Allegri RF, Heisecke SL, et al. Risk of conversion to dementia in a mild behavioral impairment group compared to a psychiatric group and to a mild cognitive impairment group. J Alzheimers Dis. 2018;62(1):227-238. doi: 10.3233/JAD-170632. [DOI] [PubMed] [Google Scholar]
- 8.McGirr A, Nathan S, Ghahremani M, Gill S, Smith EE, Ismail Z. Progression to dementia or reversion to normal cognition in mild cognitive impairment as a function of late onset neuropsychiatric symptoms. Neurology. 2022;98(21):e2132-e2139. doi: 10.1212/WNL.0000000000200256. [DOI] [PMC free article] [PubMed] [Google Scholar]
- 9.Kan CN, Cano J, Zhao X, Ismail Z, Chen CL-H, Xu X. Prevalence, clinical correlates, cognitive trajectories, and dementia risk associated with mild behavioral impairment in Asians. J Clin Psychiatry. 2022;83(3):21m14105. doi: 10.4088/JCP.21m14105. [DOI] [PubMed] [Google Scholar]
- 10.Bateman DR, Gill S, Hu S, et al. Agitation and impulsivity in mid and late life as possible risk markers for incident dementia. Alzheimers Dement (NY). 2020;6(1):e12016. doi: 10.1002/trc2.12016. [DOI] [PMC free article] [PubMed] [Google Scholar]
- 11.Lussier FZ, Pascoal TA, Chamoun M, et al. Mild behavioral impairment is associated with beta-amyloid but not tau or neurodegeneration in cognitively intact elderly individuals. Alzheimers Dement. 2020;16(1):192-199. doi: 10.1002/alz.12007. [DOI] [PMC free article] [PubMed] [Google Scholar]
- 12.Johansson M, Stomrud E, Insel PS, et al. Mild behavioral impairment and its relation to tau pathology in preclinical Alzheimer's disease. Transl Psychiatry. 2021;11(1):76. doi: 10.1038/s41398-021-01206-z. [DOI] [PMC free article] [PubMed] [Google Scholar]
- 13.Matuskova V, Ismail Z, Nikolai T, et al. Mild behavioral impairment is associated with atrophy of entorhinal cortex and hippocampus in a memory clinic cohort. Front Aging Neurosci. 2021;13:643271. doi: 10.3389/fnagi.2021.643271. [DOI] [PMC free article] [PubMed] [Google Scholar]
- 14.Gill S, Wang M, Mouches P, et al. Neural correlates of the impulse dyscontrol domain of mild behavioral impairment. Int J Geriatr Psychiatry. 2021;36(9):1398-1406. doi: 10.1002/gps.5540. [DOI] [PMC free article] [PubMed] [Google Scholar]
- 15.Gill S, Mouches P, Hu S, et al. Using machine learning to predict dementia from neuropsychiatric symptom and neuroimaging data. J Alzheimers Dis. 2020;75(1):277-288. [DOI] [PMC free article] [PubMed] [Google Scholar]
- 16.Jack CR Jr, Bennett DA, Blennow K, et al. A/T/N: an unbiased descriptive classification scheme for Alzheimer disease biomarkers. Neurology. 2016;87(5):539-547. doi: 10.1212/WNL.0000000000002923. [DOI] [PMC free article] [PubMed] [Google Scholar]
- 17.Molinuevo JL, Ayton S, Batrla R, et al. Current state of Alzheimer's fluid biomarkers. Acta Neuropathol. 2018;136(6):821-853. doi: 10.1007/s00401-018-1932-x. [DOI] [PMC free article] [PubMed] [Google Scholar]
- 18.Janelidze S, Mattsson N, Palmqvist S, et al. Plasma P-tau181 in Alzheimer's disease: relationship to other biomarkers, differential diagnosis, neuropathology and longitudinal progression to Alzheimer's dementia. Nat Med. 2020;26(3):379-386. doi: 10.1038/s41591-020-0755-1. [DOI] [PubMed] [Google Scholar]
- 19.Karikari TK, Benedet AL, Ashton NJ, et al. Diagnostic performance and prediction of clinical progression of plasma phospho-tau181 in the Alzheimer's Disease Neuroimaging Initiative. Mol Psychiatry. 2021;26(2):429-442. doi: 10.1038/s41380-020-00923-z. [DOI] [PubMed] [Google Scholar]
- 20.Mielke MM, Hagen CE, Xu J, et al. Plasma phospho-tau181 increases with Alzheimer's disease clinical severity and is associated with tau- and amyloid-positron emission tomography. Alzheimers Dement. 2018;14(8):989-997. doi: 10.1016/j.jalz.2018.02.013. [DOI] [PMC free article] [PubMed] [Google Scholar]
- 21.Chouraki V, Beiser A, Younkin L, et al. Plasma amyloid-beta and risk of Alzheimer's disease in the Framingham Heart Study. Alzheimers Dement. 2015;11(3):249-257.e1. doi: 10.1016/j.jalz.2014.07.001. [DOI] [PMC free article] [PubMed] [Google Scholar]
- 22.Mattsson N, Cullen NC, Andreasson U, Zetterberg H, Blennow K. Association between longitudinal plasma neurofilament light and neurodegeneration in patients with Alzheimer disease. JAMA Neurol. 2019;76(7):791-799. doi: 10.1001/jamaneurol.2019.0765. [DOI] [PMC free article] [PubMed] [Google Scholar]
- 23.Pase MP, Beiser AS, Himali JJ, et al. Assessment of plasma total tau level as a predictive biomarker for dementia and related endophenotypes. JAMA Neurol. 2019;76(5):598-606. doi: 10.1001/jamaneurol.2018.4666. [DOI] [PMC free article] [PubMed] [Google Scholar]
- 24.Miao R, Chen HY, Gill S, Naude J, Smith EE, Ismail Z. Plasma beta-amyloid in mild behavioural impairment: neuropsychiatric symptoms on the Alzheimer's Continuum. J Geriatr Psychiatry Neurol. 2022;35(3):434-441. doi: 10.1177/08919887211016068. [DOI] [PubMed] [Google Scholar]
- 25.Naude JP, Gill S, Hu S, et al. Plasma neurofilament light: a marker of neurodegeneration in mild behavioral impairment. J Alzheimers Dis. 2020;76(3):1017-1027. doi: 10.3233/JAD-200011. [DOI] [PMC free article] [PubMed] [Google Scholar]
- 26.Mortby ME, Black SE, Gauthier S, et al. Dementia clinical trial implications of mild behavioral impairment. Int Psychogeriatr. 2018;30(2):171-175. doi: 10.1017/S1041610218000042. [DOI] [PubMed] [Google Scholar]
- 27.ADNI General Procedures Manual. 2010. Accessed May 2022. adni.loni.usc.edu/wp-content/uploads/2010/09/ADNI_GeneralProceduresManual.pdf.
- 28.Cummings JL, Mega M, Gray K, Rosenberg-Thompson S, Carusi DA, Gornbein J. The Neuropsychiatric Inventory: comprehensive assessment of psychopathology in dementia. Neurology. 1994;44(12):2308-2314. doi: 10.1212/wnl.44.12.2308. [DOI] [PubMed] [Google Scholar]
- 29.Kaufer DI, Cummings JL, Ketchel P, et al. Validation of the NPI-Q, a brief clinical form of the Neuropsychiatric Inventory. J Neuropsychiatry Clin Neurosci. 2000;12(2):233-239. doi: 10.1176/jnp.12.2.233. [DOI] [PubMed] [Google Scholar]
- 30.Sheikh F, Ismail Z, Mortby ME, et al. Prevalence of mild behavioral impairment in mild cognitive impairment and subjective cognitive decline, and its association with caregiver burden. Int Psychogeriatr. 2018;30(2):233-244. doi: 10.1017/S104161021700151X. [DOI] [PubMed] [Google Scholar]
- 31.Rey A. L'examen clinique en psychologie. Presses Universitaries De France, 1964. [Google Scholar]
- 32.ADNI General Procedures Manual. 2008. Accessed May 2022. adni.loni.usc.edu/wp-content/uploads/2008/07/adni2-procedures-manual.pdf.
- 33.Howard AL. Leveraging time-varying covariates to test within- and between-person effects and interactions in the multilevel linear model. Emerging Adulthood. 2015;3(6):400-412. doi: 10.1177/2167696815592726. [DOI] [Google Scholar]
- 34.Zetterberg H, Burnham SC. Blood-based molecular biomarkers for Alzheimer's disease. Mol Brain. 2019;12(1):26. doi: 10.1186/s13041-019-0448-1. [DOI] [PMC free article] [PubMed] [Google Scholar]
- 35.Karikari TK, Pascoal TA, Ashton NJ, et al. Blood phosphorylated tau 181 as a biomarker for Alzheimer's disease: a diagnostic performance and prediction modelling study using data from four prospective cohorts. Lancet Neurol. 2020;19(5):422-433. doi: 10.1016/S1474-4422(20)30071-5. [DOI] [PubMed] [Google Scholar]
- 36.Khalil M, Teunissen CE, Otto M, et al. Neurofilaments as biomarkers in neurological disorders. Nat Rev Neurol. 2018;14(10):577-589. doi: 10.1038/s41582-018-0058-z. [DOI] [PubMed] [Google Scholar]
- 37.Ovod V, Ramsey KN, Mawuenyega KG, et al. Amyloid beta concentrations and stable isotope labeling kinetics of human plasma specific to central nervous system amyloidosis. Alzheimers Dement. 2017;13(8):841-849. doi: 10.1016/j.jalz.2017.06.2266. [DOI] [PMC free article] [PubMed] [Google Scholar]
- 38.Schindler SE, Bollinger JG, Ovod V, et al. High-precision plasma beta-amyloid 42/40 predicts current and future brain amyloidosis. Neurology. 2019;93(17):e1647-e1659. doi: 10.1212/WNL.0000000000008081. [DOI] [PMC free article] [PubMed] [Google Scholar]
- 39.Lantero Rodriguez J, Karikari TK, Suarez-Calvet M, et al. Plasma p-tau181 accurately predicts Alzheimer's disease pathology at least 8 years prior to post-mortem and improves the clinical characterisation of cognitive decline. Acta Neuropathol. 2020;140(3):267-278. doi: 10.1007/s00401-020-02195-x. [DOI] [PMC free article] [PubMed] [Google Scholar]
- 40.Simren J, Leuzy A, Karikari TK, et al. The diagnostic and prognostic capabilities of plasma biomarkers in Alzheimer's disease. Alzheimers Dement. 2021;17(7):1145-1156. doi: 10.1002/alz.12283. [DOI] [PMC free article] [PubMed] [Google Scholar]
- 41.Showraki A, Murari G, Ismail Z, et al. Cerebrospinal fluid correlates of neuropsychiatric symptoms in patients with Alzheimer's disease/mild cognitive impairment: a systematic review. J Alzheimers Dis. 2019;71(2):477-501. doi: 10.3233/JAD-190365. [DOI] [PubMed] [Google Scholar]
- 42.Babulal GM, Ghoshal N, Head D, et al. Mood changes in cognitively normal older adults are linked to Alzheimer disease biomarker levels. Am J Geriatr Psychiatry. 2016;24(11):1095-1104. doi: 10.1016/j.jagp.2016.04.004. [DOI] [PMC free article] [PubMed] [Google Scholar]
- 43.Skogseth R, Mulugeta E, Ballard C, et al. Neuropsychiatric correlates of cerebrospinal fluid biomarkers in Alzheimer's disease. Dement Geriatr Cogn Disord. 2008;25(6):559-563. doi: 10.1159/000137671. [DOI] [PubMed] [Google Scholar]
- 44.Wilson RS, Leurgans SE, Boyle PA, Bennett DA. Cognitive decline in prodromal Alzheimer disease and mild cognitive impairment. Arch Neurol. 2011;68(3):351-356. doi: 10.1001/archneurol.2011.31. [DOI] [PMC free article] [PubMed] [Google Scholar]
- 45.Baudic S, Barba GD, Thibaudet MC, Smagghe A, Remy P, Traykov L. Executive function deficits in early Alzheimer's disease and their relations with episodic memory. Arch Clin Neuropsychol. 2006;21(1):15-21. doi: 10.1016/j.acn.2005.07.002. [DOI] [PubMed] [Google Scholar]
- 46.Selkoe DJ, Hardy J. The amyloid hypothesis of Alzheimer's disease at 25 years. EMBO Mol Med. 2016;8(6):595-608. doi: 10.15252/emmm.201606210. [DOI] [PMC free article] [PubMed] [Google Scholar]
- 47.Karran E, De Strooper B. The amyloid hypothesis in Alzheimer disease: new insights from new therapeutics. Nat Rev Drug Discov. 2022;21(4):306-318. doi: 10.1038/s41573-022-00391-w. [DOI] [PubMed] [Google Scholar]
- 48.Jack CR Jr, Knopman DS, Jagust WJ, et al. Hypothetical model of dynamic biomarkers of the Alzheimer's pathological cascade. Lancet Neurol. 2010;9(1):119-128. doi: 10.1016/S1474-4422(09)70299-6. [DOI] [PMC free article] [PubMed] [Google Scholar]
- 49.Moscoso A, Grothe MJ, Ashton NJ, et al. Time course of phosphorylated-tau181 in blood across the Alzheimer's disease spectrum. Brain. 2021;144(1):325-339. doi: 10.1093/brain/awaa399. [DOI] [PMC free article] [PubMed] [Google Scholar]
- 50.Huang Y, Mahley RW. Apolipoprotein E: structure and function in lipid metabolism, neurobiology, and Alzheimer's diseases. Neurobiol Dis. 2014;72(pt A):3-12. doi: 10.1016/j.nbd.2014.08.025. [DOI] [PMC free article] [PubMed] [Google Scholar]
- 51.de Oliveira FF, Miraldo MC, de Castro-Neto EF, et al. Associations of neuropsychiatric features with cerebrospinal fluid biomarkers of amyloidogenesis and neurodegeneration in dementia with Lewy bodies compared with Alzheimer's disease and cognitively healthy people. J Alzheimers Dis. 2021;81(3):1295-1309. doi: 10.3233/JAD-210272. [DOI] [PubMed] [Google Scholar]
- 52.Ismail Z, Aguera-Ortiz L, Brodaty H, et al. The Mild Behavioral Impairment checklist (MBI-C): a rating scale for neuropsychiatric symptoms in pre-dementia populations. J Alzheimers Dis. 2017;56(3):929-938. doi: 10.3233/JAD-160979. [DOI] [PMC free article] [PubMed] [Google Scholar]
- 53.Hu S, Patten S, Charlton A, et al. Validating the Mild Behavioral Impairment Checklist in a cognitive clinic: comparisons with the Neuropsychiatric Inventory Questionnaire. J Geriatr Psychiatry Neurol. 2022. Apr 17;8919887221093353. doi: 10.1177/08919887221093353. Online ahead of print. [DOI] [PMC free article] [PubMed] [Google Scholar]
Associated Data
This section collects any data citations, data availability statements, or supplementary materials included in this article.
Data Availability Statement
All data used in preparing this article are publicly available on request from the ADNI platform (adni.loni.usc.edu/).


