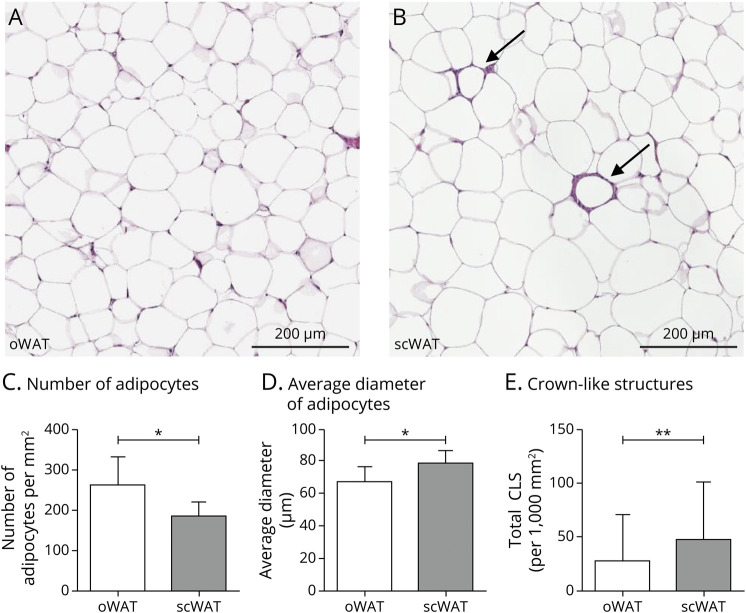
Figure 1. Photomicrographs of Hematoxylin-Eosin–Stained Adipocyte Morphology and Morphology Differences Between Subcutaneous and Omental WAT.
(A–B) Representative pictures of adipocytes in oWAT (A) and subcutaneous WAT (B) including crown-like structures (CLS) (indicated with arrows). (C) Number of adipocytes per mm2 in omental and subcutaneous WAT. (D) Average diameter of adipocytes (µm) in omental and subcutaneous WAT. (E) Total number of CLS per 1,000 mm2 in omental and subcutaneous WAT. Data are presented in mean ± SD. *p < 0.05, **p < 0.01. Analyses between oWAT and scWAT based on the number of adipocytes, diameter of adipocytes was controlled for age and sex. More information on the exact number of participants for each WAT parameter is summarized in eTable 2, links.lww.com/WNL/C471. Abbreviations: oWAT = omental white adipose tissue; scWAT = subcutaneous white adipose tissue.

