

Abstract
Background and Objectives
Internal neurofibromas, including plexiform neurofibromas (PNF), can cause significant morbidity in patients with neurofibromatosis type 1 (NF1). PNF growth is most pronounced in children and young adults, with more rapid growth thought to occur in a subset of PNF termed distinct nodular lesions (DNL). Growth behavior of internal neurofibromas and DNL in older adults is not well documented; yet knowledge thereof is important for patient risk stratification and clinical trial design. The primary objective of this study was to evaluate the long-term growth behavior of internal neurofibromas in adults with NF1. Secondary objectives were to correlate tumor growth behavior with patient-specific, tumor-specific, and patient-reported variables.
Methods
In this prospective cohort study, internal neurofibromas were identified on coronal short TI inversion recovery sequences on baseline and follow-up whole-body MRIs (WBMRIs). Tumor growth and shrinkage were defined as a volume change ≥20%. The association between tumor growth and patient-specific (baseline age, sex, and genotype), tumor-specific (morphology, location, DNL presence on baseline WBMRI, and maximum standardized uptake value on baseline PET imaging), and patient-reported variables (endogenous and exogenous hormone exposure, pain intensity, and quality of life) was assessed using the Spearman correlation coefficient and Kruskal-Wallis test.
Results
Of 106 patients with a baseline WBMRI obtained as part of a previous research study, 44 had a follow-up WBMRI. Three additional patients with WBMRIs acquired for clinical care were included, generating 47 adults for this study. The median age during baseline WBMRI was 42 years (range 18–70). The median time between WBMRIs was 10.4 years. Among 324 internal neurofibromas, 62.8% (56% of PNF and 62.1% of DNL) shrank spontaneously without treatment and 17.1% (17.9% of PNF and 13.8% of DNL) grew. Growth patterns were heterogeneous within participants. Patient-specific, tumor-specific, and patient-reported variables (including endogenous and exogenous hormone exposure) were not strong predictors of tumor growth.
Discussion
Internal neurofibroma growth behavior in older adults differs fundamentally from that in children and young adults, with most tumors, including DNL, demonstrating spontaneous shrinkage. Better growth models are needed to understand factors that influence tumor growth. These results will inform clinical trial design for internal neurofibromas.
Neurofibromatosis type 1 (NF1) is an autosomal dominant tumor suppressor syndrome that predisposes affected individuals to benign and malignant tumors. Neurofibromas, the hallmark tumors in NF1, are histologically benign neoplasms that originate from neoplastic Schwann cells. Internal neurofibromas are present in up to 60% of individuals with NF11 and, while they may extend to the subcutaneous and cutaneous tissues, they invariably have a deeper component that may not be visible on visual inspection. Plexiform neurofibromas (PNF) are a type of neurofibromas that are frequently located internally and characterized by distinct histologic and radiographic features.1-4 Despite their benign histology, growth of internal neurofibromas is associated with significant morbidity because they can invade and compress important anatomical structures. In 2020, selumetinib, an oral mitogen-activated protein kinase kinase (MEK) inhibitor, was approved for the treatment of progressive or symptomatic PNF in children with NF1.5 Clinicians must thus be able to recognize (1) PNF at risk of growth and causing symptoms and (2) PNF with rapid growth because this can signal transformation into a malignant peripheral nerve sheath tumor (MPNST), the leading cause of premature death in patients with NF1.6
PNF growth rate is highest in children and young adults.7-9 Furthermore, recent data in this population suggest that a subset of PNF termed “distinct nodular lesions” (DNL; defined as longest diameter ≥3 cm, well-demarcated or encapsulated appearance, absence of central dot sign typical of neurofibromas, and present within or outside of a neurofibroma) grow more rapidly than PNF without these radiographic characteristics.8 Spontaneous PNF regression has also been reported8,9 but is rare in children and young adults.8 Risk factors for PNF growth and shrinkage have not been identified. The expression of progesterone receptors on neurofibromas10 has motivated several studies to evaluate the effect of progesterone on neurofibroma growth during puberty, pregnancy, and in association with contraceptives. However, these studies showed either no correlation between hormone exposure and tumor growth or conflicting results and are limited by their small sample size.11-16
While neurofibroma growth trajectory has been well studied in children and young adults, their long-term growth behavior in older adults is less well understood. Understanding their natural history is important to improve patient risk stratification, develop clinical and radiographic surveillance strategies, prevent morbidity and mortality through early therapeutic intervention, and improve patient selection for clinical trials. In this study, we prospectively evaluated growth patterns of internal and plexiform neurofibromas in adult patients with NF1 over a decade using whole-body MRI (WBMRI), a type of MRI that permits imaging of the entire body within a single image acquisition session and assessment of whole-body tumor burden. In exploratory analyses, we further assessed the relationship between hormonal factors, quality-of-life (QOL) outcomes, and tumor growth behavior.
Methods
Participants
Participants with a baseline WBMRI were identified from a previous cross-sectional study conducted between 2008 and 20121 and from the investigators' clinical practices at the Massachusetts General Hospital. Inclusion criteria for this study were age 18 years or older during the baseline WBMRI; diagnosis of NF1 based on NIH clinical diagnostic criteria17,18; availability of a baseline WBMRI; and ability to provide written informed consent. Exclusion criteria were inability to undergo MRI due to a metallic implant, medical condition, or psychological condition; need for general anesthesia; pregnancy; and breastfeeding. Patients with suspected mosaic NF1 (caused by a somatic pathogenic NF1 variant) or variant NF1 (where patients lack the typical cutaneous features of NF1 but have multiple neurofibromas) were also included, given that it is unclear whether neurofibroma growth behavior in these groups differs from those in NF1 caused by a germline pathogenic NF1 variant. In these patients, the diagnosis of NF1 was made based on clinical assessment and exclusion of other genetic syndromes that may present with similar pigmentary findings (such as NF2, Noonan syndrome, and constitutional mismatch repair deficiency). This study was conducted between 2018 and 2021.
Standard Protocol Approvals, Registrations, and Patient Consents
The study was approved by the Mass General Brigham Institutional Review Board (IRB). All study-related activities were performed in accordance with the guidelines and regulations of the IRB and were conducted in compliance with the Health Insurance Portability and Accountability Act. All participants were informed of the investigational nature of the study and provided written informed consent before enrollment.
MRI Acquisition
Participants underwent MR imaging on a 1.5T magnetic resonance scanner (Avanto; Siemens Medical Systems, Malvern, PA) with an integrated body coil (eMethods, links.lww.com/WNL/C467). Images were acquired in 6 stations providing craniocaudal coverage with an overlap of at least 40 mm between 2 adjacent stations. Short TI inversion recovery (STIR) images were fused into a single whole-body image using standard software (Siemens Syngo, version MR E11, Siemens Medical Solutions). Total scan time was approximately 31 minutes.
MRI and PET Analysis
Internal neurofibromas were identified as STIR-hyperintense lesions on composite coronal STIR sequences and outlined using a highly reliable and repeatable semiautomated volumetric approach in 3DQI.19,20 Tumor segmentations were reviewed by 2 experts (K.I.L. and M.A.B.; with 4 and 17 years of experience in musculoskeletal imaging, respectively) and manually adjusted if needed. Internal neurofibromas were defined as tumors located partially or entirely deeper than subcutaneous tissue. Tumors were classified as plexiform or nonplexiform. PNF were (1) tumors involving a single or multiple major nerves or vessels (e.g., sciatic nerve, brachial plexus, and jugular vein), (2) diffuse infiltrative cutaneous tumors extending beyond the subcutaneous layer, or (3) multiple tumors arising from the spinal nerves. Nonplexiform tumors included intramuscular tumors and small tumors arising from nerve endings. DNL were identified based on published criteria.8 The difference in tumor volume between baseline and follow-up WBMRIs was calculated to determine the percent change in tumor volume.
For some patients with PNF ≥5 cm, baseline PET imaging was available.21 Treatment history of tumors between WBMRIs was extracted from the medical records and confirmed with participants.
Genetic Testing
Germline genetic testing results obtained for routine clinical care were extracted from medical records. Some individuals had germline genetic testing results from cRNA capture/next-generation sequencing analysis performed during the initial study.22
Hormone Exposure History and QOL Measures
Participants completed questionnaires in a Research Electronic Data Capture database about their endogenous and exogenous hormone exposure history (eTable 1, links.lww.com/WNL/C467). At baseline, participants reported their average pain intensity over the last day using the Visual Analog Pain Scale (VAS) and their QOL over the preceding 4 weeks using the Short Form-36 (SF-36), version 1.0.23 At follow-up, the numerical rating scale (NRS)–11 and the SF-36, version 2.0, were used. The NRS-11 was chosen for pain assessment at follow-up because it was recommended by the Response Evaluation in Neurofibromatosis and Schwannomatosis International Collaboration.24 The VAS and NRS-11 both assess average pain intensity over the last day (from 0 to 10), so longitudinal results from these 2 scales are expected to be comparable. For the SF-36, QOL was measured using 8 subscales, which were combined into 2 summary scales (physical component summary scale and mental component summary scale; eMethods, links.lww.com/WNL/C467).25 The QualityMetric Health Outcomes Scoring software was used to calculate norm-based scores based on the 1998 noninstitutionalized general US population, allowing for comparability between SF-36 versions. For all SF-36 scales, the expected US general population mean is 50 (SD 10); higher scores reflect better QOL, and lower scores reflect worse QOL.
Statistical Analysis
Statistical analyses were performed in SAS (version 9.4, SAS Institute Inc, NC) on a per-tumor and per-patient basis. For the per-tumor analysis, growth and shrinkage were defined as a volumetric increase or decrease by ≥20%, respectively, between WBMRIs, based on consensus recommendations.26 Stable disease was defined as a change <20%.26 For the per-patient analysis, the same thresholds were applied to whole-body tumor volume.
The outcome variable was defined as either percent growth or dichotomized growth (growth vs no growth). Predictor variables included age during the baseline WBMRI, sex, presence of plexiform tumor morphology, tumor location, presence of a DNL at baseline, genotype, baseline tumor volume, and baseline maximum standardized uptake value (SUVmax) on PET imaging (if available). Age was treated as a continuous and dichotomized variable (using a threshold of 25 and 35 years), based on previous natural history studies that used age 25 and 35 years as the upper range for inclusion.7,8 Exploratory variables included pregnancy history (ever vs never pregnant), number of previous pregnancies, hormonal birth control history (ever vs never on birth control), menstrual duration (defined as years difference between age of menarche and age of last menses), change in VAS/NRS-11 scores, and change in norm-based SF-36 subscale scores (defined as score at follow-up minus score at baseline). The association between predictor/exploratory variables and % growth was evaluated using the Spearman rho correlation coefficient (for continuous variables) and the Kruskal-Wallis test (for categorical variables). To assess the association between predictor/exploratory variables and dichotomized growth, a generalized linear model (binomial family and canonical link function) with random effect (subject) was fitted, and odds ratio (OR) were calculated. On a per-tumor basis, the OR was defined as the risk of an individual tumor to be classified as a “growth” tumor. On a per-patient basis, the OR reflected the risk of an individual patient being categorized as a “growth” patient (for binary variables) or the risk of being a “growth” patient when the covariate increased by 1 unit (for continuous variables). To account for clustering of tumors within individuals, we applied the generalized estimating equation for the per-tumor analysis. Individuals without tumors at baseline and follow-up were included in the per-tumor analysis and classified as “stable.”
Furthermore, we assessed the relationship between clinical variables (age, sex, genotype, number of tumors, whole-body tumor volume, pregnancy history, number of pregnancies, menstrual duration, and hormonal birth control history) and change in VAS/NRS-11 and SF-36 subscale scores using the Spearman rho correlation coefficient (for continuous variables) and the Kruskal-Wallis test (for categorical variables).
Because this was a hypothesis-generating study, we did not define a significance level a priori. We considered a p value <0.05 as suggestive of an association and worthy of exploration in future studies. To determine whether treatment between WBMRIs affected tumor growth behavior, we performed a primary analysis of treated and untreated patients and a secondary analysis of untreated patients only.
Data Availability
Anonymized data from this cohort not published within this article will be made available by request from qualified investigators.
Results
Participant Demographics
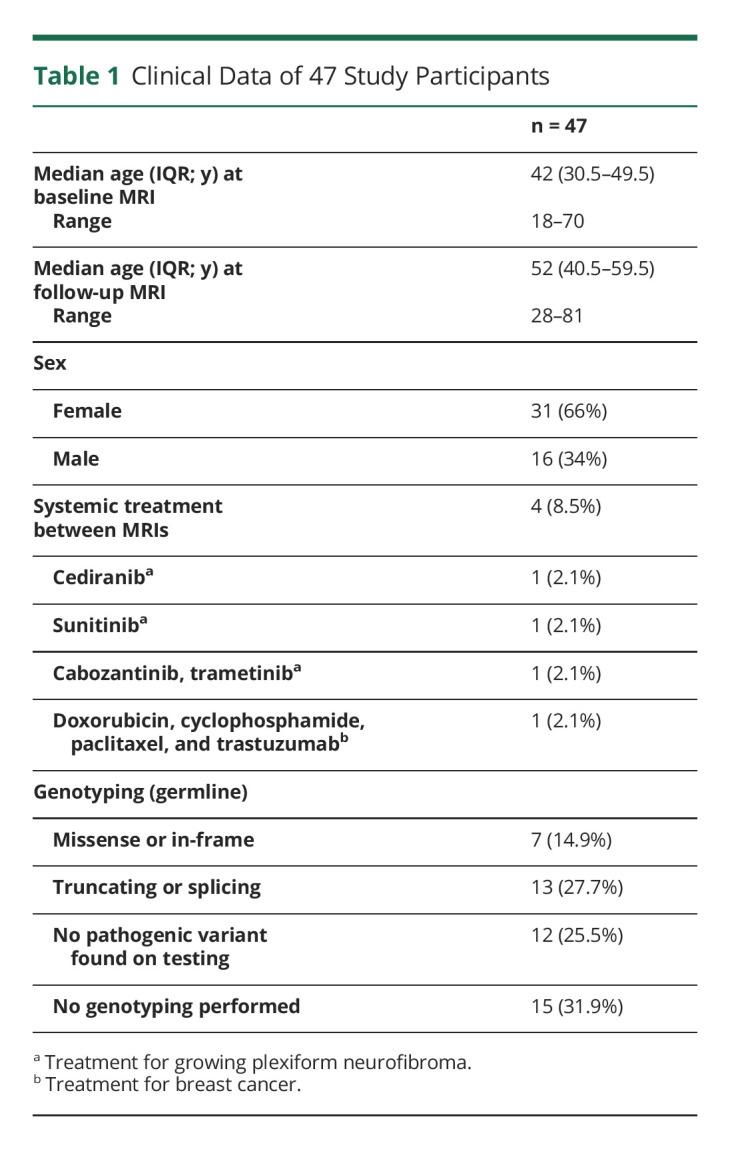
Of 106 patients from the original WBMRI research study,1 44 (41.5%) had a follow-up WBMRI. Sixty-two patients from the original study did not participate (eTable 2, links.lww.com/WNL/C467). Only 10 patients (9.4%) who were still followed up in our clinic declined participation. We included 3 patients with a baseline WBMRI acquired for clinical care, generating 47 patients with longitudinal WBMRIs. The median age during the baseline and follow-up scan was 42 and 52 years, respectively. Sixty-six percent of patients were female (Table 1). There were no differences in age and sex between patients in this study and the original cohort without a follow-up WBMRI (eTable 3, links.lww.com/WNL/C467). The median time between MRIs was 10.4 years (interquartile range [IQR] 9.5–11.1 years; range 4.6–13 years). Three patients received systemic therapy for growing/symptomatic PNF (with symptomatic improvement in patients 12 and 169), and 1 individual was treated for breast cancer between MRIs (Table 1, eTable 4, links.lww.com/WNL/C467). Three patients underwent resection of 11 internal tumors between MRIs. Germline genotyping in 32 patients revealed a pathogenic NF1 variant in 20 individuals (Table 1). In the other 12 patients, no pathogenic NF1 variant was found, likely due to the presence of genetic mosaicism and/or limitations in the testing sensitivity at the time.
Table 1.
Clinical Data of 47 Study Participants
Per-Tumor Analysis of Tumor Growth
Overall Growth Characteristics
At baseline, 315 internal neurofibromas were identified in 36 patients. Eleven patients did not have detectable tumors at baseline. Eleven tumors (11/315, 3.5%) were resected between MRIs and excluded from the growth analysis. Twenty new tumors developed in 13 patients. Thus, a total of 324 internal neurofibromas (304 tumors from baseline and 20 new tumors at follow-up) were included in the analysis. One PNF (1/304, 0.3%), which developed into an MPNST, was irradiated and resected between WBRMIs. Forty-nine neurofibromas (49/304, 16.1%) were exposed to systemic therapy (eFigures 1–2, eTable 4, links.lww.com/WNL/C467).
For all internal neurofibromas, the median annual volume change was a decrease of 4.5% per year (range −16.1% to 469.9%). Approximately 17.1% of tumors grew by a median of 81.8% over the entire study period (range 23.8%–2,153.6%). Approximately 65.8% of tumors decreased in size by a median of 61% (range −20.1% to −100%; Table 2). Excluding tumors exposed to systemic therapy (n = 49), 62.8% (160/255) of internal neurofibromas and 56% (70/125) of PNF shrank spontaneously. Thirty tumors (median baseline volume 4.74 cc) in 10 patients were present at baseline but not detectable at follow-up, consistent with spontaneous resolution (based on medical record review and confirmation with patients that these tumors were not surgically removed). Approximately 20.1% of tumors remained stable in size (Table 2). The median tumor volume at baseline was 11.2 cc (range 0.78–1,609.8 cc) and 6.17 cc (range 0.38–2,278 cc) at follow-up. The median volume for new tumors was 3.86 cc (range 1.37–21.82 cc). Eight internal neurofibromas (2.6%) grew >20% per year. This included 3 preexisting PNF (of 151 PNF; 2%), one of which developed into an MPNST (Figure 1).
Table 2.
Per-Tumor Growth Analysis of 324 Internal Neurofibromas (Including Untreated and Treated Tumors)

Figure 1. Percent Change in Tumor Volume per Year as a Function of Patient Age During Baseline MRI.
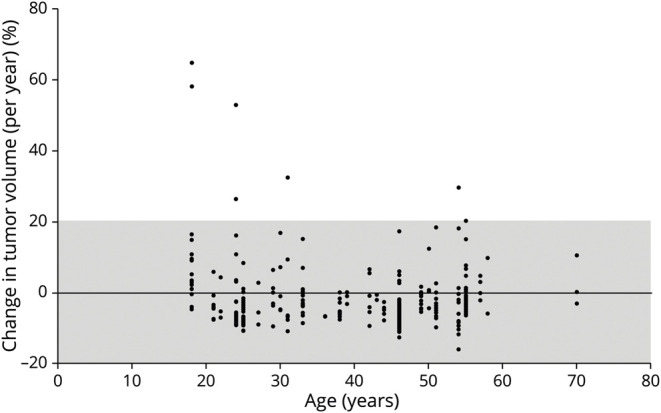
Only 8 neurofibromas grew >20% per year. Most tumors remained stable in size (gray-shaded area). A PNF that grew 469% per year and developed into an MPNST is not included in this figure. MPNST = malignant peripheral nerve sheath tumor; PNF = plexiform neurofibromas.
We observed a weak correlation between baseline age (as a continuous variable) and tumor growth (Spearman rho correlation coefficient 0.1376; p = 0.0175; eTable 5, links.lww.com/WNL/C467). This statistical correlation was likely accounted for by the presence of multiple growing tumors within the same patients. There was no correlation between dichotomized age and tumor growth (Figure 1). There was also no correlation between other clinical (sex and genotype) and tumor-specific (morphology, location, DNL presence, baseline tumor volume, and SUVmax) variables with tumor growth in the primary (treated and untreated tumors) or secondary analysis (untreated tumors only; eTables 5 and 6, links.lww.com/WNL/C467). Compared with patients from the original cohort without a follow-up WBMRI, current participants had a greater number of internal neurofibromas (p = 0.012) and greater whole-body tumor volume (p = 0.021; eTable 3, links.lww.com/WNL/C467).
Distinct Nodular Lesions
Twenty-nine (9.5%) tumors on baseline WBMRI in 10 (21.3%) patients fulfilled DNL criteria. At follow-up, 4 tumors no longer met criteria for DNL because of decreased diameter (<3 cm; n = 4) and loss of a clearly encapsulated appearance (n = 1). Ten tumors without DNL features at baseline were classified as DNL at follow-up, based on increased diameter (n = 9) and loss of the target sign (n = 1). Three DNL on follow-up MRI were new compared to baseline. Overall, DNL growth patterns mirrored the growth behavior of all internal neurofibromas and PNF (Table 2). DNL presence at baseline was not associated with tumor growth (Figure 2): of 29 DNL present at baseline, 18 (62%) shrank spontaneously and only 4 (8%) grew over time (Table 2).
Figure 2. Spontaneous Tumor Regression.

(A, B) In patient 120, a dominant tumor (tumor 1) within a brachial plexus neurofibroma (tumor 2) met criteria for a DNL and regressed spontaneously by 90%. The remainder of the neurofibroma (tumor 2) and a neurofibroma in the right neck (tumor 3) shrank spontaneously by 62% and 40%, respectively. (C–F) In patient 136, tumor 1 remained stable in size (+2%), whereas tumors 2 and 3 underwent spontaneous regression (−26% and −49%, respectively). Tumors 2 and 3 met criteria for DNL. Baseline PET-CT revealed SUVmax of 2.1 (tumor 1), 9.2 (tumor 2), and 5.7 (tumor 3), suggesting that high baseline SUVmax values (as seen for tumors 2 and 3) do not predict tumor growth. PNF = plexiform neurofibromas; SUVmax = maximum standardized uptake value.
Correlation of Internal Neurofibroma Growth With PET Imaging
Baseline PET imaging was available for 23 tumors (7.1%) in 8 patients. The median SUVmax was 2.1 (range 0.4–9.6). There was no association between baseline SUVmax and future tumor growth (eTables 5 and 6, links.lww.com/WNL/C467). Of 8 tumors with a baseline SUVmax >2.5, 4 remained stable and 4 regressed in size (Figure 2, C–F).
Per-Patient Analysis of Tumor Growth
One patient underwent resection of multiple neurofibromas between MRIs and was not assessed for interval growth. Eight of 46 patients (17.4%) met criteria for interval growth. Ten patients (21.7%) had stable and 17 (37%) had decreased tumor burden (Table 3). Of 11 patients without detectable tumors at baseline, 10 remained tumor-free at follow-up, and 1 patient developed a new tumor (3.45 cc; Table 3). In patients without tumors at baseline and follow-up, the baseline age distribution was similar to the entire cohort (median 42 years [IQR 37.3–46.3]).
Table 3.
Per-Patient Analysis of Tumor Growth Behavior in 46 Patients (Based on Whole-Body Tumor Volume)

The median whole-body tumor volume was 61.8 cc at baseline (range 0–2,644.5) and 48.5 cc at follow-up (range 0–2,281.2). The median number of tumors per patient at baseline was 3 (range 0–49). Tumor growth behavior was heterogenous within patients, with variable growth patterns in 42/47 (89.4%) patients (Figure 3). Uniform tumor shrinkage was observed in 4 patients (including 1 patient treated with cabozantinib and trametinib) and uniform tumor growth in 1 individual (in whom 1 existing tumor grew and 1 new tumor developed). Baseline age, sex, and genotype were not associated with change in whole-body tumor volume (eTables 7 and 8, links.lww.com/WNL/C467).
Figure 3. Heterogeneous Tumor Growth Patterns Within Patients.

(A, B) In patient 332, tumor 1 shrank spontaneously by 40%, but tumor 2 grew by 2,154% over 4.6 years and transformed into an MPNST. (C–F) In patient 142, a new tumor (tumor 1) developed, but an existing tumor (tumor 2) regressed spontaneously by 60% over 10 years. MPNST = malignant peripheral nerve sheath tumor.
Analysis of Hormone Exposure History and QOL Variables
Summary statistics for hormone exposure history are summarized in eTable 1, links.lww.com/WNL/C467. Given the small sample size for several hormone exposure variables, we tested only pregnancy status, exposure to hormone-based birth control, and menstrual duration for their association with tumor growth. There were no associations between these variables and tumor growth on a per-tumor (eTable 5, links.lww.com/WNL/C467) or per-patient level (eTables 7 and 8, links.lww.com/WNL/C467).
Forty-two (89.4%) patients had longitudinal pain and QOL data (eTable 9, links.lww.com/WNL/C467). There were no associations between most variables and tumor growth (eTables 5, 7, and 8, links.lww.com/WNL/C467). Paradoxically, improved physical role correlated with increased tumor growth (eTables 5 and 7, links.lww.com/WNL/C467), but widespread ceiling effects (with 52.4% participants scoring at the ceiling at both time points) may have distorted this relationship.
Regarding the relationship between clinical variables and pain scores and SF-36 subscales, there was a weak correlation between whole-body tumor volume at follow-up and NRS-11 score (Spearman rho correlation coefficient 0.337, p = 0.025) but not the bodily pain subscale on the SF-36 (the Spearman rho correlation coefficient −0.04, p = 0.804). Men demonstrated a greater decline in all mental health–related subscales compared to women, with associations observed between male sex and emotional role (p = 0.038), mental health (p = 0.002), and mental component summary scale (p = 0.002, eTable 10, links.lww.com/WNL/C467). There was a greater decline in the physical functioning subscale in women (p = 0.020), but no differences were seen for other physical health–related subscales. Women with a pregnancy history reported a greater decline in physical health–related subscales, with associations seen between previously pregnant status and physical functioning (p = 0.032), physical role (p = 0.015), bodily pain (p = 0.038), and physical component subscale (p = 0.001; eTable 11, links.lww.com/WNL/C467). Women with a pregnancy history also reported improvement in their mental health (p = 0.046) and mental component summary subscales (p = 0.047) compared to women without a pregnancy history, but this effect was not observed for the other 3 mental health–related subscales.
Discussion
In this prospective cohort study of 47 adults with NF1, we evaluated the long-term growth behavior of internal neurofibromas over a decade. Our study is unique in several regards: (1) we focused on adult patients only (median age at baseline 42 years), whereas previous studies included both children and adults,7-9 (2) our median follow-up period of 10.4 years is the longest reported to date, compared with median follow-up periods of 2.2–3 years in other studies,7-9 and (3) our analysis was not restricted to PNF or target tumors alone but included all internal neurofibromas, thus providing a more comprehensive assessment of whole-body neurofibroma growth behavior within a person. Our data show that neurofibroma growth behavior in adults with NF1 differs fundamentally from that in children and young adults. Most strikingly, 56%–63% of internal neurofibromas and PNF regressed spontaneously by ≥20% over a decade, whereas only 17% of tumors grew over this period. Second, we found that neurofibroma growth patterns were heterogenous in most patients, suggesting that patient-specific factors are not the primary drivers of tumor growth. Third, radiographic characteristics that have been proposed as markers of more aggressive tumor growth behavior, such as DNL on MRI and elevated SUVmax on PET imaging, were not associated with tumor growth in our cohort.
Longitudinal data from the National Cancer Institute (NCI; NCT00924196) and University of Hamburg have shown that PNF growth rate is highest in children and young adults, reaching median growth rates of 12.4%–14.3% per year.7-9 DNL, a proposed subset of PNF defined by size and qualitative MRI criteria, demonstrate more rapid growth than conventional PNF in children and young adults, with median growth rates of approximately 28% per year.8 Contrasting this, we observed a median shrinkage of 3.7% and 3.3% per year for PNF and DNL, respectively, in our adult cohort (eTable 12, links.lww.com/WNL/C467). Regarding the proportion of PNF with significant growth (≥20% per year), data from the University of Hamburg (median age 28.6 years) showed that 13.5% of PNF grew, with 70% of growing tumors found in patients younger than 18 years.9 By contrast, in our adult population, only approximately 2% of tumors grew significantly. On a per-patient basis, 69% in the NCI cohort (median age 8.3 years) experienced growth ≥20% over 2.8 years,7 whereas only 17% of our patients had significant growth over a decade (eTable 12, links.lww.com/WNL/C467).7 Our data demonstrate that age is a weak predictor of tumor growth in adults, supporting the notion that age ceases to be a significant risk factor for individual tumor growth after adolescence.8 In addition, 91% of adults without tumors at baseline remained tumor-free at follow-up, consistent with previous reports9 and suggesting that frequent radiographic surveillance may not be necessary in these individuals. However, 22 of 36 (61%) adults with tumors at baseline experienced growth of at least 1 tumor over time.
Surprisingly, approximately 60% of internal neurofibromas and PNF spontaneously regressed over time. This has previously been reported, but in a much smaller proportion than in our cohort (eTable 12, links.lww.com/WNL/C467). In the NCI study, approximately 9% of tumors shrank spontaneously by ≥10%.8 In the University of Hamburg study9, spontaneous tumor shrinkage of any degree was reported in 35.5% of tumors, which may have partially resulted from measurement error. In our study, we used the same segmentation method on baseline and follow-up scans and a more conservative threshold for shrinkage (volume reduction ≥20%),26 therefore reducing the likelihood that any shrinkage was due to measurement error.
Twenty percent of shrinking tumors (40 of 200) were exposed to systemic therapy between scans (eTable 4, links.lww.com/WNL/C467). Of these therapies, only cabozantinib and trametinib have known activity in PNF.27,28 In the only patient treated with these 2 drugs, all tumors shrank, and we cannot exclude that shrinkage occurred because of treatment. However, for the other treated tumors, it is unlikely that shrinkage was significantly affected by treatment.
Our observation that few neurofibromas grow and most tumors regress spontaneously over time has important clinical implications. First, a tumor that grows ≥20% per year in an adult should raise suspicion for more aggressive biology and prompt expedited evaluation. Second, the high rate of spontaneous tumor regression (56% of PNF) has implications for defining treatment response in adult clinical trials. The median PNF volume decrease in our study was 5.6% per year (range −1.7% to −16.1%), suggesting that spontaneous shrinkage occurs at a slow rate. Thus, a decrease by ≥20% in a year after therapeutic intervention would support a true treatment response. Furthermore, investigators should routinely obtain prebaseline MRIs to estimate tumor growth trajectory before clinical trial enrollment to clarify whether subsequent shrinkage is consistent with a tumor's natural history or treatment response. Treatment response should also be confirmed on subsequent MRIs as in recent PNF clinical trials.5,29
Individual neurofibroma growth behavior was heterogenous within most (89.4%) patients, concordant with previous reports.8 This suggests that patient-specific factors such as sex, genotype, and hormonal factors are not significant modulators of tumor growth. Furthermore, the baseline presence of DNL did not correlate with neurofibroma growth. In young patients, DNL have been proposed to reflect PNF with more aggressive behavior, given their rapid growth rates relative to PNF without DNL features,8 association with elevated SUVmax,30 and histologic confirmation as atypical neurofibromas.30 However, in our adult population, 62% of DNL shrank spontaneously (compared with 3.7% of DNL in the NCI cohort8) and only 13.8% grew over time. Of the 4 growing DNL in our study, 1 was confirmed to be an MPNST. In the other 3 tumors, their slow growth rates (2.5%–4.7% per year) make an atypical or malignant tumor highly unlikely. Taken together, the current data suggest that, while the radiographic presence of a DNL may be predictive of growth in children, this does not apply to adults. Given that DNL do not uniformly represent PNF with accelerated growth potential, additional studies are needed to clarify whether DNL represent a specific biologic subtype of neurofibromas. Lastly, high SUVmax (>3.5) on PET imaging also did not correlate with neurofibroma growth. High SUVmax is highly sensitive but not specific for MPNST detection in NF131 because elevated SUVmax can also be seen in inflammation and angiogenesis.32 Inflammatory changes may explain the increased glucose uptake in our cohort, given that mast cell and macrophage infiltration is a hallmark feature of neurofibromas.33,34
Our previous work did not show any cross-sectional association between higher tumor burden and pain or QOL.23 In this study, we found a weak correlation between whole-body tumor volume and NRS-11 score at follow-up. Given that the NRS-11 assesses global pain over the past day and week, we could not evaluate localized pain (due to a growing neurofibroma) or pain at other time points. Prospective use of domain-specific or disease-specific measures may provide insights into changes in pain or QOL specifically related to neurofibroma growth.35,36
Our study has some limitations. First, the annual tumor growth rate was calculated by dividing the volumetric change by the number of years between 2 scans, thus assuming linear growth, which may not be accurate. Continued longitudinal follow-up will be necessary to better characterize the dynamic nature of growth patterns. Second, the thicker slice thickness (10 mm) on the baseline MRI (compared with a slice thickness of 6 mm on the follow-up MRI) could have led to an overestimate of volume measurement on the baseline scan due to partial volume effects, thus resulting in an overestimate of shrinking tumors over time. This is more relevant for small tumors where larger variance and greater partial volume effects may be seen. We attempted to control for these factors using a threshold of 20% for growth/shrinkage. Ideally, identical imaging protocols should be used in longitudinal studies, but this can be challenging due to scanner availability, periodic scanner upgrades to improve scanning technology and efficiency (such as the abovementioned changes to slice thickness and, in addition, changes to the voxel size; eMethods, links.lww.com/WNL/C467), and changes in scan technology. Third, selection bias may contribute to the differences in DNL growth rates between children and adults because the NCI predominantly sees severely affected patients, whereas our clinic treats a spectrum of individuals that is more representative of the general NF1 population. Lastly, current natural history studies of neurofibroma growth (including ours) are based on single-center cohorts. Multicenter studies including children and adults with variable phenotypes are needed. Ongoing efforts include a growing multi-institutional database of longitudinal MRIs and clinical data to study growth patterns of NF1-associated PNF, atypical neurofibromas, and MPNST.37
Given that current qualitative and quantitative imaging features do not reliably identify neurofibromas at risk of growth, better growth models are needed. This is particularly important to select at-risk patients for treatment with available and emerging therapies, including selumetinib5 and other investigational agents.29,38-40
In summary, most internal neurofibromas in adults with NF1 regress spontaneously and few tumors grow significantly over time. The differences in growth patterns between adults and children with NF1 have implications for clinical care and clinical trial design. Future studies should focus on identifying biologic and radiographic markers that predict neurofibroma growth to enable the development of clinical growth prediction models for patient care.
Acknowledgment
The authors thank Drs. Eva Dombi and Brigitte Widemann for helpful discussions on the topic of distinct nodular lesions and Colleen Buckless for technical assistance and scheduling of whole-body MRI scans.
Glossary
- DNL
distinct nodular lesions
- IRB
Institutional Review Board
- MPNST
malignant peripheral nerve sheath tumor
- NCI
National Cancer Institute
- NF1
neurofibromatosis type 1
- NRS
numerical rating scale
- PNF
plexiform neurofibromas
- QOL
quality of life
- STIR
short TI inversion recovery
- SUVmax
maximum standardized uptake value
- VAS
Visual Analog Pain Scale
- WBMRIs
whole-body MRIs
Appendix. Authors

Study Funding
Department of Defense Neurofibromatosis Research Program (award number W81XWH-06-1-0739); The Burke Foundation.
Disclosure
K.I. Ly serves as a consultant for SpringWorks Therapeutics, has received royalties from Elsevier, and has received grant funding from the Neurofibromatosis Therapeutic Acceleration Program and the Department of Defense. V.L. Merker serves as a consultant for The Neurofibromatosis Network. W. Cai holds stock options in IQ Medical Imaging LLC. M.A. Bredella, A. Muzikansky, R.D. Thalheimer, and J.L. Da report no disclosures. C.C. Orr serves on the advisory board for AstraZeneca. H.P. Herr reports no disclosures. M.E. Morris serves as a consultant for Micropoint. C.Y. Chang reports no disclosures. G.J. Harris serves as a member of Novometrics LLC and IQ Medical Imaging LLC and an advisor for Fovia Inc. S.R. Plotkin is a cofounder of NFlection Therapeutics and NF2 Therapeutics, is a consultant for Akouos, and holds equity in and serves on the scientific advisory board for SonALAsense. J.T. Jordan received royalties from Elsevier, is a consultant for CereXis, Recursion, Navio Theragnostics, and Health2047, and holds equity in Navio Theragnostics. Go to Neurology.org/N for full disclosures.
References
- 1.Plotkin SR, Bredella MA, Cai W, et al. Quantitative assessment of whole-body tumor burden in adult patients with neurofibromatosis. PLoS One. 2012;7(4):e35711. doi: 10.1371/journal.pone.0035711. [DOI] [PMC free article] [PubMed] [Google Scholar]
- 2.Miettinen MM, Antonescu CR, Fletcher CDM, et al. Histopathologic evaluation of atypical neurofibromatous tumors and their transformation into malignant peripheral nerve sheath tumor in patients with neurofibromatosis 1-a consensus overview. Hum Pathol. 2017;67:1-10. doi: 10.1016/j.humpath.2017.05.010. [DOI] [PMC free article] [PubMed] [Google Scholar]
- 3.Mautner VF, Hartmann M, Kluwe L, Friedrich RE, Funsterer C. MRI growth patterns of plexiform neurofibromas in patients with neurofibromatosis type 1. Neuroradiology. 2006;48(3):160-165. doi: 10.1007/s00234-005-0033-4. [DOI] [PubMed] [Google Scholar]
- 4.Lim R, Jaramillo D, Poussaint TY, Chang Y, Korf B. Superficial neurofibroma: a lesion with unique MRI characteristics in patients with neurofibromatosis type 1. AJR Am J Roentgenol 2005;184(3):962-968. doi: 10.2214/ajr.184.3.01840962. [DOI] [PubMed] [Google Scholar]
- 5.Gross AM, Wolters PL, Dombi E, et al. Selumetinib in children with inoperable plexiform neurofibromas. N Engl J Med. 2020;382(15):1430-1442. doi: 10.1056/nejmoa1912735. [DOI] [PMC free article] [PubMed] [Google Scholar]
- 6.Duong TA, Sbidian E, Valeyrie-Allanore L, et al. Mortality associated with neurofibromatosis 1: a cohort study of 1895 patients in 1980-2006 in France. Orphanet J Rare Dis. 2011;6(1):18. doi: 10.1186/1750-1172-6-18. [DOI] [PMC free article] [PubMed] [Google Scholar]
- 7.Dombi E, Solomon J, Gillespie AJ, et al. NF1 plexiform neurofibroma growth rate by volumetric MRI: relationship to age and body weight. Neurology. 2007;68(9):643-647. doi: 10.1212/01.wnl.0000250332.89420.e6. [DOI] [PubMed] [Google Scholar]
- 8.Akshintala S, Baldwin A, Liewehr DJ, et al. Longitudinal evaluation of peripheral nerve sheath tumors in neurofibromatosis type 1: growth analysis of plexiform neurofibromas and distinct nodular lesions. Neuro Oncol. 2020;22(9):1368-1378. doi: 10.1093/neuonc/noaa053. [DOI] [PMC free article] [PubMed] [Google Scholar]
- 9.Nguyen R, Dombi E, Widemann BC, et al. Growth dynamics of plexiform neurofibromas: a retrospective cohort study of 201 patients with neurofibromatosis 1. Orphanet J Rare Dis. 2012;7:75. doi: 10.1186/1750-1172-7-75. [DOI] [PMC free article] [PubMed] [Google Scholar]
- 10.McLaughlin ME, Jacks T. Progesterone receptor expression in neurofibromas. Cancer Res. 2003;63(4):752-755. [PubMed] [Google Scholar]
- 11.Lammert M, Mautner VF, Kluwe L. Do hormonal contraceptives stimulate growth of neurofibromas? A survey on 59 NF1 patients. BMC Cancer. 2005;5(1):16. doi: 10.1186/1471-2407-5-16. [DOI] [PMC free article] [PubMed] [Google Scholar]
- 12.Dagalakis U, Lodish M, Dombi E, et al. Puberty and plexiform neurofibroma tumor growth in patients with neurofibromatosis type I. J Pediatr. 2014;164(3):620-624. doi: 10.1016/j.jpeds.2013.10.081. [DOI] [PMC free article] [PubMed] [Google Scholar]
- 13.Isikoglu M, Has R, Korkmaz D, Bebek N. Plexiform neurofibroma during and after pregnancy. Arch Gynecol Obstet. 2002;267(1):41-42. doi: 10.1007/s004040100239. [DOI] [PubMed] [Google Scholar]
- 14.Dugoff L, Sujansky E. Neurofibromatosis type 1 and pregnancy. Am J Med Genet. 1996;66(1):7-10. doi: . [DOI] [PubMed] [Google Scholar]
- 15.Well L, Jaeger A, Kehrer-Sawatzki H, et al. The effect of pregnancy on growth-dynamics of neurofibromas in Neurofibromatosis type 1. PLoS One. 2020;15(4):e0232031. doi: 10.1371/journal.pone.0232031. [DOI] [PMC free article] [PubMed] [Google Scholar]
- 16.Roth TM, Petty EM, Barald KF. The role of steroid hormones in the NF1 phenotype: focus on pregnancy. Am J Med Genet A. 2008;146A(12):1624-1633. doi: 10.1002/ajmg.a.32301. [DOI] [PubMed] [Google Scholar]
- 17.Gutmann DH, Aylsworth A, Carey JC, et al. The diagnostic evaluation and multidisciplinary management of neurofibromatosis 1 and neurofibromatosis 2. JAMA. 1997;278(1):51-57. doi: 10.1001/jama.1997.03550010065042. [DOI] [PubMed] [Google Scholar]
- 18.National Institutes of Health Consensus Development Conference Statement: neurofibromatosis. Bethesda, Md., USA, July 13-15, 1987. Neurofibromatosis. 1988;1(3):172-178. [PubMed] [Google Scholar]
- 19.Cai W, Kassarjian A, Bredella MA, et al. Tumor burden in patients with neurofibromatosis types 1 and 2 and schwannomatosis: determination on whole-body MR images. Radiology. 2009;250(3):665-673. doi: 10.1148/radiol.2503080700. [DOI] [PubMed] [Google Scholar]
- 20.3D Quantitative Imaging Laboratory. https://3dqi.mgh.harvard.edu
- 21.Urban T, Lim R, Merker VL, et al. Anatomic and metabolic evaluation of peripheral nerve sheath tumors in patients with neurofibromatosis 1 using whole-body MRI and (18)F-FDG PET fusion. Clin Nucl Med. 2014;39(5):e301-e307. doi: 10.1097/rlu.0b013e3182a757d3. [DOI] [PubMed] [Google Scholar]
- 22.Jordan JT, Smith MJ, Walker JA, et al. Pain correlates with germline mutation in schwannomatosis. Medicine (Baltimore). 2018;97(5):e9717. doi: 10.1097/md.0000000000009717. [DOI] [PMC free article] [PubMed] [Google Scholar]
- 23.Merker VL, Bredella MA, Cai W, et al. Relationship between whole-body tumor burden, clinical phenotype, and quality of life in patients with neurofibromatosis. Am J Med Genet A. 2014;164(6):1431-1437. doi: 10.1002/ajmg.a.36466. [DOI] [PubMed] [Google Scholar]
- 24.Wolters PL, Martin S, Merker VL, et al. Patient-reported outcomes in neurofibromatosis and schwannomatosis clinical trials. Neurology. 2013;81(21, suppl 1):S6-S14. doi: 10.1212/01.wnl.0000435747.02780.bf. [DOI] [PMC free article] [PubMed] [Google Scholar]
- 25.Ware JEJ, Kosinski M, Bjorner JB, Turner-Bowker DM, Gandek B, Maruish ME. User's Manual for the Sf-36v2 Health Survey: QualityMetric Incorporated; 2007. [Google Scholar]
- 26.Dombi E, Ardern-Holmes SL, Babovic-Vuksanovic D, et al. Recommendations for imaging tumor response in neurofibromatosis clinical trials. Neurology. 2013;81(21, suppl 1):S33-S40. doi: 10.1212/01.wnl.0000435744.57038.af. [DOI] [PMC free article] [PubMed] [Google Scholar]
- 27.AZD2171 in Treating Patients with Neurofibromatosis Type 1 and Plexiform Neurofibroma And/or Neurofibroma Near the Spine. 2017; Accessed July 27, 2021. clinicaltrials.gov/ct2/show/NCT00326872. [Google Scholar]
- 28.Study of Sutent®/Sunitinib (SU11248) in Subjects with NF-1 Plexiform Neurofibromas; 2018. Accessed July 27, 2021. clinicaltrials.gov/ct2/show/NCT01402817. [Google Scholar]
- 29.Fisher MJ, Shih CS, Rhodes SD, et al. Cabozantinib for neurofibromatosis type 1-related plexiform neurofibromas: a phase 2 trial. Nat Med. 2021;27(1):165-173. doi: 10.1038/s41591-020-01193-6. [DOI] [PMC free article] [PubMed] [Google Scholar]
- 30.Higham CS, Dombi E, Rogiers A, et al. The characteristics of 76 atypical neurofibromas as precursors to neurofibromatosis 1 associated malignant peripheral nerve sheath tumors. Neuro Oncol. 2018;20(6):818-825. doi: 10.1093/neuonc/noy013. [DOI] [PMC free article] [PubMed] [Google Scholar]
- 31.Ahlawat S, Blakeley JO, Langmead S, Belzberg AJ, Fayad LM. Current status and recommendations for imaging in neurofibromatosis type 1, neurofibromatosis type 2, and schwannomatosis. Skeletal Radiol. 2019;49(2):199-219. doi: 10.1007/s00256-019-03290-1. [DOI] [PubMed] [Google Scholar]
- 32.Zhao K, Wang C, Shi F, et al. Combined prognostic value of the SUVmax derived from FDG-PET and the lymphocyte-monocyte ratio in patients with stage IIIB-IV non-small cell lung cancer receiving chemotherapy. BMC Cancer. 2021;21(1):66. doi: 10.1186/s12885-021-07784-x. [DOI] [PMC free article] [PubMed] [Google Scholar]
- 33.Liao CP, Booker RC, Brosseau JP, et al. Contributions of inflammation and tumor microenvironment to neurofibroma tumorigenesis. J Clin Invest. 2018;128(7):2848-2861. doi: 10.1172/jci99424. [DOI] [PMC free article] [PubMed] [Google Scholar]
- 34.Yoshida Y, Adachi K, Yamamoto O. Local mast cell histamine and plasma histamine levels in neurofibromatosis type 1. Acta Derm Venereol. 2010;90(6):637-639. doi: 10.2340/00015555-0938. [DOI] [PubMed] [Google Scholar]
- 35.Wolters PL, Vranceanu AM, Thompson HL, et al. Current recommendations for patient-reported outcome measures assessing domains of quality of life in neurofibromatosis clinical trials. Neurology. 2021;97(7 suppl 1):S50-S63. doi: 10.1212/wnl.0000000000012421. [DOI] [PMC free article] [PubMed] [Google Scholar]
- 36.Wolters PL, Martin S, Merker VL, et al. Patient-reported outcomes of pain and physical functioning in neurofibromatosis clinical trials. Neurology. 2016;87(7 suppl 1):S4-S12. doi: 10.1212/wnl.0000000000002927. [DOI] [PMC free article] [PubMed] [Google Scholar]
- 37.Ly KI, Hirbe AC, Jordan JT, et al. A multi-institutional clinical and MRI repository of neurofibromatosis type 1-associated peripheral nerve sheath tumors. Paper presented at the 2021 Virtual Neurofibromatosis Conference; June 15, 2021.
- 38.Weiss BD, Wolters PL, Plotkin SR, et al. NF106: a neurofibromatosis clinical trials consortium phase II trial of the MEK inhibitor mirdametinib (PD-0325901) in adolescents and adults with NF1-related plexiform neurofibromas. J Clin Oncol. 2021;39(7):797-806. doi: 10.1200/jco.20.02220. [DOI] [PMC free article] [PubMed] [Google Scholar]
- 39.Perreault S, Larouche V, Tabori U, et al. A phase 2 study of trametinib for patients with pediatric glioma or plexiform neurofibroma with refractory tumor and activation of the MAPK/ERK pathway: TRAM-01. BMC Cancer. 2019;19(1):1250. doi: 10.1186/s12885-019-6442-2. [DOI] [PMC free article] [PubMed] [Google Scholar]
- 40.McCowage GB, Mueller S, Pratilas CA, et al. Trametinib in pediatric patients with neurofibromatosis type 1 (NF-1)–associated plexiform neurofibroma: a phase I/IIa study. J Clin Oncol. 2018;36(15 suppl):10504a. doi: 10.1200/jco.2018.36.15_suppl.10504. [DOI] [Google Scholar]
Associated Data
This section collects any data citations, data availability statements, or supplementary materials included in this article.
Data Availability Statement
Anonymized data from this cohort not published within this article will be made available by request from qualified investigators.