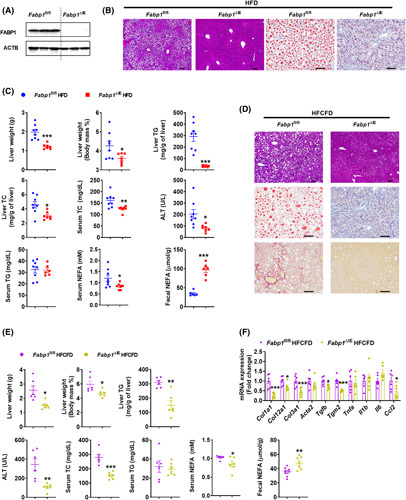
FIGURE 5.

Intestine‐specific Fabp1 disruption attenuated obesity and NASH. (A) Western blot analysis of intestinal FABP1 protein. (B) Representative H&E and Oil Red O staining; scale bar 100 µm. (C) Liver weight and index, hepatic TC and TG, and serum ALT, TC, TG, and NEFA of 15‐week HFD‐fed mice (n = 7–8) and fecal NEFA levels at 3–5 days after HFD feeding (n = 6). (D) Representative H&E, Oil Red O, and Sirius Red staining of 21‐week HFCFD‐fed mice; scale bar 100 µm. (E) Liver weight and liver index, hepatic TG, and serum ALT, TC, TG and NEFA levels of 21‐week HFCFD‐fed mice (n = 6) and fecal NEFA levels of 3–5‐day HFCFD‐fed mice (n = 7). (F) mRNA levels of hepatic fibrosis and inflammation‐related genes (n = 6). *p < 0.05, **p < 0.01, ***p < 0.001
