Abstract
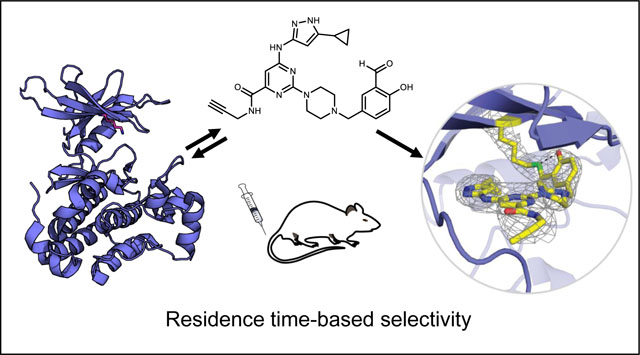
Expanding the target landscape of covalent inhibitors requires engaging nucleophiles beyond cysteine. Although the conserved catalytic lysine in protein kinases is an attractive candidate for a covalent approach, selectivity remains an obvious challenge. Moreover, few covalent inhibitors have been shown to engage the kinase catalytic lysine in animals. We hypothesized that reversible, lysine-targeted inhibitors could provide sustained kinase engagement in vivo, with selectivity driven in part by differences in residence time. By strategically linking benzaldehydes to a promiscuous kinase binding scaffold, we developed chemoproteomic probes that reversibly and covalently engage >200 protein kinases in cells and mice. Probe-kinase residence time was dramatically enhanced by a hydroxyl group ortho to the aldehyde. Remarkably, only a few kinases, including Aurora A (AURKA), showed sustained, quasi-irreversible occupancy in vivo, the structural basis for which was revealed by x-ray crystallography. We anticipate broad application of salicylaldehyde-based probes to proteins that lack a druggable cysteine.
Graphical Abstract
Introduction
Targeted covalent inhibitors are an emerging class of drugs, evidenced by the recent approval of several cysteine-targeted inhibitors, including ibrutinib,1–2 osimertinib,3–4 and sotorasib.5–6 A covalent inhibition strategy has two principal advantages: sustained target engagement in vivo, and in many cases, increased selectivity.7 With the exception of protease and lipid hydrolase inhibitors, most targeted covalent drugs have been designed to react with a solvent-exposed, noncatalytic cysteine.8–9 However, the low prevalence of cysteine near ligand binding sites restricts the scope of therapeutic targets that could potentially benefit from this approach.10
Lysine, which is frequently located near functional and ligand binding sites, presents an alternative nucleophile for covalent targeting. Despite lysine’s reduced chemical reactivity, recent efforts have led to the development of irreversible, lysine-targeted inhibitors of PI3Kδ,11 XIAP,12 Hsp90,13–14 and eIF4E,15 among other diverse targets.16–17 An unresolved question concerns whether the electrophiles employed in these irreversible inhibitors are suitable for use in animals. More importantly, reversible covalent, lysine-targeted inhibitors could potentially provide advantages over their irreversible counterparts, including increased proteome-wide selectivity driven by distinct residence times.18–19 To the best of our knowledge, the concept of “residence time-based selectivity” has not been explored with reversible, lysine-targeted inhibitors.
Aldehydes are versatile electrophiles that can react rapidly and reversibly with biological amines – including the ε-amine of lysine – to form imines under physiological conditions. The enzyme cofactor, pyridoxal phosphate (PLP), forms an imine with an active-site lysine in PLP-dependent enzymes and mediates diverse chemical transformations of biological amines.20 Voxelotor, a covalent drug that was recently approved for sickle cell disease, leverages a salicylaldehyde to reversibly target the N-terminal amine of hemoglobin.21 These examples suggest that aryl aldehydes may have the requisite balance of stability, reactivity, and reversibility for in vivo applications.22
Protein kinases represent a large class of validated therapeutic targets. Several kinases have been targeted by covalent drugs and chemical probes, including irreversible11, 23–25 and reversible26–27 inhibitors that covalently modify the catalytic lysine.10, 16 However, to the best of our knowledge, no covalent protein kinase inhibitors have been shown to reversibly engage the catalytic lysine in humans or animal models. We envisioned that aldehyde-based kinase inhibitors could fill this gap. More importantly, we hypothesized that reversible imine formation – despite targeting the conserved catalytic lysine – could form the basis of residence time-based selectivity, in which distinct imine hydrolysis (and reformation) kinetics could lead to differential kinase engagement upon removal of excess unbound inhibitor (e.g., via metabolic clearance).
Here, we describe benzaldehyde-based chemical probes that efficiently and reversibly engage the conserved catalytic lysine of protein kinases in animals. Using quantitative chemoproteomic methods, we estimated the residence times of clickable salicylaldehyde probes for endogenous kinases in cultured human cells, as well as treated mice. These target engagement studies reveal a surprising degree of selectivity, driven by distinct probe-kinase residence times. Finally, we employed a salicylaldehyde probe as a competitive occupancy probe in mice to study in vivo kinase engagement by PF-06873600, a recently developed cyclin-dependent kinase inhibitor in clinical trials for metastatic cancer.28–29
Results
Design and characterization of aldehyde-based kinase probes
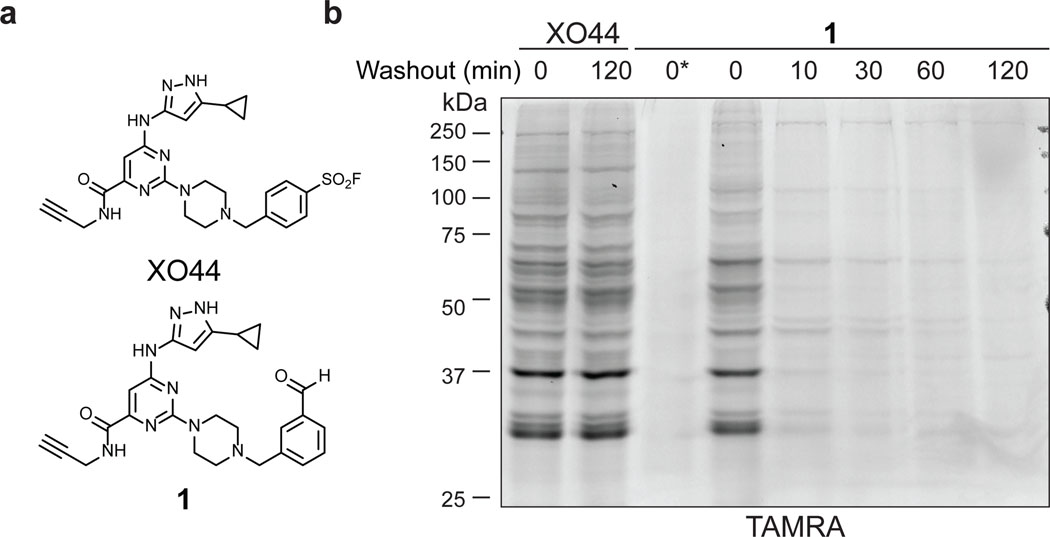
To test the feasibility of covalently targeting kinases with a benzaldehyde, we designed probe 1 based on the clickable sulfonyl fluoride XO44, a broad-spectrum kinase probe developed previously in our lab (Figure 1a).25 Like XO44, probe 1 utilizes an aminopyrazole to bind the ATP-site hinge region, as well as a piperazine linker to orient the benzaldehyde toward the catalytic lysine. We first compared probe 1 with XO44, which was previously shown to covalently modify >100 cellular kinases. Jurkat cells were treated briefly with probe 1 (2 μM, 30 min) and then lysed in buffer containing sodium cyanoborohydride to irreversibly trap imine adducts with cellular proteins. Following copper-catalyzed click conjugation of the fluorophore TAMRA-azide, probe-modified proteins were resolved by SDS-PAGE and visualized by in-gel fluorescence scanning. This analysis revealed multiple fluorescent protein bands with a profile similar to XO44-treated cells (Figure 1b). Detection of TAMRA-labeled proteins was abolished when sodium cyanoborohydride was omitted from the lysis buffer, consistent with formation of fully reversible imine adducts by probe 1. Reversibility was further confirmed by a washout experiment, in which fluorescent labeling intensity decreased rapidly in cells treated with probe 1 (t1/2 << 10 min), but not with the irreversible probe XO44. The para-substituted benzaldehyde 2 (regioisomer of 1) behaved similarly, albeit with decreased overall labeling intensity (Extended Data Figure 1), suggesting that the orientation of the aldehyde/imine affects the rate of imine bond formation and/or hydrolysis.
Figure 1.
Benzaldehyde probe 1 reversibly labels cellular proteins. (a) Chemical structures of XO44 and probe 1. (b) Jurkat cells were treated with XO44 or 1 (2 μM, 30 min), followed by compound washout for the indicated times. Cells treated with 1 were lysed in the presence of 25 mM sodium cyanoborohydride, except as indicated (*). After copper-promoted click conjugation with TAMRA-azide, samples were analyzed by in-gel fluorescence and Coomassie blue staining (Supplementary Figure 1). Data are representative of two independent experiments.
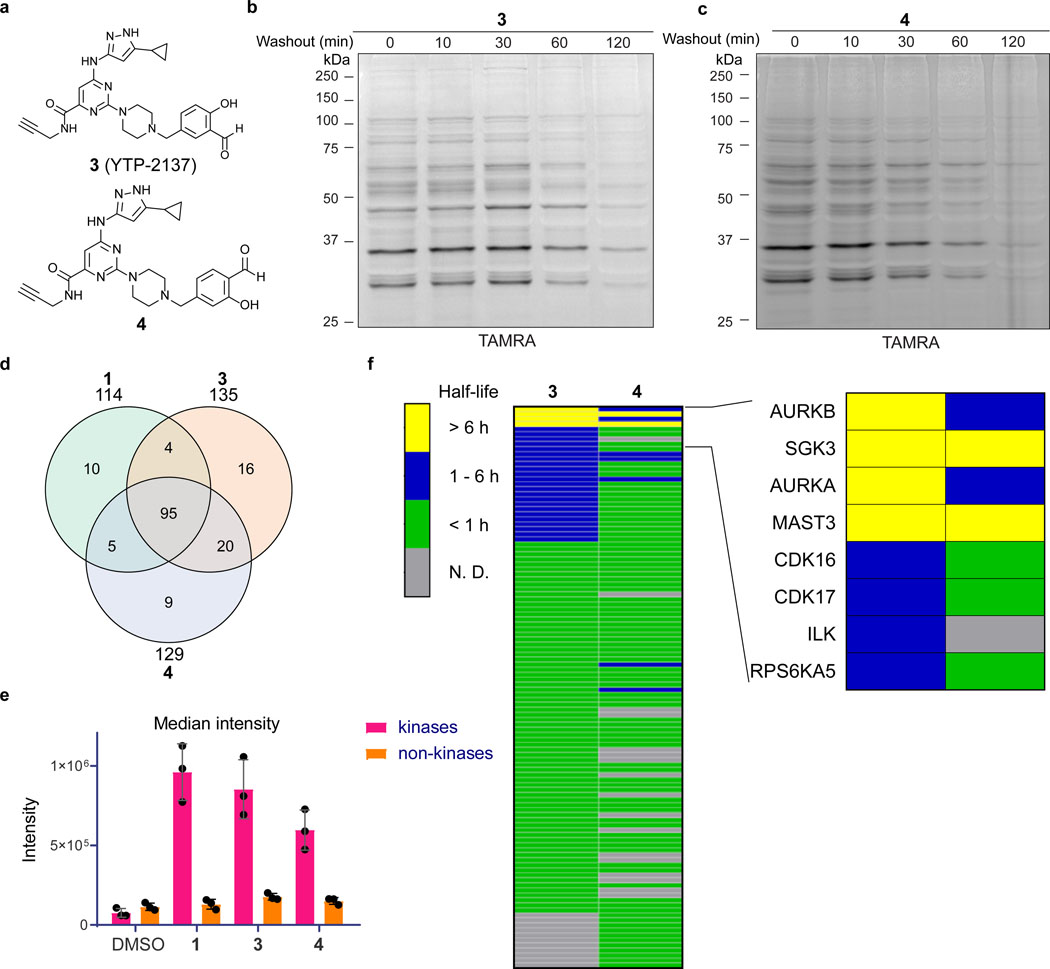
Salicylaldehydes can form imines with enhanced hydrolytic stability conferred by an intramolecular hydrogen bond.30–31 Given the rapid loss of probe 1 labeling upon washout, we hypothesized that salicylaldehyde-based probes 3 (also referred to as YTP-2137) and 4 (Figure 2a) would exhibit longer residence times. Like probe 1, salicylaldehydes 3 and 4 labeled several cellular proteins in Jurkat cells, as revealed by TAMRA-azide click conjugation in lysates treated with sodium borohydride (Figures 2b,c; sodium borohydride was superior to cyanoborohydride for trapping salicylaldehyde/protein adducts). In contrast to the rapid decrease in labeling observed after washout of probe 1, covalent protein modification by probes 3 and 4 persisted for at least 30 min post-washout. At longer time points, reduced labeling was observed. However, certain fluorescent protein bands were detected even after a 2-h washout, suggesting that salicylaldehyde probes 3 and 4 form relatively stable imines with a subset of cellular proteins (Figures 2b,c).
Figure 2.
Salicylaldehyde probes exhibit prolonged kinase residence time in cells. (a) Salicylaldehyde probes 3 and 4. (b,c) Jurkat cells were treated with 3 (b) or 4 (c) (2 μM, 30 min), followed by compound washout for the indicated times and lysis in the presence of sodium borohydride. After click conjugation with TAMRA-azide, samples were analyzed by in-gel fluorescence and Coomassie blue staining (Supplementary Figure 2). Data are representative of two independent experiments. (d-f) Jurkat cells were treated with DMSO or probes 1, 3, and 4 (2 μM, 30 min), followed by washout as described in the main text. After click conjugation with biotin-azide, modified proteins were enriched with Neutravidin-agarose and digested on-bead with trypsin. Enriched peptides were analyzed by LC-MS/MS and label-free quantitation (LFQ). (d) Shared and unique kinases enriched by each probe. (e) Median intensity values (LFQ) for identified kinases and non-kinases (mean ± SD, n=3). (f) Heat map showing estimated half-lives (t1/2) of kinases enriched from cells treated with probes 3 and 4, followed by washout for 0, 1, 3, and 6 hr. Inset depicts kinases with prolonged engagement post-washout. Grey bars (N.D.): kinase not detected or did not meet criteria for t1/2 determination (see main text).
Cellular target engagement and residence times
To identify proteins targeted by probes 1, 3, and 4 – and more ambitiously, to estimate probe-target residence times in cells – we turned to affinity enrichment and mass spectrometry. Jurkat cells were treated with DMSO or the aldehyde probes (2 μM, 30 min) in biological triplicate, washed with PBS, and then incubated with compound-free media. Cells treated with probes 3 and 4 were collected at 0, 1, 3, and 6 h post-washout and processed as described above, except that a biotin-picolyl azide reagent (Supplementary Note) was used instead of TAMRA-azide, to provide a total of 33 affinity-enriched samples for chemoproteomic analysis (DMSO-treated cells were only collected at t=0, and probe 1-treated cells were only collected at t=0 and 1 h post-washout). After click conjugation to biotin-picolyl azide, probe-modified proteins were enriched with Neutravidin-agarose beads, followed by on-bead trypsinization and analysis of the tryptic peptide fraction by high-resolution LC-MS/MS. Because the chemoproteomic workflow involves protein denaturing conditions at multiple steps after cell lysis, we assumed that specifically enriched kinases were irreversibly linked to the probes as a result of borohydride-mediated imine reduction in non-denaturing lysis buffer. Across the three aldehyde probes, a total of 159 kinases were enriched vs. DMSO controls at the first time point (t=0 post-washout), with 95 kinases shared among the three compounds (Figure 2d and Supplementary Datasets 1–3; “enriched” kinase criteria: identified in 3/3 biological replicates with intensity values ≥10-fold higher than DMSO controls). Based on label-free quantitation, the median kinase intensity (summed over all unique peptides for each kinase) for a given probe was 4–8-fold greater than the median non-kinase intensity and 8–12-fold greater than the median kinase intensity in the DMSO control sample (Figure 2e and Supplementary Dataset 4). Together, these data demonstrate that aldehyde probes 1, 3, and 4 can preferentially enrich protein kinase targets from living cells. We additionally enriched probe 3 targets in a second cell line (K562) and found 179 kinases, of which 69 were uniquely identified in K562 cells (Supplementary Dataset 5). Based on the combined datasets from Jurkat and K562 cells, probe 3 reproducibly engages 204 kinases.
We estimated cellular residence times for each kinase in Jurkat cells by comparing probe-enriched kinase intensities at each time point after washing cells into probe-free media. To increase the robustness of our baseline intensity measurements at t=0, we included only those kinases identified by ≥3 unique peptides in all 3 biological replicates. Based on these criteria, 98, 101, and 96 kinases were included in our residence time analysis for probes 1, 3, and 4, respectively (Supplementary Datasets 6–8). All of the kinases enriched by probe 1 at t=0 showed >90% reduced intensity after a 1-h washout (Supplementary Dataset 6), consistent with the in-gel fluorescence results (Figure 1). By contrast, the salicylaldehyde probes 3 and 4 engaged 27 and 9 kinases, respectively, with estimated dissociation half-times (t1/2) of >1 h (Figure 2f, blue and yellow bars, and Supplementary Dataset 9).
Strikingly, probes 3 and 4 engaged four kinases (AURKA, AURKB, MAST3, and SGK3) and two kinases (MAST3 and SGK3), respectively, in a sustained manner, with dissociation t1/2 >>6 h (Figure 2f, yellow bars). Hence, although the salicylaldehyde probes robustly engage ~100 kinases in cells (Supplementary Dataset 9), broad target occupancy decreases upon washout such that only a small subset of kinases remain significantly engaged after 6 h (Figure 2f). Because the structurally related benzaldehyde 1 dissociated rapidly from all kinases, we hypothesized that prolonged kinase engagement by salicylaldehydes 3 and 4 is due to formation of a kinetically stable imine with a subset of kinase catalytic lysines.
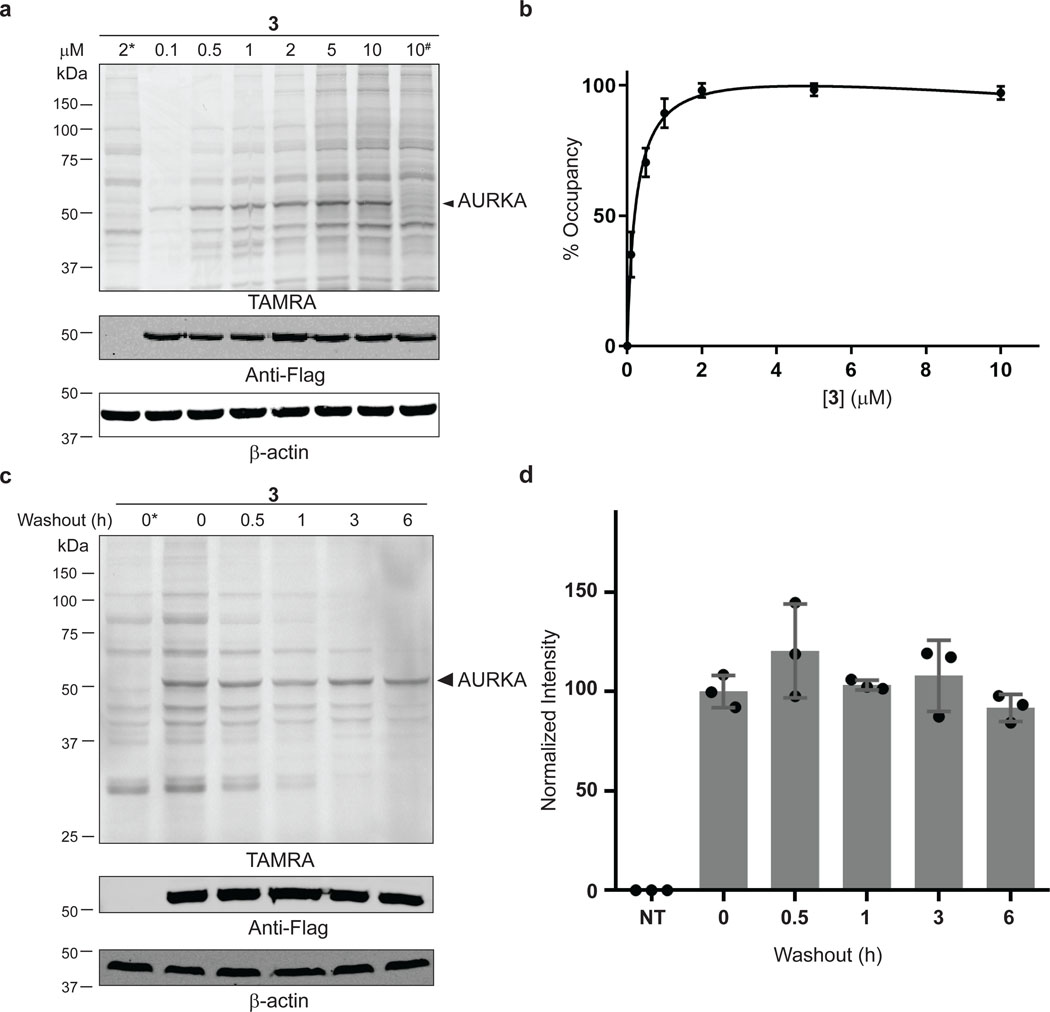
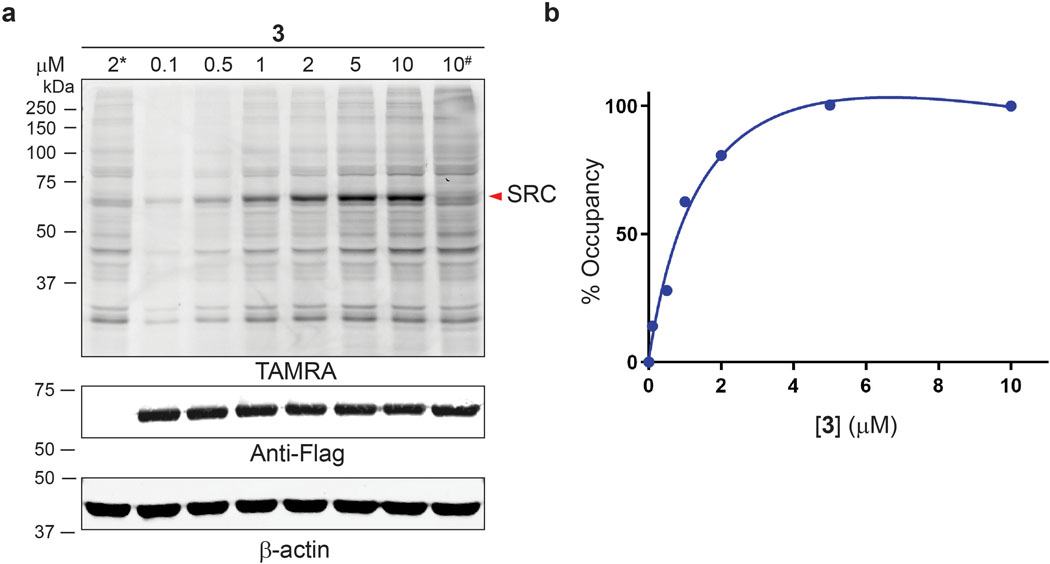
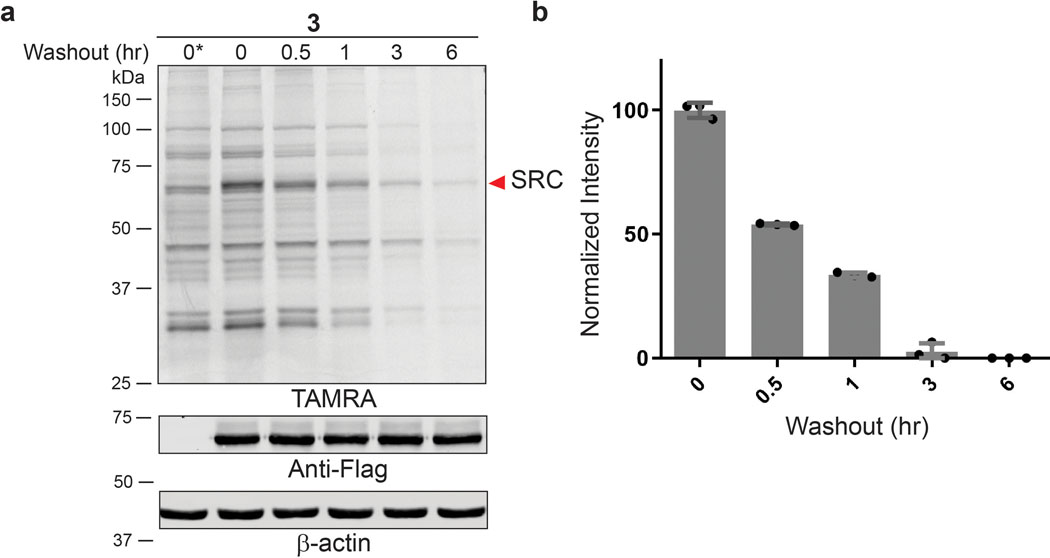
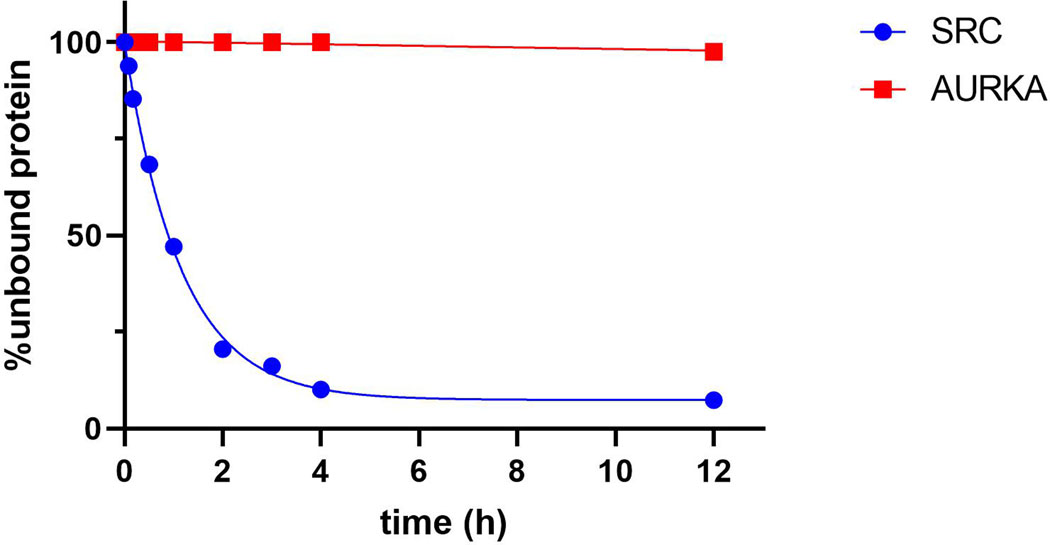
To validate the chemoproteomic data, we focused on two kinases, AURKA and SRC, which were found to engage probe 3 with long (t1/2 >> 6 h) and short (t1/2 < 1 h) residence times, respectively. We first tested the ability of probe 3 to covalently modify overexpressed AURKA. COS-7 cells were transfected with Flag-tagged AURKA, followed by treatment with probe 3 for 30 min. After cell lysis (with NaBH4 reduction) and TAMRA-azide click conjugation, in-gel fluorescence revealed a major 50-kDa fluorescent band in AURKA-transfected cells, which appeared to reach saturation at ~2 μM probe 3 (EC50 ~300 nM, Figure 3a,b). This band was not observed in non-transfected cells or in cells transfected with K162Q AURKA, in which the catalytic lysine is mutated to glutamine (Figure 3a). Consistent with the chemoproteomic data, AURKA engagement by probe 3 was quasi-irreversible in cells, as shown by a washout experiment (Figure 3c,d). By contrast, probe 3 rapidly dissociated from overexpressed SRC with t1/2 ~30 min, despite saturably modifying the SRC catalytic lysine with an EC50 of ~600 nM (Extended Data Figures 2 and 3). This striking difference in residence time was recapitulated in biochemical off-rate measurements using purified recombinant AURKA and SRC kinase domains (Extended Data Figure 4).
Figure 3.
Quasi-irreversible engagement of AURKA in cells. (a) COS-7 cells were transfected with WT or K162Q (#) Flag-AURKA and treated with probe 3 (30 min). After lysis in the presence of sodium borohydride and TAMRA-azide conjugation, samples were analyzed by in-gel fluorescence and western blotting. (b) Concentration-dependent labeling of Flag-AURKA (~50 kDa TAMRA band, mean ± SD, n=3). (c,d) COS-7 cells were transfected with Flag-AURKA and treated with probe 3 (2 μM, 30 min), followed by washout for the indicated times. Samples were analyzed as described above (mean ± SD, n=3). * and NT indicate non-transfected cells.
Cocrystal structure of AURKA bound to probe 3
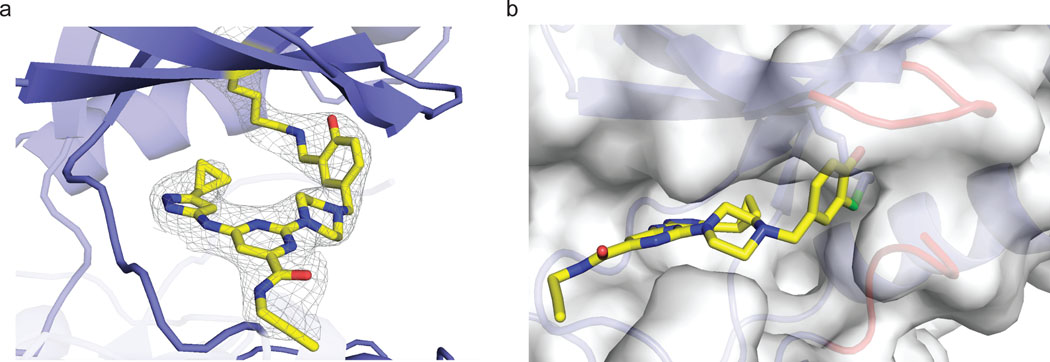
To gain molecular insight into quasi-irreversible binding of probe 3 to AURKA, we co-crystallized the reversible covalent complex without borohydride reduction and determined the structure at a resolution of 2.3 Å (Figure 4). Similar to previous kinase structures bound to the same scaffold,25 the aminopyrazole forms three hydrogen bonds with the AURKA hinge region. Imine formation between the ε-amine of K162 and the aldehyde of probe 3 was evident from the electron density map (Figure 4a). Strikingly, the orientation of the lysine side chain relative to the salicylaldehyde allows formation of an intramolecular hydrogen bond between the imine and the ortho-phenol. This hydrogen bonding interaction has previously been postulated to endow salicylaldehyde-derived imines with enhanced hydrolytic stability.30 Furthermore, the imine carbon-nitrogen double bond, which must be attacked by a water molecule to reverse adduct formation, is shielded from bulk solvent by residues in the glycine-rich loop, including F144, as well as the N-terminal portion of the activation segment (D274-S278), which is partially ordered in the AURKA/3 crystal structure (Figure 4b). In addition to affecting the imine hydrolysis rate, these interactions may also contribute to a faster on-rate for AURKA relative to other kinases. We speculate that simultaneous formation of cooperatively stabilizing interactions is only possible with a subset of protein kinases, including the four kinases found to engage probe 3 in a sustained, washout-resistant manner. Nevertheless, we have not been able to identify conserved structure or sequence features that can account for quasi-irreversible binding to all four kinases.
Figure 4.
Co-crystal structure of AURKA bound to salicylaldehyde 3. (a) Salicylaldehyde 3 forms an imine bond with the catalytic lysine of AURKA. Electron density map (2Fo-Fc) is shown at a contour level of 1σ. (b) Surface rendering of AURKA bound to probe 3, highlighting the Gly-rich loop (red, top right) and the activation segment (red, bottom right), both of which shield the salicylaldimine from bulk water (imine carbon in green).
Residence time-based selectivity in vivo
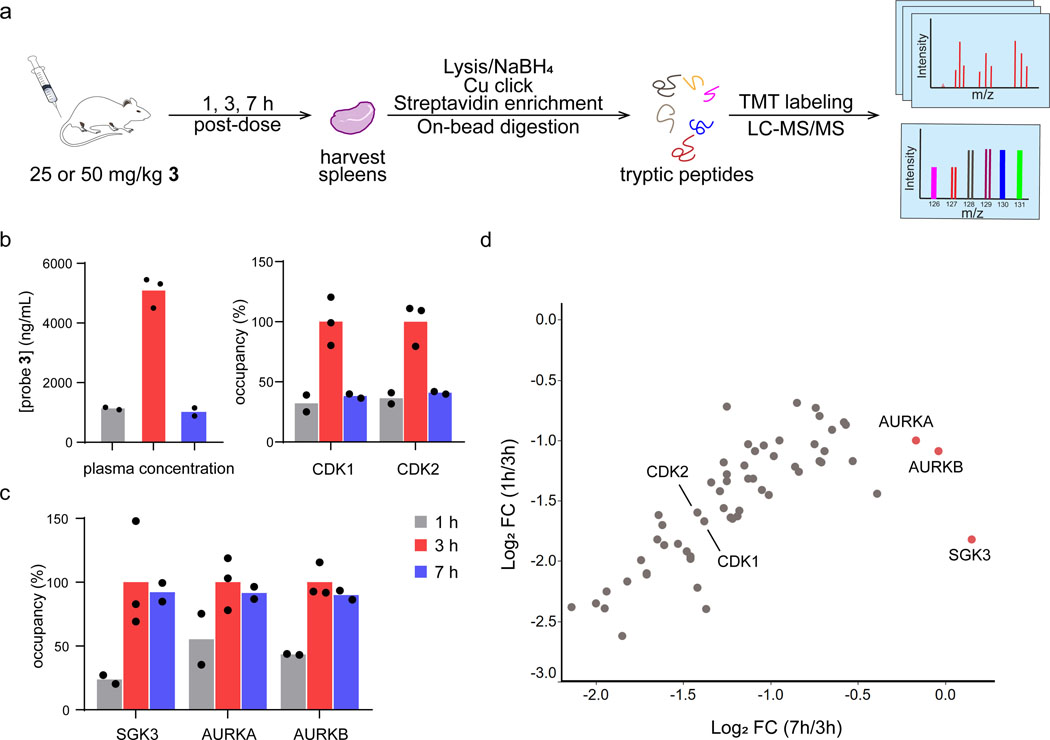
Given the encouraging results with probe 3 in cultured cells, we were motivated to test its suitability as a kinase probe in vivo. We dosed mice with vehicle or probe 3 (25 or 50 mg/kg, subcutaneous injection) and collected plasma and spleen tissue at 1, 3, and 7 h post-dose (Figure 5a). Depending on the dose, mean plasma concentrations of probe 3 were ~1 μg/mL at the earliest time point (t=1 h), increased to ~5 μg/mL at 3 h, and finally returned to ~1 μg/mL at 7 h (Supplementary Table 2). To assess target engagement in vivo, we employed our chemoproteomic workflow with 10-plex tandem mass tags (TMT) for relative quantification. Our objective was to quantify kinase engagement in one TMT10 experiment across all three time points (probe 3 for 1, 3, or 7 h) with a vehicle control (10 samples total, with 2 or 3 mice for each of the four conditions). The most important samples for comparing kinase residence times were from the 3 h and 7 h time points, corresponding to the maximum and subsequent minimum plasma concentrations of probe 3. We chose the 50 mg/kg dose group for these samples, because the difference in probe 3 plasma concentrations between t=3 h and 7 h was greatest for these mice. Spleens from the lower dose group (25 mg/kg) were used for the t=1 h time point, because the mean plasma concentrations of 3 closely matched that of the 50 mg/kg dose group at t=7 h (Supplementary Table 2). Direct comparison of these samples would thus allow assessment of whether kinase engagement correlated with plasma concentrations of probe 3 across time points (t=1, 3, or 7 h post-dose). After homogenization, spleen lysates were immediately treated with 5 mM sodium borohydride prior to click conjugation, affinity enrichment, and on-bead trypsinization. Tryptic peptides from each sample were TMT labeled, then combined and analyzed by mass spectrometry using SPS-MS3 quantification with real-time search.32 MS analysis revealed specific enrichment of 59 kinases at 3 h post-dose (log2 FC ≥1 vs. vehicle control, p < 0.05, Supplementary Dataset 10), including 6 kinases that were not identified in Jurkat or K562 cells (Extended Data Figure 5, Supplementary Dataset 10). Most kinases behaved like CDK1 and CDK2 (Figure 5b,d), in that kinase occupancy vs. time correlated with the plasma concentrations of probe 3. This pharmacodynamic behavior is consistent with relatively rapid dissociation of probe 3 from the majority of kinases between 3 h and 7 h post-dose, concomitant with clearance of probe 3 from the circulation. Strikingly, three kinases – AURKA, AURKB, and SGK3 – exhibited a distinct pharmacodynamic pattern, maintaining similar levels of probe 3 occupancy at 3 h and 7 h, despite the ~5-fold reduction in probe 3 plasma concentrations (Figure 5c,d, Supplementary Dataset 11). That probe 3 was found to exhibit sustained occupancy of AURKA, AURKB, and SGK3 in mice is remarkable and provides independent corroboration of our chemoproteomic findings in Jurkat cells.
Figure 5.
Quantifying kinase occupancy by salicylaldehyde 3 in mice. (a) Mice were dosed with vehicle or probe 3 (25 or 50 mg/kg) by subcutaneous injection. At 1, 3, and 7 h post-dose, plasma and spleens were collected for quantification of probe 3 concentrations and kinase occupancy, respectively. Spleens from each time point were selected for chemoproteomic analysis (biotin-azide conjugation, streptavidin pulldown, 10-plex TMT quantitation) based on the probe 3 plasma levels quantified from the same mice (see main text and Supplementary Table 2). Spleens from vehicle-treated mice were collected at t=7 h post-injection. (b-c) Plasma concentrations of probe 3 and relative occupancy of the indicated kinases (normalized to t=3 h) are plotted for each time point (t=1 and 7 h, n=2; t=3 h, n=3). (d) Scatter plot comparing relative kinase occupancy (log2 fold-change vs. kinase occupancy at t=3 h) at t=7 h vs. t=1 h. Each circle represents one kinase, with AURKA, AURKB, and SGK3 showing the highest occupancy at t=7 h, despite decreased plasma levels of probe 3.
Use of probe 3 to quantify drug-kinase engagement in mice
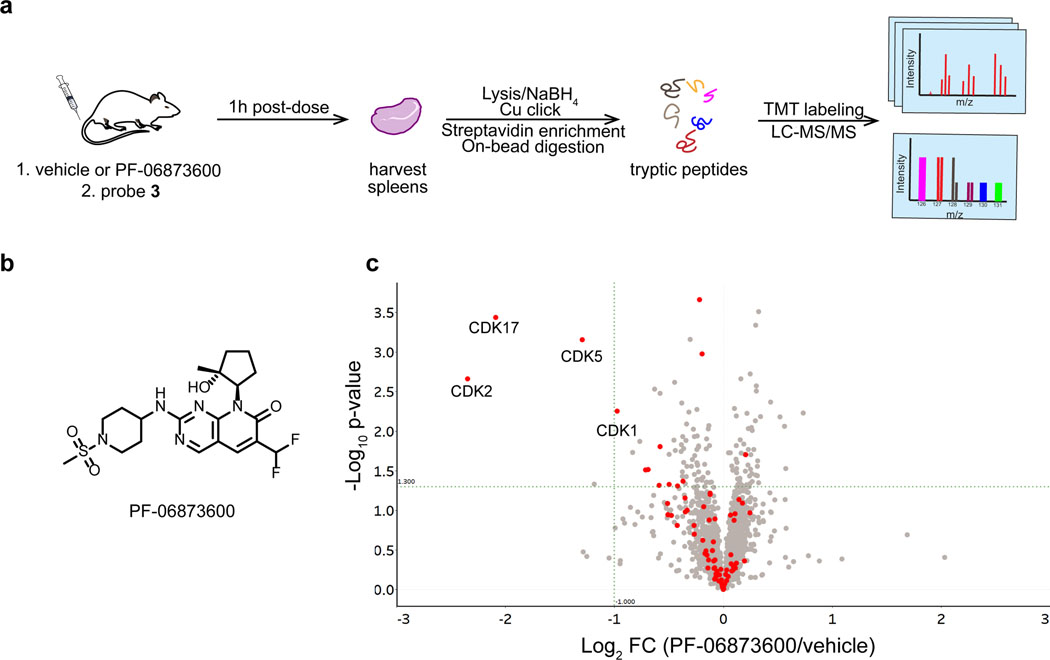
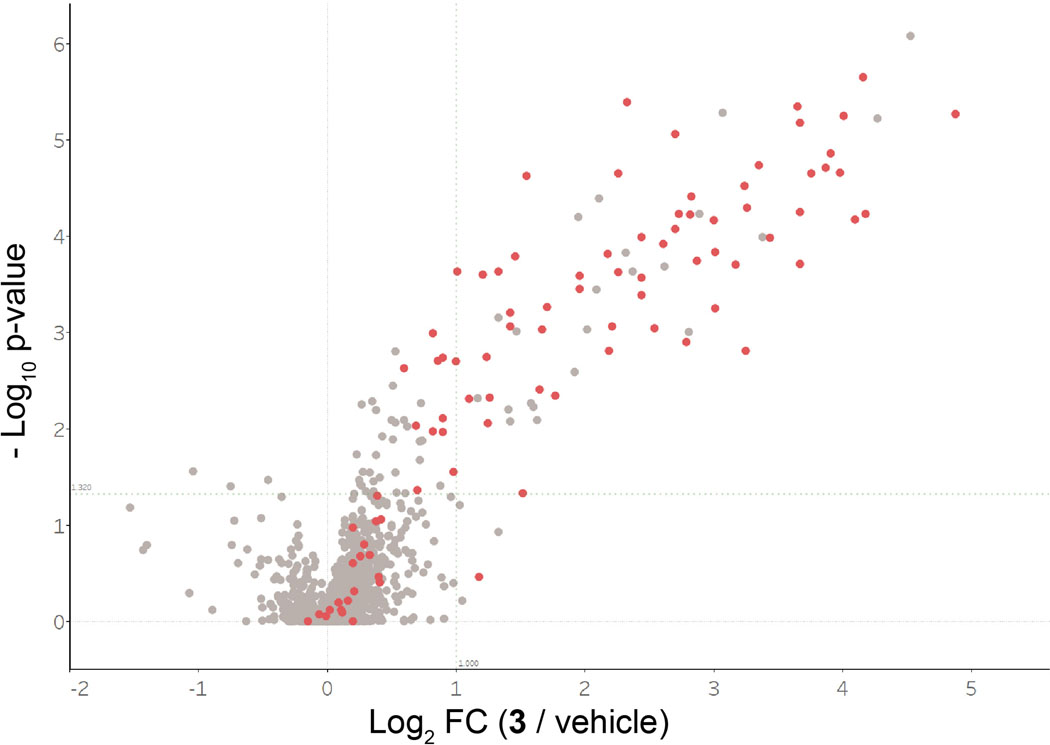
As a further demonstration of the utility of the clickable salicylaldehyde probe 3, we performed a competitive labeling experiment in mice to quantify kinase engagement by PF-06873600 (Figure 6a,b). PF-06873600, a recently disclosed CDK2/4/6 inhibitor in Phase 2 clinical trials for metastatic breast and ovarian cancer (NCT03519178), exhibits greater biochemical and cellular potency vs. CDK2 as compared to CDK1, a closely related off-target kinase.28 To assess target engagement in vivo, mice were dosed orally with PF-06873600 (50 mg/kg, n=5) or vehicle (n=5), followed by subcutaneous injection with probe 3 (10 mg/kg), which we used at a lower dose than in the study shown in Figure 5. After one hour, spleens were collected, processed, and analyzed as described above using 10-plex TMT to quantify relative kinase enrichment by probe 3 in the presence and absence of PF-06873600 (Figure 6c, Supplementary Dataset 12). Chemoproteomic analysis revealed significantly decreased enrichment of CDK2, as well as the poorly characterized kinase CDK17 (log2 FC < –2, p < 0.05), from mice treated with PF-06873600. To a lesser extent, PF-06873600 also reduced probe 3 engagement of the off-target kinases, CDK5 and CDK1 (log2 FC ~ –1, p < 0.05). Hence, PF-06873600, which is well tolerated and efficacious in CDK2-driven tumor models,28 significantly engages CDK2 in spleen tissue, with an estimated occupancy of >80% based on competition with probe 3. Our chemoproteomic results demonstrate – for the first time, to our knowledge – the feasibility of conducting competitive kinase engagement experiments in animals using a reversible lysine-targeted occupancy probe.
Figure 6.
Salicylaldehyde probe 3 reveals PF-06873600 target engagement in vivo. (a) Mice were dosed orally with vehicle (n=5) or PF-06873600 (50 mg/kg, n=5), and all mice were co-dosed with probe 3 (10 mg/kg) by subcutaneous injection. After 1 h, spleens were collected for chemoproteomic analysis. (b) Chemical structure of PF-06873600. (c) Volcano plot showing log2 fold-change and significance (−log10 p-value) between proteins enriched by probe 3 from mice treated with PF-06873600 vs. vehicle. Red, kinases; gray, non-kinases.
Discussion
In this study, we have developed and characterized salicylaldehyde-based reversible covalent kinase probes suitable for in vivo experiments. Using our clickable aldehyde probes and chemoproteomic pipeline, we identified >200 kinases across experimental conditions, including 59 kinases enriched from mice dosed with YTP-2137 (probe 3). Despite broad kinase engagement – as expected for a promiscuous scaffold that covalently modifies the conserved catalytic lysine – we uncovered striking kinetic discrimination based on distinct salicylaldehyde/kinase residence times. This residence time-based discrimination represents a previously unexplored concept for achieving selectivity with covalent kinase inhibitors that target the catalytic lysine. Kinase selectivity – driven by differences in both on and off-rates – could be improved further by linking the salicylaldehyde to a more selective noncovalent-recognition scaffold. The precise geometry of the salicylaldehyde, and hence the resulting imine, likely contributes to residence time (as well as the on-rate), as evidenced by comparing the salicylaldehyde regioisomers YTP-2137 and 4 (Figure 2f). Finally, our results with PF-06873600 demonstrate the feasibility of using clickable salicylaldehyde YTP-2137 as a competitive occupancy probe in mice.
The kinases that bind most tightly to probes YTP-2137 and 4 play disparate roles in cell biology and disease. AURKA and AURKB have distinct functions in cell cycle progression and cancer.33 AURKA has been shown to drive neuroblastoma progression through its interactions with MYCN.34–36 Moreover, recent work suggests that inhibition of AURKA can overcome acquired or intrinsic resistance to PI3K inhibitors in preclinical breast cancer models.37 MAST3 regulates the response to changes in cyclic AMP in neurons,38 and recurrent, potential gain of function mutations in the MAST3 kinase domain have been implicated in epilepsy.39 By contrast, SGK3 acts downstream of VPS34 and Class I PI3Ks and can substitute for AKT signaling in various cancers.40–42 Few selective inhibitors have been reported for either MAST3 or SGK3. Our results suggest the possibility of developing salicylaldehyde-based inhibitors with prolonged residence times for these and many other therapeutically relevant kinases, which lack a druggable cysteine.
Online methods
General materials and methods
Cell culture
All cell lines were obtained from ATCC, tested negative for mycoplasma contamination, and were used without further authentication. Jurkat (ATCC# CRL-2570) and K562 (ATCC# CRL-3344) cells were cultured in RPMI 1640, GlutaMAX (Thermo Fisher Scientific #61870036), 10% fetal bovine serum (Axenia Biologix #F001), and 1% penicillin-streptomycin (Gibco #15140122). COS-7 cells (ATCC# CRL-1651) were cultured in DMEM, GlutaMAX (Thermo Fisher Scientific #10569069), 10% fetal bovine serum, and 1% penicillin-streptomycin. Cells were maintained in a humidified 37 ˚C incubator with 5% CO2.
Probe synthesis
Synthesis methods can be found in the Supplementary Note.
Compound treatment and preparation of cell lysates
Jurkat or K562 cells (1×10⁶/mL) were treated with probes 1-4 or XO44 (2 μM) at 37 ˚C for 30 min. Cells were pelleted by centrifugation at 500 x g for 5 min and washed with warm PBS. They were then resuspended in warm compound-free media and incubated at 37 ˚C for the duration of the washout period. Finally, cell pellets were collected by centrifugation at 500 x g at 4 ˚C and lysed in 100 mM HEPES pH 7.5, 150 mM NaCl, 0.1% NP-40, 1 mM PMSF, 1X complete EDTA-free protease inhibitor cocktail (Sigma-Aldrich #11873580001); 25 mM NaCNBH3 (probes 1 and 2) or 5 mM NaBH4 (probes 3 and 4) were added immediately before lysing the cells. Lysates were cleared by centrifugation (16,000 x g, 30 min, 4 °C). Protein concentration was determined by the BCA assay (Thermo Fisher #23225). Cell lysates were normalized to 5 mg/mL protein with lysis buffer for the subsequent Cu(I)-catalyzed click reactions.
Click chemistry with TAMRA-azide and in-gel fluorescence (Jurkat cell lysates)
Click chemistry was performed by combining 42 μL of cell lysate with 8 μL of click chemistry cocktail, resulting in a final concentration of 1% SDS, 100 μM TAMRA-azide (Click Chemistry Tools #1245–5), 1 mM TCEP, 100 μM TBTA (from a 2 mM stock prepared in 1:4 DMSO:t-butyl alcohol), and 1 mM CuSO4. After incubation at room temperature for 90 min, the click reaction was quenched by adding 10 μL of 6X Laemmli sample buffer. Proteins were resolved by SDS-PAGE. Gels were washed with deionized water and scanned for TAMRA fluorescence (Typhoon Imaging System, Molecular Dynamics). Gels were then processed for western blotting or stained with Coomassie blue. All in-gel fluorescence images were processed by Windows ImageJ bundled with 64-bit Java 1.8.0_172 software (National Institute of Health), and contrast was adjusted appropriately. Western blots were analyzed with Image Studio Lite software (LI-COR Biosciences).
Pulldown of probe-modified proteins and on-bead digestion (Jurkat and K562 cells)
Lysates from probe-treated Jurkat or K562 cells (1.2 mL, 5 mg/mL) were incubated with 40 μL of settled streptavidin agarose beads (Thermo #20353) at 4 ˚C overnight to remove endogenous biotinylated proteins. Beads were removed by filtration (Pall #4650). The filtrate (1 mL) was combined with 191 μL of click chemistry cocktail, resulting in a final concentration of 1% SDS, 5 μM biotin-DMTP-picolyl azide (synthesis described below), 1 mM TCEP, 100 μM TBTA (from a 2 mM stock prepared in 1:4 DMSO:t-butyl alcohol), and 1 mM CuSO4. After incubation at room temperature for 90 min, 40 μL of settled high-capacity Neutravidin agarose beads (Thermo Fisher #29204) were added to each sample and incubated at 4 ˚C overnight. The beads were then washed with 1% NP-40, 0.1% SDS in PBS (3 × 10 min, RT), freshly prepared 6 M urea in PBS (3 × 30 min, 4 ˚C) and PBS (3 × 10 min, RT), before a brief wash in digestion buffer (20 mM Tris, 2 mM CaCl2, pH 8). Disulfide reduction was performed with 5 mM DTT at 56 ˚C for 30 min, followed by alkylation with 20 mM iodoacetamide at room temperature for 30 min in the dark. On-bead digestion was performed by adding 1 μg sequencing grade trypsin (Promega #V5113) in 100 μL digestion buffer to each sample, and incubating overnight at 37 ˚C. Digestion was quenched by adding 1% formic acid. The resulting peptides were desalted with C18 Omix Tips (Agilent #A57003100) and eluted with 50% MeCN, 0.1% formic acid (FA) in water. The samples were dried down by SpeedVac.
LC-MS/MS analysis of tryptic peptides prepared by on-bead digestion (Jurkat and K562 cells)
Tryptic peptides were reconstituted in 0.1% FA and analyzed on a Fusion Lumos Tribrid (Thermo) connected to an ACQUITY M-Class UPLC system (Waters) (Jurkat cells), or an Orbitrap Eclipse Tribrid Mass Spectrometer (Thermo) connected to an Ultimate 3000 RSLCnano system (K562 cells), and an EASY-Spray 75 μm x 15 cm C18 column with 3 μm particle size (Thermo Fisher #ES800). Peptides were loaded onto a column warmed to 45 ˚C, and equilibrated with 5% B (0.1% FA in MeCN) for 3 min at 600 nL/min, and then eluted with a flow rate of 300 nL/min using 5% solvent B for 3 min, followed by 5–30% B for 72 min, 50% B for 2 min, and 5% B for 6 min. Precursor ion mass to charge ratios (MS1) were measured in the orbitrap at a resolution of 120K, a scan range of 375–1500 m/z, an AGC target of 40,000, and a maximum injection time of 50 ms with internal calibration enabled. Ions with a peptide-like isotopic distribution (MIPS set to “peptide”) that exceeded an intensity threshold of 20,000 and contained a charge between 2 and 7 were selected for HCD fragmentation. MS2 spectra of HCD-fragmented peptides were collected using a 1.6 m/z isolation window and an HCD collision energy of 30%. Fragment ions were measured in the orbitrap at a resolution of 30K and were collected with an AGC target of 50,000 and a maximum injection time of 100 ms. Peptides selected for fragmentation were dynamically excluded for the following 30 seconds using a 10-ppm window. The maximum duty cycle was set to 3 s.
Database matching and peptide quantification (Jurkat and K562 cells)
Raw files were converted into peaklists using in-house software. Database search was performed using Batch-Tag within Protein Prospector 5.23.0 against a human SwissProt database concatenated with a corresponding randomized decoy database. Only tryptic peptides with ≤1 missed cleavage were considered. Carbamidomethylation of cysteine was included as a constant modification, while methionine oxidation, acetylation of the N-terminus, N-terminal glutamine to pyroglutamate conversion, and loss of the N-terminal methionine were included as variable modifications. Precursor tolerance was set to 20 ppm, while fragment tolerance was set to 30 ppm. Following database matching, quantification of peptide intensity was performed using Search Compare within Protein Prospector. The maximum peptide false discovery rate was set to 1%. Extracted ion chromatograms (XICs) were prepared for each peptide and used to calculate intensities with a retention time window of ± 20 seconds.
Label-free protein quantification and estimation of probe-kinase dissociation rates
Protein intensities were calculated from the sum of the individual unique peptide XICs using an in-house script. Relevant to Figure 2d, a kinase was defined as specifically enriched by a probe if it was identified with ≥1 unique peptide in all three biological replicates and had a protein intensity value ≥10-fold higher than the DMSO control. Enriched kinases identified with ≥3 unique peptides in all three biological replicates were selected for estimation of probe-kinase dissociation half-life (Figure 3f). The dissociation half-life (t1/2) of a given probe for each kinase was estimated by fitting kinase intensity values at each time point (post-washout) to a single-exponential decay function using the lmfit python curve-fitting module.
Plasmid DNA transfection and compound treatment
COS-7 cells were seeded in 6-well plates and grown until they reached ~80% confluency. To prepare the transfection complex, 2.5 μg of plasmid DNA (pCMV7.1 containing human AURKA or human SRC with an N-terminal 3xFlag tag) in 150 μL of Opti-MEM I Reduced-Serum Medium (Gibco #31985062) were mixed with 7.5 μL of Lipofectamine 2000 transfection reagent (Thermo Fisher #11668019) in 150 μL of OPTI-MEM, and incubated at RT for 30 min. Then 300 μL of DNA-Lipofectamine complexes were added to each well, and cells were incubated at 37 ˚C for 48 h. Media was exchanged with fresh media 3 h before compound treatment. Cells were treated with probe 3 for 30 min at 37 ˚C, washed with warm PBS, and incubated with compound-free media for the duration of the washout period. Cells were then rinsed 3x with cold PBS and frozen at –80 ˚C. Lysates were prepared by scraping the cells in PBS containing 2x complete EDTA-free protease inhibitor cocktail (Sigma-Aldrich #11873580001) and 5 mM NaBH4, followed by a 30-min incubation on ice. Lysates were cleared by centrifugation at 16,000 x g for 30 min at 4 ˚C. Protein concentration was determined by the BCA assay (Thermo Fisher #23225). Cell lysates were normalized to 5 mg/mL with lysis buffer for the subsequent Cu(I)-catalyzed click reactions.
Western blotting
After in-gel fluorescence scanning, proteins were transferred from the gels to 0.45 μm nitrocellulose membranes (Bio-Rad#1620115) followed by blocking with 2% BSA in TBST buffer (0.1% Tween-20 in TBS buffer) at RT for 1 h. Membranes were then incubated with primary antibody (Flag: Sigma-Aldrich #F3165; β-actin: Cell Signaling #3700; 1:1000 dilution) at 4 ˚C overnight, followed by TBST wash for 3 × 10 min at RT. Secondary antibody (LI-COR, IRDye 800CW goat anti-mouse IgG, catalog# 926–32210, 1:10000 dilution; IRDye 680CW goat anti-mouse IgG, catalog# 926–68070, 1:10000 dilution) incubation was performed at RT for 1 hr. Membranes were washed with TBST for 3 × 10 min at RT, scanned on an Odyssey infrared imager (LI-COR Biosciences), and analyzed with Image Studio Lite software (LI-COR Biosciences).
Protein expression and purification
His-tagged AURKA (residues 122–403) bearing C290A/C393A mutations in pET28a with a PreScission protease cleavage site was co-transformed with lambda phosphatase in a pCDF Duet vector (Promega) into BL-21(DE3) E. coli and purified as previously described.35, 43 The final protein was stored in size exclusion buffer (20 mM Tris pH 7.0, 200 mM NaCl, 5 mM MgCl2, 10% glycerol) and used directly for crystallization. His-tagged recombinant chicken c-Src kinase domain (residues 251–533) was purified as previously described.25
Determination of the dissociation rates of probe 3 on AURKA and SRC by LC-MS
Recombinant AURKA or SRC (5 μM) was treated with probe 3 (5.1 μM) in 50 mM HEPES, pH 8.0 at RT for 5 min, followed by 20-fold dilution into HEPES buffer containing 10 μM XO44. Aliquots were removed at the indicated time points, quenched with 2.5% formic acid, and analyzed by intact-protein LC−MS (Waters Xevo G2-XS QToF). The percentage of XO44-unmodified kinase was plotted vs. time and fitted to a one-phase decay in Prism 8 (GraphPad).
Protein crystallization
AURKA (5 μM) was incubated with probe 3 (15 μM) in 20 mM Tris pH 7.0, 200 mM NaCl, 5 mM MgCl2, 10% glycerol at RT for 1 h. The AURKA complex with probe 3 was concentrated to 18 mg/mL for crystallization. Hanging drops were prepared as a 1:1 mixture of protein-ligand complex and precipitation solution (0.2 M lithium sulfate, 0.1 M BIS-TRIS pH 5.5, 25% w/v polyethylene glycol 3350). Crystals were grown at RT for 3–5 d.
Crystal structure determination
Crystals were cryoprotected in the precipitation solution supplemented with 20% glycerol and stored in liquid nitrogen. Diffraction data were collected at beamline 8.3.1 of the Advanced Light Source (Lawrence Berkeley National Laboratory). An automated script for the XDS package44 was used to index, integrate, and scale the reflections. Data collection and refinement statistics are summarized in Supplementary Table 1. Molecular replacement was conducted using Phaser45 against 4CEG (PDB code) and the model was iteratively refined using Phenix.Refine46 with manual modeling and adjustments carried out in COOT47. The description of the ligand and the covalent link was generated with JLigand48 and refined with Refmac49.
Mouse studies
All in vivo studies were conducted in accordance with the current guidelines for animal welfare (National Research Council Guide for the Care and Use of Laboratory Animals, 2011). The procedures used were reviewed and approved by the Institutional Animal Care and Use Committee. Male CD-1 (Crl:CD1[ICR]) mice approximately 7 – 9 weeks old weighing between 20 – 40 grams were housed (up to 3/cage) at standard temperature, humidity and lighting conditions with purified water and rodent diet provided ad libitum. Mice were acclimated to the laboratory environment for a minimum of 5 days prior to initiation of dosing, then randomized to groups based on body weights. Probe 3 was formulated in a vehicle consisting of 10% ethanol, 50% polyethylene glycol 400, 10% Kolliphor EL and 30% sterile water. PF-06873600 was formulated in a vehicle consisting of 0.5% methylcellulose A4M and 0.1% Tween 80 in sterile water. In the experiment presented in Figure 5, groups of mice were administered a single dose of vehicle, 25 or 50 mg/kg of probe 3 by the subcutaneous route then observed after dosing for clinical signs. After euthanasia by exposure to isoflurane gas and exsanguination, plasma was collected (1, 3 or 7 h after dosing) using lithium heparin separation tubes then flash frozen in liquid nitrogen. Tissues were collected, then flash frozen in liquid nitrogen. In the experiment presented in Figure 6, a single dose of vehicle or 50 mg/kg of PF-06873600 was administered by oral gavage followed by a single 10 mg/kg dose of probe 3 administered by the subcutaneous route 30 min later. Plasma and tissue samples were collected after 1 h, and flash frozen as previously described, corresponding to 90 min after administration of PF-06873600. Plasma samples or standard curves made with spiked analyte were subjected to protein precipitation then centrifuged to obtain supernatants for analysis of analyte concentrations on a Sciex Qtrap 5500–02 (Sciex, Framingham, MA) LC/MS/MS instrument.
Mouse spleen sample preparation for LC-MS/MS analysis
Frozen spleens from vehicle- and probe 3-treated mice were homogenized on ice in 100 mM HEPES pH 7.5, 150 mM NaCl, 0.1% NP-40 using a Tissue Tearor (Biospec Model 985370–395). Proteins were clarified by centrifugation (16,000 g, 4 ˚C, 30 min). Imine reduction was performed by adding 5 mM NaBH4 for 30 min on ice. Protein concentrations were quantified by BCA (Thermo Fisher #23225) and normalized to 5 mg/mL. Spleen lysates (1.2 mL) were incubated with 40 μL of settled streptavidin agarose beads (Thermo Fisher #20353) at 4 ˚C overnight to remove endogenous biotinylated proteins. Beads were removed by filtration (Pall #4650). The filtrate (1 mL) was reacted with 191 μL of click chemistry cocktail, resulting in a final concentration of 1% SDS, 100 μM biotin-DMTP-picolyl azide, 1 mM TCEP, 100 μM TBTA (from a 2 mM stock prepared in 1:4 DMSO:t-butyl alcohol), and 1 mM CuSO4. After incubation at RT for 90 min, the proteins were precipitated by adding 10 mL of prechilled acetone and incubating overnight at –20 ˚C. The precipitated proteins were pelleted by centrifugation (3500 g, 4 ˚C, 30 min), resuspended in cold MeOH and re-pelleted. The pellet was solubilized in 1% SDS in PBS, diluted to a final detergent concentration of 0.4% SDS, 0.6% NP-40 in PBS, and desalted on a NAP-10 column (Cytiva #17–0854-02) using 0.1% SDS, 1% NP-40 in PBS. The column eluate was incubated with 40 μL of settled high-capacity streptavidin magnetic beads (Thermo Fisher #88817) overnight at 4 ˚C. The beads were then washed with 1% NP-40, 0.1% SDS in PBS (3 × 10 min, RT), freshly prepared 6 M urea in PBS (3 × 30 min, 4 ˚C) and PBS (3 × 10 min, RT), before a brief wash in digestion buffer (20 mM Tris, 2 mM CaCl2, pH 8). Disulfide reduction was performed with 5 mM DTT at 56 ˚C for 30 min, followed by alkylation with 20 mM iodoacetamide at RT for 30 min in the dark. On-bead digestion was performed by adding 1 μg sequencing grade trypsin (Promega #V5113) in 100 μL digestion buffer to each sample, and incubating overnight at 37 ˚C. Digestion was quenched by adding 1% formic acid. The resulting peptides were desalted with C18 Omix Tips (Agilent #A57003100) and eluted with 50% MeCN, 0.1% FA. The samples were dried down by SpeedVac.
TMT labeling of tryptic peptides from mouse spleen samples
TMT labeling was performed with the TMT 10-plex kit (Thermo Fisher #SK257743) according to the manufacturer’s instructions with minor modifications. Briefly, peptides were reconstituted in 10 μL of 30% MeCN in 200 mM HEPES buffer pH 8.5. TMT reagents were reconstituted in 20 μL of MeCN per vial, and 1.3 μL of this stock solution was added to each sample for 1 h at RT. Reactions were quenched by adding 1.2 μL of 5% hydroxylamine and incubated at RT for 15 min, followed by adding 1.3 μL of 5% TFA to acidify the solution. TMT-labeled samples were pooled and concentrated by SpeedVac to remove MeCN, and desalted using C18 Omix Tips (Agilent #A57003100). Peptides were eluted with 50% MeCN, 0.1% TFA, and dried by SpeedVac.
LC-MS/MS analysis of mouse spleen samples
TMT-labeled tryptic peptides were reconstituted in 5% MeCN, 0.1% TFA in water, and analyzed on a Orbitrap Eclipse Tribrid Mass Spectrometer (Thermo) connected to an Ultimate 3000 RSLCnano system with 0.1% FA as buffer A and 95% MeCN, 0.1% FA as buffer B. Peptides were separated on an EASY-Spray 3 μm, 75 μm x 15 cm C18 column (Thermo Fisher #ES800) with the following LC settings: flow rate at 0.3 μL/min, loading samples at 4% B for 20 min, then 4–11% B over 2 min, 11–37% B over 73 min, 37–84% B over 2 min and finally 84%B for 3 min. Data were acquired in a data-dependent mode. MS1 scans were acquired at a resolution of 120K with an AGC target of 4e5, m/z scan range of 400–1600, a maximum ion injection time of 50 ms, charge states of 2–8, and a 60-s dynamic exclusion time. MS2 spectra were acquired via collision-induced dissociation (CID) at a collision energy of 35%, in the ion trap with an AGC target of 1e4, isolation width of 0.7 m/z and maximum ion injection time set to ‘auto’. For real time search, MS2 spectra were searched against the Mus musculus reviewed Swiss-Prot FASTA database (downloaded on 7/12/2020) with the digestion enzyme set to trypsin. Methionine oxidation was set as a variable modification, while carbamidomethylation of cysteine and TMT modification were set as constant modifications. For MS3 acquisition, a synchronous precursor selection (SPS) of 10 fragments was acquired in the orbitrap for a maximum ion injection time of 105 ms with an AGC target of 1.5e5. MS3 spectra were collected at a resolution of 50K with HCD collision energy of 65%.
Peptide identification and TMT quantification (mouse spleen samples)
Raw files were analyzed with Thermo Proteome Discoverer (2.4) software against the Mus musculus reviewed Swiss-Prot FASTA database (downloaded on 7/12/2020). Trypsin was selected as the digestion enzyme with a maximum of 2 missed cleavages and a minimum peptide length of 6. Carbamidomethylation of cysteine and TMT modification of lysine/peptide N-terminus were set as fixed modifications, while methionine oxidation and protein N-terminus acetylation were set as variable modifications. Precursor tolerance was set to 10 ppm, and fragment tolerance was set to 0.6 Da. Peptide spectral match (PSM) and protein FDR were set to 1% and 5%, respectively. Reporter ion intensities were adjusted to correct for impurities during synthesis of different TMT reagents according to the manufacturer’s specifications. For quantification, PSMs with an average reporter signal-to-noise <9 and SPS mass match <75% were removed from the final dataset. Relative protein levels were determined by summing TMT reporter ion intensities across all corresponding PSMs (only PSMs corresponding to a unique protein match in the Swiss-Prot FASTA database were considered). For the competition experiment in Figure 6, all mice were dosed with probe 3 (10 mg/kg) along with either vehicle (n=5) or PF-06873600 (n=5). To account for slight differences in total protein recovery across parallel affinity enrichment samples (n=10 mouse spleens, each corresponding to a separate TMT 10-plex reporter), the median protein intensity for each TMT channel was used to normalize protein intensities across all TMT channels (n=10, vehicle and PF-06873600-treated mice). Mean protein intensities from each treatment arm (vehicle, n=5; PF-06873600, n=5) were log2-transformed and used to calculate the log2 fold-change between each treatment condition (Figure 6c).
Reporting summary
Further information on research design is available in the Nature Research Reporting Summary linked to this article.
Data availability
All mass spectrometry raw files have been deposited into the MassIVE database (http://massive.ucsd.edu/) and can be downloaded by the identifier MSV000088924 as well as in ProteomeXchange (http://www.proteomexchange.org/) with accession number PXD031899.Source data are provided in a Source Data File or in the Supplementary Datasets. Coordinates and structure factors have been deposited in the PDB under accession code 7FIC.
Code availability
The script used for LFQ quantification is available upon request.
Extended Data
Extended Data Fig. 1. Reversible protein labeling by benzaldehyde probe 2.
(a) Chemical structures of 1 and 2. (b) Jurkat cells were treated with 1 or 2 (2 μM, 30 min), followed by compound washout for the indicated times. Cells were lysed in the presence of 25 mM sodium cyanoborohydride, except as indicated (#). After copper-promoted click conjugation with TAMRA-azide, samples were analyzed by in-gel fluorescence and Coomassie blue staining. Data are representative of two independent experiments.
Extended Data Fig. 2. Probe 3 modification of overexpressed SRC.
(a) COS-7 cells were transfected with WT or K295Q (#) Flag-SRC, or not transfected (*), and then treated with the indicated concentrations of probe 3 (30 min). After lysis in the presence of sodium borohydride and TAMRA-azide conjugation, samples were analyzed by in-gel fluorescence and western blotting. Data are representative of two independent experiments. (b) Concentration-dependent labeling of Flag-SRC (n=2, mean values from two independently performed experiments were plotted).
Extended Data Fig. 3. Rapid dissociation of probe 3 from overexpressed SRC.
(a) COS-7 cells were transfected with Flag-SRC, or not transfected (*), and treated with probe 3 (2 μM, 30 min), followed by washout for the indicated times. After lysis in the presence of sodium borohydride and TAMRA-azide conjugation, samples were analyzed by in-gel fluorescence and western blotting. (b) Normalized fluorescence intensity of ~65 kDa band corresponding to Flag-SRC (mean ± SD, n = 3).
Extended Data Fig. 4. Dissociation of probe 3 from recombinant AURKA and SRC.
AURKA or SRC (5 μM) was treated with probe 3 (5.1 μM) in 50 mM HEPES, pH 8.0 at RT for 5 min, followed by 20-fold dilution into buffer containing 10 μM XO44. The percentage of XO44-modified and unmodified kinase was quantified by LC-MS at the indicated time points, and % unmodified kinase (corresponding to probe 3-bound kinase) was plotted vs. time (n = 2, mean values from two independently performed experiments were plotted).
Extended Data Fig. 5. Related to Figure 5.
Volcano plot showing log2 fold-change and significance (−log10 p-value; two tailed t-test assuming unequal variance) of proteins enriched by probe 3 (t=3 h post-dose) vs. vehicle. Red, kinases; gray, non-kinases.
Supplementary Material
Acknowledgments
Funding for this study was provided by the NCI (NIH NCI F31CA214028, A.C.), Ono Pharma Foundation (J.T.), and Pfizer. Mass spectrometry was supported in part by the UCSF Program for Breakthrough Biomedical Research and the Adelson Medical Research Foundation (A.L.B.).
Footnotes
Competing interests
T.Y., B.H., P.K., J.R.M., J.C.K., J.D.L., S.N., and J.D.C. are current or former employees of Pfizer. J.T. is a founder of Global Blood Therapeutics, Principia Biopharma, Kezar Life Sciences, Cedilla Therapeutics, and Terremoto Biosciences, and a scientific advisor to Entos.
References
- 1.Honigberg LA; Smith AM; Sirisawad M; Verner E; Loury D; Chang B; Li S; Pan Z; Thamm DH; Miller RA; Buggy JJ The Bruton tyrosine kinase inhibitor PCI-32765 blocks B-cell activation and is efficacious in models of autoimmune disease and B-cell malignancy. Proc Natl Acad Sci U S A 2010, 107 (29), 13075–13080. https://www.pnas.org/content/pnas/107/29/13075.full.pdf [DOI] [PMC free article] [PubMed] [Google Scholar]
- 2.Byrd JC; Furman RR; Coutre SE; Flinn IW; Burger JA; Blum KA; Grant B; Sharman JP; Coleman M; Wierda WG; Jones JA; Zhao W; Heerema NA; Johnson AJ; Sukbuntherng J; Chang BY; Clow F; Hedrick E; Buggy JJ; James DF; O’Brien S. Targeting BTK with Ibrutinib in Relapsed Chronic Lymphocytic Leukemia. N Engl J Med 2013, 369 (1), 32–42. https://www.nejm.org/doi/full/10.1056/NEJMoa1215637 [DOI] [PMC free article] [PubMed] [Google Scholar]
- 3.Finlay MRV; Anderton M; Ashton S; Ballard P; Bethel PA; Box MR; Bradbury RH; Brown SJ; Butterworth S; Campbell A; Chorley C; Colclough N; Cross DAE; Currie GS; Grist M; Hassall L; Hill GB; James D; James M; Kemmitt P; Klinowska T; Lamont G; Lamont SG; Martin N; McFarland HL; Mellor MJ; Orme JP; Perkins D; Perkins P; Richmond G; Smith P; Ward RA; Waring MJ; Whittaker D; Wells S; Wrigley GL Discovery of a Potent and Selective EGFR Inhibitor (AZD9291) of Both Sensitizing and T790M Resistance Mutations That Spares the Wild Type Form of the Receptor. J Med Chem 2014, 57 (20), 8249–8267. 10.1021/jm500973a [DOI] [PubMed] [Google Scholar]
- 4.Jänne PA; Yang JC-H; Kim D-W; Planchard D; Ohe Y; Ramalingam SS; Ahn M-J; Kim S-W; Su W-C; Horn L; Haggstrom D; Felip E; Kim J-H; Frewer P; Cantarini M; Brown KH; Dickinson PA; Ghiorghiu S; Ranson M. AZD9291 in EGFR Inhibitor–Resistant Non–Small-Cell Lung Cancer. N Engl J Med 2015, 372 (18), 1689–1699. https://www.nejm.org/doi/full/10.1056/NEJMoa1411817 [DOI] [PubMed] [Google Scholar]
- 5.Lanman BA; Allen JR; Allen JG; Amegadzie AK; Ashton KS; Booker SK; Chen JJ; Chen N; Frohn MJ; Goodman G; Kopecky DJ; Liu L; Lopez P; Low JD; Ma V; Minatti AE; Nguyen TT; Nishimura N; Pickrell AJ; Reed AB; Shin Y; Siegmund AC; Tamayo NA; Tegley CM; Walton MC; Wang H-L; Wurz RP; Xue M; Yang KC; Achanta P; Bartberger MD; Canon J; Hollis LS; McCarter JD; Mohr C; Rex K; Saiki AY; San Miguel T; Volak LP; Wang KH; Whittington DA; Zech SG; Lipford JR; Cee VJ Discovery of a Covalent Inhibitor of KRASG12C (AMG 510) for the Treatment of Solid Tumors. J Med Chem 2020, 63 (1), 52–65. 10.1021/acs.jmedchem.9b01180 [DOI] [PubMed] [Google Scholar]
- 6.Hong DS; Fakih MG; Strickler JH; Desai J; Durm GA; Shapiro GI; Falchook GS; Price TJ; Sacher A; Denlinger CS; Bang Y-J; Dy GK; Krauss JC; Kuboki Y; Kuo JC; Coveler AL; Park K; Kim TW; Barlesi F; Munster PN; Ramalingam SS; Burns TF; Meric-Bernstam F; Henary H; Ngang J; Ngarmchamnanrith G; Kim J; Houk BE; Canon J; Lipford JR; Friberg G; Lito P; Govindan R; Li BT KRASG12C Inhibition with Sotorasib in Advanced Solid Tumors. N Engl J Med 2020, 383 (13), 1207–1217. https://www.nejm.org/doi/full/10.1056/NEJMoa1917239 [DOI] [PMC free article] [PubMed] [Google Scholar]
- 7.Singh J; Petter RC; Baillie TA; Whitty A. The resurgence of covalent drugs. Nat Rev Drug Discov 2011, 10 (4), 307–17. https://www.ncbi.nlm.nih.gov/pubmed/21455239 [DOI] [PubMed] [Google Scholar]
- 8.Liu Q; Sabnis Y; Zhao Z; Zhang T; Buhrlage, Sara J.; Jones, Lyn H.; Gray, Nathanael S. Developing Irreversible Inhibitors of the Protein Kinase Cysteinome. Chem Biol 2013, 20 (2), 146–159. 10.1016/j.chembiol.2012.12.006 [DOI] [PMC free article] [PubMed] [Google Scholar]
- 9.Chaikuad A; Koch P; Laufer SA; Knapp S. The Cysteinome of Protein Kinases as a Target in Drug Development. Angew Chem Int Ed 2018, 57 (16), 4372–4385. https://onlinelibrary.wiley.com/doi/abs/10.1002/anie.201707875 [DOI] [PubMed] [Google Scholar]
- 10.Cuesta A; Taunton J. Lysine-Targeted Inhibitors and Chemoproteomic Probes. Annu Rev Biochem 2019, 88, 365–381. https://www.annualreviews.org/doi/pdf/10.1146/annurev-biochem-061516-044805 [DOI] [PubMed] [Google Scholar]
- 11.Dalton SE; Dittus L; Thomas DA; Convery MA; Nunes J; Bush JT; Evans JP; Werner T; Bantscheff M; Murphy JA; Campos S. Selectively Targeting the Kinome-Conserved Lysine of PI3Kδ as a General Approach to Covalent Kinase Inhibition. J Am Chem Soc 2018, 140 (3), 932–939. https://pubs.acs.org/doi/10.1021/jacs.7b08979 [DOI] [PubMed] [Google Scholar]
- 12.Gambini L; Baggio C; Udompholkul P; Jossart J; Salem AF; Perry JJP; Pellecchia M. Covalent Inhibitors of Protein–Protein Interactions Targeting Lysine, Tyrosine, or Histidine Residues. J Med Chem 2019, 62 (11), 5616–5627. 10.1021/acs.jmedchem.9b00561 [DOI] [PMC free article] [PubMed] [Google Scholar]
- 13.Tamura T; Ueda T; Goto T; Tsukidate T; Shapira Y; Nishikawa Y; Fujisawa A; Hamachi I. Rapid labelling and covalent inhibition of intracellular native proteins using ligand-directed N-acyl-N-alkyl sulfonamide. Nat Commun 2018, 9 (1), 1870. 10.1038/s41467-018-04343-0 [DOI] [PMC free article] [PubMed] [Google Scholar]
- 14.Cuesta A; Wan X; Burlingame AL; Taunton J. Ligand Conformational Bias Drives Enantioselective Modification of a Surface-Exposed Lysine on Hsp90. J Am Chem Soc 2020. 10.1021/jacs.9b09684 [DOI] [PubMed] [Google Scholar]
- 15.Wan X; Yang T; Cuesta A; Pang X; Balius TE; Irwin JJ; Shoichet BK; Taunton J. Discovery of Lysine-Targeted eIF4E Inhibitors through Covalent Docking. J Am Chem Soc 2020, 142 (11), 4960–4964. 10.1021/jacs.9b10377 [DOI] [PMC free article] [PubMed] [Google Scholar]
- 16.Pettinger J; Jones K; Cheeseman MD Lysine-Targeting Covalent Inhibitors. Angew Chem Int Ed 2017, 56 (48), 15200–15209. 10.1002/anie.201707630 [DOI] [PubMed] [Google Scholar]
- 17.Hacker SM; Backus KM; Lazear MR; Forli S; Correia BE; Cravatt BF Global profiling of lysine reactivity and ligandability in the human proteome. Nat Chem 2017, 9 (12), 1181–1190. 10.1038/nchem.2826 [DOI] [PMC free article] [PubMed] [Google Scholar]
- 18.Copeland RA The drug–target residence time model: a 10-year retrospective. Nature Reviews Drug Discovery 2016, 15 (2), 87–95. 10.1038/nrd.2015.18 [DOI] [PubMed] [Google Scholar]
- 19.Bradshaw MJ; McFarland JM; Paavilainen VO; Bisconte A; Tam D; Phan VT; Romanov S; Finkle D; Shu J; Patel V; Ton T; Li X; Loughhead DG; Nunn PA; Karr DE; Gerritsen ME; Funk J; Owens TD; Verner E; Brameld KA; Hill RJ; Goldstein DM; Taunton J. Prolonged and tunable residence time using reversible covalent kinase inhibitors. Nat Chem Biol 2015, 11 (7), 525–531. 10.1038/nchembio.1817 [DOI] [PMC free article] [PubMed] [Google Scholar]
- 20.Eliot AC; Kirsch JF Pyridoxal Phosphate Enzymes: Mechanistic, Structural, and Evolutionary Considerations. Annu Rev Biochem 2004, 73 (1), 383–415. https://www.annualreviews.org/doi/abs/10.1146/annurev.biochem.73.011303.074021 [DOI] [PubMed] [Google Scholar]
- 21.Oksenberg D; Dufu K; Patel MP; Chuang C; Li Z; Xu Q; Silva-Garcia A; Zhou C; Hutchaleelaha A; Patskovska L; Patskovsky Y; Almo SC; Sinha U; Metcalf BW; Archer DR GBT440 increases haemoglobin oxygen affinity, reduces sickling and prolongs RBC half-life in a murine model of sickle cell disease. Br J Haematol 2016, 175 (1), 141–153. https://onlinelibrary.wiley.com/doi/abs/10.1111/bjh.14214 [DOI] [PubMed] [Google Scholar]
- 22.Gampe C; Verma VA Curse or Cure? A Perspective on the Developability of Aldehydes as Active Pharmaceutical Ingredients. J Med Chem 2020, 63 (23), 14357–14381. 10.1021/acs.jmedchem.0c01177 [DOI] [PubMed] [Google Scholar]
- 23.Gushwa NN; Kang S; Chen J; Taunton J. Selective Targeting of Distinct Active Site Nucleophiles by Irreversible Src-Family Kinase Inhibitors. J Am Chem Soc 2012, 134 (50), 20214–20217. 10.1021/ja310659j [DOI] [PMC free article] [PubMed] [Google Scholar]
- 24.Patricelli MP; Szardenings KA; Liyanage M; Nomanbhoy TK; Wu M; Weissig H; Aban A; Chun D; Tanner S; Kozarich JW Functional Interrogation of the Kinome Using Nucleotide Acyl Phosphates. Biochemistry 2007, 46 (2), 350–358. 10.1021/bi062142x [DOI] [PubMed] [Google Scholar]
- 25.Zhao Q; Ouyang X; Wan X; Gajiwala KS; Kath JC; Jones LH; Burlingame AL; Taunton J. Broad-Spectrum Kinase Profiling in Live Cells with Lysine-Targeted Sulfonyl Fluoride Probes. J Am Chem Soc 2017, 139 (2), 680–685. 10.1021/jacs.6b08536 [DOI] [PMC free article] [PubMed] [Google Scholar]
- 26.Bell IM; Stirdivant SM; Ahern J; Culberson JC; Darke PL; Dinsmore CJ; Drakas RA; Gallicchio SN; Graham SL; Heimbrook DC; Hall DL; Hua J; Kett NR; Kim AS; Kornienko M; Kuo LC; Munshi SK; Quigley AG; Reid JC; Trotter BW; Waxman LH; Williams TM; Zartman CB Biochemical and Structural Characterization of a Novel Class of Inhibitors of the Type 1 Insulin-like Growth Factor and Insulin Receptor Kinases. Biochemistry 2005, 44 (27), 9430–9440. 10.1021/bi0500628 [DOI] [PubMed] [Google Scholar]
- 27.Quach D; Tang G; Anantharajan J; Baburajendran N; Poulsen A; Wee J; Retna P; Li R; Liu B; Tee D; Kwek P; Joy J; Yang W-Q; Zhang C-J; Foo K; Keller T; Yao SQ Strategic Design of Catalytic Lysine-Targeting Reversible Covalent BCR-ABL Inhibitors. Angew Chem Int Ed 2021, 60 (31), 17131–17137. https://onlinelibrary.wiley.com/doi/abs/10.1002/anie.202105383 [DOI] [PubMed] [Google Scholar]
- 28.Freeman-Cook KD; Hoffman RL; Behenna DC; Boras B; Carelli J; Diehl W; Ferre RA; He Y-A; Hui A; Huang B; Huser N; Jones R; Kephart SE; Lapek J; McTigue M; Miller N; Murray BW; Nagata A; Nguyen L; Niessen S; Ninkovic S; O’Doherty I; Ornelas MA; Solowiej J; Sutton SC; Tran K; Tseng E; Visswanathan R; Xu M; Zehnder L; Zhang Q; Zhang C; Dann S. Discovery of PF-06873600, a CDK2/4/6 Inhibitor for the Treatment of Cancer. J Med Chem 2021, 64 (13), 9056–9077. 10.1021/acs.jmedchem.1c00159 [DOI] [PubMed] [Google Scholar]
- 29.Freeman-Cook K; Hoffman RL; Miller N; Almaden J; Chionis J; Zhang Q; Eisele K; Liu C; Zhang C; Huser N; Nguyen L; Costa-Jones C; Niessen S; Carelli J; Lapek J; Weinrich SL; Wei P; McMillan E; Wilson E; Wang TS; McTigue M; Ferre RA; He Y-A; Ninkovic S; Behenna D; Tran KT; Sutton S; Nagata A; Ornelas MA; Kephart SE; Zehnder LR; Murray B; Xu M; Solowiej JE; Visswanathan R; Boras B; Looper D; Lee N; Bienkowska JR; Zhu Z; Kan Z; Ding Y; Mu XJ; Oderup C; Salek-Ardakani S; White MA; VanArsdale T; Dann SG Expanding control of the tumor cell cycle with a CDK2/4/6 inhibitor. Cancer Cell 2021, 39 (10), 1404–1421.e11. 10.1016/j.ccell.2021.08.009 [DOI] [PubMed] [Google Scholar]
- 30.Bruyneel W; Charette JJ; De Hoffmann E. Kinetics of Hydrolysis of Hydroxy and Methoxy Derivatives of N-Benzylidene-2-aminopropane. J Am Chem Soc 1966, 88 (16), 3808–3813. 10.1021/ja00968a024 [DOI] [Google Scholar]
- 31.Herscovitch R; Charette JJ; De Hoffmann E. Physicochemical properties of Schiff bases. III. Substituent effects on the kinetics of hydrolysis of N-salicylidene-2-aminopropane derivatives. J Am Chem Soc 1974, 96 (15), 4954–4958. 10.1021/ja00822a037 [DOI] [Google Scholar]
- 32.Schweppe DK; Eng JK; Yu Q; Bailey D; Rad R; Navarrete-Perea J; Huttlin EL; Erickson BK; Paulo JA; Gygi SP Full-Featured, Real-Time Database Searching Platform Enables Fast and Accurate Multiplexed Quantitative Proteomics. J Proteome Res 2020, 19 (5), 2026–2034. 10.1021/acs.jproteome.9b00860 [DOI] [PMC free article] [PubMed] [Google Scholar]
- 33.Willems E; Dedobbeleer M; Digregorio M; Lombard A; Lumapat PN; Rogister B. The functional diversity of Aurora kinases: a comprehensive review. Cell Div 2018, 13 (1), 7. 10.1186/s13008-018-0040-6 [DOI] [PMC free article] [PubMed] [Google Scholar]
- 34.Otto T; Horn S; Brockmann M; Eilers U; Schuttrumpf L; Popov N; Kenney AM; Schulte JH; Beijersbergen R; Christiansen H; Berwanger B; Eilers M. Stabilization of N-Myc is a critical function of Aurora A in human neuroblastoma. Cancer Cell 2009, 15 (1), 67–78. 10.1016/j.ccr.2008.12.005 [DOI] [PubMed] [Google Scholar]
- 35.Gustafson W; Meyerowitz J; Nekritz EA; Chen J; Benes C; Charron E; Simonds EF; Seeger R; Matthay KK; Hertz NT; Eilers M; Shokat KM; Weiss WA Drugging MYCN through an allosteric transition in Aurora kinase A. Cancer Cell 2014, 26 (3), 414–427. 10.1016/j.ccr.2014.07.015 [DOI] [PMC free article] [PubMed] [Google Scholar]
- 36.Richards MW; Burgess SG; Poon E; Carstensen A; Eilers M; Chesler L; Bayliss R. Structural basis of N-Myc binding by Aurora-A and its destabilization by kinase inhibitors. Proc Natl Acad Sci U S A 2016, 113 (48), 13726–13731. 10.1073/pnas.1610626113 [DOI] [PMC free article] [PubMed] [Google Scholar]
- 37.Donnella HJ; Webber JT; Levin RS; Camarda R; Momcilovic O; Bayani N; Shah KN; Korkola JE; Shokat KM; Goga A; Gordan JD; Bandyopadhyay S. Kinome rewiring reveals AURKA limits PI3K-pathway inhibitor efficacy in breast cancer. Nat Chem Biol 2018, 14 (8), 768–777. 10.1038/s41589-018-0081-9 [DOI] [PMC free article] [PubMed] [Google Scholar]
- 38.Musante V; Li L; Kanyo J; Lam TT; Colangelo CM; Cheng SK; Brody AH; Greengard P; Le Novère N; Nairn AC Reciprocal regulation of ARPP-16 by PKA and MAST3 kinases provides a cAMP-regulated switch in protein phosphatase 2A inhibition. eLife 2017, 6, e24998. 10.7554/eLife.24998 [DOI] [PMC free article] [PubMed] [Google Scholar]
- 39.Spinelli E; Christensen KR; Bryant E; Schneider A; GenCouns M; Rakotomamonjy J; Muir AM; Giannelli J; Littlejohn RO; Roeder ER; Schmidt B; Wilson WG; Marco EJ; Iwama K; Kumada S; Pisano T; Barba C; Vetro A; Brilstra EH; van Jaarsveld RH; Matsumoto N; Goldberg-Stern H; Carney P; Andrews PI; El Achkar CM; Berkovic S; Rodan LH; Network UD; McWalter K; Guerrini R; Scheffer IE; Mefford HC; Mandelstam S; Laux L; Millichap JJ; Guemez-Gamboa A; Nairn AC; Carvill GL Pathogenic MAST3 variants in the STK domain are associated with epilepsy. Ann Neurol 2021, 90 (2), 274–284. https://onlinelibrary.wiley.com/doi/abs/10.1002/ana.26147 [DOI] [PMC free article] [PubMed] [Google Scholar]
- 40.Gasser, Jessica A; Inuzuka H; Lau, Alan W; Wei W; Beroukhim R; Toker A. SGK3 Mediates INPP4B-Dependent PI3K Signaling in Breast Cancer. Mol Cell 2014, 56 (4), 595–607. https://www.sciencedirect.com/science/article/pii/S1097276514007801 [DOI] [PMC free article] [PubMed] [Google Scholar]
- 41.Bago R; Sommer E; Castel P; Crafter C; Bailey FP; Shpiro N; Baselga J; Cross D; Eyers PA; Alessi DR The hVps34-SGK3 pathway alleviates sustained PI3K/Akt inhibition by stimulating mTORC1 and tumour growth. The EMBO Journal 2016, 35 (17), 1902–1922. https://www.embopress.org/doi/abs/10.15252/embj.201693929 [DOI] [PMC free article] [PubMed] [Google Scholar]
- 42.Vasudevan KM; Barbie DA; Davies MA; Rabinovsky R; McNear CJ; Kim JJ; Hennessy BT; Tseng H; Pochanard P; Kim SY; Dunn IF; Schinzel AC; Sandy P; Hoersch S; Sheng Q; Gupta PB; Boehm JS; Reiling JH; Silver S; Lu Y; Stemke-Hale K; Dutta B; Joy C; Sahin AA; Gonzalez-Angulo AM; Lluch A; Rameh LE; Jacks T; Root DE; Lander ES; Mills GB; Hahn WC; Sellers WR; Garraway LA AKT-Independent Signaling Downstream of Oncogenic PIK3CA Mutations in Human Cancer. Cancer Cell 2009, 16 (1), 21–32. https://www.sciencedirect.com/science/article/pii/S1535610809001779 [DOI] [PMC free article] [PubMed] [Google Scholar]
- 43.Burgess SG; Bayliss R. The structure of C290A:C393A Aurora A provides structural insights into kinase regulation.Acta Crystallographica Section F 2015, 71 (3), 315–319. 10.1107/S2053230X15002290 [DOI] [PMC free article] [PubMed] [Google Scholar]
- 44.Kabsch W. Automatic processing of rotation diffraction data from crystals of initially unknown symmetry and cell constants. J. Appl. Cryst 1993, 26 (6), 795–800. 10.1107/S0021889893005588 [DOI] [Google Scholar]
- 45.McCoy AJ; Grosse-Kunstleve RW; Adams PD; Winn MD; Storoni LC; Read RJ Phaser crystallographic software. J. Appl. Cryst 2007, 40 (4), 658–674. 10.1107/S0021889807021206 [DOI] [PMC free article] [PubMed] [Google Scholar]
- 46.Afonine PV; Grosse-Kunstleve RW; Echols N; Headd JJ; Moriarty NW; Mustyakimov M; Terwilliger TC; Urzhumtsev A; Zwart PH; Adams PD Towards automated crystallographic structure refinement with phenix.refine.Acta Cryst. 2012, 68 (4), 352–367. 10.1107/S0907444912001308 [DOI] [PMC free article] [PubMed] [Google Scholar]
- 47.Emsley P; Lohkamp B; Scott WG; Cowtan K. Features and development of Coot.Acta Cryst. 2010, 66 (4), 486–501. 10.1107/S0907444910007493 [DOI] [PMC free article] [PubMed] [Google Scholar]
- 48.Lebedev AA; Young P; Isupov MN; Moroz OV; Vagin AA; Murshudov GN JLigand: a graphical tool for the CCP4 template-restraint library.Acta crystallographica. Section D, Biological crystallography 2012, 68 (4), 431–440. 10.1107/S090744491200251X [DOI] [PMC free article] [PubMed] [Google Scholar]
- 49.Murshudov GN; Vagin AA; Dodson EJ Refinement of Macromolecular Structures by the Maximum-Likelihood Method.Acta Cryst. 1997, 53 (3), 240–255. 10.1107/S0907444996012255 [DOI] [PubMed] [Google Scholar]
Associated Data
This section collects any data citations, data availability statements, or supplementary materials included in this article.
Supplementary Materials
Data Availability Statement
All mass spectrometry raw files have been deposited into the MassIVE database (http://massive.ucsd.edu/) and can be downloaded by the identifier MSV000088924 as well as in ProteomeXchange (http://www.proteomexchange.org/) with accession number PXD031899.Source data are provided in a Source Data File or in the Supplementary Datasets. Coordinates and structure factors have been deposited in the PDB under accession code 7FIC.


