

Abstract
Although the protective role of neutralizing antibodies against COVID-19 is well established, questions remain about the relative importance of cellular immunity. Using 6 pMHC multimers in a cohort with early and frequent sampling, we define the phenotype and kinetics of recalled and primary T cell responses following Delta or Omicron breakthrough infection in previously vaccinated individuals. Recall of spike-specific CD4+ T cells was rapid, with cellular proliferation and extensive activation evident as early as 1 day post symptom onset. Similarly, spike-specific CD8+ T cells were rapidly activated but showed variable degrees of expansion. The frequency of activated SARS-CoV-2-specific CD8+ T cells at baseline and peak inversely correlated with peak SARS-CoV-2 RNA levels in nasal swabs and accelerated viral clearance. Our study demonstrates that a rapid and extensive recall of memory T cell populations occurs early after breakthrough infection and suggests that CD8+ T cells contribute to the control of viral replication in breakthrough SARS-CoV-2 infections.
Keywords: SARS-CoV-2, T cell, multimer, CD4 T cell immunity, CD8 T cell immunity, COVID-19 vaccines, Delta, Omicron, breakthrough infection, vaccination
Graphical abstract
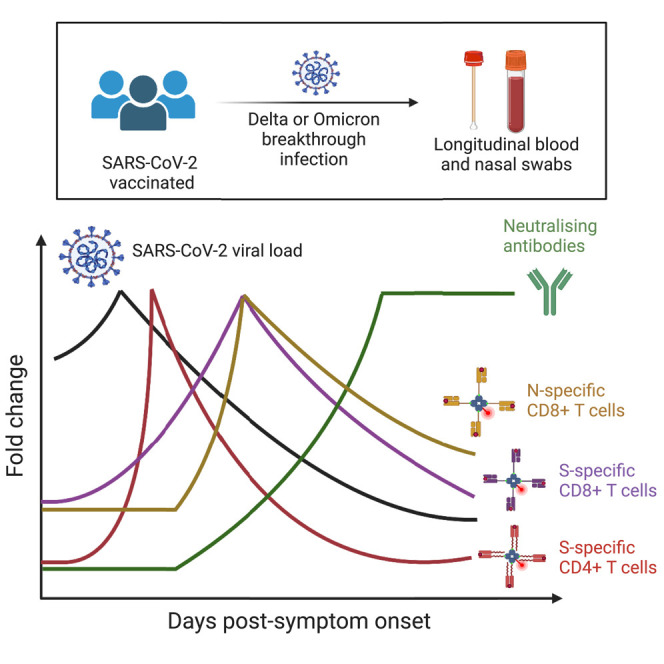
Our understanding of T cell responses to SARS-CoV-2 vaccination and breakthrough infection has lagged behind B cells and antibodies. Here, Koutsakos et al. utilize longitudinal sampling to demonstrate a rapid activation of SARS-CoV-2-specific CD4+ and CD8+ T cells during breakthrough infection. Furthermore, spike-specific CD8+ T cell activation correlates with viral clearance.
Introduction
Although antibody-evasive SARS-CoV-2 variants, such as BA.1 and BA.2,1 , 2 may reduce the effectiveness of COVID-19 vaccines against acquisition of infection, these vaccines robustly protect against severe disease in the event of vaccine breakthrough infection (BTI).3 Neutralizing antibody titers in blood are a correlate of protection from both SARS-CoV-2 infection and severe COVID-19 disease,4 , 5 with evidence for a mechanistic protective role supported by the clinical utility of monoclonal antibody treatments.6 Nonetheless, studies in humans and animal models suggest that multiple immunological effectors likely contribute to viral control and clearance.7 , 8 In particular, CD4+ and CD8+ T cell memory are likely important mediators of vaccine-associated protection from severe outcomes.9 , 10 , 11 Although unvaccinated and vaccinated cohorts show similar peak viral load after infection, vaccinated individuals exhibit accelerated viral clearance in the upper respiratory tract (URT) beginning 4 to 6 days after symptom onset.12 , 13 , 14 , 15 Although the mechanisms of vaccine-associated viral decline are yet to be defined, a role is plausible for both CD8+ T cells, which may induce cytolysis or produce antiviral cytokines,16 , 17 and CD4+ T cells, which may support the recall of humoral immunity or potentially exert cytotoxic activity.18 , 19 There is, however, a paucity of data directly linking CD8+ and/or CD4+ T cell recall to viral clearance in human SARS-CoV-2 infections.
Previous studies of BTI demonstrate the recall of spike (S)-specific memory T cells established by previous immunization, as well as the induction of primary T cell responses against non-vaccine encoded viral antigens such as nucleocapsid (N).20 , 21 , 22 , 23 To have a meaningful impact on either the rate of viral clearance or the likelihood of progressing to severe disease, memory T cell responses must be efficiently activated, likely within the first few days, following BTI.24 Although cross-sectional studies of BTI cohorts have provided evidence for the variable activation or expansion of S-specific T cells,20 , 21 early longitudinal sampling in cohorts with a well-defined exposure history is rare.25 , 26 , 27 Additional work is therefore required to understand how quickly T cell activation, proliferation, and effector function can occur relative to viral clearance.
In addition to the paucity of immunological studies that are temporally aligned with viral kinetics, the determination of T cell activation and ex vivo phenotype requires direct detection of antigen-specific T cells without in vitro restimulation. The use of fluorescently conjugated peptide-MHC (pMHC) multimers can allow for the sensitive detection of antigen-specific T cells and their ex vivo phenotypic characterization in cohorts with known HLA alleles.28 Indeed, the analyses of antigen-specific CD4+ and CD8+ T cells using pMHC multimers have provided novel insights into the biogenesis and maintenance of T cell responses following SARS-CoV-2 vaccination and primary infection.29 , 30 , 31 , 32 Here, we use 6 pMHC-I and pMHC-II multimers presenting known immunodominant SARS-COV-2 viral epitopes22 , 29 , 30 , 33 , 34 , 35 , 36 to precisely define the frequency and phenotypes of SARS-CoV-2-specific CD8+ and CD4+ T cells during both the earliest events post-BTI and over extended timelines of periodic antigen re-exposure. Furthermore, we compare the kinetics of CD8+ T cell recall with the induction of a primary CD8+ T cell response to the SARS-CoV-2 N, a non-vaccine encoded viral antigen. These data define the relationship between viral replication in the URT and T cell activation, proliferation, and initiation of effector programs, shedding light on the dynamics of human adaptive immunity to respiratory virus infection in a highly vaccinated population.
Results
Kinetics of viral clearance and antibody recall following SARS-CoV-2 BTIs
To understand the kinetics of T cell recall in relation to viral clearance and humoral immunity, we recruited a cohort of 23 individuals with PCR-confirmed SARS-CoV-2 BTI with Delta (n = 6), Omicron BA.1 (n = 7) or Omicron BA.2 (n = 10) strains (Figure 1 A; Table S1). Frequent longitudinal nasal swabs and peripheral blood samples were obtained 0–14 days post-symptom onset (PSO) with an additional follow-up of blood samples obtained up to day 44 PSO. Each individual provided on average 9 (range 4–13) samples, with a total of 150 nasal swabs and 138 blood samples analyzed. All BTIs were mild in severity and occurred on average 100 days from the last vaccination (for 21/23 participants with the exact date of vaccination available).
Figure 1.

Fine longitudinal sampling of SARS-CoV-2 breakthrough infection and study design
(A) Schematic of longitudinal sample collection following breakthrough infection with Delta, Omicron BA.1, or Omicron BA.2. Each line represents a single donor, and each point represents a sample collection (blue, nasal swab; red, blood; and purple, both swab and blood).
(B) Kinetics of the viral load measured by Ct values for SARS-CoV-2 N gene in serial nasal swabs. Green, Delta breakthrough infection; gray, BA.1; pink, BA.2.
(C) Kinetics of neutralizing antibodies measured by a live virus microneutralization assay using an antigenically similar virus to the infecting VOC. For (B) and (C), n = 6 participants for Delta, n = 7 for Omicron BA.1, and n = 10 for Omicron BA.2. For (C), the bold black line represents the mean estimate from the piecewise linear regression model using the estimated parameters.
(D) Representative flow cytometry plots for each pMHC multimer used for the detection of antigen-specific CD8+ and CD4+ T cells. Data were collected from cryopreserved PBMC following SARS-CoV-2 infection.
(E) Sequence alignment of peptides with HLA restriction used for the detection of antigen-specific CD8+ and CD4+ T cells across selected SARS-CoV-2 VOCs.
Viral load was determined in nasal swabs by qPCR of the N gene (Figure 1B). Viral load peaked early after symptom onset (median day 3 PSO but often at the earliest sample collected), with no significant difference in the peak viral load across the three variants of concern (VOCs). Analysis of the rate of viral clearance determined by linear regression showed significantly faster viral decay among Delta breakthroughs compared with Omicron (Table S2).
The recall of neutralizing antibodies was analyzed using a live virus neutralization assay (Figure 1C). The kinetics of immune recall following BTI were estimated using piecewise linear regression to estimate: (1) the duration of time between symptom onset and earliest change in the neutralizing antibody titer, (2) the time of peak response relative to the symptom onset, and (3) rates of growth and decay. Antibody titers against the infecting VOC (or an antigenically similar strain) increased from day 4.3 PSO (95% CI = 2.2–8.4) (Table S2) and peaked around day 14.6 (95% CI = 12.2–17.4) (similar to previous reports27). There were no significant differences in neutralizing antibody kinetics between subjects infected with the Delta, BA.1, or BA.2 VOCs when assessed by piecewise linear regression modeling (Table S2).
Characterization of antigen-specific T cell responses using pMHC multimers
To conduct a detailed characterization of the CD4+ and CD8+ T cell recall, we selected four CD8+ and two CD4+ T cell epitopes from SARS-CoV-2 that are restricted by HLA alleles found at high frequency in our cohort. Three immunoprominent MHC class I restricted S-derived epitopes (HLA-A∗02:01-S269–277, HLA-A∗03:01-S378–386, and HLA-A∗24:02-S1,208–1,216) and one N-derived epitope (HLA-B∗07:02-N105–113) were assessed for CD8+ T cells, whereas two MHC class II-restricted S-derived epitopes (HLA-DRB1∗15:01-S751–767 and HLA-DPB1∗04:01-S167–180) were assessed for CD4+ T cells. All multimers have been previously verified for specificity,29 , 30 , 31 , 34 , 35 with epitope-specific cells readily detected ex vivo in samples from infected individuals (Figure 1D; gating in Figure S1). All peptides are well conserved across the relevant infecting VOCs in this study, with only one mutation (N764K) found for the DR15-restricted S751 peptide in BA.1 and BA.2 sequences (Figure 1E), which is not predicted to alter MHC binding (predicted affinity 97.06 vs. 80.03 nM, NetMHCIIPan-3.237).
Robust expansion and activation of S-specific CD4+ T cells after BTI
S-specific memory CD4+ T cells were detected using the DR15-S751- and DP04-S167-pMHC multimers in all participants carrying the relevant HLA alleles (Figure 2 A). Longitudinal tracking showed a clear expansion of the number of S-specific CD4+ T cells following BTI. The analysis of T cell kinetics with a piecewise linear model estimated that frequencies of S-specific CD4+ T cells increase at 2.5 days PSO (95% CI = 1.9–3.4), peaking on day 5.4 (95% CI = 4.8–6.1) and slowly contracting thereafter (measured data in Figure 2B; piecewise regression lines in Figure 2C; Table S3). The appearance of activated (CD38+ICOS+) Tet+ cells in the circulation occurred in a synchronized manner across the cohort (Figures 2A–2C) with evidence of activation estimated to be initiated around 1.1 days PSO (95% CI = 0.7–1.8) and peaking by day 3.6 (95% CI = 3.2–4.01). Over this period, the proportion of activated pMHC-II+ CD4+ T cells increased from 2.44% (95% CI = 1.1–5.4) at the initial sampling to a peak of 74.5% (95% CI = 68%–81%) (Table S3). Other markers of activation, including CD71 and PD-1, were similarly induced following BTI (Figure 2D), with maximal expressions between 1.6 and 4.0 days PSO (Table S3). The kinetics of expansion and activation were broadly comparable between the two MHC-II epitopes, with only minor differences in the decay kinetics of some markers (Table S3).
Figure 2.

Robust expansion and activation of spike-specific CD4+ T cells after breakthrough infection
(A) Representative flow cytometry plots and kinetics of HLA-DR∗15-S751 and HLA-DP∗04-S167-specific CD4+ T cells from a single participant and co-expression of ICOS and CD38.
(B) Representative flow cytometry plots of HLA-DR∗15-S751-specific CD4+ T cells and kinetics of phenotypic markers for both pMHC-II populations, n = 19 for DP∗04-S167 and n = 9 for DR∗15-S751.
(C) Estimated kinetics of pMHC-II+ CD4+ T cell frequency and activated (CD38+ICOS+) phenotype. The lines indicate the mean estimate for measurement from the piecewise linear regression model, using pooled data from both pMHC-II populations (as no significant differences were found between the two).
(D) Representative flow cytometry plots of phenotypic markers for DR∗15-S751 (left) and kinetics marker expression for both pMHC-II populations (right). Throughout the figure, colored lines represent individual donors for each pMHC-II-specific population, n = 19 for DP∗04-S167 and n = 9 for DR∗15-S751.
Previous studies of DR15-S751 and DP04-S167 responses demonstrate recruitment into both conventional CD4+ memory T cell pools and circulating T follicular helper (cTFH) cell pools following primary vaccination or infection.29 , 30 We found minimal evidence of recalled T cells exhibiting a cTFH phenotype during BTI (Figures S2A and S2B), even among individuals where CXCR5+ S-specific cells were clearly detected after primary vaccination. Accordingly, we found no correlation between the peak or growth rate of neutralizing antibody titers and the kinetics of S-specific CD4+ T cell recall/memory across the cohort (Figure S2C).
Phenotypically, both DR15-S751- and DP04-S167-specific cells exhibited a mixture of TCM-like (CD45RA−CCR7+) and TEM-like (CD45RA−CCR7−) profiles, with a transient increase in the relative proportion of CCR7+ cells occurring around the peak of T cell proliferation (Figure S3A). Multiple inflammatory mediators, including the CXCR3 ligand CXCL10, are elevated in nasopharyngeal swabs from mild/moderate COVID-19 cases,38 which may facilitate the trafficking of activated T cells to the lung or nasal mucosa. S-specific CD4+ T cells showed increased expressions of both CXCR3 and CCR5 during BTI, suggesting the potential for these cells to migrate to inflamed tissues (Figure 2D; Figures S3B and S3C). We further observed a modest increase in granzyme B (GzmB) expression among S-specific CD4+ T cells by day 2 PSO (Figure S3D), in line with previous reports of elevated GZMB expression following in vitro culture of S-specific CD4+ T cells.39 Overall, we find rapid activation and expansion of S-specific CD4+ T cells following BTI, characterized by transient induction of tissue/lymphatic-homing markers.
Variable expansion but universal activation of S-specific CD8+ T cells after BTI
S-specific CD8+ T cells, regardless of epitope specificity, expanded during BTI from day 4.4 PSO (95% CI = 3.4–5.7), peaked on day 5.8 (95% CI = 4.9–6.9) and maintained relatively stable frequencies thereafter (Figure 3 A; Figure S4A; Table S4). We note, however, the variability in recall between individuals, with a subset of participants (12/18) showing considerable expansion in the number of S-specific CD8+ T cells (median 3.6-fold peak expansion relative to earliest time point available). The remaining six participants had comparatively stable frequencies of S-specific cells over the course of follow-up (median 1.1-fold peak expansion relative to earliest time point available; Figure S4B). Participants with limited CD8+ T cell expansion were more likely to have received 3 vaccine doses compared with the rest of the cohort (p = 0.038, Figure S4C) and exhibited higher frequencies of S-specific CD8+ T cells at the earliest time point available (p = 0.017, Figure S4D). There was not, however, any difference in the time interval from the last vaccination to BTI between the two groups (median 74 vs. 84 days, p > 0.05, Figure S4E).
Figure 3.

Early but variable recall of spike-specific CD8+ T cells after breakthrough infection
(A) Representative flow cytometry plots for HLA-A∗3-S378 and kinetics of HLA-A∗02-S269, HLA-A∗03-S378, and HLA-A∗24-S1208-specific CD8+ T cells.
(B) Representative flow cytometry plots for HLA-A∗3-S378 and kinetics of activated (CD38+) cells for HLA-A∗02-S269, HLA-A∗03-S378, and HLA-A∗24-S1208-specific CD8+ T cells.
(C) Estimated kinetics of pMHC-I+ CD8+ T cell frequency and activated (CD38+) phenotype. The lines indicate the mean estimate for measurement from the piecewise linear regression model, using pooled data from all 3 pMHC populations.
(D) Representative flow cytometry plots of phenotypic markers for HLA-A∗3-S378 and kinetics marker expression for all 3 pMHC-I populations. Throughout the figure, colored lines represent individual donors for each pMHC-I-specific population, n = 11 for A∗02-S269, n = 4 A∗03-S378, and n = 4 for A∗24-S1208.
Despite the variable changes in T cell frequency among individuals, we observed a universal induction of CD38 on S-specific CD8+ T cells, estimated to occur soon after the onset of symptoms (0.24 days PSO) and peaking at 7.1 days (Figures 3B and 3C). All six individuals with limited T cell expansion exhibited the activation of S-specific cells, with 3 of those participants showing relatively high frequencies of CD38+ cells at their initial sample that declined during follow-up (Figure S4F). It is therefore possible that the onset of CD8+ T cell activation and proliferation occurred before the first available sample in these individuals (i.e., before day 2 PSO), either due to a lag between infection and symptom onset or a rapid T cell recall.
In addition to CD38, we observed a similar increase in the expressions of the activation marker PD-1 and proliferation marker CD71, which peaked on day 3.3 (95% CI = 2.1–5.1) and day 5.4 (95% CI = 4.3–6.8) PSO, respectively (Figure 3D; Table S4). Consistent with our observations of S-specific CD4+ T cells, BTI drove increased expressions of CCR5 and CXCR3 on CD8+ T cells (Figure 3D; Figures S5A–S5C). During the course of infection, S-specific CD8+ T cells transiently changed from a CCR7−CD45RA+ to a CCR7−/+CD45RA− phenotype (Figure S5D). The expression of GzmB was dynamic, with clearly detectible GzmB+ populations at the earliest time points post-BTI and considerable induction observed in some donors (Figure 3D; Figure S5A). We did not observe any major differences in relative immunodominance, recall kinetics, or phenotype between the three S-derived pMHC-I epitopes, although the current study is not powered for a formal comparative analysis. Overall, despite the variability between donors in the expansion in the number of S-specific CD8+ T cells, these cells consistently show high levels of activation at early time points after BTI.
Concomitant expansion of primary N-specific CD8+ T cells and recall of S-specific CD8+ T cells after BTI
All individuals in the BTI cohort were previously immunized with SARS-CoV-2 vaccines encoding only the S antigen (BNT162b2, ChAdOx-nCoV19, or mRNA-1273). Consequently, recall of vaccine-induced immunological memory targeting S could be compared with the primary immune response generated against other viral antigens. Among the 23 individuals in the BTI cohort, 9 carried both an S peptide- (A2-S269–277, A3-S378, or A24-S1208) and N peptide- (B7-N105) restricting HLA allele. Furthermore, longitudinal peripheral blood mononuclear cell (PBMC) samples were available from four of these individuals over the course of primary vaccination, allowing us to characterize the nature of S- and N-specific CD8+ T cell populations before their BTI.
The analysis of pre-BTI samples validated previous observations of low baseline frequencies of naive (CD45RA+CCR7+CD95−) S-specific CD8+ T cells, which increase in frequency and acquire a CD45RA−CCR7+/−CD95+ phenotype following vaccination (Figure 4 A). At baseline, B7-N105-specific CD8+ T cells similarly presented with a naive-like phenotype (CD45RA+CCR7+) that lacked the expression of the stem cell memory marker CD95. The frequency and naive phenotype of these cells were stable throughout vaccination (Figure 4A), consistent with the lack of N antigen in the vaccine formulations received by these individuals. These data align with previous observations that in SARS-CoV-2 naive donors, most B7-N105-specific CD8+ T cells detected ex vivo are antigen-inexperienced, with no evidence of priming by cross-reactive human coronavirus epitopes.35 , 40
Figure 4.

Early expansion of primary N-specific CD8+ T cells and recall of spike-specific CD8+ T cells after breakthrough infection
(A) Representative flow cytometry plots of HLA-A∗02-S269 and HLA-B∗07-N105-specific CD8+ T cells and their phenotypic analysis based on CCR7, CD45RA, and CD95 from baseline throughout vaccination and subsequent SARS-CoV-2 breakthrough infection. Kinetics are shown for n = 9 donors with paired analysis spike-specific CD8+ T cells (either A∗02, A∗03, and A∗24) and B∗07-N105, for 4 of which pre-breakthrough samples were available.
(B) Representative flow cytometry plots for HLA-A∗3-S378 and HLA-B∗07-N105-specific CD8+ T cells. Frequencies of single marker+ cells are shown in red for B7-N105 only. Kinetics of phenotypic markers for S- or N-specific CD8+ T cells following SARS-CoV-2 breakthrough infection, n = 9 donors with paired spike-specific CD8+ T cells (either A∗02, A∗03, and A∗24) and B∗07-N105. Throughout the figure, colored lines represent individual donors for each pMHC-specific population.
N-specific cells were also found at a low frequency and with a naive phenotype at early time points post-BTI among the wider cohort. Memory S-specific CD8+ T cells were ∼8 times greater in frequency than naive N-specific CD8+ T cells at the first available time point, despite the high precursor frequency of naive B7-N105 T cells observed in this and other studies35 , 40 (Figure 4A). Over the course of BTI, we observed the progressive differentiation of B7-N105-specific T cells as they proliferated, with diminished CD45RA and acquired expression of CD95 (Figure 4A). The initiation of an effector program among N-specific CD8+ T cells was characterized by the concurrent induction of CD38, CCR5, CXCR3, GzmB, and CD71 (Figure 4B). However, despite the previous exposure to S-antigen and the difference in the overall frequency of S- and N-specific cells, the activation kinetics of S- and N-specific CD8+ T cells were largely similar, with both populations exhibiting similar delay, growth rate, and peak times of CD38, CD71, CXCR3, CCR5, and GzmB expressions (Tables S5 and S6). Nonetheless, at early time points, S-specific cells expressed higher levels of GzmB and CCR5 than naive N-specific cells (Table S6), providing them with the immediate effector and trafficking potential classically ascribed to memory T cells. Despite the similar kinetics, vaccine-primed S-specific CD8+ T cells were present at a higher frequency than N-specific CD8+ T cells throughout BTI. This was in contrast to a primary SARS-CoV-2 infection, where B7-N105-specific CD8+ T cells were a numerically dominant population over the S-specific populations included in our analysis (Figure S5E). Overall, we find that both recall and primary CD8+ T cell responses occur at early time points after symptom onset, confirming that de novo T cell responses to infection are not impaired in vaccinated individuals.22
S-specific CD8+ T cell activation correlates with viral clearance
Studies of the SARS-CoV-2 dynamics in the URT suggest that although the peak viral load is similar between vaccinated and unvaccinated individuals, previous vaccination is associated with accelerated viral clearance starting between days 4 and 6 PSO.12 , 13 , 14 , 15 To understand the relationship between viral decline and the onset of humoral and cellular recall, we compared the kinetics of nasal viral load, CD4+ and CD8+ T cell activation, and neutralizing antibody titers. Our kinetic analysis indicated that the activation of SARS-CoV-2-specific T cells occurs concurrently with viral clearance and considerably earlier than the recall of neutralizing antibodies (Figure 5 A). To further assess the potential role of T cell recall in viral clearance, we performed an exploratory analysis to understand whether T cell recall kinetics correlate with the levels and rate of viral clearance in the URT.
Figure 5.

S-specific CD8+ T cell activation correlates with viral clearance
(A) Summary of estimated kinetics viral clearance and of relevant immunological parameters determined in this study. Corresponding 95% confidence limits for all parameters are reported in Tables S2–S6.
(B) Correlations between the initial or peak frequency of CD38+ S-pMHC-I+ CD8+ T cells and viral clearance rate or peak Ct value (among the available time points). Spearman correlation coefficient and p values along with a linear regression line and 95% CI shown for statistically significant comparisons (p < 0.05), n = 19.
We investigated the relationship between viral dynamics (peak viral load and rate of viral clearance) with either the total frequency of antigen-specific CD4+ and CD8+ T cells or the activation of antigen-specific populations. The frequency of S-specific CD8+ T cells did not correlate with viral load or viral clearance rate (Figure S6A). However, we identified a relationship between S-specific CD8+ T cell activation and viral clearance. Specifically, the frequency of CD38+ S-specific cells at the time of symptom onset and peak response both positively correlated with the rate of viral clearance (p = 0.019 and 0.009, respectively, Figure 5B). Conversely, both measures of S-specific T cell activation were inversely associated with peak viral load (p = 0.001 and 0.002 for initial and peak CD8+ T cell activation, respectively; Figure 5B). Neither the frequency nor activation of the primary N-specific CD8+ T cell response was significantly associated with viral peak or clearance (Figures S6B and S6C), although this analysis is limited due to a small sample size. Additionally, we did not observe a correlation between the frequency or activation of S-specific CD4+ T cells and viral peak or clearance (Figures S6D and S6E).
The association between S-specific CD8+ T cell activation and viral kinetics is intriguing, suggesting that a greater magnitude of S-specific T cell recall may be associated with a more rapid clearance of the virus in the URT. However, studies of monoclonal antibody administration indicate that antibody titers may also accelerate viral clearance.41 Therefore, we explored whether neutralizing antibody levels (to the infecting or antigenically similar strain) were also associated with viral kinetics in this cohort. We found no significant association between initial or peak neutralizing antibody levels and viral peak or clearance rate in this cohort (Figure S6F). Overall, the association between activation of recalled S-specific CD8+ T cells in the blood and viral kinetics suggest that T cell activation may be an informative correlate of viral clearance following BTI.
Long-term stability of T cell responses following multiple antigen exposures
As the SARS-CoV-2 pandemic progresses, the lived experience of many individuals will include recurrent exposure to the viral S protein through a combination of vaccination and infection. Seven individuals in our BTI cohort were longitudinally sampled for up to 875 days over the course of the pandemic, providing a novel insight into the long-term maintenance and recall of S-specific T cell immunity (Figure 6 ). This included two individuals infected with the ancestral (Hu-1) virus, subsequently immunized twice with S-encoding vaccines and then acquiring an Omicron BTI (Figure 6A), and five individuals who received three doses of S-encoding vaccines and subsequently infected with Omicron (Figure 6B). Although each exposure had a variable impact on the frequency of S-specific T cells, the cumulative impact of multiple vaccinations/infections was the durable maintenance of memory T cell populations substantially above the pre-vaccination levels (Figure 6B). At the end of the follow-up, S-specific CD8+ T cell frequencies were 3- to 240-fold higher compared with pre-vaccination baseline samples, with S-specific CD4+ T cells 22- to 83-fold higher. Two participants with high S-specific T cell frequencies and limited CD8+ T cell expansion following BTI (COR039 and COR281) exhibited particularly high frequencies of S-specific CD8+ T cell following the 3rd vaccine dose, comprising 0.6%–1.3% of the CD8+ T cell compartment at the peak (Figure 6B). Across the cohort, each exposure to S also resulted in considerable but transient activation of both CD4+ (ICOS+CD38+) and CD8+ (CD38+) S-specific T cells. Although the sample size limits formal comparisons, BTI with BA.1 or BA.2 virus did not appear to boost circulating S-specific T cell frequencies or their activation phenotype to as great an extent as observed after the 3rd vaccine dose (Figures 6A and 6B). Taken together, our longitudinal follow-up over an extended period of time demonstrates the durability and long-term maintenance of circulating vaccine-induced S-specific CD4+ and CD8+ T memory cells.
Figure 6.

Long-term stability of T cell responses following multiple antigen exposures
(A) Kinetics for two participants with an initial Hu-1 infection.
(B) Kinetics for 5 participants after vaccination, with no previous exposure. The horizontal line indicates the pre-exposure levels for each epitope-specific T cell population. Throughout the figure, each plot represents longitudinal data from one donor, with the frequency of pMHC+ cells within CD4+ or CD8+ T cells (top) and the frequency of activated (CD38+ICOS+ for pMHC-II+CD4+ T cells or CD38+ for pMHC-I+CD8+ T cells) cells within pMHC+ cells (bottom). Each arrow on the top of the plot indicates an exposure to spike antigen by infection or vaccination.
Discussion
As SARS-CoV-2 variants increasingly escape neutralizing antibody responses, T cell responses that target conserved epitopes are likely to be of increasing immunological importance.9 Here, we characterized multiple epitope-specific CD4+ and CD8+ T cells in a longitudinal cohort of finely sampled individuals early after BTI. Our kinetic analyses clearly demonstrate a rapid activation of both CD4+ and CD8+ T cells that precedes serological increases in neutralizing antibodies. Furthermore, we find an association between high levels of S-specific CD8+ T cell activation and more rapid viral decline in the SARS-CoV-2 RNA levels in the URT.
Although mechanistic roles have been established for neutralizing antibodies in protection from the acquisition of infection and progression to severe disease,4 , 6 questions have persisted over the contributions of CD4+ or CD8+ T cells.42 Identification of immune correlates that predict avoidance of severe outcomes following BTI is challenging due to the relatively low frequency of severe infections. For this reason, studies of the correlation between T cell responses and viral kinetics have been proposed.42 It is pertinent to note that in mild/moderate BTI, vaccination has no apparent impact on peak viral load,12 , 14 , 15 with SARS-CoV-2 viral replication being curtailed at or before the onset of symptoms in most individuals.27 Nonetheless, the significantly faster decline of viral load in the URT among vaccinated individuals in the first week post-onset12 , 13 , 14 , 15 suggests that vaccine-induced immune memory contributes to viral clearance. Our study therefore places the activation of S-specific CD4+ and CD8+ memory T cells in an immunologically relevant window following BTI.
Further support for a protective role for T cells comes from our observation that the higher CD8+ T cell activation level in peripheral blood correlated with the lower peak viral load and a faster rate of viral clearance in the URT. Additional studies will be required to gain mechanistic insights into the role of cytotoxic T cells in directly controlling viral replication during BTI. Importantly, being based on the estimated kinetic parameters of viral load and T cell immunity, this association does not simply reflect temporal relationships between an activated immune response and a declining virus. Our findings are also consistent with animal studies in which CD8+ T cell depletion results in delayed viral clearance.7 Although data derived from peripheral blood may not necessarily reflect T cell responses in tissues, we find that activated S-specific T cells express chemokine receptors that should facilitate trafficking to inflamed tissues, as well as effector molecules such as GzmB that can lead to clearance of infected cells. It is important to note that we were unable to assess the role of T cell activation in the context of diverse clinical outcomes, which will need to be addressed in future studies. A key issue that remains poorly understood is whether or how accelerated viral clearance in the URT is related to protection from severe disease among vaccinated individuals. It is possible that immune responses contributing to viral clearance in the URT also prevent the spread of viruses to the lower respiratory tract, thus mitigating disease progression9; in this context, both antibodies and cytolytic T cells could contribute to the containment of viral replication.
Parallel tracking of CD4+ and CD8+ T cell responses revealed the extent to which the memory T cell pools can be reactivated following antigen exposure. In particular, the rapid appearance of highly activated S-specific CD4+ T cells in the periphery (often within a 24-h sampling window) demonstrated the remarkable efficiency of the CD4+ T cell recall during BTI. Furthermore, long-term tracking of S-specific T cell populations through multiple vaccinations and infections demonstrated the ability of memory cells to be established and recalled multiple times over the course of one to 2 years with no evidence for progressive exhaustion or anergy. Similar longitudinal tracking of the total S-specific memory pool using functional assays in cohorts with diverse vaccine histories, including heterologous vaccine regimens, would further improve our understanding of the long-term maintenance of T cell memory.
Previous characterization of nucleoprotein (B7-N105)-specific CD8+ T cells in the pre-pandemic samples and uninfected individuals has indicated that most cells have a naive phenotype,35 , 36 which is further supported by our analysis. Thus, the analysis of S- and nucleoprotein-specific CD8+ T cells in our S-vaccinated BTI cohort provides an opportunity to analyze both primary and recall CD8+ T cell responses together. Intriguingly, we did not find any major differences in the kinetics of primary and recalled responses, consistent with a previous report on recalled yellow fever virus-specific CD8+ T cells.43 We do note that the high degree of variability for S-specific CD8+ T cell recall in this cohort could mask subtle kinetic differences between primary and recall responses. In addition, as the high naive-precursor frequency of B7-N105 observed in our study and by others35 , 40 may not apply to other pMHC-I specificities and may bias response kinetics, analyses of primary responses to other epitopes could be informative. Given that both the activation time and response peak time of primary B7-N105-specific CD8+ T cells in peripheral blood occur early after symptom onset, it is plausible that both primary and recalled responses contribute to viral clearance.
In vitro restimulation assays have typically been employed to measure the functionality of vaccine- or infection-elicited T cells before BTI.11 , 44 In the context of ongoing viral replication, the use of pMHC multimers allowed us to quantitatively and qualitatively track epitope-specific T cells at markedly augmented resolution. This was particularly advantageous as restimulation-based T cell assays may be confounded during acute infection due to a combination of in vivo T cell activation and a lack of sensitivity to detect subtle changes in the antigen-specific T cell frequency. In particular, we noted a subset of individuals with no observable change in the frequency of S-specific CD8+ T cells throughout BTI, but with robust evidence of activation. Furthermore, our observation of a correlation between viral clearance and T cell recall was based on the measurement of activation, rather than T cell frequency. The ability to accurately determine the phenotype of antigen-specific CD8+ T cells directly ex vivo has therefore provided critical insights into the recall of immunological memory and viral clearance. Although restimulation assays do not allow for the determination of the ex vivo activation phenotype of antigen-specific T cells, they can provide a highly relevant measure of the total magnitude of antigen-specific responses and functionality that is not captured by our current analysis. Given our data, a key consideration for future research will be to define how functional attributes of CD8+ T cells, including cytokine production or cytolytic potential, compared with phenotypic activation and viral decay during BTI.
We and others have previously described how cTFH responses serve as correlates of humoral immunity during viral infection and vaccination, including for SARS-CoV-2.29 , 45 , 46 , 47 The low frequency of S-specific cTFH cells in our BTI cohort was therefore intriguing. It is possible that the interval between antigen exposures affects the emergence of cTFH, as second and third doses of mRNA-encoded S also result in a limited induction of CXCR5+ S-specific CD4+ T cells relative to the first dose.29 Similarly, analyses of influenza HA-specific CD4+ T cells after vaccination indicated a limited induction of a cTFH response in individuals who were vaccinated within the past 12 months compared with those who were not.48 In addition to the limited S-specific cTFH phenotype, the lack of correlation between CD4+ T cell and antibody recalls among our cohort was also surprising. This may reflect an overall less stringent involvement of T cell help in recall humoral responses, consistent with animal models.49 , 50 Given the evidence of germinal center activity following SARS-CoV-2 infection,51 further studies are thus needed to characterize lymphoid TFH and cTFH activity during recall following BTI with SARS-CoV-2 and its utility as a biomarker of humoral immunity in this context.
Although our study is focused on 23 individuals, the thorough kinetic analyses of 150 nasal swabs and 138 blood samples may facilitate a more targeted sampling of larger cohorts at key time points defined in our study. The analysis of more diverse cohorts may facilitate further dissection of factors affecting immune recall and viral clearance including previous antigen exposures, age, or disease severity, which was not possible in our cohort. Nonetheless, our study provides considerable evidence that T cell activation occurs before detectable expansion in the number of cells and that such activation is correlated with the rate of virological control during BTI with SARS-CoV-2. This emphasizes the need to further understand the role of vaccine-elicited T cell immunity both mechanistically and as a correlate of protection.
Limitations of the study
We note that our analysis is limited to specific HLA allotypes that may not be representative of the global population. Further studies are needed to establish equivalent pMHC multimer reagents across different HLA allotypes and antigens as well as to develop strategies that may allow for their application in larger cohorts of genetically diverse populations. In addition, the use of pMHC multimers precludes assessment of the entirety of the T cell memory pool and does not provide information on the functionality of epitope-specific cells. Indeed, there is a need to determine the optimal readouts for both monitoring the extent of T cell recall and identifying functional correlates of protection in larger cohorts, which may require the combined use of multimer staining and functional assays.
STAR★Methods
Key resources table
| REAGENT or RESOURCE | Source | Identifier |
|---|---|---|
| Antibodies | ||
| HRP-conjugated rabbit anti-human IgG | Agilent | Cat# P021402-2 |
| Rabbit anti SARS-CoV N antibody | Rockland | Cat# 200-401-A50 |
| Goat anti-rabbit IgG | Abcam | Cat#ab6721 |
| CD20 2H7 FITC | BD Biosciences | Cat# 555622; RRID: AB_395988 |
| CD3 SK7 BUV805 | BD Biosciences | Cat# 612893; RRID: AB_2870181 |
| CD8 RPA-T8 BUV496 | BD Biosciences | Cat# 564804; RRID: AB_2744460 |
| CD71 M-A712 BUV395 | BD Biosciences | Cat# 743308; RRID: AB_2741416 |
| CD38 HB7 BUV737 | BD Biosciences | Cat# 612824; RRID: AB_2870148 |
| ICOS C398.4A PerCP-Cy5.5 | BioLegend | Cat# 313518; RRID: AB_10641280 |
| CD4 RPA-T4 APC-Cy7 | BioLegend | Cat# 300556; RRID: AB_2564391 |
| CCR5 J418F1 BV421 | BioLegend | Cat# 359118; RRID: AB_2563577 |
| CXCR3 G02H57 Pe-Dazzle594 | BioLegend | Cat# 353736; RRID: AB_2564288 |
| PD-1 EH12.2H7 BV605 | BioLegend | Cat# 329924; RRID: AB_2563212 |
| CD45RA HI100 AlexaFluor700 | BioLegend | Cat# 304120; RRID: AB_493763 |
| CXCR5 MU5UBEE PeCy7 | ThermoFisher | Cat# 25-9185-42; RRID: AB_2573540 |
| GzmB GB11 BV510 | BD Biosciences | Cat# 563388; RRID: AB_2738174 |
| Bacterial and virus strains | ||
| SARS-CoV-2 (CoV/Australia/VIC/01/2020) | Victorian Infectious Diseases Reference Laboratory | N/A |
| SARS-CoV-2 BA.1 (NSW/1933) | Victorian Infectious Diseases Reference Laboratory | N/A |
| SARS-CoV-2 BA.2 (VIC/35858) | Victorian Infectious Diseases Reference Laboratory | N/A |
| Biological samples | ||
| Whole blood samples and derivatives (peripheral blood mononuclear cells (PBMCs), plasma and serum) from SARS-CoV-2 infected subjects | The University of Melbourne | N/A |
| Nasal swabs from SARS-CoV-2 infected subjects | The University of Melbourne | N/A |
| Chemicals, peptides, and recombinant proteins | ||
| TMB substrate | Sigma | Cat#T0440-1L |
| CytoFix/CytoPerm | BD Biosciences | Cat#554714 |
| Trypsin TPCK | Fisher Scientific | Cat# NC9783694 |
| ProT2 MHC Class II biotinylated monomer HLA-DRB1∗15:01 S751-767 | ProImmune | MT4414-1B-G |
| Pro5 MHC Class I pentamer HLA-A∗02:01 S269-277 conjugated to PE | ProImmune | F4339-2A-G |
| Pro5 MHC Class I pentamer HLA-A∗03:01 S378-386 conjugated to PE | ProImmune | F4443-2A-G |
| Pro5 MHC Class I pentamer HLA-A∗24:02 S1205-1213 conjugated to PE | ProImmune | F4668-2A-G |
| Biotinylated monomer HLA-B∗07:02 N105-113 | Monash University | In house |
| Biotinylated monomer HLA-DP∗04:01 S167-180 | Monash University | In house |
| Streptavidin PE | BD Biosciences | Cat#554061 |
| Streptavidin APC | BioLegend | Cat#405207 |
| alamarBlue Cell Viability Reagent | ThermoFisher | Cat#A50101 |
| Experimental models: Cell lines | ||
| Vero cells | Victorian Infectious Diseases Reference Laboratory | N/A |
| HAT-24 cells | Turville Laboratory, Kirby Institute, UNSW | N/A |
| Software and algorithms | ||
| FlowJo v10 | Tree Star | https://www.flowjo.com/ |
| GraphPad Prism v9 | GraphPad | https://www.graphpad.com/ |
| Monolix | Lixoft | https://lixoft.com/products/monolix/ |
Resource availability
Lead contact
Further information and requests for resources and reagents should be directed to and will be fulfilled by the lead contact, Dr. Jennifer Juno (jennifer.juno@unimelb.edu.au).
Materials availability
This study did not generate new unique reagents.
Experimental model and subject details
Human subjects
A cohort of previously vaccinated participants with a nasal PCR-confirmed breakthrough COVID-19 were recruited through contacts with the investigators and invited to provide serial blood samples following self-reported symptom onset (Table S1), some of whom were previously described in 27. For all participants, whole blood was collected with sodium heparin anticoagulant. Plasma was collected and stored at -80oC, and PBMCs were isolated via Ficoll-Paque separation, cryopreserved in 10% DMSO/FCS and stored in liquid nitrogen. For some individuals, additional PBMC samples were available from participation in previous vaccine or SARS-CoV-2 infection studies.29 , 47 , 52 Study protocols were approved by the University of Melbourne Human Research Ethics Committee (2021-21198-15398-3, 2056689), and all associated procedures were carried out in accordance with approved guidelines. All participants provided written informed consent in accordance with the Declaration of Helsinki. HLA typing was performed by the Victorian Transplantation and Immunogenetics Service.
Method details
pHLA production and staining
Pro5 MHC Class I pentamers for HLA-A∗02:01 (S269-277 YLQPRTFLL), HLA-A∗03:01 (S378-386 KCYGVSPTK), and HLA-A∗24:02 (S1205-1213 QYIKWPWYI) pre-conjugated to PE were purchased from ProImmune. ProT2 MHC Class II monomers for HLA-DRB1∗15:01 (S751-767 NLLLQYGSFCTQLNRAL) were purchased from ProImmune and conjugated to Streptavidin-PE (BD Biosciences) at a molar ratio of 8:1 monomer:S-PE. HLA-B∗07:02 (N105-113 SPRWYFYYL) and HLA-DP∗04:01 (S167-180 TFEYVSQPFLMDLE) monomers were produced as described previously.30 , 35 Monomers were conjugated to Streptavidin-APC at a molar ratio of 8:1 monomer:S-APC.
Cryopreserved PBMC were thawed in RPMI-1640 with 10% fetal calf serum (FCS) and penicillin-streptomycin (RF10), and washed. 7 – 13x106 cells were washed in PBS with 2% FCS before incubation in 50nM dasatinib (Sigma) at 37oC for 30 minutes. HLA class II and HLA-B∗07:02 tetramers were added directly to the tubes and stained at a final concentration of 2ug/mL for 60 minutes at 37oC. Class I pentamers were then added (final concentration 2ug/mL) and incubated for 15 minutes at room temperature in the dark. Cells were washed in PBS, stained with Live/Dead green (Life Technologies), and incubated for 30 minutes at 4oC with an antibody cocktail including: CD20 FITC (2H7), CD3 BUV805 (SK7), CD8 BUV496 (RPA-T8), CD71 BUV395 (M-A712), CD38 BUV737 (HB7, all from BD Biosciences), ICOS PerCP-Cy5.5 (C398.4A), CD4 APC-Cy7 (RPA-T4), CCR5 BV421 (J418F1), CXCR3 Pe-Dazzle (G02H57), PD-1 BV605 (EH12.2H7), CD45RA AlexaFluor700 (HI100, all from Biolegend), and CXCR5 PeCy7 (MU5UBEE; ThermoFisher). Cells were washed in PBS+2% FCS and permeabilised for 10 minutes in 70ul of Cytofix/Cytoperm (BD Biosciences). After washing in 2mL of PermWash, cells were incubated with anti-GzmB BV510 (GB11, BD Biosciences) for 30 minutes at 4oC. Cells were washed, resuspended in PBS+2% FCS, and acquired on a BD Fortessa using BD FACS Diva software.
SARS-CoV-2 virus propagation and titration
Ancestral SARS-CoV-2 (VIC01) isolate was grown in Vero cells in serum-free DMEM with 1μg/ml TPCK trypsin while Omicron BA.1 and BA.2 strains were grown in Calu3 cells in DMEM with 2% FCS. Cell culture supernatants containing infectious virus were harvested on Day 3 for VIC01 and Day 4 for Omicron strains, clarified via centrifugation, filtered through a 0.45μM cellulose acetate filter and stored at -80°C. Infectivity of VIC01 stocks was determined by titration on Vero cells via cytopathic effect observation and calculated using the Reed-Muench method, as previously described.47 Infectivity of Omicron stocks was determined by titration on HAT-24 cells (a clone of transduced HEK293T cells stably expressing human ACE2 and TMPRSS253). In a 96-well flat bottom plate, virus stocks were serially diluted five-fold (1:5-1:78,125) in DMEM with 5% FCS, added with 30,000 freshly trypsinised HAT-24 cells per well and incubated at 37°C. After 46 hours, 10μl of alamarBlue™ Cell Viability Reagent (ThermoFisher) was added into each well and incubated at 37°C for 1 hour. The reaction was then stopped with 1% SDS and read on a FLUOstar Omega plate reader (excitation wavelength 560nm, emission wavelength 590nm). The relative fluorescent units (RFU) measured were used to calculate %viability (‘sample’ ÷ ’no virus control’ × 100), which was then plotted as a sigmoidal dose response curve on Graphpad Prism to obtain the virus dilution that induces 50% cell death (50% lethal infectious dose; LD50). Each virus was titrated in quintuplicate in three independent experiments to obtain mean LD50 values.
SARS-CoV-2 microneutralization assay with ELISA-based readout
For Delta breakthrough infections, plasma neutralization activity against ancestral SARS-CoV-2 (CoV/Australia/VIC/01/2020 strain) was measured using a microneutralization assay as previously described.27 96-well flat bottom plates were seeded with Vero cells (20,000 cells per well in 100μl). The next day, Vero cells were washed once with 200 μl serum-free DMEM and added with 150μl of infection media (serum-free DMEM with 1.33 μg/ml TPCK trypsin). 2.5-fold serial dilutions of heat-inactivated plasma (1:20-1:12207) were incubated with SARS-CoV-2 virus at 2000 TCID50/ml at 37°C for 1 hour. Next, plasma-virus mixtures (50μl) were added to Vero cells in duplicate and incubated at 37°C for 48 hours. ‘Cells only’ and ‘virus+cells’ controls were included to represent 0% and 100% infectivity respectively. After 48 hours, all cell culture media were carefully removed from wells and 200 μl of 4% formaldehyde was added to fix the cells for 30 mins at room temperature. The plates were then dunked in a 1% formaldehyde bath for 30 minutes to inactivate any residual virus prior to removal from the BSL3 facility. Cells were washed once in PBS and then permeabilized with 150μl of 0.1% Triton-X for 15 minutes. Following one wash in PBS, wells were blocked with 200μl of blocking solution (4% BSA with 0.1% Tween-20) for 1 hour. After three washes in PBST (PBS with 0.05% Tween-20), wells were incubated with 100μl of rabbit polyclonal anti-SARS-CoV N antibody (Rockland, #200-401-A50) at a 1:8000 dilution in dilution buffer (PBS with 0.2% Tween-20, 0.1% BSA and 0.5% NP-40) for 1 hour. Plates were then washed six times in PBST and added with 100μl of goat anti-rabbit IgG (Abcam, #ab6721) at a 1:8000 dilution for 1 hour. After six washes in PBST, plates were developed with TMB and stopped with 0.15M H2SO4. OD values read at 450nm were then used to calculate %neutralization with the following formula: (‘Virus + cells’ – ‘sample’) ÷ (‘Virus + cells’ – ‘Cells only’) × 100. IC50 values were determined using four-parameter nonlinear regression in GraphPad Prism with curve fits constrained to have a minimum of 0% and maximum of 100% neutralization.
SARS-CoV-2 microneutralization assay with viability dye readout
For Omicron breakthrough infections, plasma neutralization activity against Omicron BA.1 and BA.2 was measured in HAT-24 cells using a viability dye readout. In 96-well flat bottom plates, heat-inactivated plasma samples were diluted 2.5-fold (1:20-1:12,207) in duplicate and incubated with SARS-CoV-2 virus at a final concentration of 2× LD50 at 37°C for 1 hour. Next, 30,000 freshly trypsinised HAT-24 cells in DMEM with 5% FCS were added and incubated at 37°C. ‘Cells only’ and ‘Virus+Cells’ controls were included to represent 0% and 100% infectivity respectively. After 46 hours, 10μl of alamarBlue™ Cell Viability Reagent (ThermoFisher) was added into each well and incubated at 37°C for 1 hour. The reaction was then stopped with 1% SDS and read on a FLUOstar Omega plate reader (excitation wavelength 560nm, emission wavelength 590nm). The relative fluorescent units (RFU) measured were used to calculate %neutralisation with the following formula: (‘Sample’ – ‘Virus+Cells’) ÷ (‘Cells only’ – ‘Virus+Cells’) × 100. IC50 values were determined using four-parameter non-linear regression in GraphPad Prism with curve fits constrained to have a minimum of 0% and maximum of 100% neutralisation.
Analysis of viral RNA load by qPCR
For viral RNA extraction, 200 μL of nasal swab sample was extracted with the QIAamp 96 Virus QIAcube HT kit (Qiagen, Germany) on the QIAcube HT System (Qiagen) according to manufacturer’s instructions. Purified nucleic acid was then immediately converted to cDNA by reverse transcription with random hexamers using the SensiFAST cDNA Synthesis Kit (Bioline Reagents, UK) according to manufacturer’s instructions. cDNA was used immediately in the rRT-PCR or stored at -20oC. Three microlitres of cDNA was added to a commercial real-time PCR master mix (PrecisionFast qPCR Master Mix; Primer Design, UK) in a 20 μL reaction mix containing primers and probe with a final concentration of 0.8μM and 0.1μM for each primer and the probe, respectively. Samples were tested for the presence of SARS-CoV-2 N genes using previously described primers and probes.54 , 55 Thermal cycling and rRT-PCR analyses for all assays were performed on the ABI 7500 FAST real-time PCR system (Applied Biosystems, USA) with the following thermal cycling profile: 95oC for 2 min, followed by 45 PCR cycles of 95oC for 5 s and 60oC for 30 s for N gene.
Quantification and statistical analysis
Modeling of viral and immune kinetics
We used a piecewise model to estimate the activation time and growth rate of various immune responses following breakthrough infections. The model of the immune response for subject at time can be written as:
The model has 5 parameters; and . For a period before , we assumed a constant baseline value for the immune response. After the activation time , the immune response will grow at a rate of until . From , the immune response will decay at a rate of . For each subject , the parameters were taken from a normal distribution, with each parameter having its own mean (fixed effect). A diagonal random effect structure was used, where we assumed there was no correlation within the random effects. The model was fitted to the log-transformed data values, with a constant error model distributed around zero with a standard deviation Model fitting was performed using MonolixR2019b. A binary covariate was used to quantify the difference in parameters between different groups (i.e. S-specific CD8 vs N-specific CD8 responses), and significance was determined based on the value of this binary covariate using a Wald test. Spearman correlation analyses were conducted based on the estimated parameters for each individual in GraphPad Prism 9.
Acknowledgments
We thank the participants for their generous involvement and provision of samples. We thank the molecular staff at the Victorian Infectious Diseases Reference Laboratory for performing real-time PCR and Ms. Grace Gare for technical assistance. We thank Dr. Julian Druce and Dr. Leon Caly at the Victorian Infectious Diseases Reference Laboratory for isolating and distributing SARS-CoV-2 virus isolates. We thank A/Prof Stuart Turville from the Kirby Institute, University of New South Wales for technical expertise and sharing the HAT-24 cell line. We acknowledge the Melbourne Cytometry Platform for provision of flow cytometry services. The graphical abstract was created with BioRender. The work has been generously supported by the Morningside Foundation and by the Australian National Health and Medical Research Council grants 1149990, 1162760, 1194036, and 2004398; Australian Medical Research Future Fund grants 2005544, 2016062, and 2013870; The Victorian Government; and Australian National Health and Medical Research Council Investigator or Fellowship grants (M.K., A.K.W., J.A.J., H.-X.T., D.A.W., M.P.D., K.K., T.H.O.N., and S.J.K.).
Author contributions
M.K. and J.A.J. conceived and supervised the study. M.K., J.A.J., W.S.L., H.-X.T., and A.K.W. designed experiments. M.K., J.A.J., W.S.L., G.T., P.K., K.C.L., and T.T. performed experiments. J.N., T.A., H.E.K., and S.J.K. recruited, collected, and processed participant samples. M.K., J.A.J., W.S.L., H.-X.T., A.K.W., A.R., D.K., and M.P.D. contributed to data analysis. L.C.R., T.H.O.N., P.G.T., K.K., J.P., J.R., and D.A.W. contributed to the methodology design. M.K., J.A.J., W.S.L., H.-X.T., A.R., M.P.D., and S.J.K. drafted the manuscript. All authors reviewed the final version of the manuscript.
Declaration of interests
M.K. has acted as a consultant for Sanofi group of companies.
Published: February 28, 2023
Footnotes
Supplemental information can be found online at https://doi.org/10.1016/j.immuni.2023.02.017.
Supplemental information
Data and code availability
All data reported in this paper will be shared by the lead contact upon request. This paper does not report original code. Any additional information required to reanalyze the data reported in this paper is available from the lead contact upon request.
References
- 1.Buchan S.A., Chung H., Brown K.A., Austin P.C., Fell D.B., Gubbay J.B., Nasreen S., Schwartz K.L., Sundaram M.E., Tadrous M., et al. Estimated effectiveness of COVID-19 vaccines against omicron or delta symptomatic infection and severe outcomes. JAMA Netw. Open. 2022;5:e2232760. doi: 10.1001/jamanetworkopen.2022.32760. [DOI] [PMC free article] [PubMed] [Google Scholar]
- 2.Kirsebom F.C.M., Andrews N., Stowe J., Toffa S., Sachdeva R., Gallagher E., Groves N., O'Connell A.M., Chand M., Ramsay M., Bernal J.L. COVID-19 vaccine effectiveness against the omicron (BA.2) variant in England. Lancet Infect. Dis. 2022;22:931–933. doi: 10.1016/S1473-3099(22)00309-7. [DOI] [PMC free article] [PubMed] [Google Scholar]
- 3.Lauring A.S., Tenforde M.W., Chappell J.D., Gaglani M., Ginde A.A., McNeal T., Ghamande S., Douin D.J., Talbot H.K., Casey J.D., et al. Clinical severity of, and effectiveness of mRNA vaccines against, Covid-19 from omicron, delta, and alpha SARS-CoV-2 variants in the United States: prospective observational study. BMJ. 2022;376:e069761. doi: 10.1136/bmj-2021-069761. [DOI] [PMC free article] [PubMed] [Google Scholar]
- 4.Khoury D.S., Cromer D., Reynaldi A., Schlub T.E., Wheatley A.K., Juno J.A., Subbarao K., Kent S.J., Triccas J.A., Davenport M.P. Neutralizing antibody levels are highly predictive of immune protection from symptomatic SARS-CoV-2 infection. Nat. Med. 2021;27:1205–1211. doi: 10.1038/s41591-021-01377-8. [DOI] [PubMed] [Google Scholar]
- 5.Cromer D., Steain M., Reynaldi A., Schlub T.E., Sasson S.C., Kent S.J., Khoury D.S., Davenport M.P. 2022. Neutralising antibodies predict protection from severe COVID-19. [DOI] [Google Scholar]
- 6.Stadler E., Chai K.L., Schlub T.E., Cromer D., Polizzotto M.N., Kent S.J., Beecher C., White H., Turner T., Skoetz N., et al. 2022. Determinants of passive antibody efficacy in SARS-CoV-2 infection. [DOI] [PubMed] [Google Scholar]
- 7.Liu J., Yu J., McMahan K., Jacob-Dolan C., He X., Giffin V., Wu C., Sciacca M., Powers O., Nampanya F., et al. CD8 T cells contribute to vaccine protection against SARS-CoV-2 in macaques. Sci. Immunol. 2022;7:eabq7647. doi: 10.1126/sciimmunol.abq7647. [DOI] [PMC free article] [PubMed] [Google Scholar]
- 8.Zhuang Z., Lai X., Sun J., Chen Z., Zhang Z., Dai J., Liu D., Li Y., Li F., Wang Y., et al. Mapping and role of T cell response in SARS-CoV-2-infected mice. J. Exp. Med. 2021;218:e20202187. doi: 10.1084/jem.20202187. [DOI] [PMC free article] [PubMed] [Google Scholar]
- 9.Wherry E.J., Barouch D.H. T cell immunity to COVID-19 vaccines. Science. 2022;377:821–822. doi: 10.1126/science.add2897. [DOI] [PubMed] [Google Scholar]
- 10.Bertoletti A., Le Bert N., Tan A.T. SARS-CoV-2-specific T cells in the changing landscape of the COVID-19 pandemic. Immunity. 2022;55:1764–1778. doi: 10.1016/j.immuni.2022.08.008. [DOI] [PMC free article] [PubMed] [Google Scholar]
- 11.Scurr M.J., Lippiatt G., Capitani L., Bentley K., Lauder S.N., Smart K., Somerville M.S., Rees T., Stanton R.J., Gallimore A., et al. Magnitude of venous or capillary blood-derived SARS-CoV-2-specific T cell response determines COVID-19 immunity. Nat. Commun. 2022;13:5422. doi: 10.1038/s41467-022-32985-8. [DOI] [PMC free article] [PubMed] [Google Scholar]
- 12.Chia P.Y., Ong S.W.X., Chiew C.J., Ang L.W., Chavatte J.M., Mak T.M., Cui L., Kalimuddin S., Chia W.N., Tan C.W., et al. Virological and serological kinetics of SARS-CoV-2 Delta variant vaccine breakthrough infections: a multicentre cohort study. Clin. Microbiol. Infect. 2022;28:612.e1–612.e7. doi: 10.1016/j.cmi.2021.11.010. [DOI] [PMC free article] [PubMed] [Google Scholar]
- 13.Puhach O., Adea K., Hulo N., Sattonnet P., Genecand C., Iten A., Jacquérioz F., Kaiser L., Vetter P., Eckerle I., et al. Infectious viral load in unvaccinated and vaccinated individuals infected with ancestral, Delta or Omicron SARS-CoV-2. Nat. Med. 2022;28:1491–1500. doi: 10.1038/s41591-022-01816-0. [DOI] [PubMed] [Google Scholar]
- 14.Garcia-Knight M., Anglin K., Tassetto M., Lu S., Zhang A., Goldberg S.A., Catching A., Davidson M.C., Shak J.R., Romero M., et al. Infectious viral shedding of SARS-CoV-2 Delta following vaccination: A longitudinal cohort study. PLoS Pathog. 2022;18:e1010802. doi: 10.1371/journal.ppat.1010802. [DOI] [PMC free article] [PubMed] [Google Scholar]
- 15.Singanayagam A., Hakki S., Dunning J., Madon K.J., Crone M.A., Koycheva A., Derqui-Fernandez N., Barnett J.L., Whitfield M.G., Varro R., et al. Community transmission and viral load kinetics of the SARS-CoV-2 delta (B.1.617.2) variant in vaccinated and unvaccinated individuals in the UK: a prospective, longitudinal, cohort study. Lancet Infect. Dis. 2022;22:183–195. doi: 10.1016/S1473-3099(21)00648-4. [DOI] [PMC free article] [PubMed] [Google Scholar]
- 16.Sekine T., Perez-Potti A., Rivera-Ballesteros O., Strålin K., Gorin J.B., Olsson A., Llewellyn-Lacey S., Kamal H., Bogdanovic G., Muschiol S., et al. Robust T cell immunity in convalescent individuals with asymptomatic or mild COVID-19. Cell. 2020;183:158–168.e14. doi: 10.1016/j.cell.2020.08.017. [DOI] [PMC free article] [PubMed] [Google Scholar]
- 17.Rha M.S., Jeong H.W., Ko J.H., Choi S.J., Seo I.H., Lee J.S., Sa M., Kim A.R., Joo E.J., Ahn J.Y., et al. PD-1-Expressing SARS-CoV-2-specific CD8(+) T cells are not exhausted, but functional in patients with COVID-19. Immunity. 2021;54:44–52.e43. doi: 10.1016/j.immuni.2020.12.002. [DOI] [PMC free article] [PubMed] [Google Scholar]
- 18.Meckiff B.J., Ramírez-Suástegui C., Fajardo V., Chee S.J., Kusnadi A., Simon H., Eschweiler S., Grifoni A., Pelosi E., Weiskopf D., et al. Imbalance of regulatory and cytotoxic SARS-CoV-2-reactive CD4(+) T cells in COVID-19. Cell. 2020;183:1340–1353.e1316. doi: 10.1016/j.cell.2020.10.001. [DOI] [PMC free article] [PubMed] [Google Scholar]
- 19.Kaneko N., Boucau J., Kuo H.H., Perugino C., Mahajan V.S., Farmer J.R., Liu H., Diefenbach T.J., Piechocka-Trocha A., Lefteri K., et al. Temporal changes in T cell subsets and expansion of cytotoxic CD4+ T cells in the lungs in severe COVID-19. Clin. Immunol. 2022;237:108991. doi: 10.1016/j.clim.2022.108991. [DOI] [PMC free article] [PubMed] [Google Scholar]
- 20.Kared H., Wolf A.S., Alirezaylavasani A., Ravussin A., Solum G., Tran T.T., Lund-Johansen F., Vaage J.T., Nissen-Meyer L.S., Nygaard U.C., et al. Immune responses in Omicron SARS-CoV-2 breakthrough infection in vaccinated adults. Nat. Commun. 2022;13:4165. doi: 10.1038/s41467-022-31888-y. [DOI] [PMC free article] [PubMed] [Google Scholar]
- 21.Collier A.Y., Brown C.M., McMahan K.A., Yu J., Liu J., Jacob-Dolan C., Chandrashekar A., Tierney D., Ansel J.L., Rowe M., et al. Characterization of immune responses in fully vaccinated individuals after breakthrough infection with the SARS-CoV-2 delta variant. Sci. Transl. Med. 2022;14:eabn6150. doi: 10.1126/scitranslmed.abn6150. [DOI] [PMC free article] [PubMed] [Google Scholar]
- 22.Minervina A.A., Pogorelyy M.V., Kirk A.M., Crawford J.C., Allen E.K., Chou C.H., Mettelman R.C., Allison K.J., Lin C.Y., Brice D.C., et al. SARS-CoV-2 antigen exposure history shapes phenotypes and specificity of memory CD8(+) T cells. Nat. Immunol. 2022;23:781–790. doi: 10.1038/s41590-022-01184-4. [DOI] [PMC free article] [PubMed] [Google Scholar]
- 23.Lim J.M.E., Tan A.T., Le Bert N., Hang S.K., Low J.G.H., Bertoletti A. SARS-CoV-2 breakthrough infection in vaccinees induces virus-specific nasal-resident CD8+ and CD4+ T cells of broad specificity. J. Exp. Med. 2022;219:e20220780. doi: 10.1084/jem.20220780. [DOI] [PMC free article] [PubMed] [Google Scholar]
- 24.Bertoletti A., Le Bert N., Tan A.T. Act early and at the right location: SARS-CoV-2 T cell kinetics and tissue localization. Int. J. Mol. Sci. 2022;23:10679. doi: 10.3390/ijms231810679. [DOI] [PMC free article] [PubMed] [Google Scholar]
- 25.Reinscheid M., Luxenburger H., Karl V., Graeser A., Giese S., Ciminski K., Reeg D.B., Oberhardt V., Roehlen N., Lang-Meli J., et al. COVID-19 mRNA booster vaccine induces transient CD8+ T effector cell responses while conserving the memory pool for subsequent reactivation. Nat. Commun. 2022;13:4631. doi: 10.1038/s41467-022-32324-x. [DOI] [PMC free article] [PubMed] [Google Scholar]
- 26.Kedzierska K., Thomas P.G. Count on us: T cells in SARS-CoV-2 infection and vaccination. Cell Rep. Med. 2022;3:100562. doi: 10.1016/j.xcrm.2022.100562. [DOI] [PMC free article] [PubMed] [Google Scholar]
- 27.Koutsakos M., Lee W.S., Reynaldi A., Tan H.X., Gare G., Kinsella P., Liew K.C., Taiaroa G., Williamson D.A., Kent H.E., et al. The magnitude and timing of recalled immunity after breakthrough infection is shaped by SARS-CoV-2 variants. Immunity. 2022;55:1316–1326.e4. doi: 10.1016/j.immuni.2022.05.018. [DOI] [PMC free article] [PubMed] [Google Scholar]
- 28.Altman J.D., Moss P.A., Goulder P.J., Barouch D.H., McHeyzer-Williams M.G., Bell J.I., McMichael A.J., Davis M.M. Phenotypic analysis of antigen-specific T lymphocytes. Science. 1996;274:94–96. doi: 10.1126/science.274.5284.94. [DOI] [PubMed] [Google Scholar]
- 29.Wragg K.M., Lee W.S., Koutsakos M., Tan H.X., Amarasena T., Reynaldi A., Gare G., Konstandopoulos P., Field K.R., Esterbauer R., et al. Establishment and recall of SARS-CoV-2 spike epitope-specific CD4(+) T cell memory. Nat. Immunol. 2022;23:768–780. doi: 10.1038/s41590-022-01175-5. [DOI] [PubMed] [Google Scholar]
- 30.Mudd P.A., Minervina A.A., Pogorelyy M.V., Turner J.S., Kim W., Kalaidina E., Petersen J., Schmitz A.J., Lei T., Haile A., et al. SARS-CoV-2 mRNA vaccination elicits a robust and persistent T follicular helper cell response in humans. Cell. 2022;185:603–613.e15. doi: 10.1016/j.cell.2021.12.026. [DOI] [PMC free article] [PubMed] [Google Scholar]
- 31.Oberhardt V., Luxenburger H., Kemming J., Schulien I., Ciminski K., Giese S., Csernalabics B., Lang-Meli J., Janowska I., Staniek J., et al. Rapid and stable mobilization of CD8(+) T cells by SARS-CoV-2 mRNA vaccine. Nature. 2021;597:268–273. doi: 10.1038/s41586-021-03841-4. [DOI] [PMC free article] [PubMed] [Google Scholar]
- 32.Jung S., Jung J.H., Noh J.Y., Kim W.J., Yoon S.Y., Jung J., Kim E.S., Kim H.B., Cheong H.J., Kim W.J., et al. The generation of stem cell-like memory cells early after BNT162b2 vaccination is associated with durability of memory CD8(+) T cell responses. Cell Rep. 2022;40:111138. doi: 10.1016/j.celrep.2022.111138. [DOI] [PMC free article] [PubMed] [Google Scholar]
- 33.Habel J.R., Nguyen T.H.O., van de Sandt C.E., Juno J.A., Chaurasia P., Wragg K., Koutsakos M., Hensen L., Jia X., Chua B., et al. Suboptimal SARS-CoV-2-specific CD8(+) T cell response associated with the prominent HLA-A∗02:01 phenotype. Proc. Natl. Acad. Sci. USA. 2020;117:24384–24391. doi: 10.1073/pnas.2015486117. [DOI] [PMC free article] [PubMed] [Google Scholar]
- 34.Rowntree L.C., Petersen J., Juno J.A., Chaurasia P., Wragg K., Koutsakos M., Hensen L., Wheatley A.K., Kent S.J., Rossjohn J., et al. SARS-CoV-2-specific CD8(+) T-cell responses and TCR signatures in the context of a prominent HLA-A∗24. Immunol. Cell Biol. 2021;99:990–1000. doi: 10.1111/imcb.12482. [DOI] [PMC free article] [PubMed] [Google Scholar]
- 35.Nguyen T.H.O., Rowntree L.C., Petersen J., Chua B.Y., Hensen L., Kedzierski L., van de Sandt C.E., Chaurasia P., Tan H.X., Habel J.R., et al. CD8(+) T cells specific for an immunodominant SARS-CoV-2 nucleocapsid epitope display high naive precursor frequency and TCR promiscuity. Immunity. 2021;54:1066–1082.e1065. doi: 10.1016/j.immuni.2021.04.009. [DOI] [PMC free article] [PubMed] [Google Scholar]
- 36.Peng Y., Felce S.L., Dong D., Penkava F., Mentzer A.J., Yao X., Liu G., Yin Z., Chen J.L., Lu Y., et al. An immunodominant NP105–113-B∗07:02 cytotoxic T cell response controls viral replication and is associated with less severe COVID-19 disease. Nat. Immunol. 2022;23:50–61. doi: 10.1038/s41590-021-01084-z. [DOI] [PMC free article] [PubMed] [Google Scholar]
- 37.Jensen K.K., Andreatta M., Marcatili P., Buus S., Greenbaum J.A., Yan Z., Sette A., Peters B., Nielsen M. Improved methods for predicting peptide binding affinity to MHC class II molecules. Immunology. 2018;154:394–406. doi: 10.1111/imm.12889. [DOI] [PMC free article] [PubMed] [Google Scholar]
- 38.Rajagopala S.V., Strickland B.A., Pakala S.B., Kimura K.S., Shilts M.H., Rosas-Salazar C., Brown H.M., Freeman M.H., Wessinger B.C., Gupta V., et al. 2022. Mucosal gene expression in response to SARS-CoV-2 is associated with early viral load. [DOI] [PMC free article] [PubMed] [Google Scholar]
- 39.Dong T., Liu G., Felce S., Yao X., Yin Z., Fries A., Mentzer A., Dong D., Wang W., Dejnirattisai W., et al. 2022. Memory cytotoxic SARS-CoV-2 spike protein-specific CD4+ T cells associate with viral control. [DOI] [Google Scholar]
- 40.Lineburg K.E., Grant E.J., Swaminathan S., Chatzileontiadou D.S.M., Szeto C., Sloane H., Panikkar A., Raju J., Crooks P., Rehan S., et al. CD8(+) T cells specific for an immunodominant SARS-CoV-2 nucleocapsid epitope cross-react with selective seasonal coronaviruses. Immunity. 2021;54:1055–1065.e1055. doi: 10.1016/j.immuni.2021.04.006. [DOI] [PMC free article] [PubMed] [Google Scholar]
- 41.Weinreich D.M., Sivapalasingam S., Norton T., Ali S., Gao H., Bhore R., Xiao J., Hooper A.T., Hamilton J.D., Musser B.J., et al. REGEN-COV antibody combination and outcomes in outpatients with Covid-19. N. Engl. J. Med. 2021;385:e81. doi: 10.1056/NEJMoa2108163. [DOI] [PMC free article] [PubMed] [Google Scholar]
- 42.Kent S.J., Khoury D.S., Reynaldi A., Juno J.A., Wheatley A.K., Stadler E., John Wherry E., Triccas J., Sasson S.C., Cromer D., Davenport M.P. Disentangling the relative importance of T cell responses in COVID-19: leading actors or supporting cast? Nat. Rev. Immunol. 2022;22:387–397. doi: 10.1038/s41577-022-00716-1. [DOI] [PMC free article] [PubMed] [Google Scholar]
- 43.Minervina A.A., Pogorelyy M.V., Komech E.A., Karnaukhov V.K., Bacher P., Rosati E., Franke A., Chudakov D.M., Mamedov I.Z., Lebedev Y.B., et al. Primary and secondary anti-viral response captured by the dynamics and phenotype of individual T cell clones. eLife. 2020;9:e53704. doi: 10.7554/eLife.53704. [DOI] [PMC free article] [PubMed] [Google Scholar]
- 44.Tan A.T., Lim J.M.E., Le Bert N., Kunasegaran K., Chia A., Qui M.D.C., Tan N., Chia W.N., de Alwis R., Ying D., et al. Rapid measurement of SARS-CoV-2 spike T cells in whole blood from vaccinated and naturally infected individuals. J. Clin. Invest. 2021;131:e152379. doi: 10.1172/JCI152379. [DOI] [PMC free article] [PubMed] [Google Scholar]
- 45.Koutsakos M., Nguyen T.H.O., Kedzierska K. With a little help from T follicular helper friends: humoral immunity to influenza vaccination. J. Immunol. 2019;202:360–367. doi: 10.4049/jimmunol.1800986. [DOI] [PubMed] [Google Scholar]
- 46.Koutsakos M., Wheatley A.K., Loh L., Clemens E.B., Sant S., Nüssing S., Fox A., Chung A.W., Laurie K.L., Hurt A.C., et al. Circulating T(FH) cells, serological memory, and tissue compartmentalization shape human influenza-specific B cell immunity. Sci. Transl. Med. 2018;10:eaan8405. doi: 10.1126/scitranslmed.aan8405. [DOI] [PubMed] [Google Scholar]
- 47.Juno J.A., Tan H.X., Lee W.S., Reynaldi A., Kelly H.G., Wragg K., Esterbauer R., Kent H.E., Batten C.J., Mordant F.L., et al. Humoral and circulating follicular helper T cell responses in recovered patients with COVID-19. Nat. Med. 2020;26:1428–1434. doi: 10.1038/s41591-020-0995-0. [DOI] [PubMed] [Google Scholar]
- 48.Wild K., Smits M., Killmer S., Strohmeier S., Neumann-Haefelin C., Bengsch B., Krammer F., Schwemmle M., Hofmann M., Thimme R., et al. Pre-existing immunity and vaccine history determine hemagglutinin-specific CD4 T cell and IgG response following seasonal influenza vaccination. Nat. Commun. 2021;12:6720. doi: 10.1038/s41467-021-27064-3. [DOI] [PMC free article] [PubMed] [Google Scholar]
- 49.Hebeis B.J., Klenovsek K., Rohwer P., Ritter U., Schneider A., Mach M., Winkler T.H. Activation of virus-specific memory B cells in the absence of T cell help. J. Exp. Med. 2004;199:593–602. doi: 10.1084/jem.20030091. [DOI] [PMC free article] [PubMed] [Google Scholar]
- 50.Zabel F., Fettelschoss A., Vogel M., Johansen P., Kündig T.M., Bachmann M.F. Distinct T helper cell dependence of memory B-cell proliferation versus plasma cell differentiation. Immunology. 2017;150:329–342. doi: 10.1111/imm.12688. [DOI] [PMC free article] [PubMed] [Google Scholar]
- 51.Tan H.X., Wragg K.M., Kelly H.G., Esterbauer R., Dixon B.J., Lau J.S.Y., Flanagan K.L., van de Sandt C.E., Kedzierska K., McMahon J.H., et al. Cutting edge: SARS-CoV-2 infection induces robust germinal center activity in the human tonsil. J. Immunol. 2022;208:2267–2271. doi: 10.4049/jimmunol.2101199. [DOI] [PubMed] [Google Scholar]
- 52.Wheatley A.K., Juno J.A., Wang J.J., Selva K.J., Reynaldi A., Tan H.X., Lee W.S., Wragg K.M., Kelly H.G., Esterbauer R., et al. Evolution of immune responses to SARS-CoV-2 in mild-moderate COVID-19. Nat. Commun. 2021;12:1162. doi: 10.1038/s41467-021-21444-5. [DOI] [PMC free article] [PubMed] [Google Scholar]
- 53.Tea F., Ospina Stella A., Aggarwal A., Ross Darley D., Pilli D., Vitale D., Merheb V., Lee F.X.Z., Cunningham P., Walker G.J., et al. SARS-CoV-2 neutralizing antibodies: longevity, breadth, and evasion by emerging viral variants. PLoS Med. 2021;18:e1003656. doi: 10.1371/journal.pmed.1003656. [DOI] [PMC free article] [PubMed] [Google Scholar]
- 54.Chan J.F., Yip C.C., To K.K., Tang T.H., Wong S.C., Leung K.H., Fung A.Y., Ng A.C., Zou Z., Tsoi H.W., et al. Improved molecular diagnosis of COVID-19 by the novel, highly sensitive and specific COVID-19-RdRp/Hel real-time reverse transcription-PCR assay validated in vitro and with clinical specimens. J. Clin. Microbiol. 2020;58:e00310–e00320. doi: 10.1128/JCM.00310-20. [DOI] [PMC free article] [PubMed] [Google Scholar]
- 55.Corman, V.M., Landt, O., Kaiser, M., Molenkamp, R., Meijer, A., Chu, D.K., Bleicker, T., Brünink, S., Schneider, J., Schmidt, M.L., et al. (2020). Detection of 2019 novel coronavirus (2019-nCoV) by real-time RT-PCR. Euro Surveill. 25, 2000045. 10.2807/1560-7917.ES.2020.25.3.2000045. [DOI] [PMC free article] [PubMed]
Associated Data
This section collects any data citations, data availability statements, or supplementary materials included in this article.
Supplementary Materials
Data Availability Statement
All data reported in this paper will be shared by the lead contact upon request. This paper does not report original code. Any additional information required to reanalyze the data reported in this paper is available from the lead contact upon request.