Abstract
We detected biosynthetic activity for aflatoxins G1 and G2 in cell extracts of Aspergillus parasiticus NIAH-26. We found that in the presence of NADPH, aflatoxins G1 and G2 were produced from O-methylsterigmatocystin and dihydro-O-methylsterigmatocystin, respectively. No G-group aflatoxins were produced from aflatoxin B1, aflatoxin B2, 5-methoxysterigmatocystin, dimethoxysterigmatocystin, or sterigmatin, confirming that B-group aflatoxins are not the precursors of G-group aflatoxins and that G- and B-group aflatoxins are independently produced from the same substrates (O-methylsterigmatocystin and dihydro-O-methylsterigmatocystin). In competition experiments in which the cell-free system was used, formation of aflatoxin G2 from dihydro-O-methylsterigmatocystin was suppressed when O-methylsterigmatocystin was added to the reaction mixture, whereas aflatoxin G1 was newly formed. This result indicates that the same enzymes can catalyze the formation of aflatoxins G1 and G2. Inhibition of G-group aflatoxin formation by methyrapone, SKF-525A, or imidazole indicated that a cytochrome P-450 monooxygenase may be involved in the formation of G-group aflatoxins. Both the microsome fraction and a cytosol protein with a native mass of 220 kDa were necessary for the formation of G-group aflatoxins. Due to instability of the microsome fraction, G-group aflatoxin formation was less stable than B-group aflatoxin formation. The ordA gene product, which may catalyze the formation of B-group aflatoxins, also may be required for G-group aflatoxin biosynthesis. We concluded that at least three reactions, catalyzed by the ordA gene product, an unstable microsome enzyme, and a 220-kDa cytosol protein, are involved in the enzymatic formation of G-group aflatoxins from either O-methylsterigmatocystin or dihydro-O-methylsterigmatocystin.
Aflatoxin B1 (AFB1), AFB2, AFG1, and AFG2 are toxic, carcinogenic secondary metabolites that are produced by some strains of Aspergillus flavus, Aspergillus parasiticus, Aspergillus nomius, and Aspergillus tamarii (10). The biosynthetic pathway consists of more than 18 enzyme steps from acetyl coenzyme A (2, 4–6, 9, 25, 27, 30–35, 37). Many of the genes involved in aflatoxin biosynthesis have been isolated, and most of them are clustered (reviewed in references 26 and 28). The pathway leading to the formation of G-group aflatoxins has not been determined yet because the enzyme activities required to synthesize these compounds have not been detected in cell-free systems.
AFB1 and AFG1 contain dihydrobisfuran rings, and AFB2 and AFG2 contain tetrahydrobisfuran rings. In vivo feeding experiments have shown that AFB1 and AFG1 are produced from O-methylsterigmatocystin (OMST) and that AFB2 and AFG2 are produced from dihydro-O-methylsterigmatocystin (DHOMST) (4, 6, 30). Also, AFB1 and AFB2 are independently produced from OMST and DHOMST, respectively, through common reactions in in vitro cell-free systems (4, 30).
The biosynthetic pathway(s) associated with the formation of G-group aflatoxins has been controversial for a long time. All known G-group aflatoxin-producing strains also produce B-group aflatoxins (18). No mutants that produce only G-group aflatoxins have been isolated in mutagenesis experiments performed with aflatoxigenic strains (3, 36). Low levels of conversion of radioactive AFB1 to other aflatoxins, including AFG1, have been obtained by using a cell-free homogenate (22). These results are consistent with the hypothesis that G-group aflatoxins may be produced from B-group aflatoxins. However, some researchers have reported that in feeding experiments radioactive AFB1 is converted to other aflatoxins (16, 22), while other workers have not observed this (11, 17). Despite these differences, it is generally assumed that G-group aflatoxins are produced from B-group aflatoxins by insertion of oxygen into a C-C bond through a Baeyer-Villigar reaction (9, 27).
Aflatoxins are produced intracellularly and then excreted. In feeding experiments, exogenous AFB1 may not reach the aflatoxin biosynthetic site in the cell, and confirmation of AFB1 entrance into the cell is essential. However, since aflatoxins are hydrophobic substances, distinguishing the entrance of AFB1 into a cell from nonspecific binding of AFB1 to hydrophobic cellular components (e.g., membranes) is very difficult. Therefore, an in vitro cell-free system for G-group aflatoxin biosynthesis is essential for determining the biosynthetic relationship between the G- and B-group aflatoxins. Our objectives in this study were (i) to establish a cell-free system for biosynthesis of G-group aflatoxins, (ii) to clarify the biosynthetic relationship between G- and B-group aflatoxins, and (iii) to characterize the enzyme steps for G-group aflatoxin formation. Finally, we describe a scheme for the biosynthetic pathway for the G-group aflatoxins.
MATERIALS AND METHODS
Microorganisms and cultures.
A. parasiticus NIAH-26, a UV-irradiated mutant of A. parasiticus SYS-4 (= NRRL 2999), was used in this study (36). A. parasiticus NIAH-26 induced all enzymes required to convert norsolorinic acid to aflatoxins in YES liquid culture medium (2% yeast extract, 20% sucrose), although it produced no aflatoxins or anthraquinone or xanthone precursors. This mutant may be blocked in the pathway before the formation of norsolorinic acid (30–35, 37). Non-aflatoxin-producing wild-type strain Aspergillus oryzae SYS-2 (= IFO 4251) also was used. The fungal strains were cultured without agitation at 28°C for 4 days either in YES liquid medium (an aflatoxin-inducing medium) or in YEP liquid medium (2% yeast extract, 20% peptone) (a non-aflatoxin-inducing medium) (1).
Standard metabolite samples.
We prepared OMST and DHOMST as described previously (30). 5-Methoxysterigmatocystin (7-hydroxy-6-10-dimethoxydifuroxanthone) and sterigmatin were isolated by extracting mycelia of Aspergillus versicolor (Vuillemin) Tiraboschi (13), and dimethoxysterigmatocystin (6,9,10-trimethoxy-7-hydroxydifuroxanthone) was isolated by extracting mycelia of Aspergillus multicolor (14). A standard kit (Makor, Israel) was used to analyze the AFB1, AFB2, AFG1, and AFG2. The sterigmatocystin derivatives were dissolved in dimethylformamide and diluted in methanol, and their concentrations were determined from UV absorption spectra by using the following molar absorption coefficients (8, 13): OMST (310 nm), 16,500; DHOMST (311 nm), 17,300; 5-methoxysterigmatocystin (331 nm), 12,100; dimethoxysterigmatocystin (330 nm), 19,200; sterigmatin (324 nm), 16,900; AFB1 (362 nm), 21,800; AFB2 (363 nm), 24,000; AFG1 (362 nm), 16,100; and AFG2 (365 nm), 19,300.
Preparation of cell extract, microsome fractions, and cytosol fractions.
The cell extract, microsome, and cytosol fractions were prepared from mycelia of cultures grown in YES or YEP medium at 28°C for 4 days by grinding the mycelia and then centrifuging them (32, 37). Samples were frozen at −80°C until they were used.
Enzyme assays for aflatoxin formation.
We determined assay conditions that optimized the enzyme activity. Lecithin from eggs (Merck, Rahway, N.J.) was dissolved in a mixture containing chloroform and methanol and dried by rotary evaporation. After six repetitions of solubilization and drying, the resultant lipid film was suspended in a solution containing 20 mM Tris-HCl (pH 7.5) and 1 mM EDTA by mixing with a Vortex mixer and sonication in order to obtain a liposome solution with a final lecithin concentration of 5 mg/ml (21). The resultant liposome solution was stored at 4°C. To determine the effect of lipid form on enzyme activity, lecithin also was suspended in water and then sonicated without evaporation; in the resultant solution, the lipid could assume the form of a micelle instead of a liposome. Both lipid preparations were effective for G-group aflatoxin formation activity for at least 6 months.
To detect enzyme activity, we incubated cell extracts (containing 1.3 mg of protein per ml) in a reaction mixture containing 90 mM potassium phosphate (pH 7.5), 10% (vol/vol) glycerol, each substrate at a concentration of 80 μM, 4 mM NADPH, 0.9 mg of bovine serum albumin (BSA) per ml, and 0.5 mg of liposome per ml. The cell extract was first mixed with BSA and liposome, and the reaction was started by adding the other constituents. The final volume of the reaction mixture was 50 μl. Reactions were routinely carried out at 24°C for 40 min and then terminated by adding 75 μl of water-saturated chloroform and mixing the preparation with a Vortex mixer. After centrifugation at 10,000 × g for 1 min, an aliquot of the lower chloroform layer was injected directly into a model LC-6A high-performance liquid chromatograph (HPLC) (Shimadzu, Kyoto, Japan) equipped with a silica gel HPLC column (4.6 by 150 mm; Shim-pack CLC-SIL; Shimadzu) and a guard column (4 by 10 mm; Shim-pack G-Sil). The solvent system consisted of toluene, ethyl acetate, formic acid, and methanol (198:15:4:3, vol/vol/vol/vol). The fluorescence intensities of the aflatoxins were monitored with a Shimadzu model RF-535 HPLC fluorescence monitor (excitation wavelength, 365 nm; emission wavelength, 425 nm) by using a flow rate of 1 ml/min at room temperature. The retention times of AFB1, AFB2, AFG1, and AFG2 were compared with the retention times of standard metabolite samples.
Microsome fractions were mixed with or without the cytosol fraction (final concentration, 0.36 mg of protein/ml) in the presence of BSA and liposome in order to localize enzyme activity. Enzyme reaction was started by adding the reaction mixture containing the other constituents.
To determine the molecular mass of the cytosolic factor used for AFG1 formation, we prepared the cytosol fraction (6 mg of protein; 0.4 ml) by concentrating the fraction to 80% saturation with ammonium sulfate and then suspending it in a 20 mM Tris-HCl (pH 7.5) solution. The resultant solution was loaded onto an Ultrogel AcA 34 column (1.25 by 56 cm; Amersham Pharmacia Biotech AB, Uppsala, Sweden) that had previously been equilibrated with a solution containing 20 mM Tris-HCl (pH 7.5). After 0.5-ml fractions were collected, a 70-μl aliquot from each fraction was mixed with the microsome fraction (5 μl; final concentration, 0.84 mg/ml) and then with a mixture containing lipid and BSA. The reaction was then started by adding a reaction mixture containing the other constituents described above. The final volume of the reaction mixture was 100 μl. The reaction was carried out at 24°C for 40 min, and the amounts of AFB1 and AFG1 were measured.
To determine the stability of enzyme activity, the cell extracts were incubated with or without BSA (2.3 mg/ml) and lipid (1.25 mg/ml) for various times at 24°C. The enzyme activity that remained was determined by adding a reaction mixture containing the other constituents described above and then incubating the preparation at 24°C for 40 min.
To determine which fraction (microsome or cytosol) resulted in the instability of G-group aflatoxin formation activity, one fraction was incubated at 24°C for 60 min, and then the other fraction was added. The aflatoxin biosynthesis enzyme activities were then measured. The final concentrations of microsomes and cytosol were 1.9 and 0.36 mg/ml, respectively.
Characterization of enzyme activity.
Methyrapone (2-methyl-1,2-di-3-pyridyl-1-propanone), SKF-525A [Proadifen; α-phenyl-α-propylbenzeneacetic acid 2-(diethylamino)ethyl ester], and imidazole were purchased from Sigma Chemical Co. (St. Louis, Mo.). Ethoxyquin (6-methoxy-1,2-dihydro-2,2,4-trimethylquinoline) was purchased from ICN Pharmaceuticals, Inc. (Costa Mesa, Calif.). For gel filtration we used an Ultrogel AcA 34 column, and the following molecular mass standards (Amersham Pharmacia Biotech AB) were used to calibrate the molecular mass measurements: dextran blue (2,000 kDa), ferritin (450 kDa), catalase (240 kDa), aldolase (158 kDa), BSA (68 kDa), egg albumin (45 kDa), and cytochrome c (12.5 kDa).
For heat treatment of the cytosol fraction, the cytosol was kept at 90°C for 5 min and then cooled. The protein concentration was determined by using the Bradford method (7) and BSA as the standard.
RESULTS
Detection of enzymatic activity for G-group aflatoxin formation.
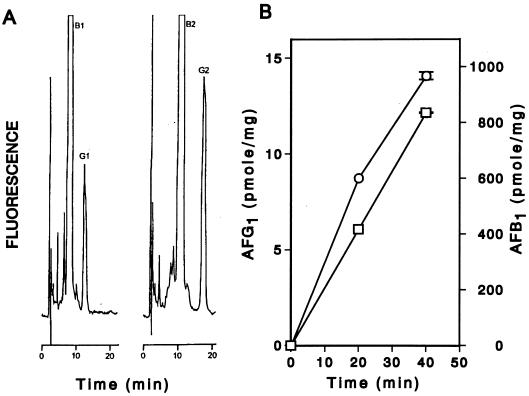
When the cell extract of A. parasiticus NIAH-26 was incubated with OMST in the presence of NADPH at 24°C for 40 min, AFG1 and AFB1 were formed (Fig. 1A). When DHOMST instead of OMST was added to the reaction mixture, AFG2 and AFB2 were produced. The amounts of AFB1 and AFG1 produced from OMST continued to increase for at least 40 min (Fig. 1B). When OMST was used as a substrate, the apparent Km values of OMST and NADPH for AFG1 formation were 1.8 and 154 μM, respectively.
FIG. 1.
Enzymatic formation of G- and B-group aflatoxins. (A) Cell extract was incubated with OMST (left) or DHOMST (right) in the presence of NADPH, and a chloroform extract of the reaction mixture was then analyzed by silica gel HPLC. The retention times were 8.3 min for AFB1, 12.7 min for AFG1, 10.7 min for AFB2, and 17.1 min for AFG2. (B) Cell extract was incubated with OMST at 24°C for various times in the presence of liposome and BSA, and AFG1 (□) and AFB1 (○) were produced. The error bars indicate the differences in the duplicate experiments.
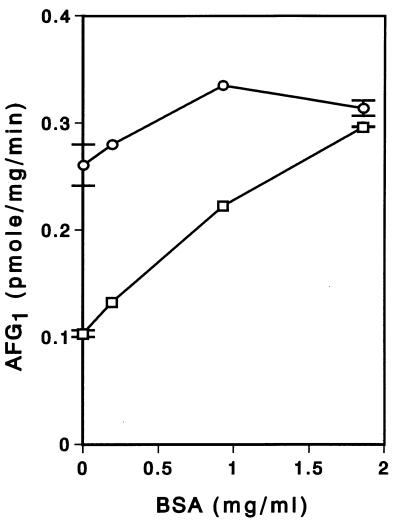
Because the enzyme activity for G-group aflatoxin formation appeared to be weak, approximately 0.6% of the enzyme activity for B-group aflatoxin formation, we attempted to optimize the activities by supplying substances generally assumed to be useful for activating or stabilizing enzymes (e.g., BSA, lipids, and polyols) (15, 20, 29). When an extract was mixed with various concentrations (0 to 1.8 mg/ml) of BSA and liposome and then the reaction was started by adding substrate and other constituents, the enzyme activity was enhanced (Fig. 2). Addition of only lipid (0.5 mg/ml) significantly increased the enzyme activity for G-group aflatoxin formation, and addition of both lipid (0.5 mg/ml) and BSA (0.9 mg/ml) resulted in the maximum enzyme activity. We also found that enzyme activity was significantly greater when the lipid-BSA mixture was added first to the cell extract, before the other constituents were added, than when the reactions were started by adding a single solution containing all of the constituents. In similar experiments, we found that the micelle form of the lipid instead of the liposome form resulted in a similar enhancement effect, although the liposome form was routinely used. In contrast, increasing the glycerol concentration from 10 to 25% did not affect the enzyme activity, although more than 20% glycerol is generally considered a stabilizer for cytochrome P-450 monooxygenase activity (19).
FIG. 2.
Activation of aflatoxin production with BSA and liposome. Cell extract was added to mixtures containing various concentrations of BSA with (○) or without (□) liposome (0.5 mg/ml), and then the reactions were started by adding the other constituents, including OMST and NADPH. After incubation at 24°C for 40 min, the amount of AFG1 produced was measured. The error bars indicate the differences in the duplicate experiments.
Independent formation of G- and B-group aflatoxins.
We examined the enzyme activities for G-group aflatoxin formation when various metabolites were used as substrates. When 9 μM OMST was added to the reaction mixture, AFG1 (0.20 ± 0.011 pmol/mg of protein/min) but not AFG2 was produced, and when the same concentration of DHOMST was added, only AFG2 (0.17 ± 0.014 pmol/mg/min) was produced. However, neither AFG1 nor AFG2 was produced from either 85 μM 5-methoxysterigmatocystin or 87 μM sterigmatin. A trivial amount of AFG1 (0.009 ± 0.007 pmol/mg/min) was produced when 77 μM dimethoxysterigmatocystin was added, which may have been due to contamination of the dimethoxysterigmatocystin by a small amount OMST. In the same experiments, neither AFG1 nor AFG2 was produced from either 9 μM AFB1 or 9 μM AFB2, nor did the reverse reaction from G-group aflatoxins to B-group aflatoxins occur.
Involvement of the common enzyme(s) for formation of AFG1 and AFG2.
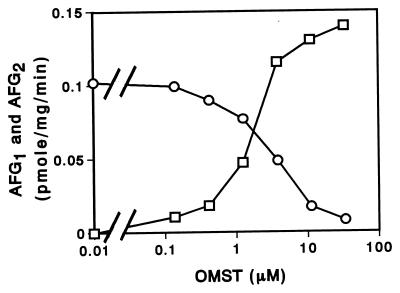
To determine the relationship between AFG1 formation and AFG2 formation, we examined the enzyme activities by using reaction mixtures that contained 4.6 μM DHOMST and different concentrations of OMST (Fig. 3). Although AFG2 was produced from DHOMST, the amount formed decreased as the OMST concentration increased. Adding high concentrations of OMST (concentrations higher than 10 μM) led to exclusive formation of AFG1. These results indicate that the same enzyme(s) may catalyze the formation of AFG1 and AFG2.
FIG. 3.
Competition between OMST and DHOMST for enzyme during G-group aflatoxin formation. A cell extract was incubated with 4.6 μM DHOMST and various concentrations of OMST at 24°C for 40 min, and then the amounts of AFG1 (□) and AFG2 (○) were measured.
Requirement for both the microsome fraction and the 220-kDa protein for G-group aflatoxin production.
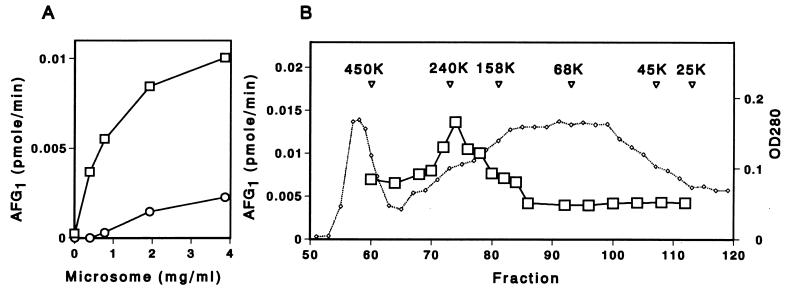
We measured the G-group aflatoxin formation activity by using either the microsome fraction or the cytosol fraction or a combination of both fractions (Fig. 4A). Significant amounts of AFG1 were not formed in the reaction mixture containing OMST plus cytosol, and the OMST-microsome reaction mixture produced only a trace amount of AFG1. When both the cytosol and microsome fractions were present, enzyme activity was markedly enhanced and dependent on the microsome concentration. Preincubation of the cytosol at 90°C for 5 min eliminated the enhancement effect during G-group aflatoxin formation (data not shown). These results indicate that both the cytosol fraction and the microsome fraction are required for production of AFG1.
FIG. 4.
Requirement for both cytosol and microsome fractions during AFG1 formation. (A) Various concentrations of the microsome fraction were incubated with OMST in the presence (□) or absence (○) of the cytosol fraction. (B) Concentrated cytosol fraction was applied to an Ultrogel AcA 34 gel filtration column, and the column effluent was supplemented with the microsome fraction. Then the AFG1 formation activity (□) was measured. The absorbance at 280 nm is shown for reference (dotted line). The positions of molecular mass standards (in kilodaltons) are indicated, and the volume of each fraction was 0.5 ml. OD280, optical density at 280 nm.
Neither aflatoxin formation activity nor enhancement effects were detected with either cytosol fractions or microsome fractions prepared from cultures grown in YEP medium or from A. oryzae SYS-2 that had been cultured in YES medium. Instead, the cytosol fractions of cultures grown in YEP medium partially suppressed AFG1 formation activity of either the microsome fraction or the cytosol fraction prepared from A. parasiticus NIAH-26 cultured in YES medium (data not shown).
We examined the activation factor in the cytosol fraction by fractionating it through an Ultrogel AcA 34 gel filtration column and then incubating each fraction with OMST in a reaction mixture containing the microsome fraction. AFG1 formation activity (Fig. 4B) was increased threefold by the addition of the fraction that corresponded to a molecular weight of about 220,000. This fraction did not correspond to the peak fraction containing protein, indicating that the enhancing activity of this fraction was not caused by an as-yet-unidentified stabilizing effect associated with a high protein concentration. These results indicate that at least two kinds of enzymes, one a microsome enzyme and the other a 220-kDa soluble protein, are necessary for the formation of AFG1 from OMST.
Characterization and comparison of G-group aflatoxin formation activity and B-group aflatoxin formation activity.
Formation of AFG1 and AFB1 was decreased by 3 mM methyrapone, SKF-525A, or imidazole (Table 1), indicating that the formation of AFB1 and the formation of AFG1 were dependent on cytochrome P-450 oxygenase activity. Also, preferential inhibition of AFG1 formation but not AFB1 formation by ethoxyquin, which was detected in cultures of aflatoxigenic strains (12), was observed in the cell-free system.
TABLE 1.
Effects of various compounds on aflatoxin production
| Expt | Compound | Concn | Production of:
|
|
|---|---|---|---|---|
| AFG1 (pmol/mg/min) | AFB1 (pmol/mg/min) | |||
| 1a | None | 0.15 ± 0.013b (100)c | 21 ± 2.0 (100) | |
| Methyrapone | 3 mM | 0.027 ± 0.001 (18) | 7.5 ± 0.1 (35) | |
| SKF-525A | 3 mM | 0.018 ± 0.0004 (12) | 5.5 ± 0.3 (26) | |
| Imidazole | 3 mM | 0.062 ± 0.005 (42) | 9.8 ± 0.6 (46) | |
| 2d | None | 0.15 ± 0.008 (100) | 19 ± 0.03 (100) | |
| Ethoxyquin | 2 μg/ml | 0.09 (61) | 18 (95) | |
| Ethoxyquin | 5 μg/ml | 0.075 (52) | 16 (86) | |
| Ethoxyquin | 40 μg/ml | 0.027 ± 0.01 (18) | 10 ± 0.5 (55) | |
Dimethylformamide (final concentration, 2%) was included in the reaction mixtures as the solvent.
The values represent the means and differences of duplicate experiments.
The values in parentheses are percentages.
Water was included in the reaction mixtures as the solvent.
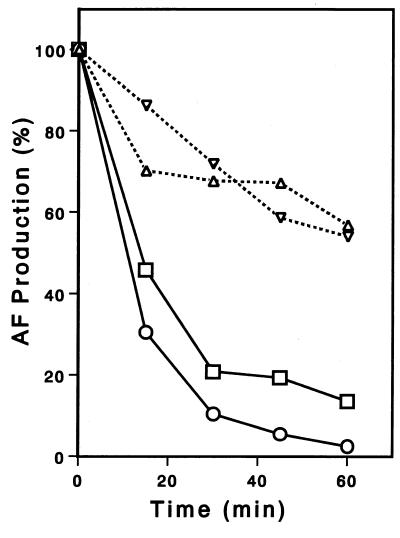
When the cell extract was incubated with or without liposome and BSA at 24°C for various times, the level of AFG1 production (Fig. 5) decreased to less than 50% of the original level after 15 min and to less than 20% of the original level after 30 min, irrespective of the presence of lipid and BSA. The AFB1 formation activity was more stable than the AFG1 formation activity was and was about 70% of the original activity after 30 min of incubation. The presence of lipid and BSA appeared to slightly stabilize both activities, although an increase in the glycerol concentration up to 34% (final concentration) did not stabilize the activities (data not shown).
FIG. 5.
Stability of aflatoxin formation activity. Cell extracts were incubated with (□ and ▿) or without (○ and ▵) lipid and BSA at 24°C for various times, and then the enzyme activities for AFG1 formation (□ and ○) and for AFB1 formation (▿ and ▵) were determined. The activities without preincubation (at zero time) were 0.19 pmol of AFG1/mg/min (□), 0.23 pmol of AFG1/mg/min (○), 31 pmol of AFB1/mg/min (▿), and 30 pmol of AFB1/mg/min (▵). AF, aflatoxin.
We determined which fraction (cytosol or microsome) contributed to the instability of the enzyme activity by independently incubating the fractions at 24°C for 60 min and then adding the other fraction. We found that preincubation of the microsome fraction significantly decreased the activity to 9.5% of the maximum activity, whereas preincubation of the cytosol fraction only slightly decreased the activity to 98% of the maximum activity. These results indicate that the microsome enzyme may be the cause of the instability observed in G-group aflatoxin biosynthesis.
DISCUSSION
We detected enzyme activity for G-group aflatoxin formation by using a cell extract and a combination of cytosol and microsome fractions of A. parasiticus NIAH-26. Addition of exogenous lipid and BSA increased G-group aflatoxin formation, but the amount of AFG1 formed was always less than 1.5% of the amount of AFB1 formed, even in the presence of liposome and BSA. In contrast to this differential activity in cell-free systems, A. parasiticus NRRL 2999, the wild-type progenitor of NIAH-26, produced similar amounts of both G- and B-group aflatoxins. Also, A. parasiticus NIAH-26 could convert either sterigmatocystin, dihydrosterigmatocystin, OMST, or DHOMST to significant amounts of G-group aflatoxins that corresponded to the amounts of B-group aflatoxins obtained in previous feeding experiments (30). The relative decrease in G-group aflatoxin biosynthesis may indicate that the enzymes for G-group aflatoxin formation are relatively sensitive to the methods used to prepare the cell-free fractions, whereas the enzymes for B-group aflatoxin formation are much less sensitive to the process. Furthermore, G-group aflatoxin biosynthesis requires both cytosol and microsome fractions (Fig. 4), and if only one of these fractions was used for examining G-group aflatoxin biosynthesis, no (or only a slight amount of) G-group aflatoxin was detected. These findings may at least partially explain why the enzyme activity for G-group aflatoxin biosynthesis was not detected previously.
In this study, we obtained data supporting the hypothesis that G-group aflatoxins and B-group aflatoxins are formed independently. AFG1 and AFG2 were produced from OMST and DHOMST, respectively, whereas neither AFG1 nor AFG2 was produced from AFB1 or AFB2 in the cell-free systems used. These results indicate that B-group aflatoxins are not the precursors of G-group aflatoxins and that G- and B-group aflatoxins are independently produced from the same substrate (OMST for AFG1 and AFB1 and DHOMST for AFG2 and AFB2) through different pathways from a common branching intermediate. Although the branch point is not known, at least one intermediate following OMST or DHOMST seems to be involved (see below).
Recently, the ord1 and ordA genes were isolated from A. flavus (24) and A. parasiticus (38), respectively, and were found to be required for the conversion of OMST to AFB1. Yu et al. (38) reported that complementation of A. parasiticus SRRC 2043, an OMST-accumulating strain, with the ordA gene restores the ability to produce AFB1, AFB2, AFG1, and AFG2. However, in a yeast expression system ordA could convert AFB1 to OMST but not to AFG1, and Yu et al. suggested that at least one additional enzyme in addition to the ordA gene product may be needed for the formation of G-group aflatoxins; our results are consistent with this hypothesis. Both the ordA gene and the ord1 gene encode cytochrome P-450 type monooxygenases (based on their DNA sequences). Our finding that biosynthesis of aflatoxins requires NADPH and is inhibited by monooxygenase inhibitors, such as SKF-525A, is consistent with these reports. This similarity indicates that the same enzyme may be involved in both biosynthetic pathways. Moreover, ordA may be a microsome enzyme, since B-group aflatoxin biosynthetic activity is limited to the microsome fraction (4, 29a).
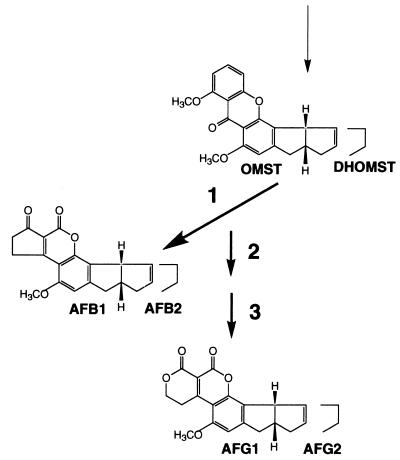
Our results revealed that there are differences between the G-group aflatoxin biosynthetic activity and the B-group aflatoxin biosynthetic activity, because the microsome enzyme fraction involved in G-group aflatoxin formation was less stable than the microsome enzyme fraction involved in B-group aflatoxin formation (Fig. 5). The evidence which indicates that an additional unstable microsome enzyme may be required for G-group aflatoxin formation includes (i) the fact that an ordA product is the sole requirement for AFB1 formation (38), (ii) the fact that the enzyme for B-group aflatoxin biosynthesis is more stable than the enzyme for AFG1 biosynthesis (Fig. 5), and (iii) the fact that the unstable enzyme is in the microsome fraction. Therefore, at least three enzymes apparently are required for conversion of OMST to AFG1 and conversion of DHOMST to AFG2 (Fig. 6); these enzymes are a microsome ordA gene product, an unstable microsome protein, and a 220-kDa cytosol protein. Although B-group aflatoxins may be the final products of the reactions catalyzed by the ordA product, at least two reactions catalyzed by the ordA product may be included in the pathway from OMST to AFB1 or the pathway from DHOMST to AFB2. A nonenzymatic reaction, as well as the enzymatic reaction(s) catalyzed by the ordA gene product, might also occur. Furthermore, a transient intermediate in the successive reactions may function as the branch point for the formation of G-group and B-group aflatoxins and may be converted to G-group aflatoxins through two reactions catalyzed by the unstable microsome enzyme and the cytosol enzyme. We hypothesize that the preferential inhibition of G-group aflatoxin biosynthesis by ethoxyquin (13) is due to this compound’s effect on one of the latter two reaction steps that appear to be unique to G-group aflatoxin biosynthesis. The estimated molecular mass of the native cytosol protein was about 220 kDa, and this protein may be an aggregate form under the low-salt conditions which we used in the gel filtration procedure.
FIG. 6.
Metabolic pathways for formation of AFG1 from OMST and formation of AFG2 from DHOMST. At least three enzyme reactions may be commonly present in both pathways. Reaction 1 may be catalyzed by an ordA gene product, which is microsome cytochrome P-450 oxygenase. A transient intermediate formed during this pathway may be subsequently converted to another substance in reaction 2 and finally converted to the final product, AFG1 or AFG2, in reaction 3. Reactions 2 and 3 may be catalyzed by an unstable microsome enzyme and a 220-kDa cytosol protein. However, the order of the three enzyme activities was not determined in this study.
The biosynthesis of G-group aflatoxins was sensitive to conditions, such as buffer, ionic strength, and ethoxyquin, that suggest that physically and chemically unstable intermediates may be part of the biosynthetic pathway. The next step in our research will involve determining the intermediates involved in these pathways.
Neither G-group aflatoxin biosynthesis nor enhancement of activity due to the microsome and cytosol fractions was detected in the cell-free systems prepared from the strain that was cultured in non-aflatoxin-inducible YEP medium or from the nonaflatoxigenic organism A. oryzae. Similar results have been observed for other enzymes involved in aflatoxin biosynthesis (23, 30, 31, 33, 37), and these results suggested that G-group aflatoxin biosynthesis may be regulated at the transcriptional level by mechanism(s) common to the other enzymes (26). Cloning and characterization of the genes related to G-group aflatoxin formation remain to be studied.
This study brings to an end the long controversy about G-group aflatoxin biosynthesis. It is generally accepted that strains of A. parasiticus produce both G- and B-group aflatoxins, while A. flavus strains produce only B-group aflatoxins (18). The absence of G-group aflatoxin biosynthesis in A. flavus may soon be explained on the basis of biochemical as well as molecular-biological evidence.
ACKNOWLEDGMENTS
This work was supported in part by grant-in-aid BDP-99-VI-1-3 (Bio Design Program) from the Ministry of Agriculture, Forestry and Fisheries.
REFERENCES
- 1.Abdollahi A, Buchanan R L. Regulation of aflatoxin biosynthesis: induction of aflatoxin by various carbohydrates. J Food Sci. 1981;46:633–635. [Google Scholar]
- 2.Bennett J W, Christensen S B. New perspectives on aflatoxin biosynthesis. Adv Appl Microbiol. 1983;29:53–92. doi: 10.1016/s0065-2164(08)70354-x. [DOI] [PubMed] [Google Scholar]
- 3.Bennett J W, Goldblatt L A. The isolation of mutants of Aspergillus flavus and A. parasiticus with altered aflatoxin producing ability. Sabouraudia. 1973;11:235–241. [PubMed] [Google Scholar]
- 4.Bhatnagar D, Cleveland T E, Kingston D G I. Enzymological evidence for separate pathways for aflatoxin B1 and B2 biosynthesis. Biochemistry. 1991;30:4343–4350. doi: 10.1021/bi00231a033. [DOI] [PubMed] [Google Scholar]
- 5.Bhatnagar D, Erlich K C, Cleveland T E. Oxidation-reduction reactions in biosynthesis of secondary metabolites. In: Bhatnagar D, Lillehoj E B, Arora D K, editors. Handbook of applied mycology. Vol. 5. New York, N.Y: Marcel Dekker, Inc.; 1992. pp. 255–286. [Google Scholar]
- 6.Bhatnagar D, McCormick S P, Lee L S, Hill R A. Identification of O-methylsterigmatocystin as an aflatoxin B1 and G1 precursor in Aspergillus parasiticus. Appl Environ Microbiol. 1987;53:1028–1033. doi: 10.1128/aem.53.5.1028-1033.1987. [DOI] [PMC free article] [PubMed] [Google Scholar]
- 7.Bradford M M. A rapid and sensitive method for the quantitation of microgram quantities of protein utilizing the principle of protein-dye binding. Anal Biochem. 1976;72:248–254. doi: 10.1016/0003-2697(76)90527-3. [DOI] [PubMed] [Google Scholar]
- 8.Cole R J, Cox R H. Handbook of toxic fungal metabolites. New York, N.Y: Academic Press, Inc.; 1981. pp. 1–93. [Google Scholar]
- 9.Dutton M F. Enzymes and aflatoxin biosynthesis. Microbiol Rev. 1988;52:274–295. doi: 10.1128/mr.52.2.274-295.1988. [DOI] [PMC free article] [PubMed] [Google Scholar]
- 10.Dvorackova I. Aflatoxins and human health. Boca Raton, Fla: CRC Press; 1990. [Google Scholar]
- 11.Floyd J C, Bennett J W. Preparation of 14C labeled aflatoxins and incorporation of unlabelled aflatoxin in a blocked versicolorin A accumulating mutant of Aspergillus parasiticus. J Am Oil Chem Soc. 1981;58:956A–959A. [Google Scholar]
- 12.Foudin A S, Leaich L L, Ayres J C. Effects of ethoxyquin on aflatoxin-producing strains of Aspergillus parasiticus and A. flavus. J Food Sci. 1978;43:731–734. [Google Scholar]
- 13.Hamasaki T, Matsui K, Isono K, Hatsuda Y. A new metabolite from Aspergillus versicolor. Agric Biol Chem. 1973;37:1769–1770. [Google Scholar]
- 14.Hamasaki T, Nakagomi T, Hatsuda Y, Fukuyama K, Katsube Y. 5,6-Dimethyoxysterigmatocystin, a new metabolite from Aspergillus multicolor. Tetrahedron Lett. 1977;1977:2765–2766. [Google Scholar]
- 15.Havorson M, Greenway D, Eberhart D, Fitzgerald K, Parkinson A. Reconstitution of testosterone oxidation by purified rat cytochrome P450p (IIIa1) Arch. Biochem Biophys. 1990;277:166–180. doi: 10.1016/0003-9861(90)90566-h. [DOI] [PubMed] [Google Scholar]
- 16.Heathcote J G, Dutton M F, Hibbert J R. Biosynthesis of aflatoxins. part II. Chem Ind (London) 1976;20:270–272. [Google Scholar]
- 17.Henderberg A, Bennett J W, Lee L S. Biosynthetic origin of aflatoxin G1: confirmation of sterigmatocystin and lack of confirmation of aflatoxin B1 as precursors. J Gen Microbiol. 1988;134:661–667. doi: 10.1099/00221287-134-3-661. [DOI] [PubMed] [Google Scholar]
- 18.Hesseltine C W, Sorenson W G, Smith M. Taxonomic studies of the aflatoxin producing strains in the Aspergillus flavus group. Mycologia. 1970;62:123–132. [PubMed] [Google Scholar]
- 19.Ichikawa Y, Yamamoto T. Reconversion of detergent- and sulfhydryl reagent-produced P-420 to P-450 by polyols and glutathione. Biochim Biophys Acta. 1967;131:490. doi: 10.1016/0005-2728(67)90008-4. [DOI] [PubMed] [Google Scholar]
- 20.Imaoka S, Terano Y, Funane Y. Constitutive testosterone 6b-hydroxylase in rat liver. J Biochem. 1988;104:481–487. doi: 10.1093/oxfordjournals.jbchem.a122494. [DOI] [PubMed] [Google Scholar]
- 21.Inoue K. Permeability properties of liposomes prepared from dipalmitoyllecithin, dimyristoyllecithin, egg lecithin, rat liver lecithin and beef brain sphingomyelin. Biochim Biophys Acta. 1974;339:390–402. doi: 10.1016/0005-2736(74)90166-7. [DOI] [PubMed] [Google Scholar]
- 22.Maggon K K, Ventikasubramanian T A. Metabolism of aflatoxin B1 and aflatoxin G1 by Aspergillus parasiticus. Experientia. 1973;29:1210–1212. doi: 10.1007/BF01935075. [DOI] [PubMed] [Google Scholar]
- 23.Matsushima K, Ando Y, Hamasaki T, Yabe K. Purification and characterization of two versiconal hemiacetal acetate reductases involved in aflatoxin biosynthesis. Appl Environ Microbiol. 1994;60:2561–2567. doi: 10.1128/aem.60.7.2561-2567.1994. [DOI] [PMC free article] [PubMed] [Google Scholar]
- 24.Prieto R, Woloshuk C P. ord1, an oxidoreductase gene responsible for the conversion of O-methylsterigmatocystin to aflatoxin in Aspergillus flavus. Appl Environ Microbiol. 1997;63:1661–1666. doi: 10.1128/aem.63.5.1661-1666.1997. [DOI] [PMC free article] [PubMed] [Google Scholar]
- 25.Steyn P S, Vleggaar R, Wessels P L. The biosynthesis of aflatoxin and its congeners. In: Steyn P S, editor. The biosynthesis of mycotoxins. New York, N.Y: Academic Press; 1980. pp. 105–155. [Google Scholar]
- 26.Trail F, Mahanti N, Linz J. Molecular biology of aflatoxin biosynthesis. Microbiology. 1995;141:755–765. doi: 10.1099/13500872-141-4-755. [DOI] [PubMed] [Google Scholar]
- 27.Watanabe C M H, Townsend C A. Incorporation of molecular oxygen in aflatoxin B1 biosynthesis. J Org Chem. 1996;61:1990–1993. [Google Scholar]
- 28.Woloshuk C P, Prieto R. Genetic organization and function of the aflatoxin B1 biosynthetic genes. FEMS Microbiol Lett. 1998;160:169–176. doi: 10.1111/j.1574-6968.1998.tb12907.x. [DOI] [PubMed] [Google Scholar]
- 29.Wood A W, Levin W, Lu A Y H, Yagi H, Hernandez O, Jerina D M, Conney A H. Metabolism of benzo[a]pyrene and benzo[a]pyrenederivatives to mutagenic products by highly purified hepatic microsomal enzymes. J Biol Chem. 1976;251:4882–4890. [PubMed] [Google Scholar]
- 29a.Yabe, K. Unpublished data.
- 30.Yabe K, Ando Y, Hamasaki T. Biosynthetic relationship among aflatoxins B1, B2, G1, and G2. Appl Environ Microbiol. 1988;54:2101–2106. doi: 10.1128/aem.54.8.2101-2106.1988. [DOI] [PMC free article] [PubMed] [Google Scholar]
- 31.Yabe K, Ando Y, Hamasaki T. Desaturase activity in the branching step between aflatoxins B1 and G1 and aflatoxins B2 and G2. Agric Biol Chem. 1991;55:1907–1991. [Google Scholar]
- 32.Yabe K, Ando Y, Hamasaki T. A metabolic grid among versiconal hemiacetal acetate, versiconol acetate, versiconol, and versiconal during aflatoxin biosynthesis. J Gen Microbiol. 1991;137:2469–2475. doi: 10.1099/00221287-137-10-2469. [DOI] [PubMed] [Google Scholar]
- 33.Yabe K, Ando Y, Hashimoto J, Hamasaki T. Two distinct O-methyltransferases in aflatoxin biosynthesis. Appl Environ Microbiol. 1989;55:2171–2177. doi: 10.1128/aem.55.9.2172-2177.1989. [DOI] [PMC free article] [PubMed] [Google Scholar]
- 34.Yabe K, Hamasaki T. Stereochemistry during aflatoxin biosynthesis. II. Cyclase reaction in the conversion of versiconal to versicolorin B and racemization of versiconal hemiacetal acetate. Appl Environ Microbiol. 1993;59:2493–2500. doi: 10.1128/aem.59.8.2493-2500.1993. [DOI] [PMC free article] [PubMed] [Google Scholar]
- 35.Yabe K, Matsuyama Y, Ando Y, Nakajima H, Hamasaki T. Stereochemistry during aflatoxin biosynthesis: conversion of norsolorinic acid to averufin. Appl Environ Microbiol. 1993;59:2486–2492. doi: 10.1128/aem.59.8.2486-2492.1993. [DOI] [PMC free article] [PubMed] [Google Scholar]
- 36.Yabe K, Nakamura H, Ando Y, Terakado N, Nakajima H, Hamasaki T. Isolation and characterization of Aspergillus parasiticus mutants with impaired aflatoxin production by a novel tip culture method. Appl Environ Microbiol. 1988;54:2096–2100. doi: 10.1128/aem.54.8.2096-2100.1988. [DOI] [PMC free article] [PubMed] [Google Scholar]
- 37.Yabe K, Nakamura N, Nakajima H, Ando Y, Hamasaki T. Enzymatic conversion of norsolorinic acid to averufin in aflatoxin biosynthesis. Appl Environ Microbiol. 1991;57:1340–1345. doi: 10.1128/aem.57.5.1340-1345.1991. [DOI] [PMC free article] [PubMed] [Google Scholar]
- 38.Yu J, Chang P-K, Ehrlich K C, Cary J W, Montalbano B, Dyer J M, Bhatnagar D, Cleveland T E. Characterization of the critical amino acids of Aspergillus parasiticus cytochrome P-450 monooxygenase encoded by ordA that is involved in the biosynthesis of aflatoxins B1, G1, B2, and G2. Appl Environ Microbiol. 1998;64:4834–4841. doi: 10.1128/aem.64.12.4834-4841.1998. [DOI] [PMC free article] [PubMed] [Google Scholar]


