

Abstract
Laser resurfacing treatments for photoaged skin have improved dramatically over the past decades, but few studies have examined the molecular mechanisms underlying differences in clinical response. Seventeen white female participants with moderate-severe photoaging received non-ablative fractional laser treatment on the face and forearm once monthly for 6 months. Biopsies for microarray analysis were performed at baseline and 7 days after facial treatment and at baseline and 1, 7, 14, and 29 days after forearm treatment in each participant, resulting in 119 total samples. Participants were stratified into fast (n=11) and slow (n=6) responders based on the presence of clinical improvement after the first treatment. Microarray analysis revealed upregulation of genes associated with matrix metalloproteinases, collagen and extracellular components, TGF-β signaling, dsRNA signaling, and retinoic acid synthesis following treatment that did not differ significantly between fast and slow responders. Cluster and enrichment analyses suggested significantly greater activation of lipid metabolism and keratinocyte differentiation in fast responders, who showed greater upregulation of acyltransferases, fatty acid elongases, fatty acid 2-hydroxylase, fatty acid desaturases, and specific keratins that may contribute to epidermal barrier function. These results create a novel atlas of molecular changes that correlate with improvements in photoaging after laser therapy.
INTRODUCTION
Fractional photothermolysis is a method of laser resurfacing that creates tiny, pixelated microthermal zones of focal injury in the skin, which allows faster re-epithelialization by surrounding untreated epidermis and dermis compared to non-fractionated methods (Geronemus, 2006, Manstein et al., 2004). The concept may be applied to both ablative (e.g., CO2, Er:YAG) and non-ablative (e.g., Nd:YAG, Er:Glass) lasers to induce dermal thickening, tissue tightening, and skin texture improvement with short recovery times and less risk of scarring and infection than traditional fully ablative methods (Alexiades-Armenakas et al., 2008, Kauvar, 2014, Park et al., 2012, Tierney et al., 2010).
At the molecular level, laser resurfacing improves skin aging by promoting matrix metalloproteinase (MMP)-mediated breakdown of photodamaged dermal collagen and elastic fibers, followed by their regeneration (Helbig and Paasch, 2011, Orringer et al., 2004, Orringer et al., 2010, Orringer et al., 2012, Orringer et al., 2005, Starnes et al., 2012). Transforming growth factor-beta (TGF-β) is also stimulated after laser treatment to drive collagen synthesis (Helbig and Paasch, 2011, Orringer et al., 2004, Poon et al., 2015). Despite increasingly well-characterized mechanisms underlying the efficacy of laser resurfacing, few studies have examined the molecular events underlying differences in the timing of clinical response, which may influence patient adherence and outcomes during multi-session treatment regimens.
In this study, 17 participants with moderate to severe photodamage underwent six monthly non-ablative fractional laser (NAFL) treatments at the face and dorsal forearm. We performed clinical assessments and punch biopsies on the face and forearm for microarray analysis at various timepoints. We found a strong gene expression signature for immune response and double-stranded RNA (dsRNA) signaling after laser treatment across all participants. We also found that early clinical response to NAFL treatments may not solely be explained by differences in dermal matrix degradation, collagen synthesis, TGF-β signaling, dsRNA signaling, or retinoic acid synthesis, but may require the stimulation of lipid metabolism, including genes involved in epidermal barrier function.
RESULTS
Participant demographics and characteristics
We enrolled 17 white female participants (mean age [SD], 54.5 [5.9] years) with Fitzpatrick skin phototypes of I (3, 18%), II (9, 53%), or III (5, 29%) and scores of 5–7 on the 9-point Griffiths photoaging scale, suggestive of moderate to severe facial photodamage at baseline (Griffiths, 1992). One participant (#09) withdrew after the week-8 visit due to nonadherence to sun protection requirements. The remaining 16 participants completed all visits and procedures, including NAFL treatments of the face and dorsal forearm (monthly from baseline to week 20), clinical assessments (baseline, weeks 4, 8, 16, 24, and 44), and punch biopsies for microarray assays (baseline, days 1, 7, 14, and 29) (Figure 1a).
Figure 1. Study timeline and participant clinical response.
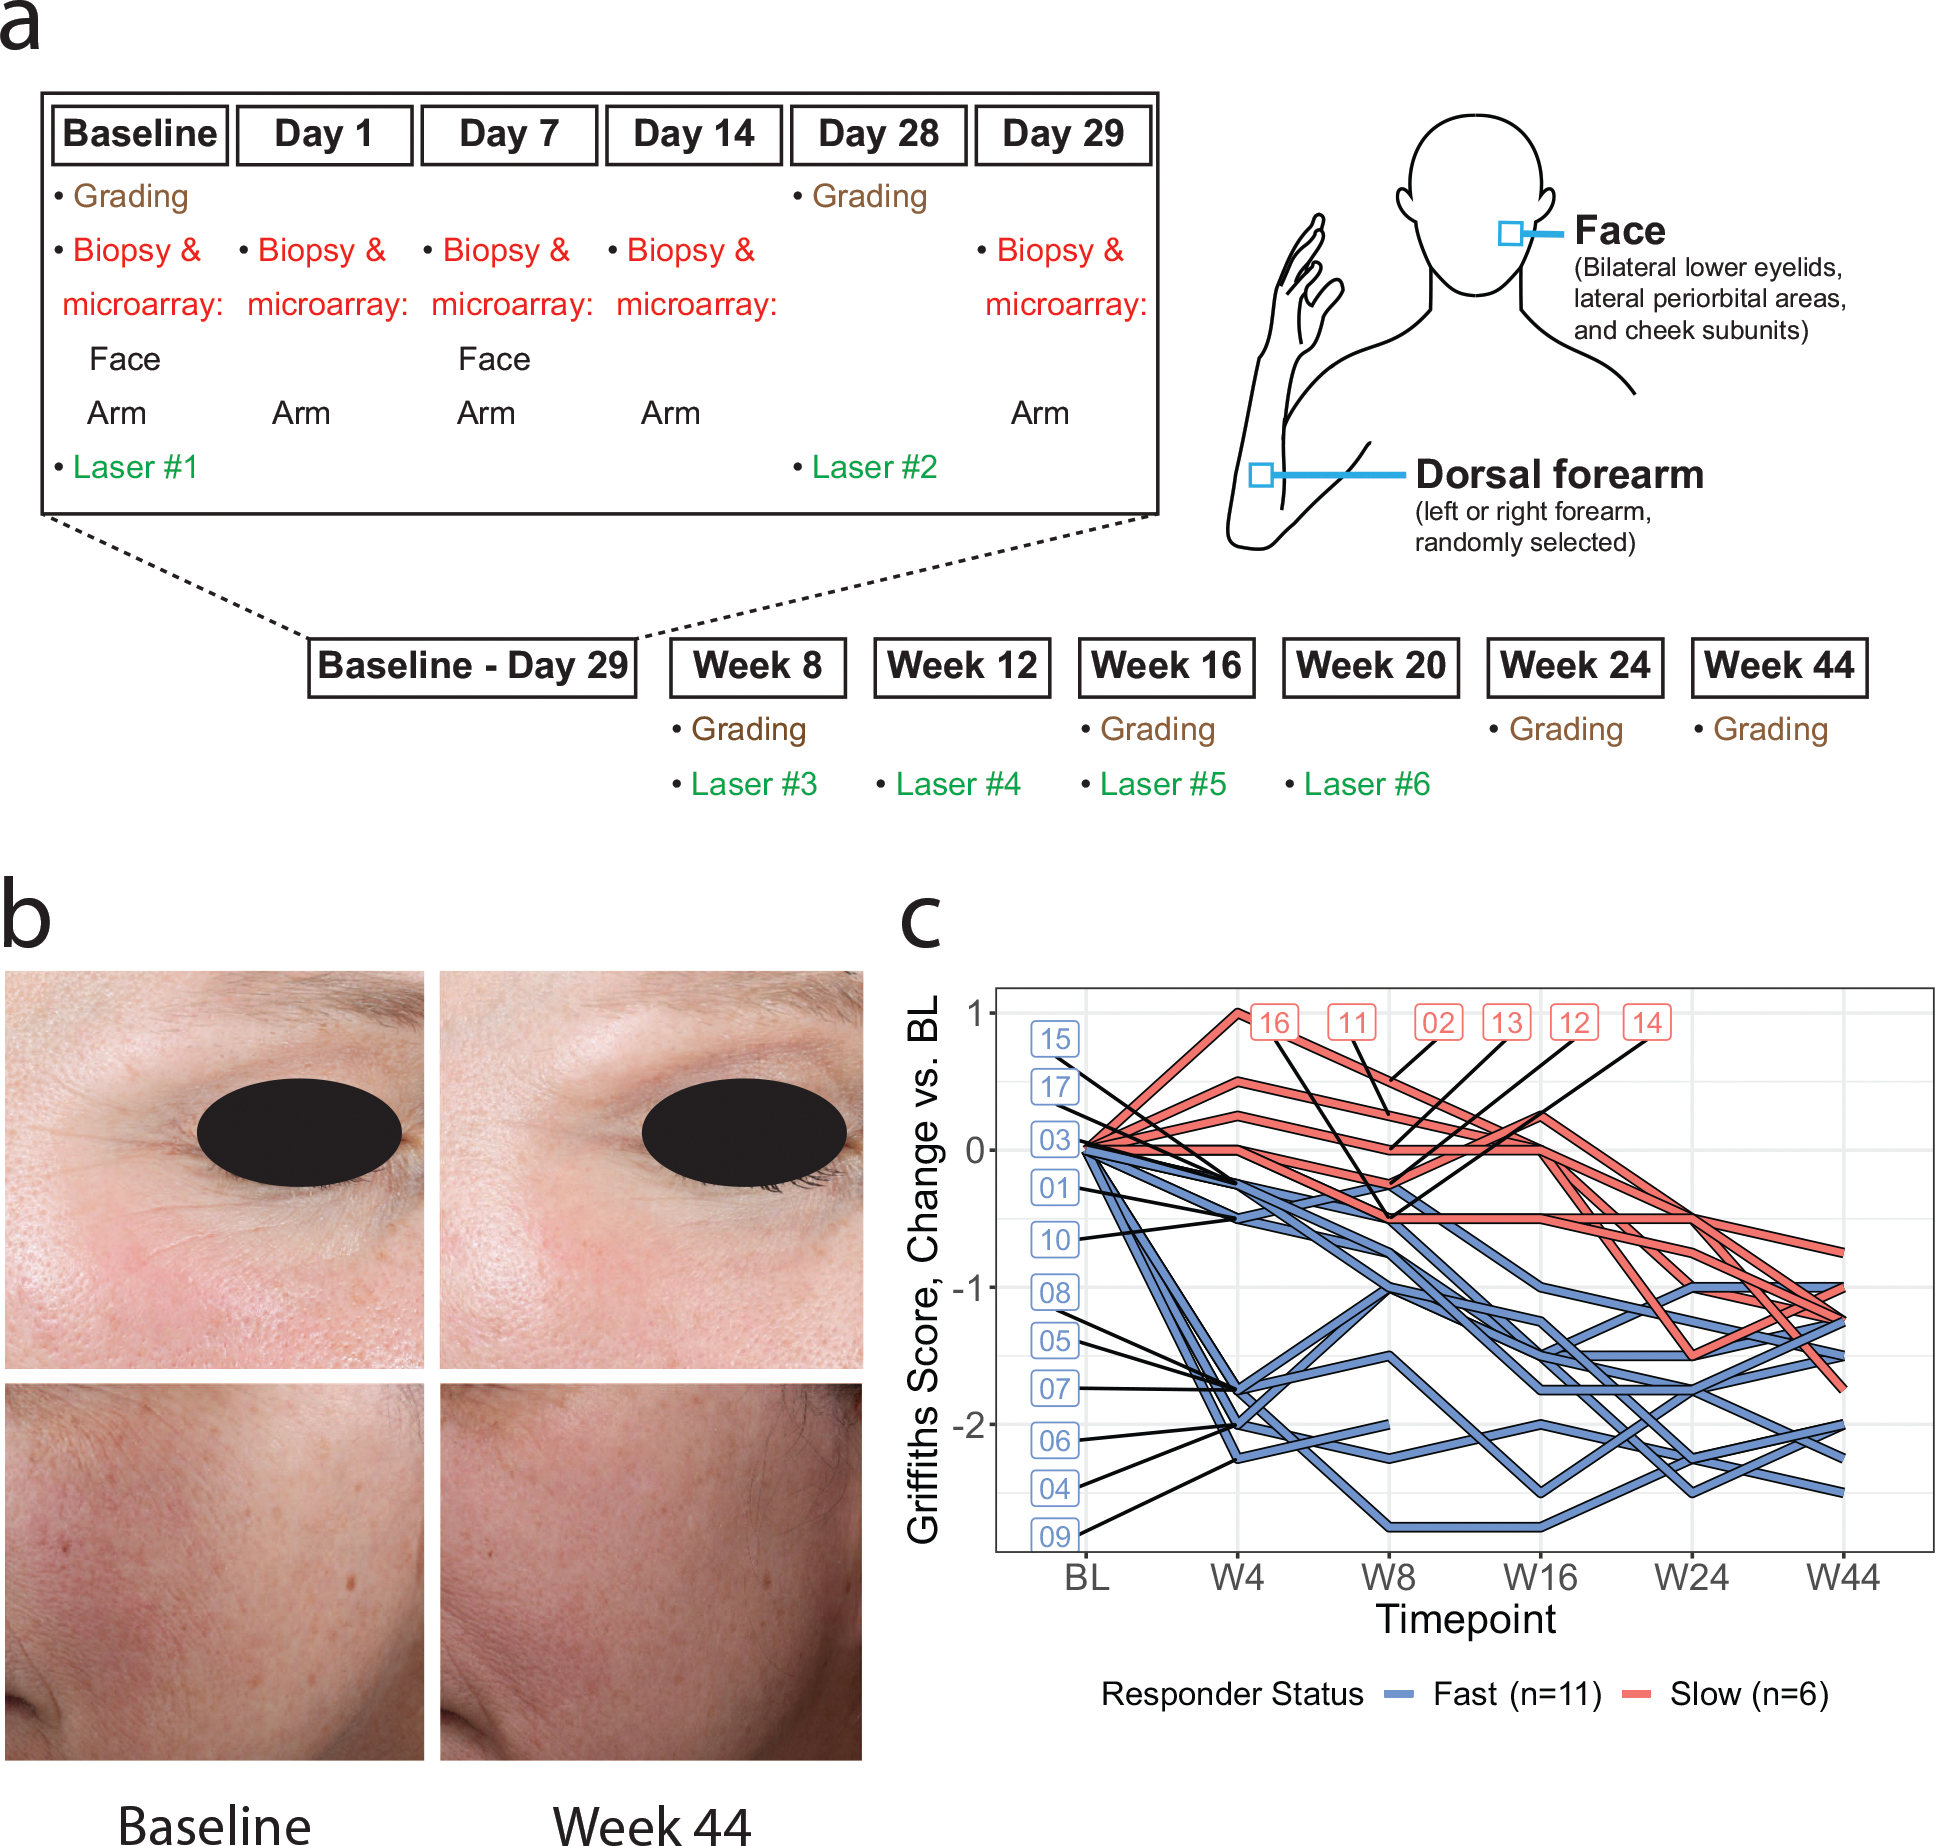
(a) Participants underwent 6 sessions of treatment with 1550 nm Er:Glass non-ablative fractional laser at monthly intervals; the face and dorsal forearm were treated during each session. Punch biopsies of the face were taken at baseline and 7 days after the first laser session, whereas punch biopsies of the arm were taken at baseline and 1, 7, 14, and 29 days after the first laser session (day 29 was also 1 day after the second laser session). Clinical grading was performed at baseline, week 4, week 8, week 16, week 24, and week 44. (b) Sample clinical photographs at baseline and at week 44 (6 months after last laser session) showing improvement in wrinkles and overall skin texture. (c) Change in Griffiths facial photoaging score for individual participants at various timepoints relative to baseline. Participants were labeled as fast responders (blue; n=11) if they experienced improvement after the first laser session (assessed at week 4). The remaining participants who experienced improvement later in the study were labeled as slow responders (red; n=6). Labels indicate participant identification number. Participant 09 withdrew from the study after the week-8 visit owing to difficulty adhering to sun protection requirements. BL, baseline; W4, week 4; W8, week 8; W16, week 16; W24, week 24; W44, week 44.
Clinically graded photoaging of the face and dorsal forearm improved after successive non-ablative fractional laser treatments
Linear mixed-effects models showed improvement in Griffiths facial photoaging scores across all participants, with increasingly pronounced improvement after successive treatments and 28.4% improvement relative to baseline at 6 months after the last treatment (Supplementary Table S1). Photodamage of the dorsal forearm, assessed with the 9-point McKenzie scale (Mckenzie et al., 2011), also showed increasing improvement over time with 20.4% improvement relative to baseline at 6 months after the last treatment (Supplementary Table S1). Similar trends were seen with facial wrinkles and mottled hyperpigmentation (grading scales in Supplementary Table S2, results in Supplementary Table S3, and sample photographs in Figure 1b).
A subset of participants exhibited a significantly more rapid and pronounced clinical response
Examination of changes in Griffiths score showed that some participants improved clinically after just one treatment (fast responders, n=11), whereas others required more treatments until clinical response was seen (slow responders, n=6) (Figure 1c). Compared to slow responders, fast responders did not differ significantly in age or skin type but had more severe facial and arm photoaging at baseline (by 1.5 and 1.7 points, respectively) (Supplementary Table S4). While fast responders experienced greater clinical improvement than slow responders at each timepoint up to week 24, the difference in improvement of Griffiths score between fast and slow responders diminished significantly by week 44 (6 months after the last treatment). A similar trend was seen for McKenzie scores, although the greater clinical improvement in fast responders relative to slow responders remained statistically significant at week 44 (Supplementary Table S5).
Clustering and enrichment analyses revealed a strong signature for immune responses after non-ablative fractional laser treatment across all participants
Log2 fold changes (Log2FC) of genes on day 7 relative to baseline at the face and dorsal forearm showed moderately strong correlation across all participants (Supplementary Figure S1), supporting the use of gene expression at the dorsal forearm as a surrogate for gene expression at the face. Hierarchical clustering of microarray data of the arm, at which biopsies were obtained at significantly more time points (baseline and 1, 7, 14, and 29 days after the first laser session; day 29 was also 1 day after the second laser session), revealed distinct profiles of change in gene expression across time (Figure 2a). Gene ontology over-representation analysis (ORA) of cluster 1 suggested continuously increasing stimulation of immune-related biological processes and molecular functions such as response to virus, positive regulation of immune response, and dsRNA binding from baseline to day 29 (Figure 2b, 2c and 2d). Cluster 3 involved the downregulation of genes associated with epidermis development and extracellular matrix structural constituent immediately following the first and second laser treatments (on days 1 and 29, respectively), whereas clusters 1 and 4 involved increasing expression of genes associated with collagen fibril organization especially at the later time points (Figure 2b, 2c and 2d)
Figure 2. Hierarchical clustering and over-representation analysis shows strong signature of immune activation and extracellular matrix remodeling after non-ablative fractional laser treatment across all participants.
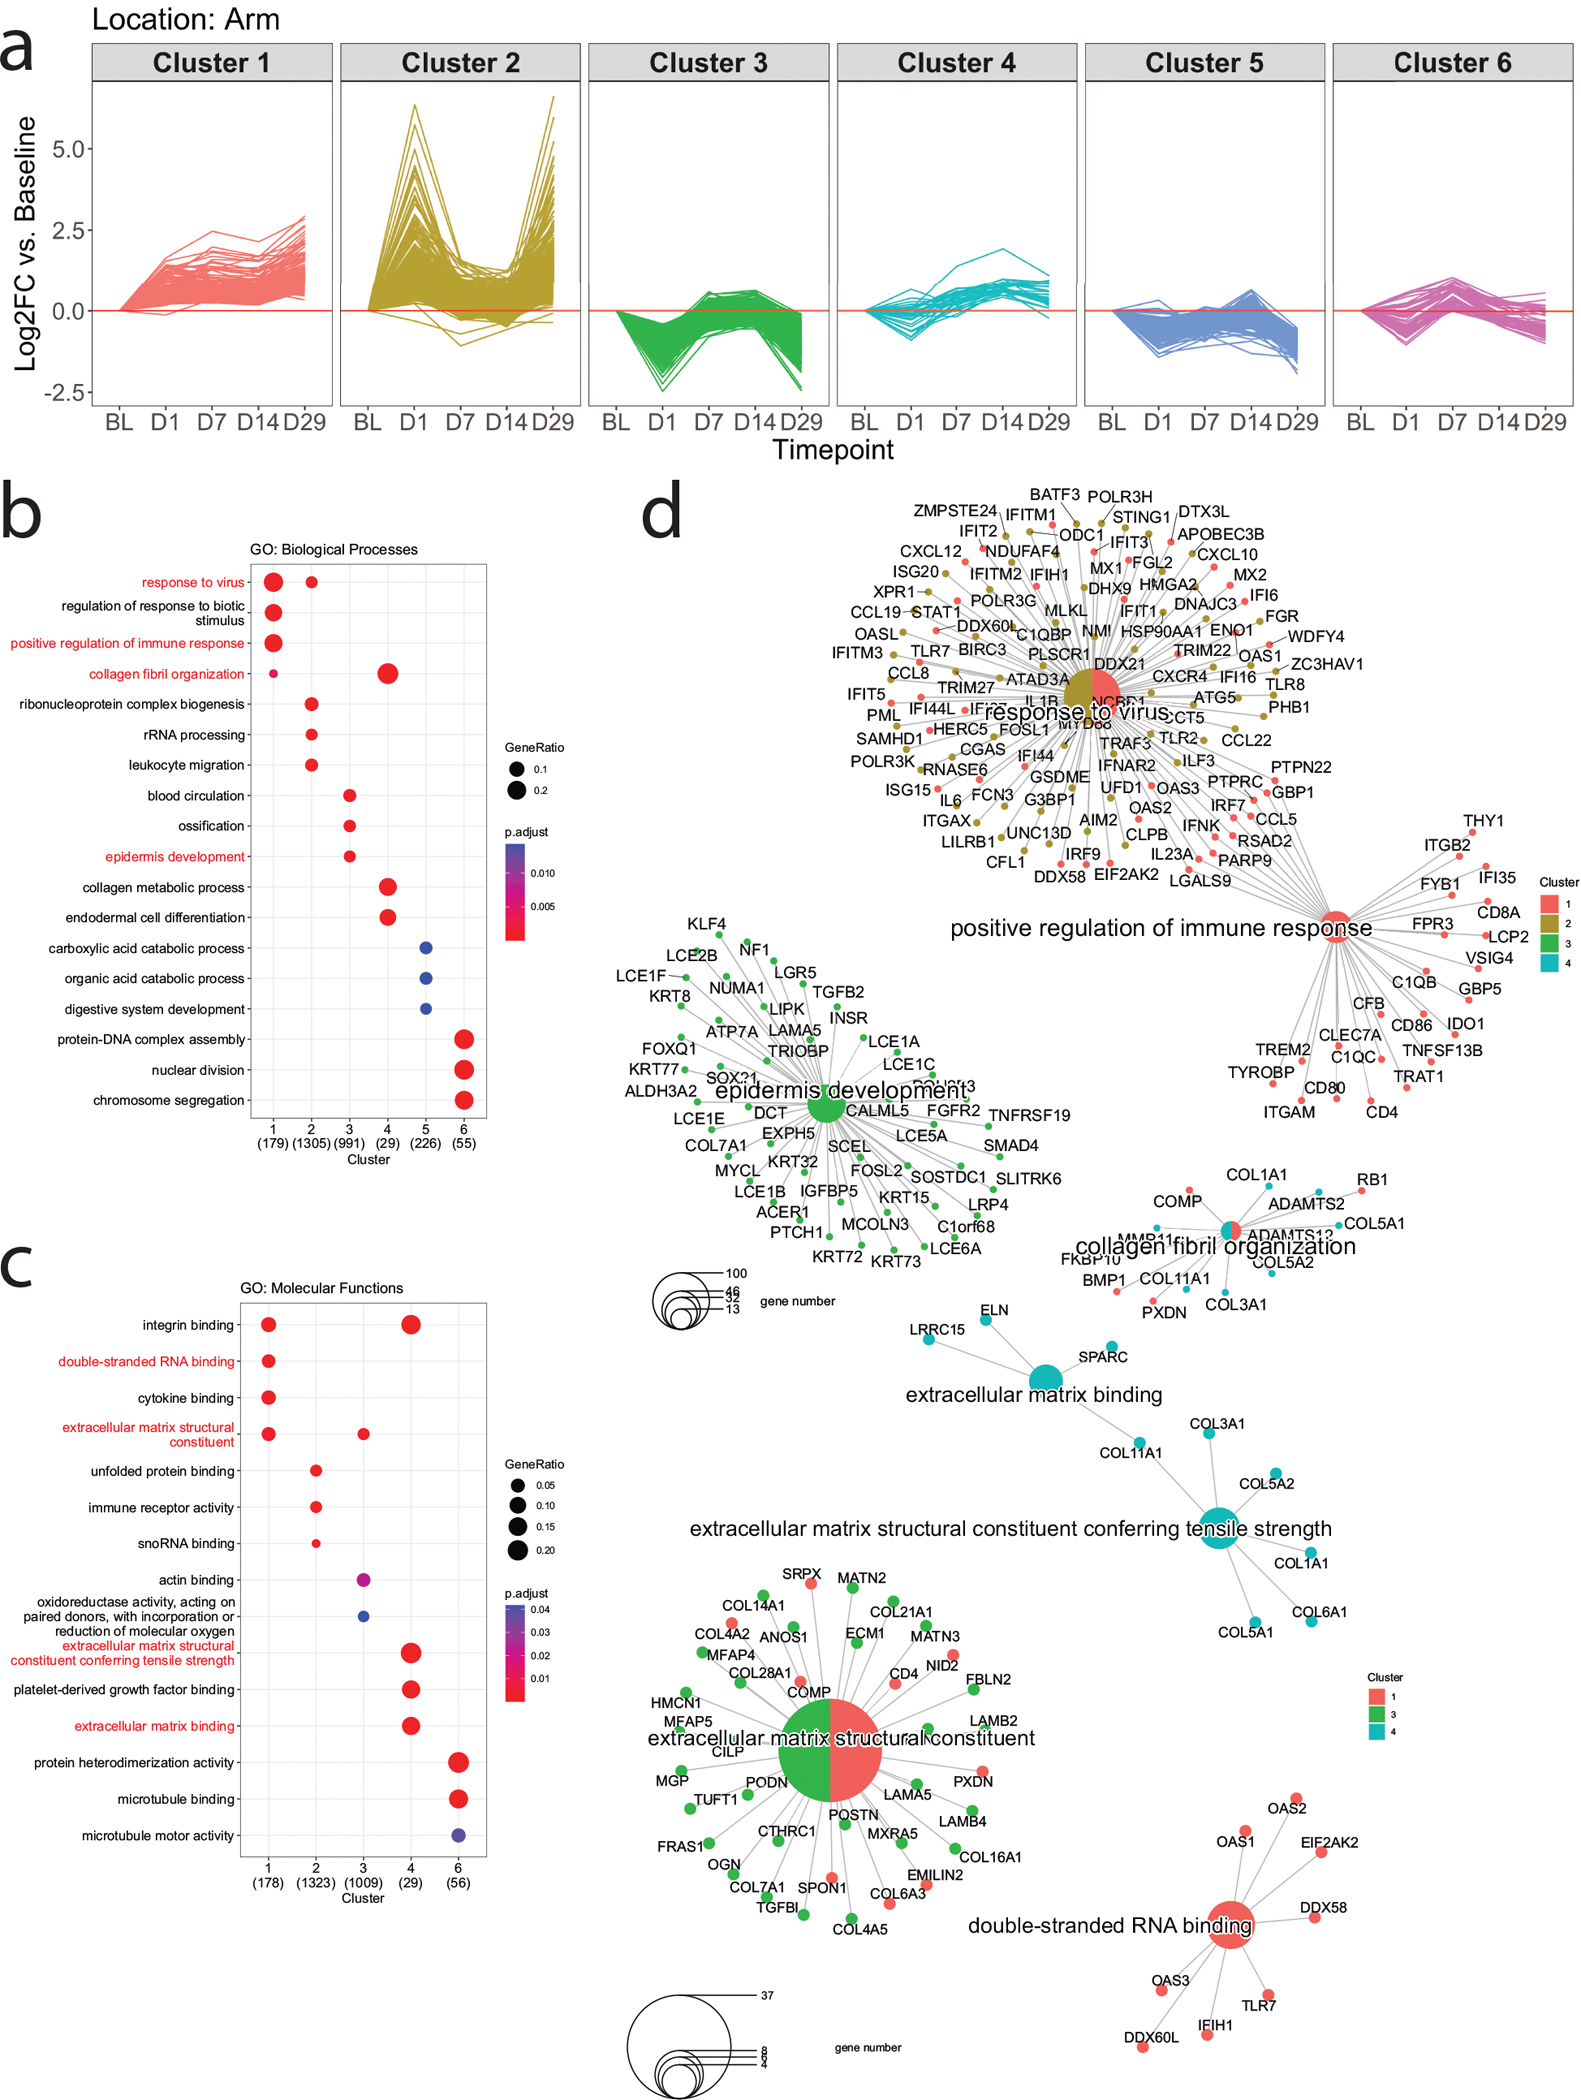
(a) Time series plots showing the Log2 fold change (Log2FC) of genes at each timepoint relative to baseline in the arm across all participants (n=17), stratified by clusters identified by hierarchical clustering using the Pearson correlation distance and Ward’s hierarchical agglomerative clustering method. Genes with absolute Log2FC > 0.585 (FC > 1.5) and P < 0.05 on at least one time point were included. (b) Biological processes and (c) molecular functions enriched in each cluster of genes based on gene ontology (GO) over-representation analysis (ORA). (d) Gene concept network illustrating individual genes belonging to selected GO terms. P values in ORA were calculated with Fisher’s exact test and adjusted for multiplicity using the Benjamini-Hochberg procedure. BL, baseline; D1, day 1; D7, day 7; D14, day 14; D29, day 29.
Gene expression changes were associated with matrix degradation, collagen and extracellular matrix synthesis, TGF-β signaling, dsRNA sensing, and retinoic acid synthesis
Based on the results of cluster analysis and previously characterized mechanisms of tissue remodeling after laser treatment, we examined temporal changes in the expression of specific genes related to degradation of the dermal matrix (MMP1, MMP3, MMP9, tissue inhibitor of metalloproteinase-1 [TIMP1]), regeneration of dermal components (collagens [COL1A1, COL1A2, COL3A1], elastin [ELN], fibrillins [FBN1, FBN2], fibronectin [FN1], cellular communication network factor 2 [CCN2]), and TGF-β signaling (TGFB1, TGFBR1, TGFBR2). Given the strong signature for dsRNA signaling across all participants (Figure 2c and 2d) and prior studies on the association between dsRNA signaling and retinoic acid synthesis (Kim et al., 2019), we also explored the temporal expression of 2′−5′-oligoadenylate synthetase (OAS) family proteins that sense dsRNA and aldehyde dehydrogenase 1 family member A3 (ALDH1A3) that synthesizes retinoic acid.
Across all participants, MMP1, MMP3, and MMP9 increased significantly on day 1 after the first laser session, decreased toward baseline levels on days 7 and 14, and increased again on day 29 (1 day after the second laser session). The expression of TIMP1, which inhibits MMPs, showed a similar temporal trend but with lower magnitude of fold changes (Figure 3). The expression of type I and III collagens (COL1A1, COL1A2, COL3A1) and ELN decreased on day 1 then recovered above baseline levels. On day 29 (1 day after the second laser session), mRNA levels of all three collagens decreased but remained higher than baseline levels; ELN expression also decreased but not to the same extent seen following the first laser session. Modest elevations in FBN1, FBN2, FN1, and CCN2 were seen towards the later timepoints. TGFB1, TGFBR1, TGFBR2, and ALDH1A3 were significantly upregulated 1 day after the first and second laser sessions. The expression of OAS1, OAS2, and OAS3 increased after the first laser session, remained elevated on days 7 and 14, and further increased on day 29 (1 day after the second laser session) (Figure 3). However, changes in the aforementioned genes did not differ significantly between fast and slow clinical responders (Supplementary Figure S2).
Figure 3. Distinct patterns of change in genes associated with matrix metalloproteinases (MMP), tissue inhibitors of metalloproteinases (TIMP), collagen, other extracellular matrix components, TGF-β signaling, dsRNA signaling, and retinoic acid synthesis across all participants.
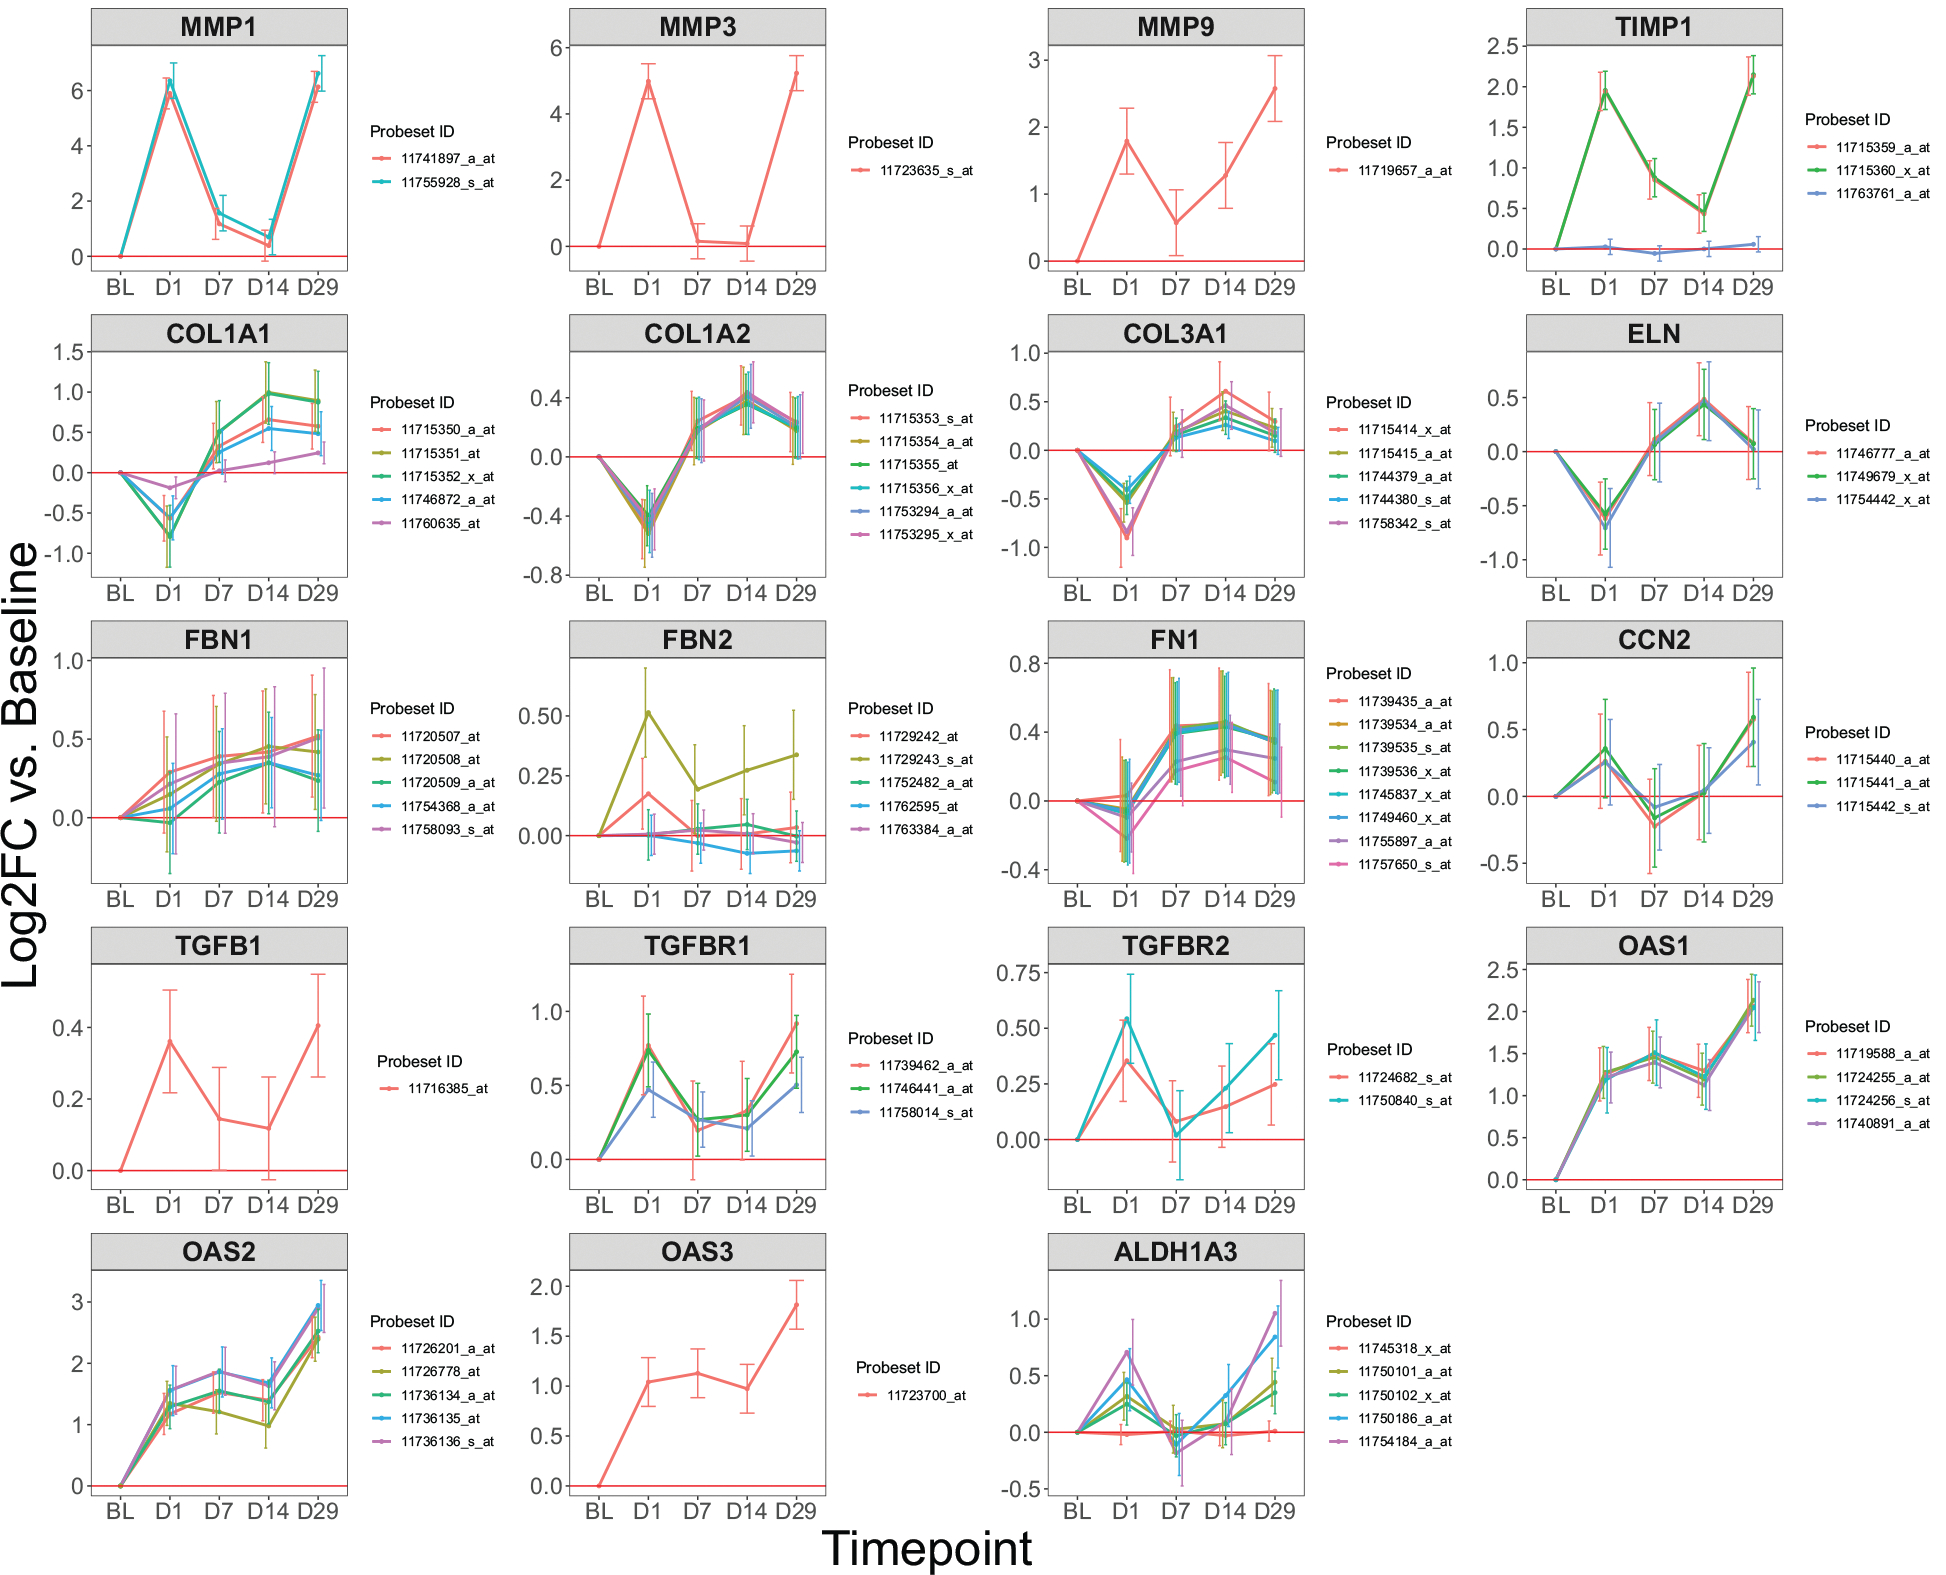
Time series plots show Log2 fold change (Log2FC) of individual Affymetrix probe sets and their corresponding genes at each timepoint relative to baseline in the arm across all participants (n=17). Error bars indicate the 95% confidence interval and were calculated from moderated t statistics, accounting for within-patient correlations. Error bars that do not cross zero indicate statistically significant difference relative to baseline (P<0.05). BL, baseline; D1, day 1; D7, day 7; D14, day 14; D29, day 29.
Discrepant responses to non-ablative fractional laser were associated with differences in lipid metabolism and keratinization
To explore other potential molecular mechanisms underlying the different clinical responses of fast and slow responders, we performed hierarchical clustering on the difference in Log2FC (i.e. difference-in-differences) of genes between fast and slow responders across all timepoints (Figure 4a). Gene ontology ORA of cluster 4, which had a clear bimodal pattern of relative gene upregulation on days 1 and 14 after laser treatment (Figure 4a), suggested greater activation of fatty acid metabolic process, keratinocyte differentiation, and acyltransferase activity in fast compared to slow responders (Figure 4b, 4c, and 4d)
Figure 4. Hierarchical clustering and over-representation analysis shows the enrichment of lipid metabolism processes in fast clinical responders.
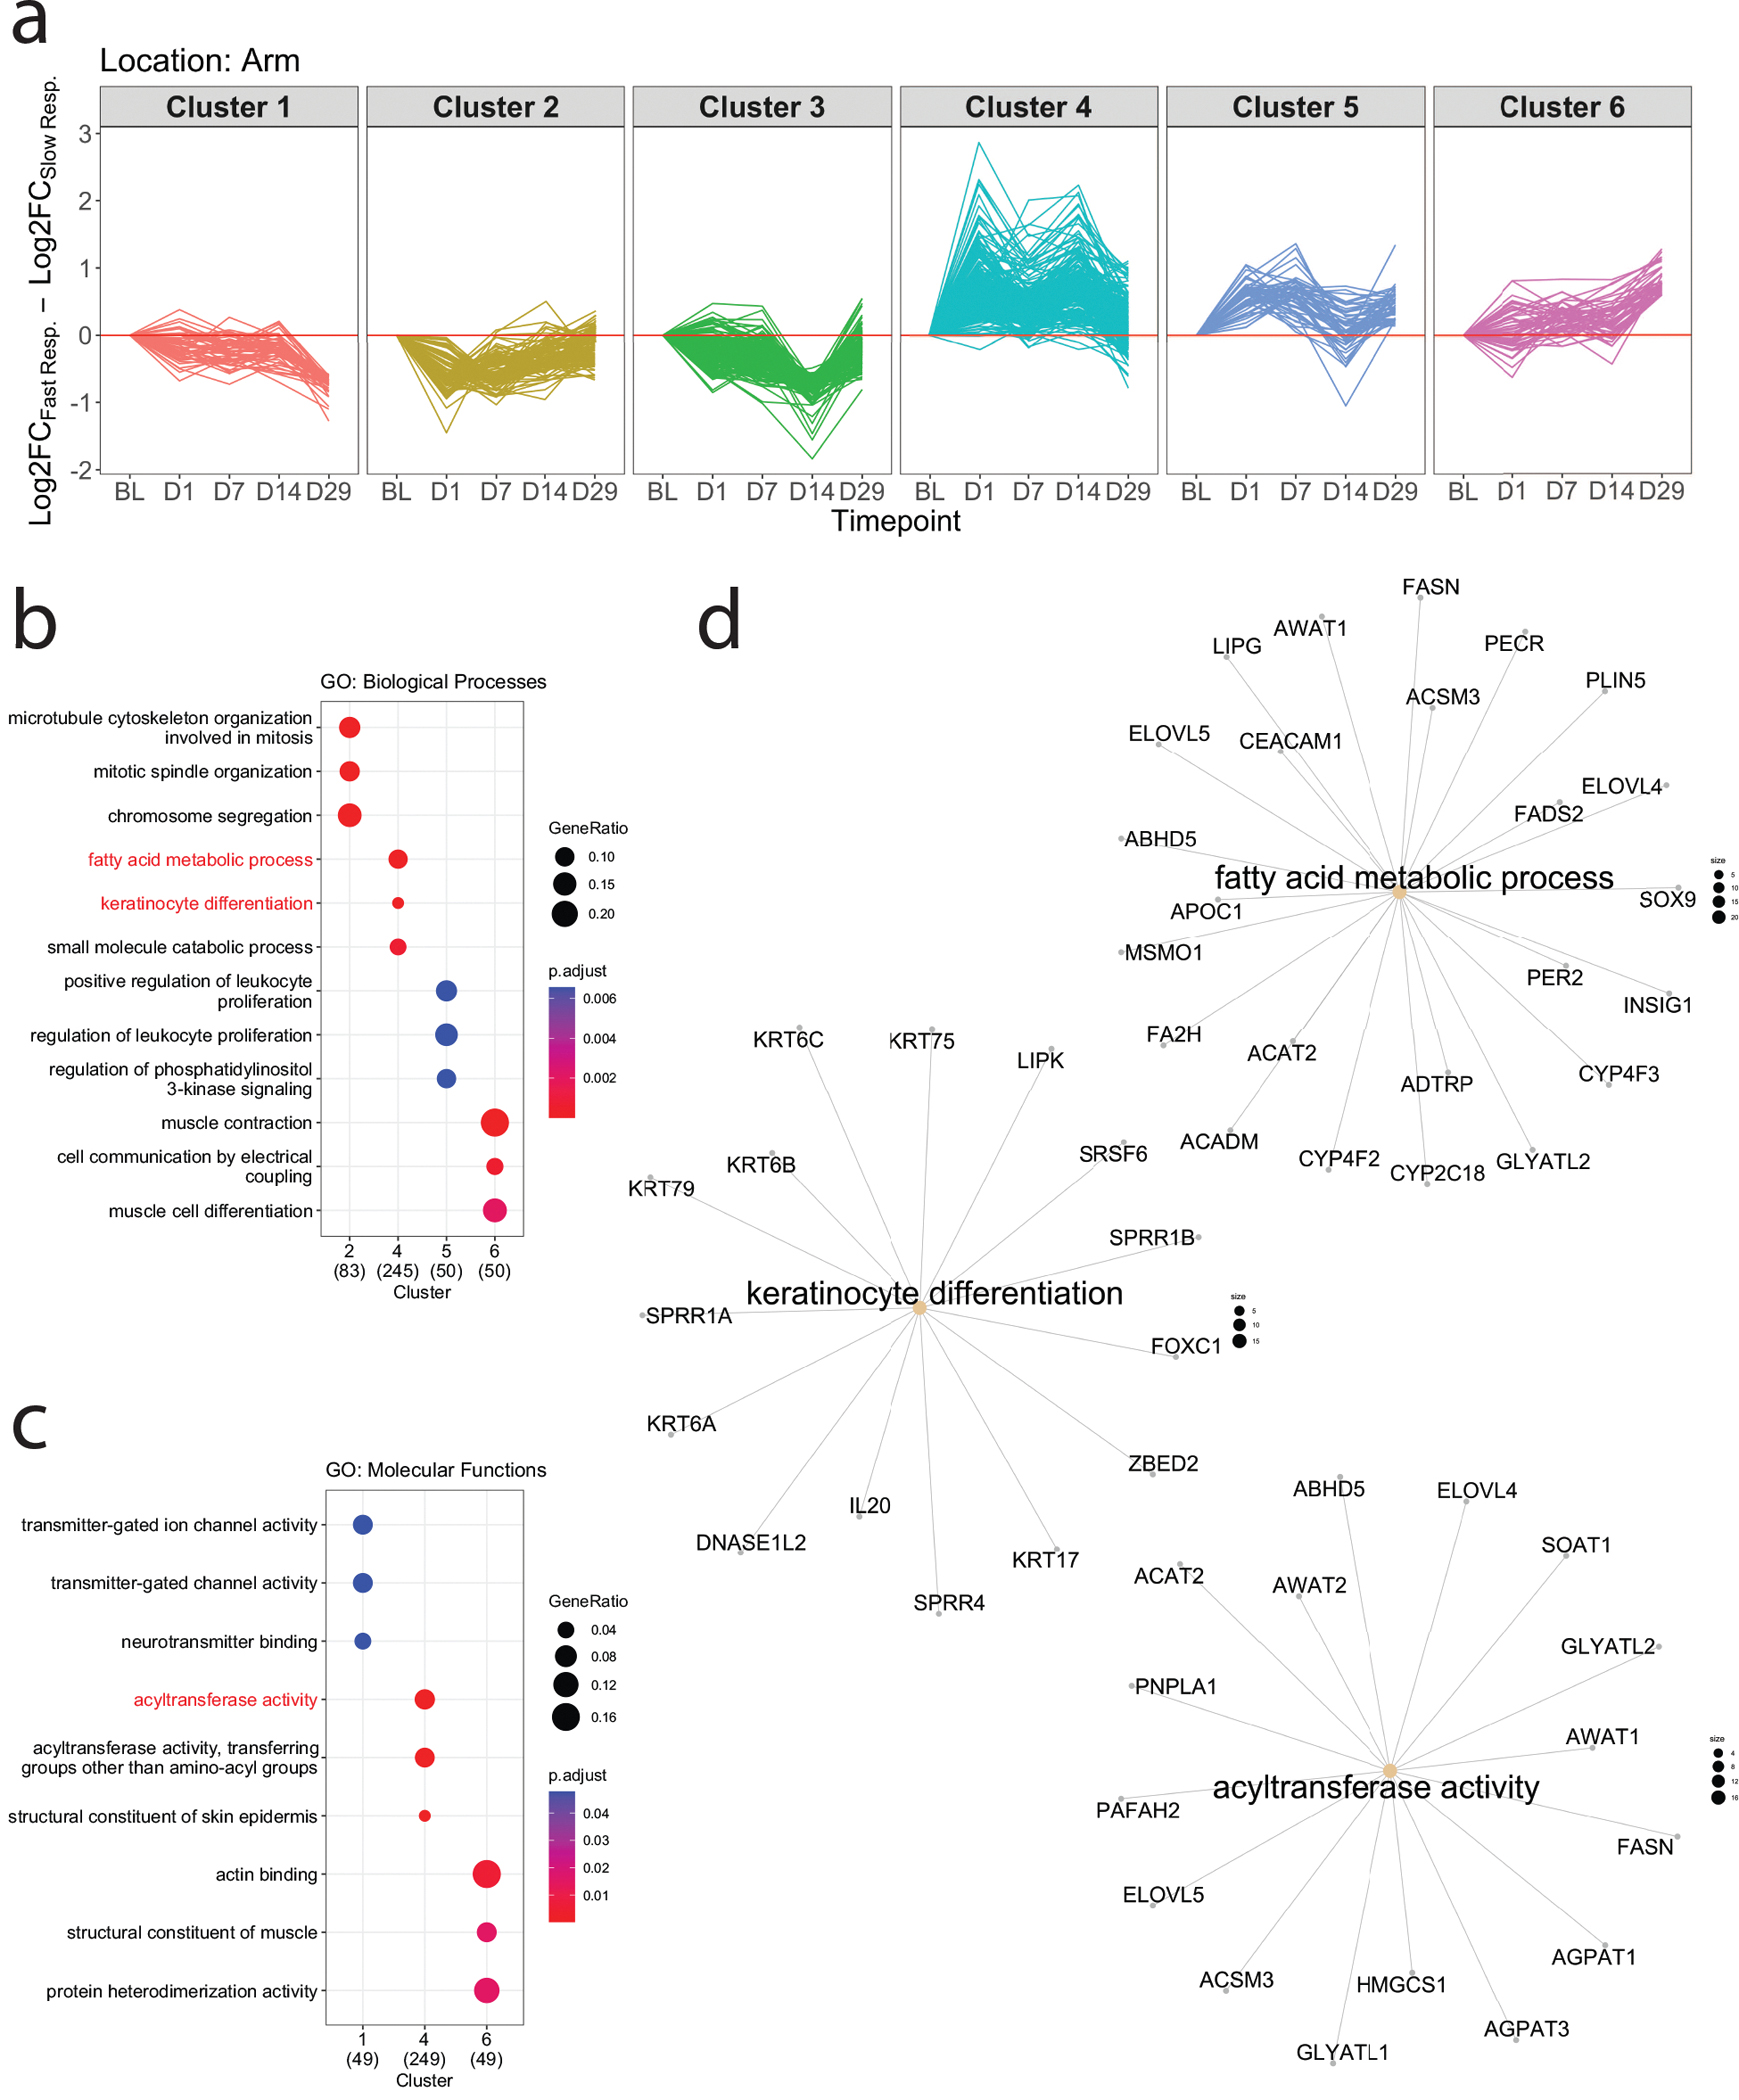
(a) Time series plots showing the difference in Log2 fold change (Log2FC) of genes between fast and slow clinical responders (i.e., difference-in-differences) at each timepoint relative to baseline in the arm across all participants (n=17), stratified by clusters identified by hierarchical clustering using the Pearson correlation distance and Ward’s hierarchical agglomerative clustering method. Genes with absolute Log2FC > 0.585 (FC > 1.5) and P < 0.05 on at least one time point were included. (b) Biological processes and (c) molecular functions enriched in each cluster of genes based on gene ontology (GO) over-representation analysis (ORA). (d) Gene concept network illustrating individual genes belonging to selected GO terms. P values in ORA were calculated with Fisher’s exact test and adjusted for multiplicity using the Benjamini-Hochberg procedure. BL, baseline; D1, day 1; D7, day 7; D14, day 14; D29, day 29.
Next, we performed gene set enrichment analysis (GSEA) using the Kyoto Encyclopedia of Genes and Genomes (KEGG) pathway database. Consistent with results of cluster analysis and ORA, we found significantly greater activation of pathways associated with lipid metabolism in fast responders, including peroxisome proliferator activated receptor (PPAR) signaling, peroxisome, glycerolipid metabolism, and fatty acid metabolism on days 1 and 14 after laser treatment (Figure 5a and 5b).
Figure 5. Gene set enrichment analysis shows differential activation of lipid metabolism in fast versus slow responders.
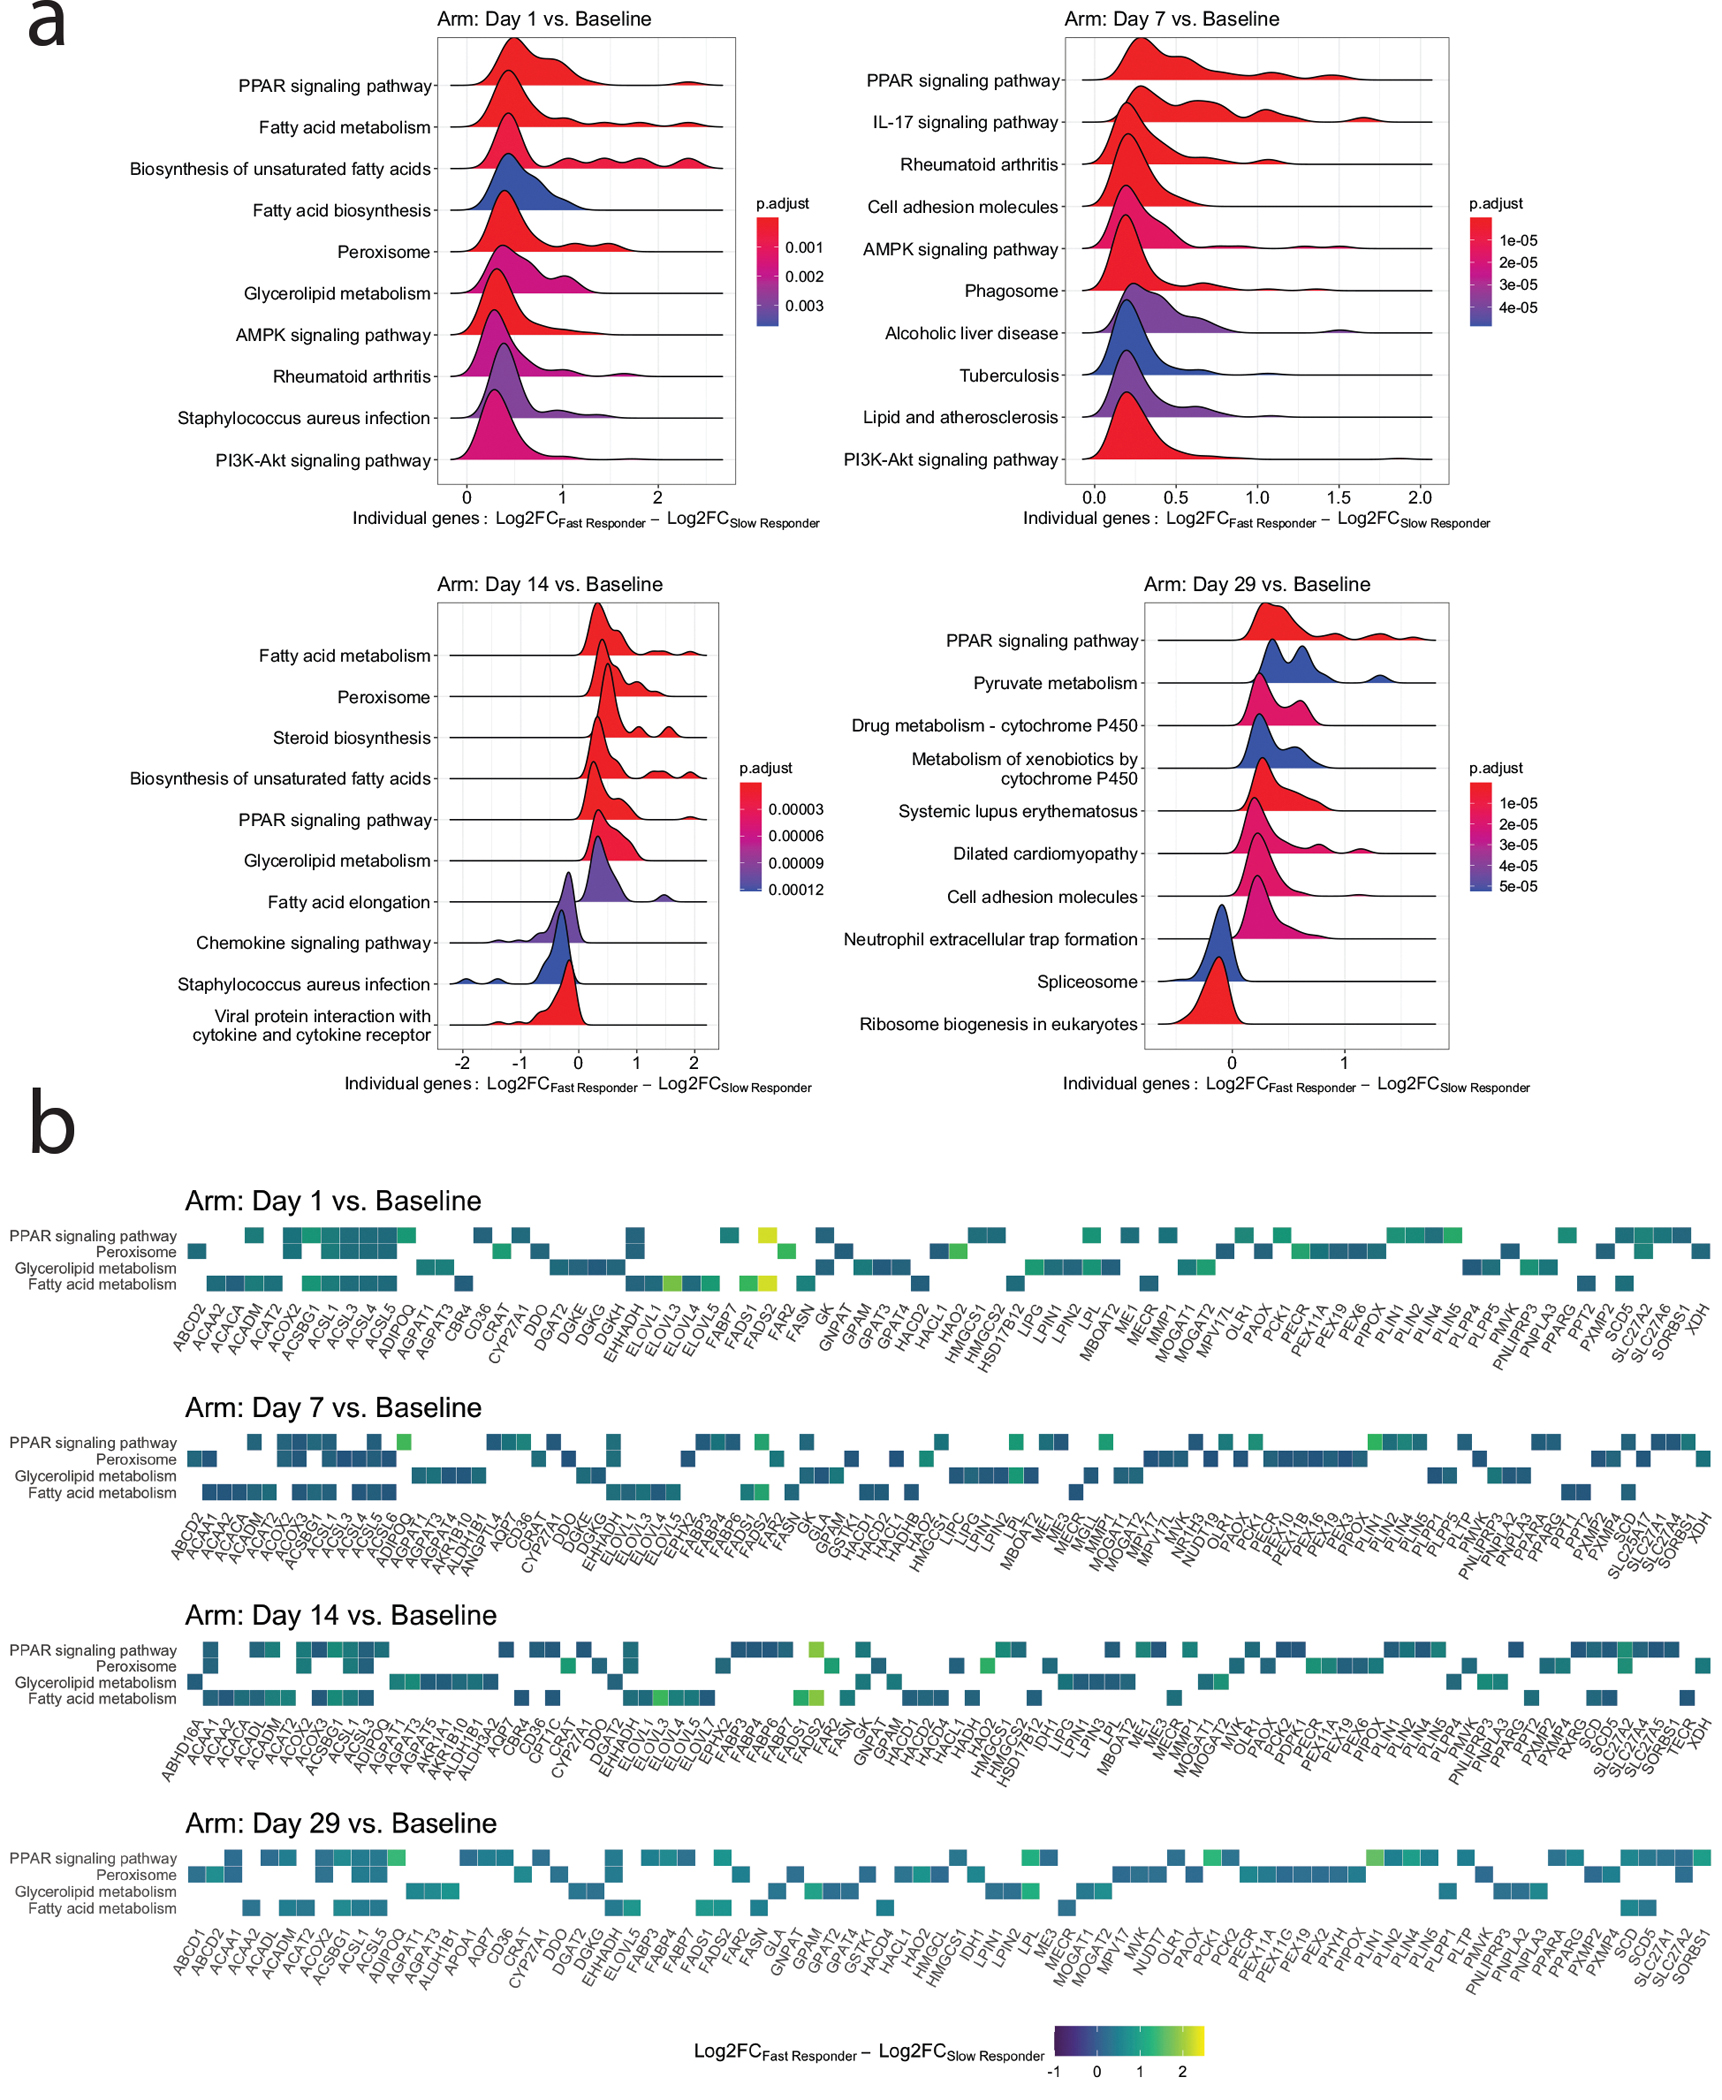
(a) Ridgeline plots showing significant pathways identified by gene set enrichment analysis (GSEA) of Kyoto Encyclopedia of Genes and Genomes (KEGG) database pathways. Density curves that peak above 0 suggest more positive Log2FC of genes in fast than in slow responders, and vice versa. (b) Heat plots showing individual genes of selected pathways (PPAR signaling, peroxisome, glycerolipid metabolism, and fatty acid metabolism) and their degree of upregulation in fast relative to slow responders after laser treatment.
Based on overlapping pathways and genes identified by cluster analysis, ORA, and GSEA (Figure 4d and 5b), the fold changes of lipid metabolism-related genes including acyltransferases (1-acyl-sn-glycerol-3-phosphate acyltransferases [AGPAT1, AGPAT3], acyl-coA wax alcohol acyltransferases [AWAT1 and AWAT2]), elongation of very long chain fatty acid 3 and 5 (ELOVL3, ELOVL5), fatty acid desaturases 1 and 2 (FADS1, FADS2), fatty acid 2-hydroxylase (FA2H), fatty acyl-CoA reductase 2 (FAR2), and hydroxyacid oxidase 2 (HAO2) were further examined. Despite no significant difference in the expression of these genes between fast and slow responders at baseline, fast responders showed statistically significantly greater upregulations in AGPAT1, AGPAT3, AWAT2, ELOVL5, FA2H, and FADS2 on day 1 after the first laser treatment (Table 1). AGPAT1, AGPAT3, AWAT1, and FA2H but not the other selected genes were also significantly upregulated in fast compared to slow responders on day 14 after the first laser treatment (Table 1). Similarly, expression levels of keratins KRT6A, KRT6B, KRT6C, KRT17, KRT75, and KRT79 did not differ significantly between fast and slow responders at baseline but were greater stimulated in fast compared to slow responders especially on day 14 after the first laser treatment (Supplementary Table S6).
Table 1.
Expression of selected lipid-metabolism genes in fast compared to slow clinical responders
| Gene Symbol | Affymetrix Probe Set ID | Log2FC: Fast vs. Slow Responders at BL [95% CI] | P | Log2FC: Fast Responders, D1 vs. BL [95% CI] | P | Log2FC: Slow Responders, D1 vs. BL [95% CI] | P | Δ Log2FC: Difference between Fast vs. Slow Responders, D1 vs. BL [95% CI] | P | Log2FC: Fast Responders, D14 vs. BL [95% CI] | P | Log2FC: Slow Responders, D14 vs. BL [95% CI] | P | Δ Log2FC: Difference between Fast vs. Slow Responders, D14 vs. BL [95% CI] | P |
|---|---|---|---|---|---|---|---|---|---|---|---|---|---|---|---|
|
| |||||||||||||||
| AGPAT1 | 11730933_a_at | −0.31 [−0.79 – 0.16] |
0.190 | 0.33 [−0.03 – 0.69] |
0.070 | −0.35 [−0.84 – 0.14] |
0.160 |
0.68
[0.07 – 1.29] |
0.028 | 0.18 [−0.18 – 0.54] |
0.334 | −0.43 [−0.92 – 0.06] |
0.082 |
0.61
[0.00 – 1.22] |
0.049 |
| 11750187_a_at | −0.23 [−0.72 – 0.25] |
0.341 | 0.28 [−0.08 – 0.65] |
0.130 | −0.18 [−0.68 – 0.32] |
0.487 | 0.46 [−0.16 – 1.08] |
0.145 | 0.36 [−0.01 – 0.73] |
0.056 | −0.20 [−0.70 – 0.30] |
0.438 | 0.56 [−0.06 – 1.18] |
0.078 | |
| 11750188_x_at | −0.31 [−0.80 – 0.18] |
0.214 | 0.29 [−0.09 – 0.67] |
0.129 | −0.33 [−0.84 – 0.18] |
0.205 | 0.62 [−0.01 – 1.25] |
0.056 | 0.35 [−0.03 – 0.73] |
0.068 | −0.37 [−0.88 – 0.14] |
0.158 |
0.72
[0.08 – 1.35] |
0.027 | |
| 11751668_a_at | −0.23 [−0.73 – 0.27] |
0.367 | 0.33 [−0.05 – 0.72] |
0.091 | −0.13 [−0.65 – 0.39] |
0.626 | 0.46 [−0.19 – 1.11] |
0.162 | 0.38 [−0.01 – 0.76] |
0.055 | −0.24 [−0.76 – 0.28] |
0.367 | 0.61 [−0.03 – 1.26] |
0.062 | |
|
| |||||||||||||||
| AGPAT3 | 11733822_at | −0.27 [−0.68 – 0.14] |
0.192 | 0.29 [−0.02 – 0.60] |
0.068 | −0.14 [−0.57 – 0.28] |
0.500 | 0.44 [−0.09 – 0.96] |
0.104 | 0.25 [−0.06 – 0.57] |
0.113 | −0.20 [−0.63 – 0.22] |
0.344 | 0.46 [−0.07 – 0.98] |
0.089 |
| 11733823_at | −0.18 [−0.70 – 0.33] |
0.488 | 0.32 [−0.07 – 0.71] |
0.110 | −0.11 [−0.64 – 0.42] |
0.689 | 0.43 [−0.23 – 1.09] |
0.204 | 0.38 [−0.01 – 0.77] |
0.059 | −0.17 [−0.70 – 0.36] |
0.526 | 0.55 [−0.11 – 1.21] |
0.103 | |
| 11733824_at | 0.00 [−0.42 – 0.41] |
0.993 | 0.10 [−0.22 – 0.42] |
0.541 | −0.12 [−0.55 – 0.31] |
0.580 | 0.22 [−0.32 – 0.75] |
0.419 | 0.11 [−0.21 – 0.42] |
0.513 | −0.11 [−0.54 – 0.32] |
0.618 | 0.21 [−0.32 – 0.75] |
0.430 | |
| 11746817_a_at | −0.30 [−0.66 – 0.06] |
0.102 |
0.33
[0.05 – 0.61] |
0.019 | −0.13 [−0.51 – 0.25] |
0.494 | 0.46 [0.00 – 0.93] |
0.052 | 0.21 [−0.06 – 0.49] |
0.129 | −0.17 [−0.54 – 0.21] |
0.377 | 0.38 [−0.08 – 0.85] |
0.107 | |
| 11753091_s_at | −0.36 [−0.86 – 0.14] |
0.157 | 0.31 [−0.07 – 0.69] |
0.109 | −0.35 [−0.86 – 0.17] |
0.187 |
0.66
[0.02 – 1.30] |
0.045 | 0.33 [−0.06 – 0.71] |
0.094 | −0.22 [−0.74 – 0.29] |
0.397 | 0.55 [−0.10 – 1.19] |
0.094 | |
| 11758597_s_at | −0.56 [−1.12 – 0.01] |
0.053 |
0.47
[0.04 – 0.90] |
0.034 | −0.23 [−0.81 – 0.36] |
0.443 | 0.70 [−0.03 – 1.42] |
0.060 | 0.32 [−0.11 – 0.75] |
0.140 | −0.52 [−1.11 – 0.06] |
0.078 |
0.85
[0.12 – 1.57] |
0.022 | |
| 11762437_x_at | −0.16 [−0.34 – 0.02] |
0.077 | 0.00 [−0.13 – 0.14] |
0.950 | −0.03 [−0.21 – 0.15] |
0.732 | 0.04 [−0.19 – 0.26] |
0.754 |
−0.16
[−0.30 – −0.03] |
0.019 | −0.14 [−0.33 – 0.04] |
0.122 | −0.02 [−0.25 – 0.21] |
0.872 | |
|
| |||||||||||||||
| AWAT1 | 11743222_at | −0.87 [−2.23 – 0.49] |
0.209 | 0.96 [−0.08 – 2.00] |
0.071 | −0.52 [−1.93 – 0.89] |
0.470 | 1.47 [−0.28 – 3.23] |
0.099 | 0.98 [−0.06 – 2.02] |
0.066 | −0.82 [−2.23 – 0.59] |
0.252 |
1.80
[0.04 – 3.55] |
0.045 |
|
| |||||||||||||||
| AWAT2 | 11733597_at | −1.07 [−2.78 – 0.65] |
0.220 |
1.50
[0.19 – 2.81] |
0.025 | −1.12 [−2.89 – 0.66] |
0.215 |
2.62
[0.42 – 4.82] |
0.020 | 0.91 [−0.39 – 2.22] |
0.169 | −0.75 [−2.53 – 1.02] |
0.402 | 1.67 [−0.54 – 3.87] |
0.137 |
| 11733598_at | −1.16 [−3.06 – 0.73] |
0.227 |
1.64
[0.19 – 3.09] |
0.027 | −1.23 [−3.18 – 0.73] |
0.218 |
2.86
[0.43 – 5.30] |
0.022 | 0.76 [−0.69 – 2.20] |
0.303 | −0.90 [−2.86 – 1.06] |
0.366 | 1.65 [−0.78 – 4.09] |
0.181 | |
|
| |||||||||||||||
| ELOVL3 | 11733300_at | −0.38 [−1.85 – 1.10] |
0.614 | 0.99 [−0.14 – 2.12] |
0.086 | −0.82 [−2.35 – 0.71] |
0.289 | 1.81 [−0.09 – 3.71] |
0.062 | 0.84 [−0.29 – 1.97] |
0.143 | −0.63 [−2.16 – 0.90] |
0.415 | 1.47 [−0.43 – 3.37] |
0.128 |
|
| |||||||||||||||
| ELOVL5 | 11716078_a_at | −0.55 [−1.30 – 0.20] |
0.149 |
0.83
[0.26 – 1.40] |
0.005 | −0.23 [−1.00 – 0.55] |
0.563 |
1.06
[0.10 – 2.02] |
0.032 | 0.52 [−0.05 – 1.10] |
0.072 | −0.12 [−0.89 – 0.65] |
0.759 | 0.64 [−0.32 – 1.61] |
0.188 |
| 11757300_s_at | −0.39 [−0.94 – 0.15] |
0.157 |
0.56
[0.15 – 0.98] |
0.009 | −0.25 [−0.81 – 0.32] |
0.393 |
0.81
[0.10 – 1.51] |
0.025 | 0.40 [−0.02 – 0.82] |
0.063 | −0.10 [−0.67 – 0.46] |
0.716 | 0.50 [−0.20 – 1.21] |
0.162 | |
|
| |||||||||||||||
| FA2H | 11724063_s_at | −0.96 [−1.95 – 0.04] |
0.060 | 0.74 [−0.02 – 1.50] |
0.056 |
−1.18
[−2.21 – −0.15] |
0.025 |
1.92
[0.64 – 3.20] |
0.004 | 0.44 [−0.32 – 1.20] |
0.251 | −0.87 [−1.90 – 0.16] |
0.098 |
1.31
[0.03 – 2.59] |
0.045 |
| 11749576_a_at | −0.12 [−0.51 – 0.26] |
0.527 | 0.03 [−0.26 – 0.33] |
0.826 | −0.08 [−0.48 – 0.32] |
0.683 | 0.12 [−0.38 – 0.61] |
0.647 | −0.03 [−0.32 – 0.27] |
0.858 | −0.15 [−0.55 – 0.25] |
0.448 | 0.13 [−0.37 – 0.62] |
0.614 | |
| 11757685_a_at | −0.89 [−1.81 – 0.04] |
0.060 | 0.65 [−0.06 – 1.36] |
0.072 | −0.95 [−1.91 – 0.01] |
0.052 |
1.60
[0.41 – 2.79] |
0.009 | 0.47 [−0.24 – 1.18] |
0.191 | −0.72 [−1.68 – 0.24] |
0.139 | 1.19 [0.00 – 2.38] |
0.050 | |
|
| |||||||||||||||
| FADS1 | 11745459_a_at | −0.57 [−1.78 – 0.64] |
0.351 |
0.97
[0.05 – 1.89] |
0.040 | −0.37 [−1.62 – 0.88] |
0.556 | 1.34 [−0.21 – 2.89] |
0.090 |
0.94
[0.01 – 1.86] |
0.047 | −0.33 [−1.58 – 0.92] |
0.600 | 1.27 [−0.28 – 2.82] |
0.108 |
| 11752670_a_at | −0.57 [−1.79 – 0.65] |
0.359 |
1.01
[0.08 – 1.95] |
0.034 | −0.42 [−1.69 – 0.84] |
0.507 | 1.44 [−0.13 – 3.01] |
0.073 | 0.91 [−0.02 – 1.84] |
0.055 | −0.29 [−1.55 – 0.97] |
0.649 | 1.20 [−0.37 – 2.77] |
0.132 | |
| 11755251_x_at | −0.47 [−1.65 – 0.71] |
0.433 | 0.86 [−0.04 – 1.76] |
0.061 | −0.36 [−1.58 – 0.87] |
0.564 | 1.22 [−0.30 – 2.74] |
0.115 | 0.85 [−0.06 – 1.75] |
0.065 | −0.34 [−1.56 – 0.88] |
0.583 | 1.19 [−0.33 – 2.71] |
0.124 | |
|
| |||||||||||||||
| FADS2 | 11744899_a_at | −1.07 [−2.84 – 0.71] |
0.236 |
1.43
[0.08 – 2.79] |
0.039 | −0.88 [−2.72 – 0.95] |
0.343 |
2.31
[0.03 – 4.60] |
0.047 | 1.22 [−0.13 – 2.58] |
0.077 | −0.70 [−2.54 – 1.13] |
0.451 | 1.92 [−0.36 – 4.20] |
0.098 |
| 11744900_x_at | −0.73 [−2.11 – 0.64] |
0.292 |
1.06
[0.01 – 2.11] |
0.048 | −0.74 [−2.16 – 0.68] |
0.305 |
1.80
[0.03 – 3.56] |
0.046 | 0.94 [−0.11 – 1.99] |
0.078 | −0.46 [−1.88 – 0.96] |
0.522 | 1.40 [−0.36 – 3.17] |
0.118 | |
| 11744902_a_at | −0.92 [−2.70 – 0.86] |
0.307 |
1.48
[0.12 – 2.84] |
0.033 | −0.78 [−2.62 – 1.06] |
0.403 | 2.26 [−0.03 – 4.54] |
0.053 | 1.19 [−0.17 – 2.55] |
0.085 | −0.46 [−2.30 – 1.38] |
0.619 | 1.66 [−0.63 – 3.94] |
0.154 | |
| 11754939_x_at | −0.79 [−2.32 – 0.74] |
0.306 |
1.18
[0.01 – 2.35] |
0.048 | −0.83 [−2.41 – 0.75] |
0.301 |
2.01
[0.04 – 3.97] |
0.046 | 1.04 [−0.13 – 2.20] |
0.082 | −0.49 [−2.07 – 1.09] |
0.542 | 1.52 [−0.44 – 3.49] |
0.128 | |
|
| |||||||||||||||
| FAR2 | 11755235_a_at | −0.33 [−1.07 – 0.41] |
0.377 | 0.36 [−0.21 – 0.92] |
0.213 | −0.42 [−1.18 – 0.34] |
0.278 | 0.77 [−0.17 – 1.72] |
0.108 | 0.35 [−0.21 – 0.91] |
0.224 | −0.33 [−1.09 – 0.43] |
0.398 | 0.67 [−0.27 – 1.62] |
0.161 |
| 11758994_at | −0.36 [−1.49 – 0.77] |
0.532 |
0.92
[0.06 – 1.79] |
0.036 | −0.53 [−1.69 – 0.64] |
0.376 | 1.45 [0.00 – 2.90] |
0.051 | 0.73 [−0.14 – 1.59] |
0.099 | −0.37 [−1.54 – 0.80] |
0.530 | 1.10 [−0.36 – 2.55] |
0.138 | |
|
| |||||||||||||||
| HAO2 | 11727665_a_at | −0.50 [−1.68 – 0.69] |
0.408 | 0.76 [−0.14 – 1.67] |
0.097 | −0.68 [−1.90 – 0.54] |
0.273 | 1.44 [−0.08 – 2.96] |
0.063 | 0.55 [−0.35 – 1.45] |
0.232 | −0.53 [−1.75 – 0.69] |
0.389 | 1.08 [−0.44 – 2.60] |
0.161 |
| 11741521_a_at | −0.48 [−1.67 – 0.70] |
0.421 | 0.84 [−0.06 – 1.75] |
0.069 | −0.68 [−1.91 – 0.55] |
0.278 | 1.52 [−0.01 – 3.05] |
0.051 | 0.71 [−0.20 – 1.62] |
0.124 | −0.62 [−1.85 – 0.61] |
0.318 | 1.33 [−0.19 – 2.86] |
0.087 | |
P values were calculated by moderated t-statistic. Bold font indicates statistical significance. Green shading indicates significant difference in fold change relative to baseline between fast and slow responders. BL, baseline; D1, day 1; D7, day 7; D14, day 14.
DISCUSSION
In this study, we showed the clinical efficacy of NAFL for treating photoaged skin. We also explored temporal changes in gene expression in vivo with microarray studies across all participants and within clinically defined subgroups of fast and slow responders. With 119 number of total microarrays assessed, this study is one of the largest to provide a novel molecular atlas of facial rejuvenation after laser therapy.
Compared to prior investigations, our microarray studies showed a similar timeline in the induction of MMPs and collagen after fractional laser resurfacing (Orringer et al., 2010, Orringer et al., 2012, Starnes et al., 2012). Elevations in TGFB1, TGBBR1, and TGFBR2 after each treatment in this study also suggested increased TGF-β signaling that likely contributed to neocollagenesis (Poon et al., 2015). Few studies have examined molecular changes following successive laser sessions, and our finding that type I and III collagen decreased below baseline levels after the first but not the second laser treatment shows the accumulation of treatment effects across multiple laser sessions.
Prior studies showed significant immune responses in the skin after laser treatment, including elevations in IL-8 (Orringer et al., 2012) and neutrophilic infiltration (Orringer et al., 2010, Starnes et al., 2012). Elevations in IL-1β, TNF-α, and TGF-β have also been observed (Orringer et al., 2004, Orringer et al., 2010, Orringer et al., 2012, Orringer et al., 2005) and contribute to the induction of MMPs necessary for degrading photodamaged collagen (Varani et al., 2001, Yan and Boyd, 2007). Consistent with these findings, ORA analysis of clustered microarray data in this study suggested strong immune responses to microthermal wounding.
Although dsRNA sensing is usually associated with antiviral responses, we previously found that dsRNA is released by damaged tissue and contributes to skin and hair regeneration in mice after cutaneous wounding through the activation of TLR3 (Nelson et al., 2015). dsRNA also stimulates retinoic acid synthesis in mice after cutaneous wounding and in human scalp after fractional ablative CO2 laser treatment (Kim et al., 2019). In this study, activation of dsRNA signaling was seen after laser treatment and reflected in the significant upregulation of dsRNA-sensing OAS proteins. Consistent with our previous finding that dsRNA increases retinoic acid synthesis by upregulating ALDH1A3 (Kim et al., 2019), ALDH1A3 was significantly upregulated after the first laser treatment and to a greater extent after the second laser treatment in this study, implying increased endogenous retinoic acid synthesis in the context of laser resurfacing. Retinoids are well-established for treating photoaging (Griffiths et al., 1993, Kafi et al., 2007, Riahi et al., 2016, Stratigos and Katsambas, 2005), and our results provide further support for a link between wound-induced dsRNA sensing, retinoic acid synthesis, and skin rejuvenation.
Another goal of this study was to examine molecular responses underlying differences in clinical response to NAFL treatment. Contrary to our expectations, we found that the induction of genes related to dermal matrix degradation (MMP1, MMP3, MMP9, TIMP1), extracellular matrix synthesis (COL1A1, COL1A2, COL3A1, ELN, FBN1, FBN2, FN1, CCN2), TGF-β signaling (TGFB1, TGFBR1, TGFBR2), retinoic acid synthesis (ALDH1A3), and dsRNA signaling (OAS1, OAS2, OAS3) occurred across all participants but was not statistically different between fast and slow responders. Instead, we identified greater activation of lipid metabolism in fast responders, driven by genes such as AGPAT1, AGPAT3, ELOVL5, AWAT2, FA2H, and FADS2. While the former set of genes might be required for final clinical improvement, lipid metabolism genes appear to have a unique role in early response to photo-rejuvenation and are comparatively understudied.
AGPAT1 and AGPAT3 catalyze the formation of glycerolipids that help restore the skin permeability barrier upon its disruption (Lu et al., 2005). Similarly, FA2H promotes the synthesis of 2-hydroxylated ceramides to strengthen epidermal barrier function (Hama, 2010, Uchida et al., 2007). AWAT2, a member of the diacylglycerol acyltransferase family, is highly expressed in sebaceous glands and responsible for the synthesis of wax esters, which decrease with aging and are directly correlated with skin hydration (Pappas et al., 2013, Turkish et al., 2005, Zouboulis and Boschnakow, 2001). Although the significance of ELOVL5 in barrier function is unknown, skin permeability defects have been observed with the disruption of other ELOVL genes such as ELOVL3 and ELOVL4 (Uchida, 2011, Westerberg et al., 2004). Cho et al. previously found downregulation of FADS1, FADS2, ELOVL3, FAR2, and HAO2 in photoaged skin (Cho et al., 2018), and the greater upregulations in these genes in fast compared to slow responders (though only statistically significant for FADS2 and approaching statistical significance for others; Table 1) may suggest enhanced reversal of lipid metabolism-associated derangements in photoaged skin among fast responders.
Fast responders in this study showed greater upregulation of KRT6 and KRT17, a sign of keratinocyte proliferation during wound healing (Moll et al., 2008, Zhang et al., 2019). KRT17 has also been shown recently to contribute to both lipid synthesis and restoration of epidermal barrier function in mice following skin injury (Pang et al., 2021), which coincide with the genetic profile that we observed among fast responders after NAFL treatment. Dryness is a characteristic of aged skin (Huang and Chien, 2020), and it would be important to clarify in future studies the extent to which laser resurfacing may modulate lipid metabolism to mitigate transcutaneous water loss and induce skin barrier regeneration.
The lack of statistical difference between fast and slow responders for many of the individual genes examined (e.g., in Supplementary Figure S2) may reflect a true lack of difference in means, but our study may have been underpowered due to small number of participants. Although we examined mRNA expression using microarrays without corroboration with RT-PCR, changes in the expression of genes related to MMPs, collagens, other extracellular matrix components, TGF-β signaling, and retinoic acid synthesis were consistent with those in prior RT-PCR–based studies (Kim et al., 2019, Orringer et al., 2004, Orringer et al., 2012, Orringer et al., 2005). The collection of multiple biologic replicates (119 in total) and presence of multiple distinct probe sets for genes in the microarray platform (Affymetrix PrimeView) also increases the confidence and validity of observations when probe sets for a given gene exhibit parallel changes across participants and time (e.g., genes in Figure 3). We did not examine protein levels, and though prior studies have found consistency between mRNA and protein levels of MMPs and collagens (Orringer et al., 2004, Orringer et al., 2010, Orringer et al., 2012, Orringer et al., 2005), whether this is true for other molecules identified in this study is unknown. Fast clinical responders in this study had more severe photoaging at baseline, and their greater initial improvement may have resulted from greater ease of observing treatment effects. Although the Griffiths photonumeric scale has higher inter-rater agreement and reliability compared to descriptive scales, future studies may use digital image analysis of clinical photographs to quantify improvements in wrinkles and hyperpigmentation more objectively.
In summary, multi-session NAFL treatment of photoaged skin led to clinical improvements over time and gene expression patterns consistent with prior studies. Further analysis revealed candidate pathways and genes associated with lipid metabolism and epidermal barrier function that may underlie a faster clinical response. These results do not establish a causal relationship between laser treatment and the activation of lipid metabolism in early clinical responders, as the fast and slow responders may have differed in unmeasured characteristics such as chronic medical conditions and nutrition. Nevertheless, we hope that our findings will stimulate more research to understanding the fundamental biology between photoaging and its reversal.
MATERIALS & METHODS
Study participants
This study was approved by the Johns Hopkins University Institutional Review Board (IRB00028766). Participants provided written informed consent prior to participation. We enrolled 17 female patients with scores of 5–7 on the 9-point Griffiths photoaging scale, indicating moderate to severe facial photodamage at baseline (Griffiths, 1992). Inclusion criteria included age 40–65 years, Fitzpatrick skin phototype I-III (to reduce the risk of post-inflammatory hyperpigmentation), and willingness to participate in skin care and sun protection routines throughout the study with cleanser, moisturizer, and sunscreen provided by the investigators. Exclusion criteria included history of abnormal scarring or keloids, pregnancy, plans for significant weight change, and use of oral or topical retinoids within the past month. All participants had a topical retinoid washout period of 4 weeks before enrollment and had not undergone cosmetic or laser treatments on the face in the past 6 months.
Treatment with 1550 nm Er:Glass non-ablative fractional laser
Participants received one treatment each month for 6 months with 1550 nm Er:Glass NAFL on the mid face (including the bilateral lower eyelids, lateral periorbital areas and cheek subunits, extended to include the nasolabial folds and melomental creases) and a 10 cm × 5 cm area on one dorsal forearm selected randomly at baseline (Figure 1a). Laser settings were as follows: face, fluence 60–70 mJ, treatment level 8–11, 8 passes; forearm, fluence 60–70 mJ, treatment level 6–9, 8 passes.
Participants were assessed clinically at baseline and weeks 4, 8, 16, 24, and 44 based on the Griffiths facial photoaging scale (Griffiths, 1992) and McKenzie arm photoaging scale (Mckenzie et al., 2011). Scales provided by Unilever Research and Development were used to assess facial wrinkles and mottled hyperpigmentation (Supplementary Table S2). Two board-certified dermatologists performed all assessments independently.
Punch biopsy and microarray assays
Four-millimeter punch biopsies were collected from the dorsal forearm at baseline and on days 1, 7, 14, and 29 after the first laser session (day 29 was also 1 day after the second laser session). Biopsies of the face were taken at the mid-lateral upper cheek on a randomized side at baseline and on day 7 post-laser treatment. Skin samples were placed in RNAlater stabilizing reagent (Qiagen, Valencia, CA), frozen at −196°C, and submitted to the Johns Hopkins Transcriptomics and Deep Sequencing Core. RNA was isolated with RNeasy Fibrous Tissue kit (Qiagen, Valencia, CA), and microarrays were performed with the Affymetrix PrimeView Human Gene Expression Array. Expression signals were normalized with the robust multi-array algorithm (Irizarry, 2003), and probe sets were annotated with Entrez gene symbols.
Statistical Analysis
Log2FC across timepoints were calculated for each probe set using the Linear Models for Microarray Data (limma) method in R, with statistical significance evaluated using the moderated t-statistic (Ritchie et al., 2015). Hierarchical clustering was performed using the Pearson correlation distance and Ward’s hierarchical agglomerative clustering method (Murtagh and Legendre, 2014) on genes with absolute Log2FC > 0.585 (FC > 1.5) and P < 0.05 on at least one time point in the arm. Gene ontology ORA and GSEA using the KEGG database were performed with the clusterprofiler package in R (Kanehisa et al., 2017, Subramanian et al., 2005, Wu et al., 2021). For ORA and GSEA, P values were calculated using Fisher’s exact tests and permutation tests, respectively, and adjusted using the Benjamini-Hochberg procedure (Benjamini and Hochberg, 1995). Analyses and visualizations were performed with R v.4.2.0 (R Core Team, 2022). Clinical grades across timepoints were compared with linear mixed-effects models. The R packages limma, clusterprofiler, lme4, lmerTest, and tidyverse were used (Bates et al., 2015, Kuznetsova et al., 2017, Ritchie et al., 2015, Wickham et al., 2019, Wu et al., 2021). Two-sided P<0.05 was accepted as statistically significant.
Supplementary Material
Supplementary Table S1. Changes in Griffiths and McKenzie photoaging scores at each timepoint relative to baseline across all participants
Supplementary Table S2. Scales used to assess facial wrinkles and mottled hyperpigmentation
Supplementary Table S3. Additional physician-graded clinical assessments
Supplementary Table S4. Participant demographics and characteristics stratified by fast and slow response to non-ablative fractional laser treatment
Supplementary Table S5. Change in Griffiths and McKenzie photoaging scores at each timepoint relative to baseline, stratified by fast and slow clinical responders
Supplementary Table S6. Expression of selected keratin genes in fast compared to slow clinical responders
Supplementary Figure S1. Similar gene expression profile seen in skin of the face and arm at 7 days after laser treatment across all participants. Comparison of changes in gene expression of the face and dorsal forearm at 7 days after laser treatment; the orthogonal regression line and Pearson correlation coefficient are shown. BL, baseline; D7, day 7.
Supplementary Figure S2. Changes in the expression of genes associated with matrix metalloproteinases (MMP), tissue inhibitors of metalloproteinases (TIMP), collagen, other extracellular matrix components, TGF-β signaling, dsRNA signaling, and retinoic acid synthesis do not differ between fast and slow responders. Time series plots show Log2 fold change (Log2FC) of individual selected genes at each timepoint relative to baseline (BL), stratified by fast (blue, n=11) and slow (red, n=6) responders. Error bars indicate the 95% confidence interval and were calculated from moderated t statistics, accounting for within-patient correlations. Error bars that do not cross zero indicate statistically significant difference relative to baseline (P<0.05). Differences between fast and slow responders were not statistically significant for the selected genes. BL, baseline; D1, day 1; D7, day 7; D14, day 14; D29, day 29.
ACKNOWLEDGEMENTS
We would like to thank Connie Talbot, Bao Li Chu, Ruizhi Wang, Jasmine Mensah, and Dr. Julie Jefferson for their contribution to this study.
Funding sources:
Unilever Human Biology Science and Technology; NIH NIAMS R01 AR074846 to LAG
Footnotes
CONFLICTS OF INTEREST STATEMENT
Research funding for this work was provided by Unilever Corporation. Dr. Stacy Hawkins has served as an employee of Unilever R&D. Dr. Sewon Kang has served as a paid consultant to Unilever.
IRB approval status: Reviewed and approved by Johns Hopkins University IRB (IRB00028766)
Publisher's Disclaimer: This is a PDF file of an article that has undergone enhancements after acceptance, such as the addition of a cover page and metadata, and formatting for readability, but it is not yet the definitive version of record. This version will undergo additional copyediting, typesetting and review before it is published in its final form, but we are providing this version to give early visibility of the article. Please note that, during the production process, errors may be discovered which could affect the content, and all legal disclaimers that apply to the journal pertain.
DATA AVAILABILITY STATEMENT
Datasets related to this article can be found at https://www.ncbi.nlm.nih.gov/geo/query/acc.cgi?acc=GSE206495, hosted at the NCBI Gene Expression Omnibus (GEO) database (Barrett et al., 2012).
REFERENCES
- Alexiades-Armenakas MR, Dover JS, Arndt KA. The spectrum of laser skin resurfacing: Nonablative, fractional, and ablative laser resurfacing. J Am Acad Dermatol 2008;58(5):719–37. [DOI] [PubMed] [Google Scholar]
- Barrett T, Wilhite SE, Ledoux P, Evangelista C, Kim IF, Tomashevsky M, et al. NCBI GEO: archive for functional genomics data sets—update. Nucleic Acids Res 2012;41(D1):D991–D5. [DOI] [PMC free article] [PubMed] [Google Scholar]
- Bates D, Mächler M, Bolker B, Walker S. Fitting Linear Mixed-Effects Models Using lme4. Journal of Statistical Software 2015;67(1). [Google Scholar]
- Benjamini Y, Hochberg Y. Controlling the False Discovery Rate: A Practical and Powerful Approach to Multiple Testing. Journal of the Royal Statistical Society Series B (Methodological) 1995;57(1):289–300. [Google Scholar]
- Cho BA, Yoo S-K, Seo J-S. Signatures of photo-aging and intrinsic aging in skin were revealed by transcriptome network analysis. Aging 2018;10(7):1609–26. [DOI] [PMC free article] [PubMed] [Google Scholar]
- Geronemus RG. Fractional photothermolysis: Current and future applications. Lasers Surg Med 2006;38(3):169–76. [DOI] [PubMed] [Google Scholar]
- Griffiths C, Russman AN, Majmudar G, Singer RS, Hamilton TA, Voorhees JJ. Restoration of Collagen Formation in Photodamaged Human Skin by Tretinoin (Retinoic Acid). N Engl J Med 1993;329(8):530–5. [DOI] [PubMed] [Google Scholar]
- Griffiths CEM. A Photonumeric Scale for the Assessment of Cutaneous Photodamage. Arch Dermatol 1992;128(3):347. [PubMed] [Google Scholar]
- Hama H Fatty acid 2-Hydroxylation in mammalian sphingolipid biology. Biochimica et Biophysica Acta (BBA) - Molecular and Cell Biology of Lipids 2010;1801(4):405–14. [DOI] [PMC free article] [PubMed] [Google Scholar]
- Helbig D, Paasch U. Molecular changes during skin aging and wound healing after fractional ablative photothermolysis. Skin Res Technol 2011;17(1):119–28. [DOI] [PubMed] [Google Scholar]
- Huang AH, Chien AL. Photoaging: a Review of Current Literature. Curr Derm Rep 2020;9(1):22–9. [Google Scholar]
- Irizarry RA. Exploration, normalization, and summaries of high density oligonucleotide array probe level data. Biostatistics 2003;4(2):249–64. [DOI] [PubMed] [Google Scholar]
- Kafi R, Kwak HSR, Schumacher WE, Cho S, Hanft VN, Hamilton TA, et al. Improvement of Naturally Aged Skin With Vitamin A (Retinol). Arch Dermatol 2007;143(5). [DOI] [PubMed] [Google Scholar]
- Kanehisa M, Furumichi M, Tanabe M, Sato Y, Morishima K. KEGG: new perspectives on genomes, pathways, diseases and drugs. Nucleic Acids Res 2017;45(D1):D353–D61. [DOI] [PMC free article] [PubMed] [Google Scholar]
- Kauvar AN. Fractional nonablative laser resurfacing: is there a skin tightening effect? Dermatol Surg 2014;40 Suppl 12:S157–63. [DOI] [PubMed] [Google Scholar]
- Kim D, Chen R, Sheu M, Kim N, Kim S, Islam N, et al. Noncoding dsRNA induces retinoic acid synthesis to stimulate hair follicle regeneration via TLR3. Nature Communications 2019;10(1). [DOI] [PMC free article] [PubMed] [Google Scholar]
- Kuznetsova A, Brockhoff PB, Christensen RHB. lmerTest Package: Tests in Linear Mixed Effects Models. Journal of Statistical Software 2017;82(13). [Google Scholar]
- Lu B, Jiang YJ, Man MQ, Brown B, Elias PM, Feingold KR. Expression and regulation of 1-acyl-sn-glycerol- 3-phosphate acyltransferases in the epidermis. J Lipid Res 2005;46(11):2448–57. [DOI] [PubMed] [Google Scholar]
- Manstein D, Herron GS, Sink RK, Tanner H, Anderson RR. Fractional Photothermolysis: A New Concept for Cutaneous Remodeling Using Microscopic Patterns of Thermal Injury. Lasers Surg Med 2004;34(5):426–38. [DOI] [PubMed] [Google Scholar]
- Mckenzie NE, Saboda K, Duckett LD, Goldman R, Hu C, Curiel-Lewandrowski CN. Development of a Photographic Scale for Consistency and Guidance in Dermatologic Assessment of Forearm Sun Damage. Arch Dermatol 2011;147(1):31. [DOI] [PMC free article] [PubMed] [Google Scholar]
- Moll R, Divo M, Langbein L. The human keratins: biology and pathology. Histochem Cell Biol 2008;129(6):705–33. [DOI] [PMC free article] [PubMed] [Google Scholar]
- Murtagh F, Legendre P. Ward’s Hierarchical Agglomerative Clustering Method: Which Algorithms Implement Ward’s Criterion? Journal of Classification 2014;31(3):274–95. [Google Scholar]
- Nelson AM, Reddy SK, Ratliff TS, Hossain MZ, Katseff AS, Zhu AS, et al. dsRNA Released by Tissue Damage Activates TLR3 to Drive Skin Regeneration. Cell Stem Cell 2015;17(2):139–51. [DOI] [PMC free article] [PubMed] [Google Scholar]
- Orringer JS, Kang S, Johnson TM, Karimipour DJ, Hamilton T, Hammerberg C, et al. Connective Tissue Remodeling Induced by Carbon Dioxide Laser Resurfacing of Photodamaged Human Skin. Arch Dermatol 2004;140(11). [DOI] [PubMed] [Google Scholar]
- Orringer JS, Rittié L, Baker D, Voorhees JJ, Fisher G. Molecular mechanisms of nonablative fractionated laser resurfacing. Br J Dermatol 2010;163(4):757–68. [DOI] [PubMed] [Google Scholar]
- Orringer JS, Sachs DL, Shao Y, Hammerberg C, Cui Y, Voorhees JJ, et al. Direct Quantitative Comparison of Molecular Responses in Photodamaged Human Skin to Fractionated and Fully Ablative Carbon Dioxide Laser Resurfacing. Dermatol Surg 2012;38(10):1668–77. [DOI] [PubMed] [Google Scholar]
- Orringer JS, Voorhees JJ, Hamilton T, Hammerberg C, Kang S, Johnson TM, et al. Dermal matrix remodeling after nonablative laser therapy. J Am Acad Dermatol 2005;53(5):775–82. [DOI] [PubMed] [Google Scholar]
- Pang B, Zhu Z, Xiao C, Luo Y, Fang H, Bai Y, et al. Keratin 17 Is Required for Lipid Metabolism in Keratinocytes and Benefits Epidermal Permeability Barrier Homeostasis. Front Cell Dev Biol 2021;9:779257. [DOI] [PMC free article] [PubMed] [Google Scholar]
- Pappas A, Fantasia J, Chen T. Age and ethnic variations in sebaceous lipids. Dermatoendocrinol 2013;5(2):319–24. [DOI] [PMC free article] [PubMed] [Google Scholar]
- Park S-H, Kim D-W, Jeong T Skin-tightening effect of fractional lasers: Comparison of non-ablative and ablative fractional lasers in animal models. J Plast Reconstr Aesthet Surg 2012;65(10):1305–11. [DOI] [PubMed] [Google Scholar]
- Poon F, Kang S, Chien AL. Mechanisms and treatments of photoaging. Photodermatol Photoimmunol Photomed 2015;31(2):65–74. [DOI] [PubMed] [Google Scholar]
- R Core Team. R: A language and environment for statistical computing. Vienna, Austria: R Foundation for Statistical Computing; 2022. [Google Scholar]
- Riahi RR, Bush AE, Cohen PR. Topical Retinoids: Therapeutic Mechanisms in the Treatment of Photodamaged Skin. Am J Clin Dermatol 2016;17(3):265–76. [DOI] [PubMed] [Google Scholar]
- Ritchie ME, Phipson B, Wu D, Hu Y, Law CW, Shi W, et al. limma powers differential expression analyses for RNA-sequencing and microarray studies. Nucleic Acids Res 2015;43(7):e47–e. [DOI] [PMC free article] [PubMed] [Google Scholar]
- Starnes AM, Jou PC, Molitoris JK, Lam M, Baron ED, Garcia-Zuazaga J. Acute effects of fractional laser on photo-aged skin. Dermatol Surg 2012;38(1):51–7. [DOI] [PubMed] [Google Scholar]
- Stratigos AJ, Katsambas AD. The Role of Topical Retinoids in the Treatment of Photoaging. Drugs 2005;65(8):1061–72. [DOI] [PubMed] [Google Scholar]
- Subramanian A, Tamayo P, Mootha VK, Mukherjee S, Ebert BL, Gillette MA, et al. Gene set enrichment analysis: A knowledge-based approach for interpreting genome-wide expression profiles. Proceedings of the National Academy of Sciences 2005;102(43):15545–50. [DOI] [PMC free article] [PubMed] [Google Scholar]
- Tierney EP, Hanke CW, Petersen J, Bartley T, Eckert JR, McCutchen C. Clinical and echographic analysis of ablative fractionated carbon dioxide laser in the treatment of photodamaged facial skin. Dermatol Surg 2010;36(12):2009–21. [DOI] [PubMed] [Google Scholar]
- Turkish AR, Henneberry AL, Cromley D, Padamsee M, Oelkers P, Bazzi H, et al. Identification of Two Novel Human Acyl-CoA Wax Alcohol Acyltransferases. J Biol Chem 2005;280(15):14755–64. [DOI] [PubMed] [Google Scholar]
- Uchida Y The role of fatty acid elongation in epidermal structure and function. Dermatoendocrinol 2011;3(2):65–9. [DOI] [PMC free article] [PubMed] [Google Scholar]
- Uchida Y, Hama H, Alderson NL, Douangpanya S, Wang Y, Crumrine DA, et al. Fatty Acid 2-Hydroxylase, Encoded by FA2H, Accounts for Differentiation-associated Increase in 2-OH Ceramides during Keratinocyte Differentiation. J Biol Chem 2007;282(18):13211–9. [DOI] [PubMed] [Google Scholar]
- Varani J, Spearman D, Perone P, Fligiel SEG, Datta SC, Wang ZQ, et al. Inhibition of Type I Procollagen Synthesis by Damaged Collagen in Photoaged Skin and by Collagenase-Degraded Collagen in Vitro. The American Journal of Pathology 2001;158(3):931–42. [DOI] [PMC free article] [PubMed] [Google Scholar]
- Westerberg R, Tvrdik P, Undén A-B, Månsson J-E, Norlén L, Jakobsson A, et al. Role for ELOVL3 and Fatty Acid Chain Length in Development of Hair and Skin Function. J Biol Chem 2004;279(7):5621–9. [DOI] [PubMed] [Google Scholar]
- Wickham H, Averick M, Bryan J, Chang W, McGowan L, François R, et al. Welcome to the Tidyverse. Journal of Open Source Software 2019;4(43):1686. [Google Scholar]
- Wu T, Hu E, Xu S, Chen M, Guo P, Dai Z, et al. clusterProfiler 4.0: A universal enrichment tool for interpreting omics data. The Innovation 2021;2(3):100141. [DOI] [PMC free article] [PubMed] [Google Scholar]
- Yan C, Boyd DD. Regulation of matrix metalloproteinase gene expression. J Cell Physiol 2007;211(1):19–26. [DOI] [PubMed] [Google Scholar]
- Zhang X, Yin M, Zhang L-J. Keratin 6, 16 and 17—Critical Barrier Alarmin Molecules in Skin Wounds and Psoriasis. Cells 2019;8(8):807. [DOI] [PMC free article] [PubMed] [Google Scholar]
- Zouboulis CC, Boschnakow A. Chronological ageing and photoageing of the human sebaceous gland. Clin Exp Dermatol 2001;26(7):600–7. [DOI] [PubMed] [Google Scholar]
Associated Data
This section collects any data citations, data availability statements, or supplementary materials included in this article.
Supplementary Materials
Supplementary Table S1. Changes in Griffiths and McKenzie photoaging scores at each timepoint relative to baseline across all participants
Supplementary Table S2. Scales used to assess facial wrinkles and mottled hyperpigmentation
Supplementary Table S3. Additional physician-graded clinical assessments
Supplementary Table S4. Participant demographics and characteristics stratified by fast and slow response to non-ablative fractional laser treatment
Supplementary Table S5. Change in Griffiths and McKenzie photoaging scores at each timepoint relative to baseline, stratified by fast and slow clinical responders
Supplementary Table S6. Expression of selected keratin genes in fast compared to slow clinical responders
Supplementary Figure S1. Similar gene expression profile seen in skin of the face and arm at 7 days after laser treatment across all participants. Comparison of changes in gene expression of the face and dorsal forearm at 7 days after laser treatment; the orthogonal regression line and Pearson correlation coefficient are shown. BL, baseline; D7, day 7.
Supplementary Figure S2. Changes in the expression of genes associated with matrix metalloproteinases (MMP), tissue inhibitors of metalloproteinases (TIMP), collagen, other extracellular matrix components, TGF-β signaling, dsRNA signaling, and retinoic acid synthesis do not differ between fast and slow responders. Time series plots show Log2 fold change (Log2FC) of individual selected genes at each timepoint relative to baseline (BL), stratified by fast (blue, n=11) and slow (red, n=6) responders. Error bars indicate the 95% confidence interval and were calculated from moderated t statistics, accounting for within-patient correlations. Error bars that do not cross zero indicate statistically significant difference relative to baseline (P<0.05). Differences between fast and slow responders were not statistically significant for the selected genes. BL, baseline; D1, day 1; D7, day 7; D14, day 14; D29, day 29.
Data Availability Statement
Datasets related to this article can be found at https://www.ncbi.nlm.nih.gov/geo/query/acc.cgi?acc=GSE206495, hosted at the NCBI Gene Expression Omnibus (GEO) database (Barrett et al., 2012).