

This cohort study uses the American Heart Association’s Life’s Essential 8 metrics to quantify the associations between levels of cardiovascular health and life expectancy free of major chronic disease, including cardiovascular disease, diabetes, cancer, and dementia, among UK adults.
Key Points
Question
What is the association of cardiovascular health (CVH) levels, estimated by the American Heart Association’s Life’s Essential 8 score, with life expectancy free of major chronic diseases?
Findings
In this cohort study of 135 199 adults from the UK Biobank study, high CVH level was associated with substantially longer life expectancy free of 4 major chronic diseases (cardiovascular disease, diabetes, cancer, and dementia) in both men and women. Furthermore, the disease-free life expectancy was similar between low and other socioeconomic groups among participants with high CVH.
Meaning
These findings support improvement in population health by promoting a high CVH level, which may also narrow health disparities associated with socioeconomic status.
Abstract
Importance
The average life expectancy has increased substantially in the past few decades in most industrialized countries; however, not all of the increased life expectancy is being spent in optimal health, especially among individuals with low socioeconomic status.
Objective
To quantify the associations between levels of cardiovascular health (CVH), estimated by the American Heart Association’s Life’s Essential 8 (LE8) metrics, with life expectancy free of major chronic disease, including cardiovascular disease (CVD), diabetes, cancer, and dementia, in UK adults.
Design, Setting, and Participants
This cohort study included 135 199 adults in the UK Biobank study who were initially free of major chronic disease and had complete data on LE8 metrics. Data analyses were performed in August 2022.
Exposures
Cardiovascular health levels, as estimated by LE8 score. The LE8 score, which consists of 8 components: (1) diet, (2) physical activity, (3) tobacco/nicotine exposure, (4) sleep, (5) body mass index, (6) non–high-density lipoprotein cholesterol, (7) blood glucose, and (8) blood pressure. The CVH level was evaluated at baseline and categorized into low (LE8 score <50), moderate (LE8 score ≥50 but <80), and high (LE8 score ≥80) levels.
Main Outcomes and Measures
The primary outcome was the life expectancy free of 4 major chronic diseases (CVD, diabetes, cancer, and dementia).
Results
Of the 135 199 adults (44.7% men; mean [SD] age, 55.4 [7.9] years) included in the study, a total of 4712, 48 955, and 6748 men had low, moderate, and high CVH levels, respectively, and the corresponding numbers for women were 3661, 52 192, and 18 931. At age 50 years, the estimated disease-free years were 21.5 (95% CI, 21.0-22.0), 25.5 (95% CI, 25.4-25.6), and 28.4 (95% CI, 27.8-29.0) for men with low, moderate, and high CVH levels, respectively; the corresponding estimated disease-free years at age 50 years for women were 24.2 (95% CI, 23.5-24.8), 30.5 (95% CI, 30.4-30.6), and 33.6 (95% CI, 33.1-34.0). Equivalently, men with moderate or high CVH levels lived on average 4.0 (95% CI, 3.4-4.5) or 6.9 (95% CI, 6.1-7.7) longer years free of chronic disease, respectively, at age 50 years, compared with men with low CVH levels. The corresponding longer years lived free of disease for women were 6.3 (95% CI, 5.6-7.0) or 9.4 (95% CI, 8.5-10.2). For participants with high CVH level, there was not a statistically significant difference in disease-free life expectancy between participants with low and other socioeconomic status.
Conclusions and Relevance
In this cohort study, a high level of CVH, evaluated using the LE8 metrics, was associated with longer life expectancy free of major chronic diseases and may contribute to narrowing socioeconomic health inequalities in both men and women.
Introduction
The average life expectancy has increased substantially in the past few decades in most industrialized countries; however, it is noted that not all of the increased life expectancy is being spent in optimal health.1 In fact, increasing numbers of middle-aged and elderly individuals live more years affected by various chronic diseases, such as diabetes, cardiovascular disease (CVD), cancer, and dementia.2 It has been estimated that 27.2% of US adults had multiple chronic conditions in 2018,3 and two-thirds of UK adults are expected to be living with multiple chronic conditions by 2035.4 These chronic conditions have been linked to a lower quality of life, a higher risk of premature mortality, and a great burden on health care costs.5,6
The concept of cardiovascular health (CVH) was proposed by the American Heart Association (AHA) in 2010 and is composed of both lifestyle factors and biological metrics.7 The original algorithm for evaluating CVH was the Life’s Simple 7 (LS7) score.7 In 2022, the AHA published the new algorithm for evaluating CVH, the Life’s Essential 8 (LE8) score, on the basis of feedback on the LS7 score and new evidence.8 The LE8 score adopts a new scoring algorithm and incorporates sleep health into CVH.8 Intriguingly, previous studies have shown that having a higher CVH level was not only associated with a lower risk of CVD, but also associated with lower risks of other diseases, such as diabetes, cancer, and dementia, as well as risk of all-cause mortality.9,10,11,12,13 Currently, studies assessing the relations between CVH defined by LE8 and the overall health in humans are lacking.
Life expectancy free of major chronic diseases (also referred to as “health span”14) considers both morbidity and mortality and provides more intuitive and comprehensive estimates for overall health compared with other indicators such as relative risk of a certain disease or mortality, and such estimates could be useful metrics for both policy makers and the general public. To our knowledge, no study has investigated the association between CVH defined by the new LE8 score and life expectancy free from major chronic diseases. Moreover, previous studies have shown that a low socioeconomic level (eg, low education attainment, high Townsend Deprivation Index, low household income) was associated with shorter life expectancy15,16,17; it is unclear whether a high CVH level can attenuate the loss of disease-free years and health disparities associated with low socioeconomic level.
The aim of this cohort study was to evaluate the association between levels of CVH, defined by the LE8 score, and life expectancy free from CVD, diabetes, cancer, and dementia in adults from a large UK population. Furthermore, we investigated the joint associations of CVH and socioeconomic status with life expectancy.
Methods
Study Design and Population
The UK Biobank study is a population-based cohort study recruiting more than 0.5 million participants aged 40 to 69 years throughout the UK between 2006 and 2010. The study design and methods have been described in detail previously.18 The study was approved by the North West Multi-centre Research Ethics Committee and the Tulane University Biomedical Committee Institutional Review Board, and all participants provided written informed consent at baseline recruitment to UK Biobank. This study followed Strengthening the Reporting of Observational Studies in Epidemiology (STROBE) reporting guidelines.
Among 162 825 participants who had completed data on diet and other CVH components, a total of 135 199 participants were included in the main analysis after excluding 45 participants who were pregnant, 27 207 participants who were already diagnosed with any of 4 chronic diseases (CVD, diabetes, cancer, or dementia) at baseline, and 374 participants who were lost to follow-up. All included participants had available data on death and nonfatal disease event. We excluded participants with both self-reported prevalent CVD, diabetes, cancer, or dementia (dementia and cognitive impairment), and the prevalent diseases diagnosis (if incident date of diseases was prior to the date of attending assessment center) identified through hospital impatient records. The baseline characteristics between participants with complete data on LE8 score and those with missing data are summarized in eTable 1 in Supplement 1.
Assessments of CVH
Cardiovascular health was evaluated by LE8 score.8 Eight components were used to create the LE8 score, including (1) diet, (2) physical activity, (3) tobacco/nicotine exposure, (4) sleep, (5) body mass index, (6) non–high-density lipoprotein (non-HDL) cholesterol, (7) blood glucose, and (8) blood pressure. Diet within LE8 was estimated by calculating the Dietary Approaches to Stop Hypertension diet score.19 The information on physical activity (minutes of moderate or vigorous physical activity per week), tobacco/nicotine exposure (combustible tobacco use and secondhand smoke exposure), sleep (sleep duration), and medication use were self-reported and collected during the interview process. Standing height, weight, and blood pressure were measured at the assessment center. Body mass index was calculated as weight in kilograms divided by height in meters squared. Blood pressure was measured twice by trained nurse. Average levels of systolic and diastolic blood pressure were used in this study, and automated measurements were preferred; if the automated one was not available, manual measurement was used instead.20 The measurement of serum cholesterol and glycated hemoglobin was performed at laboratory central. Serum cholesterol was measured enzymatically, and non-HDL cholesterol was calculated as total cholesterol minus HDL cholesterol. Glycated hemoglobin was measured using a high-performance liquid chromatography method. The details and scoring algorithm for each CVH metric are provided in eTable 2 in Supplement 1 and previous studies.8 The individual CVH metric ranges from 0 to 100 points. The overall CVH score was calculated by summing the scores for the 8 metrics and dividing by 8 and also ranges from 0 to 100 points. Higher score represents healthier CVH. According to the AHA’s recommendations,8 we categorized overall CVH into low (LE8 score <50), moderate (LE8 score ≥50 but <80), and high (LE8 score ≥80) levels.
Assessments of Covariates
A touch-screen questionnaire was used to collect information on age, sex, race and ethnicity, Townsend Deprivation Index, education attainment, annual household income, and depression status. The Townsend Deprivation Index is a composite measure of deprivation based on unemployment, non–car ownership, non–home ownership, and household overcrowding; higher values represent lower socioeconomic status.21 Levels of educational attainment were classified into 6 levels: (1) no qualifications, (2) Certificate of Secondary Education or Ordinary Levels/General Certificate of Secondary Education or equivalent, (3) Advanced Levels/Advanced Subsidiary Levels or equivalent, (4) other professional qualification, (5) National Vocational Qualification or Higher National Certificate or equivalent, and (6) college or university degree.22,23 Total annual household income before tax was collected based on 5 groups: (1) less than £18 000, (2) £18 000 to £29 999, (3) £30 000 to £51 999, (4) £52 000 to £100 000, and (5) more than £100 000. Depressive symptoms were measured by a single screening question from the Patient Health Questionnaire: “Over the past two weeks, how often have you felt down, depressed or hopeless?” Participants who answered “several days,” “more than half the days,” or “nearly every day” were defined as “Yes,” and those who answered “not at all” were defined as “No.”24 We coded missing covariates as a missing indicator category for categorical variables and with mean values for continuous variables. In a sensitivity analysis, we imputed missing covariate values with multivariate imputation by chained equations and repeated the analyses. Further details can be found at the UK Biobank website (https://biobank.ctsu.ox.ac.uk/showcase).
Assessments of Death and Chronic Diseases
Information on death and death date was obtained by reviewing the death certificates held by the National Health Service Information Centre (England and Wales) and the National Health Service Central Register Scotland (Scotland). Information on disease diagnosis and diagnosed date was obtained from hospital inpatient records held by the Hospital Episode Statistics (England), Scottish Morbidity Record data (Scotland), and the Patient Episode Database (Wales). We defined incident nonfatal major chronic diseases according to the International Statistical Classification of Diseases and Related Health Problems, Tenth Revision (ICD-10) codes. Nonfatal CVD comprised nonfatal coronary heart disease, stroke, heart failure, and atrial fibrillation. All cancers except nonmelanoma skin cancer, type 2 diabetes, and dementia were included as outcome. The ICD-10 codes for diagnosing the 4 diseases are summarized in eTable 3 in Supplement 1. Several previous studies have assessed the accuracy of using hospital inpatient records and ICD codes in the UK Biobank to diagnose these chronic diseases (CVD, dementia, and diabetes) and have shown that these data are reliable enough for epidemiological studies.25,26,27,28 Participants newly diagnosed with any of the 4 diseases during follow-up were defined as having incident major chronic disease. Date of diagnosis was defined by the earliest diagnosed date for the 4 diseases. The censoring date was defined as the end date of disease and mortality data collection (May 23, 2021). Details of the exposure and outcome measurement are described in eAppendix 1 in Supplement 1.
Statistical Analysis
Population-based multistate life tables were used to calculate the total life expectancy and years lived with and without CVD, diabetes, cancer, and dementia according to the levels of each CVH component and overall CVH. To build a multistate life table, 3 health states were considered in this study: (1) free of disease, (2) presence of disease, and (3) death. Three possible transitions between states were investigated: from nondisease to incident disease (transition 1), and from nondisease to death (transition 2) among participants free of disease at baseline, as well as from disease diagnosis to death (transition 3) among participants with incident disease during follow-up. We only considered the first entry into a state, and no reversal of state was allowed.
To evaluate the differences in life expectancies for CVH levels, we first calculated the overall sex- and age-specific transition rates for each transition using survival analysis with Gompertz distribution. Second, hazard ratios (HRs) by CVH levels were calculated for each transition in Cox proportional hazards models (eTable 4 in Supplement 1). The basic assumptions of a Cox model were confirmed by calculating scaled Schoenfeld residuals and inspecting time-based HR plots. The models were adjusted by age, race and ethnicity (White, other [including individuals who self-reported as Asian, Black, >1 race, and other ethnicity; these groups were combined owing to small sample sizes]), Townsend Deprivation Index (continuous), education level (6 levels), income (5 groups), and depression status (yes, no). For the HR of transition 3, age at diagnosis of chronic disease was further adjusted. Third, we calculated the baseline prevalence of CVH level by sex and 10-year age groups for participants free of disease at baseline and those diagnosed with disease during follow-up. Lastly, we combined overall transition rates, HRs and prevalence of CVH levels to derive weighted transition rates, which were used to create multistate life tables. Separate life tables were created for each sex and each CVH level. The multistate life table started at age 50 years and ended at age 100 years. The 95% CIs of life expectancy estimation were calculated using a Monte Carlo simulation (parametric bootstrapping) with 2000 runs. Similar calculations have been described previously,29,30,31 and the methodology details are described in eAppendix 2 in Supplement 1. Also, we performed a sensitivity analysis by treating CVH as a continuous score (after 50 points of LE8, divide into groups of 10 points). Moreover, we performed another sensitivity analysis by excluding participants who became ill or died within 2 years.
Due to the important role of socioeconomic status in optimizing and preserving CVH,8,13 we investigated joint associations of several relevant and well-established indicators (educational attainment, Townsend Deprivation Index, and household income) with CVH in relation to life expectancy with and without CVD, diabetes, cancer, or dementia. We classified participants according to the joint categories of overall CVH levels and levels of these socioeconomic indicators. For joint analysis, low education attainment was categorized as less than or equal to Certificate of Secondary Education or Ordinary Levels/General Certificate of Secondary Education or equivalent,22 high Townsend Deprivation Index was categorized as above median, and low annual household income was categorized as less than £31 000 to represent lower socioeconomic status, respectively. Multistate life tables were built to estimate the differences in life expectancies between joint categories. In addition, we performed a sensitivity analysis by changing a more extreme definition for each indicator of low socioeconomic status (low education: no qualifications; high Townsend Deprivation Index: above highest tertile; low income: <£18 000).
All statistical analyses were conducted using Stata, version 17.0 for Windows (StataCorp), and R, version 4.1.3 (R Foundation for Statistical Computing). All statistical tests were 2-sided, and we considered P < .05 to be statistically significant.
Results
Cohort Characteristics
A total of 135 199 participants were included in the analysis. The mean (SD) value of the LE8 score was 66.2 (11.2) for men and 71.0 (12.0) for women. Table 1 summarizes the baseline characteristics in men and women according to levels of CVH, estimated by the LE8 score. Of 60 415 men, 7.8%, 81.0%, and 11.2% had low (LE8 score <50), moderate (LE8 score ≥50 but <80), and high (LE8 score ≥80) CVH levels, respectively. Of 74 784 women, 4.9%, 69.8%, and 25.3% had low, moderate, and high CVH levels, respectively. In both men and women, participants with higher levels of CVH were more likely to be younger, to be White, to have a higher level of educational attainment, to have a lower Townsend Deprivation Index, and to have a lower prevalence of depression. The difference for individual CVH components by sex is shown in eTable 5 in Supplement 1. During a mean of 11.9 years of follow-up, 4656 deaths were documented (2658 men and 1998 women), and a total of 11 427 incident CVD events (7179 men and 4248 women), 2786 incident type 2 diabetes events (1624 men and 1162 women), 12 688 incident cancer events (6412 men and 6276 women), and 808 incident dementia events (418 men and 390 women) were observed.
Table 1. Baseline Characteristics by Cardiovascular Health (CVH) Level Among Included Men and Women.
| Characteristic | No. (%) | |||||
|---|---|---|---|---|---|---|
| Men (n = 60 415) | Women (n = 74 784) | |||||
| Low CVH | Moderate CVH | High CVH | Low CVH | Moderate CVH | High CVH | |
| No. of participants | 4712 (7.8) | 48 955 (81.0) | 6748 (11.2) | 3661 (4.9) | 52 192 (69.8) | 18 931 (25.3) |
| Age, mean (SD), y | 55.1 (7.6) | 55.9 (8.1) | 54.5 (8.3) | 55.8 (7.2) | 55.9 (7.7) | 52.9 (7.9) |
| Race and ethnicity | ||||||
| Asian | 61 (1.3) | 806 (1.7) | 107 (1.6) | 40 (1.1) | 716 (1.4) | 282 (1.5) |
| Black | 69 (1.5) | 443 (0.9) | 29 (0.4) | 89 (2.4) | 589 (1.1) | 99 (0.5) |
| White | 4494 (95.4) | 46 990 (96.0) | 6513 (96.5) | 3453 (94.3) | 50 002 (95.8) | 18 280 (96.6) |
| >1 Race | 25 (0.5) | 226 (0.5) | 36 (0.5) | 30 (0.8) | 369 (0.7) | 116 (0.6) |
| Other ethnicity | 38 (0.8) | 302 (0.6) | 35 (0.5) | 39 (1.1) | 382 (0.7) | 133 (0.7) |
| Townsend Deprivation Index, mean (SD) | −1.0 (3.1) | −1.7 (2.8) | −1.8 (2.8) | −0.8 (3.2) | −1.6 (2.8) | −1.8 (2.7) |
| Education levels | ||||||
| No qualification | 553 (11.8) | 3644 (7.5) | 224 (3.3) | 528 (14.5) | 4316 (8.3) | 650 (3.4) |
| CSE or Ordinary Levels/GCSE or equivalent | 727 (15.5) | 5807 (11.9) | 500 (7.4) | 845 (23.3) | 9799 (18.9) | 2598 (13.8) |
| Advanced Levels/Advanced Subsidiary Levels or equivalent | 317 (6.8) | 2789 (5.7) | 341 (5.1) | 246 (6.8) | 3671 (7.1) | 1242 (6.6) |
| Other professional qualification | 549 (11.7) | 5299 (10.9) | 532 (7.9) | 473 (4.6) | 7500 (14.4) | 2425 (12.8) |
| NVQ or HNC or equivalent | 988 (21.1) | 9139 (18.7) | 1005 (14.9) | 575(15.8) | 6295 (12.1) | 1904 (10.1) |
| College or university degree | 1549 (33.1) | 22 105 (45.3) | 4139 (61.4) | 968 (26.6) | 20 392 (39.2) | 10 075 (53.3) |
| Annual household income, £ | ||||||
| <18 000 | 744 (15.8) | 5228 (10.7) | 621 (9.2) | 754 (20.6) | 7775 (14.9) | 1818 (9.6) |
| 18 000-30 999 | 950 (20.2) | 9908 (20.2) | 1287 (19.1) | 859 (23.5) | 11 917 (22.8) | 3592 (19.0) |
| 31 000-51 999 | 1222 (25.9) | 13 753 (28.1) | 1859 (27.6) | 918 (25.1) | 12 867 (24.7) | 4965 (26.2) |
| 52 000-100 000 | 1090 (23.1) | 12 887 (26.3) | 1908 (27.6) | 523 (14.3) | 10 281 (19.7) | 4909 (31.2) |
| >100 000 | 313 (6.3) | 3932 (8.0) | 708 (10.5) | 83 (2.3) | 2739 (5.3) | 1755 (9.3) |
| Depression | 1148 (24.4) | 8513 (17.4) | 1059 (15.7) | 1173 (32.0) | 12 182 (23.3) | 3990 (21.1) |
| AHA Life’s Essential 8 score, mean (SD) | ||||||
| Total CVH score | 44.2 (4.6) | 65.8 (7.7) | 84.3 (3.8) | 44.3 (4.8) | 67.7 (7.7) | 85.5 (4.4) |
| DASH score | 10.6 (17.3) | 29.3 (27.4) | 61.9 (26.7) | 19.6 (23.9) | 45.0 (31.7) | 69.2 (26.6) |
| Physical activity score | 24.3 (35.8) | 75.8 (36.6) | 96.4 (12.6) | 18.7 (32.5) | 67.7 (40.5) | 93.4 (17.9) |
| Tobacco/nicotine exposure score | 48.5 (35.6) | 73.6 (26.4) | 87.0 (16.6) | 53.9 (35.9) | 74.5 (26.9) | 85.5 (18.6) |
| Sleep health score | 80.0 (23.4) | 91.1 (16.2) | 96.4 (10.1) | 78.2 (25.0) | 90.1 (17.5) | 95.9 (10.9) |
| Body mass index score | 44.4 (26.0) | 70.1 (24.0) | 92.9 (13.2) | 35.9 (27.6) | 71.7 (27.8) | 93.8 (13.1) |
| Blood lipid score | 27.3 (22.8) | 43.5 (26.2) | 70.8 (26.0) | 26.9 (23.1) | 43.2 (27.2) | 69.3 (27.1) |
| Blood glucose score | 87.1 (18.7) | 95.9 (12.1) | 99.2 (5.6) | 85.6 (19.2) | 95.0 (13.2) | 98.9 (6.4) |
| Blood pressure score | 31.8 (22.7) | 47.5 (24.6) | 69.7 (22.6) | 35.6 (24.0) | 54.4 (27.2) | 77.6 (23.7) |
Abbreviations: AHA, American Heart Association; CSE, Certificate of Secondary Education; DASH, Dietary Approaches to Stop Hypertension; GCSE, General Certificate of Secondary Education; HNC, Higher National Certificate; NVQ, National Vocational Qualification.
Life Expectancy and Years Lived With and Without Major Chronic Diseases
Higher levels of CVH were associated with both longer total life expectancy and greater percentage of life expectancy free of major chronic diseases (CVD, diabetes, cancer, and dementia) in men and women (Figure 1). At age 50 years, the estimated total life expectancy was 34.5 (95% CI, 33.3-35.6), 37.2 (95% CI, 37.0-37.3), and 39.3 (95% CI, 38.2-40.3) years for men with low, moderate, and high CVH levels, respectively. The corresponding estimated total life expectancy at age 50 years for women was 36.0 (95% CI, 34.6-37.3), 40.2 (95% CI, 40.1-40.4), and 42.0 (95% CI, 41.3-42.6) years. Notably, the percentage of life expectancy free of diseases out of total life expectancy was greater along with higher levels of CVH, which were 62.4% (95% CI, 60.8%-64.3%), 68.6% (95% CI, 68.3%-68.8%), and 72.4% (95% CI, 70.8%-74.2%) among men with low, moderate, and high CVH levels, respectively, and were 67.2% (95% CI, 65.2%-69.3%), 75.8% (95% CI, 75.5%-76.1%), and 79.9% (95% CI, 78.9%-80.9%) for women, respectively.
Figure 1. Total Life Expectancy and Life Expectancy With and Without Major Chronic Disease by Levels of CVH.
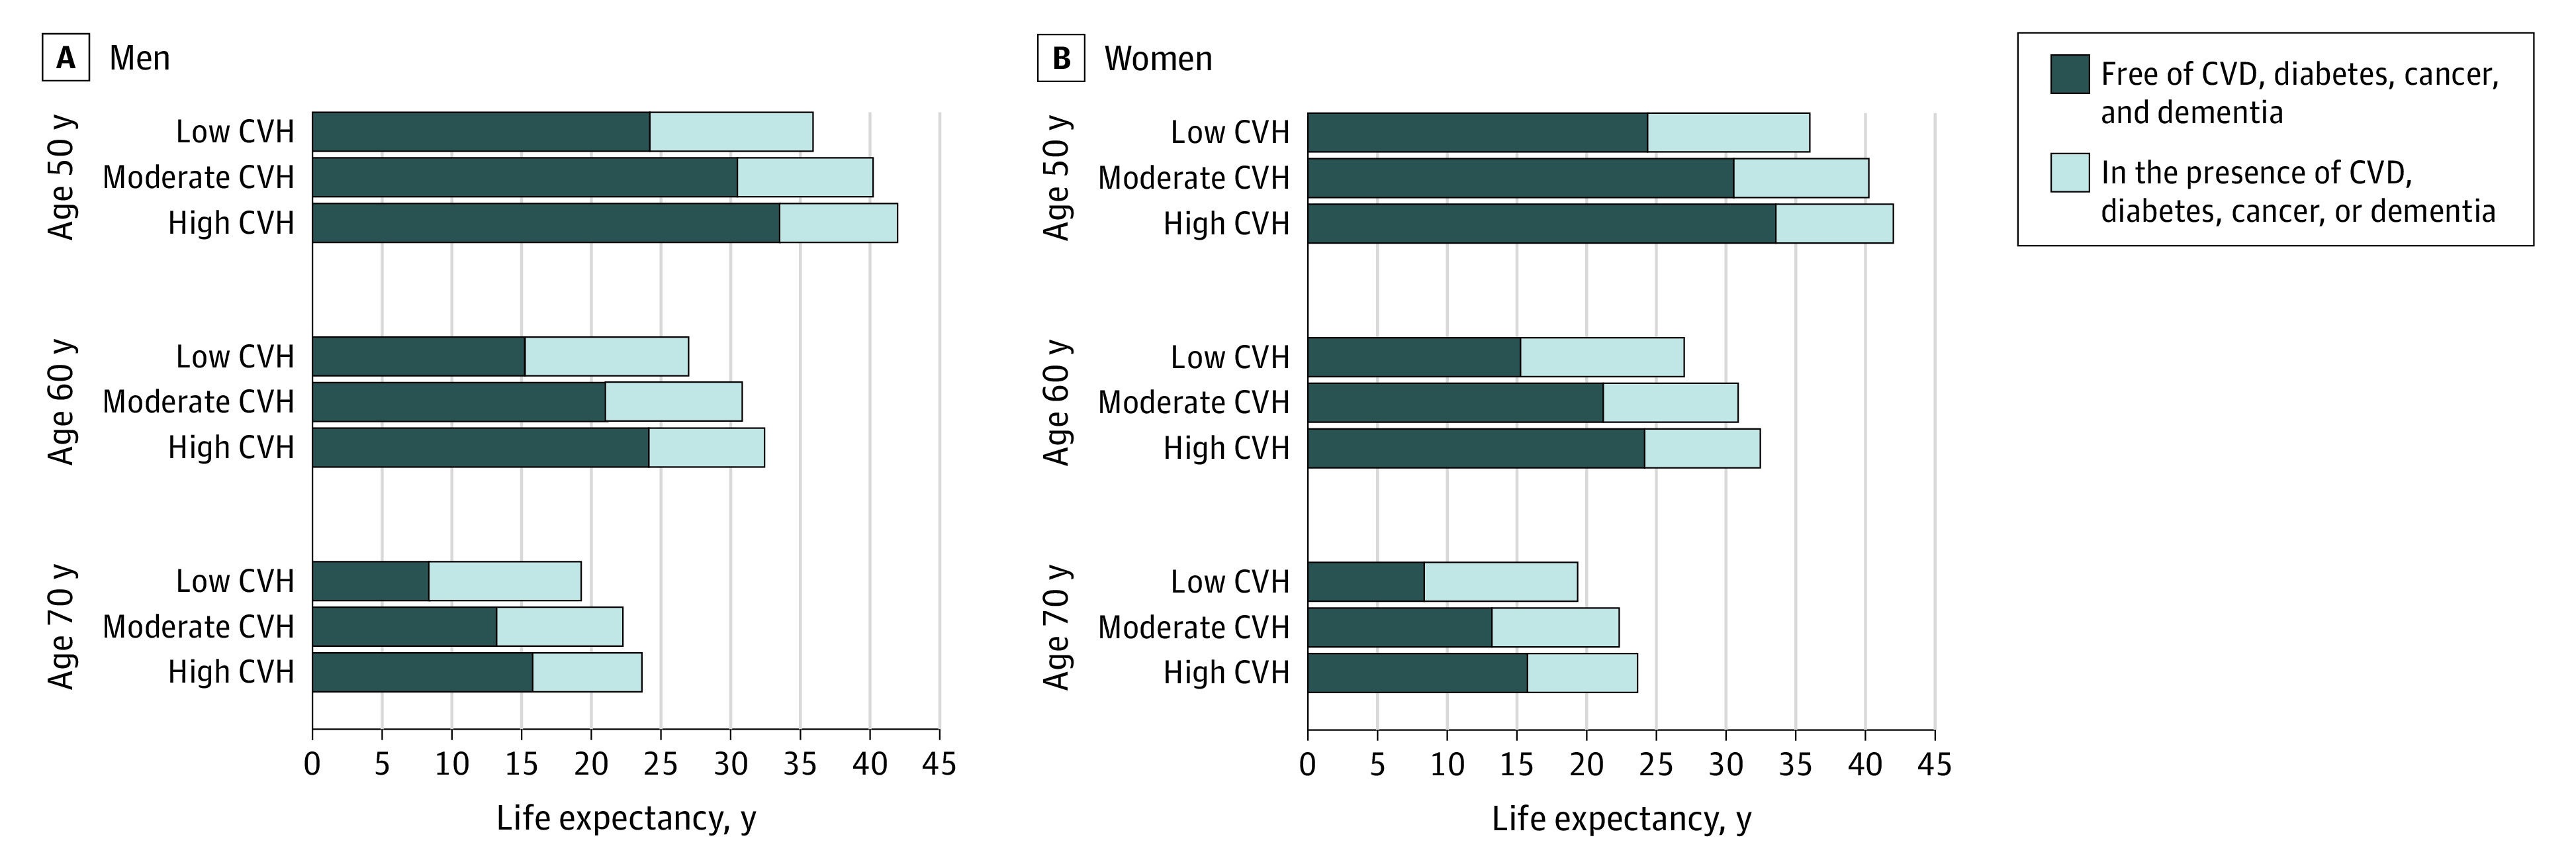
CVD indicates cardiovascular disease; CVH, cardiovascular health.
The estimated disease-free years at age 50 years was 21.5 (95% CI, 21.0-22.0), 25.5 (95% CI, 25.4-25.6), and 28.4 (95% CI, 27.8-29.0) years for men with low, moderate, and high CVH levels, respectively. The corresponding estimated disease-free years at age 50 years for women was 24.2 (95% CI, 23.5-24.8), 30.5 (95% CI, 30.4-30.6), and 33.6 (95% CI, 33.1-34.0) years. Equivalently, men with moderate or high CVH levels lived on average 4.0 (95% CI, 3.4-4.5) or 6.9 (95% CI, 6.1-7.7) years longer free of chronic disease at age 50 years, respectively, compared with men with low CVH levels. The corresponding longer years lived free of disease for women at age 50 years was 6.3 (95% CI, 5.6-7.0) or 9.4 (95% CI, 8.5-10.2) years (Table 2). The differences in years lived free of major chronic diseases between CVH levels were less pronounced at older index ages (eg, at age 60 or 70 years). However, until age 70 years, the estimated disease-free life expectancy remained significantly higher in the high CVH group than in the low CVH group in men (5.2 years; 95% CI, 4.6-5.8 years) and women (7.5 years; 95% CI, 6.8-8.1 years) (Figure 1). Moreover, life expectancy in the presence of major chronic diseases was shorter along with higher levels of CVH, despite the increase in total life expectancy across CVH levels (Figure 1 and Table 2). Similar results were observed if multiple imputation was used to impute data for missing covariates (eFigure 1 in Supplement 1).
Table 2. Total Life Expectancy and Years Lived With and Without Chronic Diseases at Age 50 Years by Cardiovascular Health (CVH) Level in Men and Womena.
| CVH level by Life’s Essential 8 score | Total, y (95% CI) | Free of CVD, diabetes, cancer, and dementia, y (95% CI) | In the presence of CVD, diabetes, cancer, or dementia, y (95% CI) | |||||
|---|---|---|---|---|---|---|---|---|
| LE at age 50 y | Difference | LE at age 50 y | Difference | LE, % | LE at age 50 y | Difference | LE, % | |
| Men | ||||||||
| Low CVH | 34.5 (33.3 to 35.6) | 0 [Reference]b | 21.5 (21.0 to 22.0) | 0 [Reference]b | 62.4 (60.8 to 64.3) | 12.9 (11.9 to 13.9) | 0 [Reference]b | 37.6 (35.7 to 39.2) |
| Moderate CVH | 37.2 (37.0 to 37.3) | 2.7 (1.5 to 4.0)c | 25.5 (25.4 to 25.6) | 4.0 (3.4 to 4.5)c | 68.6 (68.3 to 68.8) | 11.7 (11.6 to 11.8) | −1.3 (−2.2 to −0.2)c | 31.4 (31.2 to 31.7) |
| High CVH | 39.3 (38.2 to 40.3) | 4.8 (3.1 to 6.4)c | 28.4 (27.8 to 29.0) | 6.9 (6.1 to 7.7)c | 72.4 (70.8 to 74.2) | 10.9 (9.9 to 11.7) | −2.1 (−3.5 to −0.7)c | 27.6 (25.8 to 29.2) |
| Women | ||||||||
| Low CVH | 36.0 (34.6 to 37.3) | 0 [Reference]b | 24.2 (23.5 to 24.8) | 0 [Reference]b | 67.2 (65.2 to 69.3) | 11.8 (10.7 to 12.8) | 0 [Reference]b | 32.8 (30.7 to 34.8) |
| Moderate CVH | 40.2 (40.1 to 40.4) | 4.2 (2.8 to 5.7)c | 30.5 (30.4 to 30.6) | 6.3 (5.6 to 7.0)c | 75.8 (75.5 to 76.1) | 9.7 (9.6 to 9.9) | −2.1 (−3.2 to −0.9)c | 24.2 (23.9 to 24.5) |
| High CVH | 42.0 (41.3 to 42.6) | 6.0 (4.5 to 7.6)c | 33.6 (33.1 to 34.0) | 9.4 (8.5 to 10.2)c | 79.9 (78.9 to 80.9) | 8.4 (7.9 to 8.9) | −3.4 (−4.5 to −2.1)c | 20.0 (19.1 to 21.1) |
Abbreviations: CVD, cardiovascular disease; LE, life expectancy.
All LEs have been calculated with hazard ratios adjusted for age, sex, race and ethnicity, Townsend Deprivation Index, education level, household income, and depression status.
Differences are calculated using the low CVH group as the reference.
Differences are statistically significant at P < .05.
A sensitivity analysis was also performed by treating CVH as a continuous score (per 10 points). Compared with participants with low CVH levels (LE8 score <50), the estimated life expectancy free of disease at age 50 years was on average 2.3 (95% CI, 1.7-2.8) years longer among men and 1.9 (95% CI, 1.6-2.2) years longer among women for every 10-point increase in LE8 score (eTable 6 in Supplement 1). An additional sensitivity analysis was performed by excluding participants who became ill or died within 2 years, and the disease-free life expectancy was not appreciably changed (eFigure 2 in Supplement 1).
Additionally, the life expectancy free of diseases associated with each individual component of CVH was estimated separately. Except for non-HDL cholesterol score, all other individual components of CVH were each associated with longer life expectancy free of major chronic diseases in men and women, including the new component for CVH, high sleep health score (sleep duration). High sleep health scores had a statistically significant association with a longer disease-free life expectancy at age 50 years of 2.7 (95% CI, 1.8-3.5) years for women and 1.9 (95% CI, 1.2-2.8) years for men compared with their counterparts with low sleep health scores (eFigures 4 and 5 in Supplement 1).
Association of CVH and Socioeconomic Factors With Life Expectancy
Lower levels of socioeconomic status (low education attainment, high Townsend Deprivation Index, and low household income) were associated with shorter life expectancy free of diseases in both men and women (eTable 7 in Supplement 1). Men and women with low socioeconomic status had on average 0.6 to 1.4 and 0.4 to 1.6 shorter years of life expectancy free of diseases, respectively, at age 50 years compared with their counterparts with other socioeconomic status. In joint analysis of the association of CVH and socioeconomic status with estimated life expectancy free of diseases, longer life expectancy free of diseases at age 50 years was associated with higher CVH level in both low and other socioeconomic status. Notably, for participants who had high CVH levels, the life expectancies free of diseases between participants with low and other socioeconomic status were not statistically significantly different in both men (difference: 0.6 [95% CI, −1.1 to 2.5] years for education; 0.3 [95% CI, −1.6 to 0.9] years for Townsend Deprivation Index; and 0.9 [95% CI, −0.4 to 2.2] years for income) and women (difference: −0.9 [95% CI, −2.0 to 0.3] years for education; 0.3 years [95% CI, −0.7 to 1.2] years for Townsend Deprivation Index, and 0.6 [95% CI, −0.4 to 1.7] years for income) (Figures 2 and 3). Of note, the results were not appreciably changed if low socioeconomic status was defined by using a more extreme cut point for each indicator (eFigure 3 in Supplement 1).
Figure 2. Association of CVH and Socioeconomic Status With Estimated Life Expectancy With and Without Chronic Disease at Age 50 Years in Men.

Low education was defined as education attainment less than or equal to Certificate of Secondary Education or Ordinary Levels/General Certificate of Secondary Education or equivalent. CVD indicates cardiovascular disease; CVH, cardiovascular health.
Figure 3. Association of CVH and Socioeconomic Status With Estimated Life Expectancy With and Without Chronic Disease at Age 50 Years in Women.

Low education was defined as education attainment less than or equal to Certificate of Secondary Education or Ordinary Levels/General Certificate of Secondary Education or equivalent. CVD indicates cardiovascular disease; CVH, cardiovascular health.
Discussion
In this large, prospective cohort of middle-aged participants from the UK, we found that a high CVH level, defined by LE8 score, was associated with substantially longer life expectancy free of major chronic diseases (CVD, diabetes, cancer, and dementia) in both men and women. Men with moderate or high CVH levels lived on average 4.0 or 6.9 years longer free of chronic disease at age 50 years, respectively, compared with men with low CVH levels. The corresponding longer years lived free of disease for women were 6.3 or 9.4 years. Furthermore, the disease-free life expectancy was similar between low and other socioeconomic groups among participants with high CVH.
To our knowledge, this is the first study to evaluate the associations of CVH defined by the LE8 metric with life expectancy lived with and without major chronic diseases. The present results are consistent with previous findings on the association of the original CVH score (LS7 score) or lifestyle with life expectancy free of diseases.29,30,31,32,33,34,35,36 Hasbani et al found that better CVH, assessed by LS7 score, was consistently associated with longer life expectancy free of coronary heart disease among participants with different levels of genetic risk for coronary heart disease.35 Wilkins et al observed that participants with an optimal CVD risk factor profile (the optimal CVD risk factor profile was defined as concurrently meeting 4 factors: [1] blood pressure ≤120/80 mm Hg, [2] total cholesterol level <180 mg/dL, [3] no diabetes, and [4] no current smoking) had approximately 14 years longer life expectancies free of CVD at age 45 years compared with those who had at least 2 of 4 CVD risk factors.36 In the Nurses’ Health Study and the Health Professionals Follow-Up Study, men and women who adopted 4 or 5 healthy lifestyle factors (never smoking, normal weight, moderate to vigorous physical activity, no more than moderate alcohol drinking, and a healthy diet) had approximately 7.6 and 10 years longer life expectancies, respectively, free of CVD, diabetes, or cancer at age 50 years compared with those who adopted 0 healthy lifestyle factors.30 However, all participants in these cohorts were well educated and had relatively high socioeconomic status. In the Chicago Health and Aging Project, adhering to a healthy lifestyle was associated with a longer life expectancy free of dementia at age 65 years by 6.2 and 4.5 years for men and women, respectively, compared with their counterparts with an unhealthy lifestyle.29 This study extends previous findings by providing a broader estimate of longevity and the number of years lived with and without diseases associated with CVH using the LE8 score and a combination of 4 major chronic diseases.
For individual components of CVH, we observed that, except for non-HDL cholesterol score, all other individual components of CVH each had statistically significant associations with longer life expectancy free of major chronic diseases. Non-HDL cholesterol is a well-established predictor for CVD,37 and the observed null association of non-HDL cholesterol score may be partly due to the inclusion of cancer in the study outcomes, which account for 53% of overall nonfatal events. Moreover, a recent study from the National Health and Nutrition Examination Survey showed that both low and high non-HDL cholesterol levels had statistically significant association with higher risk of all-cause and cardiovascular mortality in men without statin therapy.38 Future studies are needed to investigate these relationships in other populations.
Intriguingly, we observed that the life expectancy in the presence of major chronic disease was shorter along with the higher levels of CVH, despite extended total life expectancy. The present data indicate that higher-level CVH extended more disease-free life span, thereby occupying the space for periods with diseases, leading to a compression of years of life lived with disease. These findings were directly supported by the results from the Chicago Heart Association Detection Project in Industry study, which showed that participants who had a high level of CVH in early middle age not only lived a longer life, but also a healthier life with a greater proportion of life span free of morbidity compared with counterparts with a low level of CVH.39 Taken together, these results indicate that a high CVH may not only prolong life span, but also improve the quality (disease free) of aging. Because total life expectancy cannot be extended indefinitely, these findings are of important implications for improvement of healthy aging.
Moreover, given the important role of socioeconomic status in optimizing and preserving CVH,8 we performed joint analyses of several relevant and well-established socioeconomic indicators and CVH in relation to the estimated life expectancies. Consistent with previous studies,15,16 we found that a lower socioeconomic status was associated with a shorter life expectancy. Of interest, the joint analyses showed that disparities in disease-free life expectancy due to low socioeconomic status might be considerably offset by a high CVH level. Indeed, we observed similar life expectancy free of diseases at age 50 years between participants with a high CVH level and low socioeconomic status and those with a high CVH level and relative higher socioeconomic status. These results did not change even when we used stricter cutoff points to define low socioeconomic status. These findings indicate that the gap in life expectancy between low socioeconomic status and others might be narrowed by improving CVH and, therefore, could contribute to reducing health inequalities.
Strengths and Limitations
The major strengths of this study include the use of the LE8 score for evaluating CVH, the large sample size, and calculation of disease-free life expectancy. This study also has several limitations. First, for the definition of disease-free life expectancy, we only included CVD, diabetes, cancer, and dementia. We selected these diseases based on their high prevalence in the population, rapid growth trends, and the well-established associations of CVH with such diseases, consistent with previous studies.10,11,12,13 Second, incident disease was diagnosed from hospital inpatient records in UK Biobank, whereas several previous studies have shown this routinely collected hospital admission data are sufficiently reliable for epidemiological research.25,26,27,28 Third, assessments of lifestyle factors were based on the self-reported questionnaire in UK Biobank and could be subject to measurement errors. Considering the large sample size and the validity of the measurement performance for the lifestyle and biomarker factors in UK Biobank (eAppendix 1 in Supplement 1), the potential measurement error may not change the conclusion. Fourth, information on most of the CVH metrics was available only at baseline, thus we did not consider potential changes of CVH during the follow-up period. The potential CVH changes are likely biased toward the null and would underestimate the strength of the association between CVH and life expectancy. Further research is necessary to evaluate such association. Fifth, the information on e-cigarettes was not available in UK Biobank, which could have led to a slight overestimation of the LE8 score in this study. Sixth, UK Biobank is not fully representative of the UK population regarding lifestyle and characteristics; however, a previous study showed that the valid assessment of exposure-disease associations may be widely generalizable and does not require participants to be representative of the population at large,40 though there is evidence of a “healthy volunteer” selection bias in UK Biobank. Seventh, the majority (97%) of the study participants were White European; whether the present findings could be generalized to other populations would be further testified. Eighth, the life tables created in this study were logged only from age 50 years, which might not represent the full life course.
Conclusions
In conclusion, this cohort study indicates that a high CVH level, evaluated by the LE8 score, is strongly associated with longer life expectancy, especially life expectancy free of major chronic diseases in both men and women. These findings support the improvement in population health by promoting high CVH levels, which may also narrow health disparities associated with socioeconomic status.
eAppendix 1. Exposure and outcome measurement of UK Biobank
eAppendix 2. Statistical method used for estimating the difference in life expectancy
eTable 1. Baseline characteristics between participants with complete data on LE8 score and those with missing
eTable 2. Methods for evaluating each individual CVH metric
eTable 3. ICD-10 Codes for each chronic disease
eTable 4. Associations between life essential 8 and risk of major chronic disease and mortality in women and men
eTable 5. Baseline characteristics between men and women
eTable 6. The estimates of life expectancy free of chronic disease at age 50 among participants with per 10-point increase LE8 score
eTable 7. Associations between socioeconomic status and life expectancy free of chronic diseases in men and women at age 50
eFigure 1. Life expectancies according to levels of cardiovascular health by using multiple imputation to impute data for missing covariates
eFigure 2. Life expectancies according to levels of cardiovascular health by excluding participants who became ill or died within 2 years
eFigure 3. Joint association of cardiovascular health and socioeconomic status in relation to estimated life expectancy with and without chronic disease at age 50 by using a more extreme definition of low socioeconomic status
eFigure 4. Estimated life expectancy at age 50 years with and without major chronic disease according to levels of individual component of cardiovascular health in men
eFigure 5. Estimated life expectancy at age 50 years with and without major chronic disease according to levels of individual component of cardiovascular health in women
eReferences
Data Sharing Statement
References
- 1.Kontis V, Bennett JE, Mathers CD, Li G, Foreman K, Ezzati M. Future life expectancy in 35 industrialised countries: projections with a Bayesian model ensemble. Lancet. 2017;389(10076):1323-1335. doi: 10.1016/S0140-6736(16)32381-9 [DOI] [PMC free article] [PubMed] [Google Scholar]
- 2.Dorsey ER, Elbaz A, Nichols E, et al. ; GBD 2016 Parkinson’s Disease Collaborators . Global, regional, and national burden of Parkinson’s disease, 1990-2016: a systematic analysis for the Global Burden of Disease Study 2016. Lancet Neurol. 2018;17(11):939-953. doi: 10.1016/S1474-4422(18)30295-3 [DOI] [PMC free article] [PubMed] [Google Scholar]
- 3.Boersma P, Black LI, Ward BW. Prevalence of multiple chronic conditions among US adults, 2018. Prev Chronic Dis. 2020;17:E106. doi: 10.5888/pcd17.200130 [DOI] [PMC free article] [PubMed] [Google Scholar]
- 4.Kingston A, Robinson L, Booth H, Knapp M, Jagger C; MODEM project . Projections of multi-morbidity in the older population in England to 2035: estimates from the Population Ageing and Care Simulation (PACSim) model. Age Ageing. 2018;47(3):374-380. doi: 10.1093/ageing/afx201 [DOI] [PMC free article] [PubMed] [Google Scholar]
- 5.Fortin M, Dubois MF, Hudon C, Soubhi H, Almirall J. Multimorbidity and quality of life: a closer look. Health Qual Life Outcomes. 2007;5(1):52. doi: 10.1186/1477-7525-5-52 [DOI] [PMC free article] [PubMed] [Google Scholar]
- 6.Lehnert T, Heider D, Leicht H, et al. Review: health care utilization and costs of elderly persons with multiple chronic conditions. Med Care Res Rev. 2011;68(4):387-420. doi: 10.1177/1077558711399580 [DOI] [PubMed] [Google Scholar]
- 7.Lloyd-Jones DM, Hong Y, Labarthe D, et al. ; American Heart Association Strategic Planning Task Force and Statistics Committee . Defining and setting national goals for cardiovascular health promotion and disease reduction: the American Heart Association’s strategic Impact Goal through 2020 and beyond. Circulation. 2010;121(4):586-613. doi: 10.1161/CIRCULATIONAHA.109.192703 [DOI] [PubMed] [Google Scholar]
- 8.Lloyd-Jones DM, Allen NB, Anderson CAM, et al. ; American Heart Association . Life’s essential 8: updating and enhancing the American Heart Association’s Construct of Cardiovascular Health: a presidential advisory from the American Heart Association. Circulation. 2022;146(5):e18-e43. doi: 10.1161/CIR.0000000000001078 [DOI] [PMC free article] [PubMed] [Google Scholar]
- 9.Yang Q, Cogswell ME, Flanders WD, et al. Trends in cardiovascular health metrics and associations with all-cause and CVD mortality among US adults. JAMA. 2012;307(12):1273-1283. doi: 10.1001/jama.2012.339 [DOI] [PMC free article] [PubMed] [Google Scholar]
- 10.Dong C, Rundek T, Wright CB, Anwar Z, Elkind MSV, Sacco RL. Ideal cardiovascular health predicts lower risks of myocardial infarction, stroke, and vascular death across whites, blacks, and Hispanics: the northern Manhattan study. Circulation. 2012;125(24):2975-2984. doi: 10.1161/CIRCULATIONAHA.111.081083 [DOI] [PMC free article] [PubMed] [Google Scholar]
- 11.Rasmussen-Torvik LJ, Shay CM, Abramson JG, et al. Ideal cardiovascular health is inversely associated with incident cancer: the Atherosclerosis Risk In Communities study. Circulation. 2013;127(12):1270-1275. doi: 10.1161/CIRCULATIONAHA.112.001183 [DOI] [PMC free article] [PubMed] [Google Scholar]
- 12.Fretts AM, Howard BV, McKnight B, et al. Life’s Simple 7 and incidence of diabetes among American Indians: the Strong Heart Family Study. Diabetes Care. 2014;37(8):2240-2245. doi: 10.2337/dc13-2267 [DOI] [PMC free article] [PubMed] [Google Scholar]
- 13.Sabia S, Fayosse A, Dumurgier J, et al. Association of ideal cardiovascular health at age 50 with incidence of dementia: 25 year follow-up of Whitehall II cohort study. BMJ. 2019;366:4414. doi: 10.1136/bmj.l4414 [DOI] [PMC free article] [PubMed] [Google Scholar]
- 14.Garmany A, Yamada S, Terzic A. Longevity leap: mind the healthspan gap. NPJ Regen Med. 2021;6(1):57. doi: 10.1038/s41536-021-00169-5 [DOI] [PMC free article] [PubMed] [Google Scholar]
- 15.Stringhini S, Carmeli C, Jokela M, et al. ; LIFEPATH consortium . Socioeconomic status and the 25 × 25 risk factors as determinants of premature mortality: a multicohort study and meta-analysis of 1.7 million men and women. Lancet. 2017;389(10075):1229-1237. doi: 10.1016/S0140-6736(16)32380-7 [DOI] [PMC free article] [PubMed] [Google Scholar]
- 16.Meara ER, Richards S, Cutler DM. The gap gets bigger: changes in mortality and life expectancy, by education, 1981-2000. Health Aff (Millwood). 2008;27(2):350-360. doi: 10.1377/hlthaff.27.2.350 [DOI] [PMC free article] [PubMed] [Google Scholar]
- 17.Kinge JM, Modalsli JH, Øverland S, et al. Association of household income with life expectancy and cause-specific mortality in Norway, 2005-2015. JAMA. 2019;321(19):1916-1925. doi: 10.1001/jama.2019.4329 [DOI] [PMC free article] [PubMed] [Google Scholar]
- 18.Sudlow C, Gallacher J, Allen N, et al. UK biobank: an open access resource for identifying the causes of a wide range of complex diseases of middle and old age. PLoS Med. 2015;12(3):e1001779. doi: 10.1371/journal.pmed.1001779 [DOI] [PMC free article] [PubMed] [Google Scholar]
- 19.Appel LJ, Moore TJ, Obarzanek E, et al. ; DASH Collaborative Research Group . A clinical trial of the effects of dietary patterns on blood pressure. N Engl J Med. 1997;336(16):1117-1124. doi: 10.1056/NEJM199704173361601 [DOI] [PubMed] [Google Scholar]
- 20.Wartolowska KA, Webb AJS. Midlife blood pressure is associated with the severity of white matter hyperintensities: analysis of the UK Biobank cohort study. Eur Heart J. 2021;42(7):750-757. doi: 10.1093/eurheartj/ehaa756 [DOI] [PMC free article] [PubMed] [Google Scholar]
- 21.Yousaf S, Bonsall A. UK Townsend Deprivation Scores From 2011 Census Data. UK Data Service; 2017. [Google Scholar]
- 22.Ma H, Zhou T, Li X, Maraganore D, Heianza Y, Qi L. Early-life educational attainment, APOE ε4 alleles, and incident dementia risk in late life. Geroscience. 2022;44(3):1479-1488. doi: 10.1007/s11357-022-00545-z [DOI] [PMC free article] [PubMed] [Google Scholar]
- 23.Zhou T, Sun D, Li X, Ma H, Heianza Y, Qi L. Educational attainment and drinking behaviors: Mendelian randomization study in UK Biobank. Mol Psychiatry. 2021;26(8):4355-4366. doi: 10.1038/s41380-019-0596-9 [DOI] [PMC free article] [PubMed] [Google Scholar]
- 24.Lourida I, Hannon E, Littlejohns TJ, et al. Association of lifestyle and genetic risk with incidence of dementia. JAMA. 2019;322(5):430-437. doi: 10.1001/jama.2019.9879 [DOI] [PMC free article] [PubMed] [Google Scholar]
- 25.Wilkinson T, Schnier C, Bush K, et al. ; Dementias Platform UK and UK Biobank . Identifying dementia outcomes in UK Biobank: a validation study of primary care, hospital admissions and mortality data. Eur J Epidemiol. 2019;34(6):557-565. doi: 10.1007/s10654-019-00499-1 [DOI] [PMC free article] [PubMed] [Google Scholar]
- 26.Eastwood SV, Mathur R, Atkinson M, et al. Algorithms for the capture and adjudication of prevalent and incident diabetes in UK Biobank. PLoS One. 2016;11(9):e0162388. doi: 10.1371/journal.pone.0162388 [DOI] [PMC free article] [PubMed] [Google Scholar]
- 27.Rannikmäe K, Ngoh K, Bush K, et al. Accuracy of identifying incident stroke cases from linked health care data in UK Biobank. Neurology. 2020;95(6):e697-e707. doi: 10.1212/WNL.0000000000009924 [DOI] [PMC free article] [PubMed] [Google Scholar]
- 28.Herrett E, Shah AD, Boggon R, et al. Completeness and diagnostic validity of recording acute myocardial infarction events in primary care, hospital care, disease registry, and national mortality records: cohort study. BMJ. 2013;346:f2350. doi: 10.1136/bmj.f2350 [DOI] [PMC free article] [PubMed] [Google Scholar]
- 29.Dhana K, Franco OH, Ritz EM, et al. Healthy lifestyle and life expectancy with and without Alzheimer’s dementia: population based cohort study. BMJ. 2022;377:e068390. doi: 10.1136/bmj-2021-068390 [DOI] [PMC free article] [PubMed] [Google Scholar]
- 30.Li Y, Schoufour J, Wang DD, et al. Healthy lifestyle and life expectancy free of cancer, cardiovascular disease, and type 2 diabetes: prospective cohort study. BMJ. 2020;368:6669. doi: 10.1136/bmj.l6669 [DOI] [PMC free article] [PubMed] [Google Scholar]
- 31.Franco OH, de Laet C, Peeters A, Jonker J, Mackenbach J, Nusselder W. Effects of physical activity on life expectancy with cardiovascular disease. Arch Intern Med. 2005;165(20):2355-2360. doi: 10.1001/archinte.165.20.2355 [DOI] [PubMed] [Google Scholar]
- 32.Nyberg ST, Batty GD, Pentti J, et al. Obesity and loss of disease-free years owing to major non-communicable diseases: a multicohort study. Lancet Public Health. 2018;3(10):e490-e497. doi: 10.1016/S2468-2667(18)30139-7 [DOI] [PMC free article] [PubMed] [Google Scholar]
- 33.O’Doherty MG, Cairns K, O’Neill V, et al. Effect of major lifestyle risk factors, independent and jointly, on life expectancy with and without cardiovascular disease: results from the Consortium on Health and Ageing Network of Cohorts in Europe and the United States (CHANCES). Eur J Epidemiol. 2016;31(5):455-468. doi: 10.1007/s10654-015-0112-8 [DOI] [PMC free article] [PubMed] [Google Scholar]
- 34.Stenholm S, Head J, Kivimäki M, et al. Smoking, physical inactivity and obesity as predictors of healthy and disease-free life expectancy between ages 50 and 75: a multicohort study. Int J Epidemiol. 2016;45(4):1260-1270. doi: 10.1093/ije/dyw126 [DOI] [PMC free article] [PubMed] [Google Scholar]
- 35.Hasbani NR, Ligthart S, Brown MR, et al. American Heart Association’s Life’s Simple 7: lifestyle recommendations, polygenic risk, and lifetime risk of coronary heart disease. Circulation. 2022;145(11):808-818. doi: 10.1161/CIRCULATIONAHA.121.053730 [DOI] [PMC free article] [PubMed] [Google Scholar]
- 36.Wilkins JT, Ning H, Berry J, Zhao L, Dyer AR, Lloyd-Jones DM. Lifetime risk and years lived free of total cardiovascular disease. JAMA. 2012;308(17):1795-1801. doi: 10.1001/jama.2012.14312 [DOI] [PMC free article] [PubMed] [Google Scholar]
- 37.Ridker PM, Rifai N, Cook NR, Bradwin G, Buring JE. Non-HDL cholesterol, apolipoproteins A-I and B100, standard lipid measures, lipid ratios, and CRP as risk factors for cardiovascular disease in women. JAMA. 2005;294(3):326-333. doi: 10.1001/jama.294.3.326 [DOI] [PubMed] [Google Scholar]
- 38.Zeng RX, Xu JP, Kong YJ, Tan JW, Guo LH, Zhang MZ. U-shaped relationship of non-HDL cholesterol with all-cause and cardiovascular mortality in men without statin therapy. Front Cardiovasc Med. 2022;9:903481. doi: 10.3389/fcvm.2022.903481 [DOI] [PMC free article] [PubMed] [Google Scholar]
- 39.Allen NB, Zhao L, Liu L, et al. Favorable cardiovascular health, compression of morbidity, and healthcare costs: forty-year follow-up of the CHA study (Chicago Heart Association Detection Project in Industry). Circulation. 2017;135(18):1693-1701. doi: 10.1161/CIRCULATIONAHA.116.026252 [DOI] [PMC free article] [PubMed] [Google Scholar]
- 40.Fry A, Littlejohns TJ, Sudlow C, et al. Comparison of sociodemographic and health-related characteristics of UK Biobank participants with those of the general population. Am J Epidemiol. 2017;186(9):1026-1034. doi: 10.1093/aje/kwx246 [DOI] [PMC free article] [PubMed] [Google Scholar]
Associated Data
This section collects any data citations, data availability statements, or supplementary materials included in this article.
Supplementary Materials
eAppendix 1. Exposure and outcome measurement of UK Biobank
eAppendix 2. Statistical method used for estimating the difference in life expectancy
eTable 1. Baseline characteristics between participants with complete data on LE8 score and those with missing
eTable 2. Methods for evaluating each individual CVH metric
eTable 3. ICD-10 Codes for each chronic disease
eTable 4. Associations between life essential 8 and risk of major chronic disease and mortality in women and men
eTable 5. Baseline characteristics between men and women
eTable 6. The estimates of life expectancy free of chronic disease at age 50 among participants with per 10-point increase LE8 score
eTable 7. Associations between socioeconomic status and life expectancy free of chronic diseases in men and women at age 50
eFigure 1. Life expectancies according to levels of cardiovascular health by using multiple imputation to impute data for missing covariates
eFigure 2. Life expectancies according to levels of cardiovascular health by excluding participants who became ill or died within 2 years
eFigure 3. Joint association of cardiovascular health and socioeconomic status in relation to estimated life expectancy with and without chronic disease at age 50 by using a more extreme definition of low socioeconomic status
eFigure 4. Estimated life expectancy at age 50 years with and without major chronic disease according to levels of individual component of cardiovascular health in men
eFigure 5. Estimated life expectancy at age 50 years with and without major chronic disease according to levels of individual component of cardiovascular health in women
eReferences
Data Sharing Statement