

SUMMARY
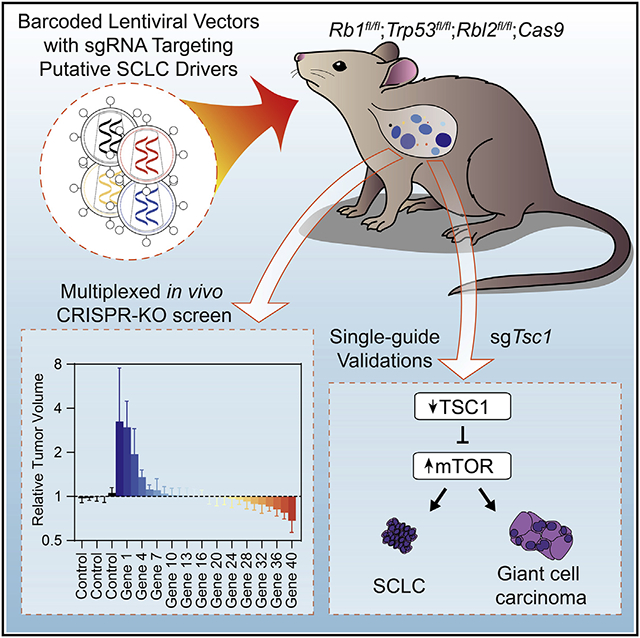
Small cell lung cancer (SCLC) is a lethal form of lung cancer. Here, we develop a quantitative multiplexed approach on the basis of lentiviral barcoding with somatic CRISPR-Cas9-mediated genome editing to functionally investigate candidate regulators of tumor initiation and growth in genetically engineered mouse models of SCLC. We found that naphthalene pre-treatment enhances lentiviral vector-mediated SCLC initiation, enabling high multiplicity of tumor clones for analysis through high-throughput sequencing methods. Candidate drivers of SCLC identified from a meta-analysis across multiple human SCLC genomic datasets were tested using this approach, which defines both positive and detrimental impacts of inactivating 40 genes across candidate pathways on SCLC development. This analysis and subsequent validation in human SCLC cells establish TSC1 in the PI3K-AKT-mTOR pathway as a robust tumor suppressor in SCLC. This approach should illuminate drivers of SCLC, facilitate the development of precision therapies for defined SCLC genotypes, and identify therapeutic targets.
Graphical Abstract
In brief
Lee et al. report a meta-analysis of published genomic studies to identify candidate drivers of SCLC development in patients. They implement a genetic screening approach in mouse models of SCLC to functionally validate mTOR signaling as a key driver of SCLC development, including the TSC1 tumor suppressor.
INTRODUCTION
Small cell lung cancer (SCLC) constitutes about 15% of all lung cancers and is one of the most aggressive forms of human cancer.1-3 Mortality in SCLC remains high, with a median survival of 8–10 months, as SCLC tumors are highly metastatic and become rapidly resistant to therapeutic approaches.4 The malignancy of SCLC cells is at least in part encoded by the complexity of genomic alterations induced by cigarette smoking.5 A major goal in the field has been to identify genetic drivers of SCLC growth, with the intent of eventually mirroring the successes with targeted therapies achieved in lung adenocarcinoma.6
Inactivation of the TP53 and RB1 tumor suppressor genes is a near universal event in SCLC. Other recurrent alterations in SCLC genomes include inactivation of tumor suppressors such as NOTCH family members or the MLL2 chromatin remodeler, and amplification of oncogenes such as MYC family transcription factors.5,7,8 Because of the high tumor mutation burden (TMB) in SCLC cells, however, distinguishing driver alterations from passengers remains challenging. For instance, KMT2D (encoding MLL2) is among the largest genes (>40 kb) in the human genome; consequently, mutations within this gene have not been classified as putative drivers in the largest published genomic analyses of SCLC.5 However, functional analyses strongly suggest that MLL2 loss is an important driver of SCLC.8,9
Genetically engineered mouse models of cancer provide a platform with which candidate cancer driver alterations can be functionally interrogated in a relevant in vivo context. The development of SCLC mouse models that recapitulate the inactivation of TP53 and RB1 in human SCLC has enabled the investigation of the role of additional candidate drivers of SCLC.10-12 However, thus far, progress in functionally validating potential driver mutations has been slow, with only a limited number of genes being tested since the first mouse model of SCLC was developed close to 20 years ago.7,11,13-18
Almost all genetically engineered mouse models of SCLC entail tumor initiation via the delivery of the Cre recombinase by an adenoviral vector (Ad-Cre) to delete conditional mutant alleles of Rb1 and Trp53.7,11-13,19 Notably, adenoviral vectors do not integrate into the DNA of the transduced cells. Although this may be beneficial in synchronizing the time of tumor initiation, it is unsuitable for experimental studies in which sustained transgene expression or genetic tagging of transduced cells is required. The recent development of Tuba-seq (tumor barcoding with ultradeep barcode sequencing) has enabled the functional investigation of pools of putative driver genes in a quantitative and scalable manner in mouse models of lung adenocarcinoma.20,21 In this approach, each cell transduced by a lentiviral-Cre vector (Lenti-sgRNA/Cre) and its descendants are stably labeled with a clonal identifier in the form of a random DNA barcode (BC) as well as a vector-specific identifier to distinctly label each unique genetic perturbation (i.e., sgRNA-ID or sgID). Thus, the importance of each sgRNA-targeted gene during tumor initiation and growth can be studied quantitatively. Furthermore, the presence of sgID allows simultaneous testing of multiple sgRNAs in one mouse with a pool of multiple lentiviral vectors. Although the Tuba-seq pipeline is in theory generalizable to any in vivo model that is amenable to lentiviral transduction and relies upon a conditionally regulated tumorigenic program, it has not yet been applied to study the genetic underpinnings of SCLC development.
Here we present a barcoded Lenti-Cre-based mouse model of SCLC, which allows tracking of SCLC tumor clones that develop entirely within the native environment. We show that pre-treatment with naphthalene is key to efficient initiation of SCLC using lentiviral vectors, which enables the analysis of many tumor genotypes with Tuba-seq. We quantitatively assessed the impact of 40 genes on the initiation and growth of SCLC in a minimal number of mice. Our work validates the PI3K-AKT-mTOR pathway as an important driver of SCLC development and demonstrates a key role for TSC1 in this pathway as a potent tumor suppressor in SCLC.
RESULTS
Naphthalene treatment enhances the development of SCLC in mice
Rb1fl/fl;Trp53fl/fl;Rbl2fl/fl (RPR2 or TKO [triple knockout]) mice model the most prevalent subtype of human SCLC (SCLC-A, with high expression of ASCL122). In this mouse model, tumor initiation is efficient and tumor progression relatively rapid (4–6 months) following intratracheal instillation with Ad-CMV-Cre.11,23 Although RPR2;R26LSL-tdTomato (RPR2T) mice developed SCLC upon transduction with Lenti-Cre (HIV-PGK-Cre backbone) (Figures 1A-1C), the overall tumor numbers were much lower than in RPR2 mutant mice using Ad-CMV-Cre despite similar titers (Table S1).11 Naphthalene is a compound that kills most club cells in the lung epithelium.24 On the basis of a previous report using naphthalene prior to lentiviral transduction to generate lung tumors in mice,25 we injected RPR2T mice with either naphthalene or vehicle (corn oil) two days prior to intratracheal delivery of Lenti-Cre (Figure 1A). Naphthalene pre-treatment significantly increased both tumor number and burden in this context (Figures 1B and 1C). Importantly, Lenti-Cre-initiated tumors showed histopathological characteristics of SCLC-A tumors, including high expression of ASCL1 and the neuroendocrine marker UCHL1 (Figures 1D, 1E, and S1A). Tumors initiated using a different Lenti-Cre vector backbone (FIV-CMV-Cre) showed similar SCLC-A histology (Figure S1B). In contrast to naphthalene pre-treatment, which increased tumor area also in the Ad-Cre model (Figures S1C and S1D), transduction with Ad-CMV-EGFP two days prior to Lenti-Cre transduction did not increase tumor number or area (Figures S1E and S1F), indicating that the pro-tumor effects of naphthalene are distinct from inflammatory responses upon adenoviral infection. Cell lines derived from RPR2T mutant tumors initiated by Ad-CMV-Cre or Lenti-Cre, with or without naphthalene treatment, formed floating clusters of cells in culture, similar to classical neuroendocrine SCLC cell lines (Figure S2A). Transcriptomic analysis confirmed expression of Ascl1 and canonical neuroendocrine markers, with low levels of other transcription factors typical of other SCLC subtypes22 (Figures 1F and 1G).
Figure 1. Naphthalene treatment enhances SCLC tumor development upon lentiviral Cre delivery.

(A) Workflow diagram for lentiviral Cre delivery (Lenti-Cre) used to generate SCLC in mice.
(B) Representative H&E staining of lung sections (with some intestine in the middle panel) from mice transduced with Ad-CMV-Cre (Ad-Cre) or HIV-PGK-Cre (Lenti-Cre) alone (NT) or following corn oil (vehicle [veh.]) or naphthalene (naph.) pre-treatment as in (A). Scale bar, 2 mm.
(C) Quantification of tumor burden and numbers from mice in (B) (n = 1 experiment, with n = 3 or 4 mice per condition). p values were calculated using one-way ANOVA with post-hoc Tukey test. *p < 0.05 and **p < 0.01.
(D) Representative H&E and immunohistochemistry (IHC) staining (brown signal) images of lung sections from mice transduced with HIV-PGK-Cre (Lenti-Cre) or Ad-CMV-Cre (Ad-Cre) as a control. Scale bar, 100 μm. Higher magnification images are shown in insets, where scale bar indicates 50 μm.
(E) Frequencies of CC10high versus CC10low tumors quantified from images of lung sections from mice transduced with HIV-PGK-Cre (Lenti-Cre) as in (D) (n = 2 mice). The analyses of tumors from mice infected with Ad-CMV-Cre (Ad-Cre) and Ad-cGRP-Cre are derived from data available in Yang et al. (2018).26
(F and G) Bar graphs of RNA expression of selected genes (RNA-seq) in SCLC cell lines (Naph. + Lenti-Cre, n = 1; Lenti-Cre, n = 1; Naph. + Ad-CMV-Cre, n = 1; Ad-CMV-Cre, n = 2) (Lenti-Cre: HIV-PGK-Cre). (F) Genes representing the four major SCLC subtypes. (G) Common neuroendocrine markers. Data represented as mean ± SEM (C) or mean ± SD (F and G).
SCLC tumors in the Ad-CMV-Cre RPR2 model can be initiated from cGRP+ neuroendocrine lung epithelial cells (the minority of tumors) as well as from another, unknown non-neuroendocrine cell type(s) of origin.26 The presence of cells with non-neuroendocrine features (i.e., expressing the club cell marker CC10 or the NOTCH target HES1) within tumors initiated after naphthalene pre-treatment and Lenti-Cre transduction suggested that these tumors likely mostly originate from the same non-neuroendocrine cell type(s) as Ad-CMV-Cre SCLC tumors26 (Figures 1D, 1E, S2B, and S2C).
Thus, naphthalene pre-treatment enhances SCLC development in the RPR2 model. Given the potential ease with which this Lenti-Cre platform could be used to inactivate genes of interest using sgRNAs and the CRISPR-Cas9 system, we next moved on to identifying potential regulators of SCLC etiology for further study.
A meta-analysis reveals both known and novel putative genetic regulators of SCLC
To identify potential key drivers of SCLC pathogenesis, we performed a meta-analysis of 37 studies published prior to October 1, 2021, on human SCLC (Figure 2A). We compiled data for not only genetic but also epigenetic and transcriptomic alterations in SCLC (Table S2). This analysis identified 3,285 potential driver gene candidates that were profiled in at least 250 patients, had an alteration frequency of ≥3%, and coded for proteins with amino acid residue lengths of ≤2,000 (Tables S3 and S4). Whereas the relative rarity of SCLC tumor whole-genome/exome sequencing studies meant that many of the genes were examined in 400 patients or fewer, a number of the more highly profiled cancer-related genes benefited from larger coverage, with the total patient numbers ranging from 500 to about 2,000 (Figure 2B). As expected, in this analysis, TP53 and RB1 ranked first and second, respectively, as the most frequently altered genes in SCLC (Figure 2C). Although several top candidate genes identified in this meta-analysis, such as COL11A1 and XPC, were previously identified to be recurrently mutated in SCLC or capable of initiating lung cancer upon inactivation,27,28 others, such as HCN1, PCDH15, and ERICH3, have been studied minimally in cancer contexts and represent novel tumor suppressor gene candidates in SCLC (Figure 2C). The 3,285 candidates were enriched in signaling and cancer-related pathways (Figure 2D), including an enrichment in factors implicated in PI3K-AKT-mTOR signaling (Figures 2D, S3A, S3B; Table S5). Furthermore, genes involved in DNA repair,29 Notch signaling,5 the WNT/Hippo-Merlin pathways,27 and epigenetic and transcriptional regulation8 showed high alteration rates (Figure 2E).
Figure 2. A meta-analysis of genetic studies identifies candidate drivers of SCLC development.

(A) Diagram of the meta-analysis workflow.
(B) Total number of genes represented when cutoff criteria are applied on total patient number (e.g., 2 genes were profiled in ≥2,000 patients, ~100 genes were profiled in ≥1,100 patients).
(C) Alteration frequencies of top 25 gene candidates in all available patient data profiled.
(D) Top 10 enriched pathways for genes altered in ≥3% of SCLC patients, were profiled in at least 250 patients and coded for protein with amino acid residue length of ≤2,000. Changing the gene cutoff criteria (e.g., removing amino acid residue length limits on protein products and keeping only genes that are expressed at ≥5 reads per kilobase of exon per million reads mapped [RPKM] in human SCLC) did not strongly affect the pathway enrichments. WikiPathways was used for enrichment analysis, with the word “pathways” removed in the figure for space considerations.
(E) Diagram of selected SCLC driver candidates placed in signaling pathways on the basis of (D). RB1 and TP53 were not represented to highlight other candidate drivers. Fill color indicates percentage of patients with alterations in that gene. p value was determined using Bonferroni step-down correction on two-sided hypergeometric test (D).
Overall, this meta-analysis identified several candidate tumor suppressor genes and cancer pathways, most of which have not been functionally validated in SCLC (Table S6).
Quantitative in vivo CRISPR screening to test tumor-suppressive activity in SCLC
To investigate gene candidates in the pathways identified in the meta-analysis in an in vivo model of SCLC, we combined the Lenti-Cre/naphthalene platform with tumor barcoding with ultradeep barcode sequencing, an approach initially developed to uncover cancer drivers in mouse models of lung adenocarcinoma.20,21 We prioritized 40 genes from the 3,285 candidates identified in the meta-analysis, focusing on genes in key signaling pathways in SCLC (26 genes across pools 1–3; several of these genes are highlighted in Figure 2E) and novel targets with high alteration rates in patients with SCLC (14 genes in pool 4; all candidate genes tested are marked boldface type in Table S6). We transduced RPR2T;H11LSL-Cas9 (RPR2T;Cas9) mice with four independent Lenti-sgTSG/Cre pools consisting of Lenti/Cre expressing inert sgRNAs (as controls) and Lenti-sgRNA/Cre vectors targeting putative tumor suppressor genes (TSGs) chosen for further study from the meta-analysis (Figure 3A). Lungs were harvested at different time points for the different pools to identify possible optimal times for analysis, with no clear difference observed between the time points (see below).
Figure 3. In vivo CRISPR screen uncovers both positive and negative effects of gene inactivation on SCLC growth and initiation.

(A) Diagram of the Tuba-seq workflow (n = 4 independent experimental pools, n = 3–22 mice per group).
(B) Lung fluorescence images from mice transduced with pool 1. tdTomato fluorescence and bright-field images were merged. Scale bar, 1 mm.
(C) Lung weights of mice (n = 3–5 per group) transduced with pool 1 at the time of collection.
(D) Log-normal mean tumor size (normalized to tumors with sgInerts) for each putative tumor suppressor gene targeting sgRNA in RPR2T;Cas9 mice. For each gene, each circle represents a unique sgRNA. p values are indicated with a color code.
(E) Tumor numbers (normalized to tumors with sgInerts as well as tumors in RPR2T mice for pools #1, 3 and 4 or RPR2L mice for pool #2) for each putative tumor suppressor gene targeting sgRNA in RPR2T;Cas9 mice. For each gene, each circle represents a unique sgRNA. p values are indicated with a color code.
The 95% confidence intervals were calculated using bootstrapping (D and E). p values were determined using two-sided unpaired t test (C) or bootstrapping followed by Benjamini-Hochberg correction (D and E). Data are represented as mean ± SEM (C) or mean ± 95% confidence interval (D and E). ns, not significant.
Both RPR2T;Cas9 and control RPR2T mice showed robust tumor formation upon Cre delivery as evidenced by tdTomato fluorescence; RPR2T;Cas9 mice showed a trend toward increased lung weights suggestive of increased tumor burden upon loss of tumor suppressor genes (Figures 3B, 3C, S4A, and S4B). To determine gene inactivation effects on SCLC initiation and progression, we isolated genomic DNA from bulk tumor-bearing lungs, PCR-amplified and sequenced the sgID-BC region in the Lenti-sgRNA/Cre vector, and analyzed the data. A previous study using RP;Ptenfl/fl conditional knockout mice showed that PTEN is a potent suppressor of SCLC development initiated by loss of p53 and RB.13 We found that inactivation of PTEN significantly increased tumor size and number in RPR2T;Cas9 mice, indicative of a potent tumor-suppressive role even with the additional inactivation of p130. Conversely, inactivation of the essential gene Pcna decreased tumor size and number, indicating that this pipeline has the ability to uncover both genotype-specific positive and negative effects on SCLC initiation and growth (Figures 3D and 3E).30 Distinct sgRNAs targeting the same gene consistently had similar effects in RPR2T;Cas9 mice (Figures 3D and 3E). In contrast, sgRNAs targeting candidate cancer drivers had little to no effect on tumor growth in RPR2T mice lacking Cas9 (Figures S4C and S4D), as expected, indicating that sgID-BC enrichment and depletion recapitulate on-target gene inactivation activity. Quantifying tumor growth using alternative metrics showed similar results, with Pten and Tsc1 inactivation increasing tumor burden and size and Arid1a and Pcna inactivation decreasing tumor burden in RPR2T;Cas9 mice, while sgRNAs had little to no effect in RPR2T mice (Figures S5A-S5D).
This Tuba-seq analysis identified several new genetic modifiers of SCLC growth (Figures 3D and 3E). First, Tsc1 inactivation increased both tumor number and size, suggestive of a strong tumor suppressor role. Second, inactivation of Arid1a or Arid1b decreased tumor number and size in two independent pools, suggesting that ARID1A- and ARID1B-containing complexes normally promote rather than restrict the growth of SCLC in this genetic context. Third, inactivation of Nkx2-1 led to increased tumor number but not size, suggesting a tumor-suppressive role for this lung lineage transcription factor at the time of tumor initiation. Finally, Kdm6a inactivation increased tumor number in pool 1, which was harvested at 14 weeks following tumor initiation, but showed a more modest effect in pool 2 collected at 21 weeks following tumor initiation, suggesting that KDM6A may be a more potent tumor suppressor in early lesions in this model.
Taken together, these results indicate that adapting the Tuba-seq approach to an autochthonous murine model of SCLC enables identification of oncogenic drivers and tumor suppressors, and greatly increases throughput of in vivo analyses.
Single-guide validation confirms TSC1 as a tumor suppressor in mouse SCLC
Having observed frequent alterations in the PI3K-AKT-mTOR signaling pathway in our meta-analysis (Figure 2E) and identified Tsc1 as a potent tumor suppressor gene in the RPR2 model using Tuba-seq (Figures 3D and 3E), we further investigated the role of TSC1 in SCLC. In single-guide experiments, RPR2T;Cas9 mice transduced with low titers of Lenti-sgTsc1/Cre vectors (to ensure visualization of individual tumors) (Table S1) developed both SCLC tumors and non-small cell lung cancer (NSCLC) tumors (giant cell lung adenocarcinoma) (Figures 4A-4C). Laser-capture microdissection followed by PCR amplification and sequencing of the sgID-BC in the Lenti-sgRNA/Cre vector showed that neighboring SCLC and NSCLC tumors arose from different clonal events (Figures S6A-S6C). Although PTEN, like TSC1, is a negative regulator of the PI3K-AKT-mTOR signaling pathway, RPR2T;Cas9 mice transduced with Lenti-sgPten/Cre did not develop NSCLC tumors, unlike mice transduced with Lenti-sgTsc1/Cre where 11 of 12 mice developed giant cell lung adenocarcinoma in addition to SCLC (Figures S7A-S7C). Although these Rb/p53/p130/Tsc1 (RPR2;Tsc1) mutant tumors provide a new model for giant cell lung adenocarcinoma, we did not investigate their biology further. The neuroendocrine SCLC compartment in the RPR2T;Cas9 mice with Tsc1 inactivation showed a trend toward increased tumor number and area compared with control RPR2T mice at this time point (Figures 4B and 4C).
Figure 4. TSC1 is a tumor suppressor in mouse SCLC.

(A) Representative H&E sections of lungs (and spleen and intestine) from RPR2T and RPR2T;Cas9 mice transduced with Lenti-sgTsc1/Cre sgRNA 1 (Lenti-sgTsc1-1/Cre) or Lenti-sgTsc1/Cre sgRNA2 (Lenti-sgTsc1-2/Cre) (n = 2 independent experiments, n = 2–6 mice per group). Mice were collected 18 weeks after transduction. Scale bar, 2 mm.
(B) Quantification of tumor size and number in (A).
(C) Representative H&E and immunohistochemistry (IHC) staining (brown signal) images of lung sections from mice transduced with Lenti-sgTsc1-1/Cre or Lenti-sgTsc1-2/Cre. Scale bar, 100 μm.
(D) Immunoassay of TSC1, S6, and phosphorylated S6 (p-S6) in cell lines derived from Tsc1-wild-type (WT) and Tsc1-knockout (KO) mouse tumors. Overexposed image is shown to confirm the knockout. HSP90 was used as a loading control.
(E) Quantification of TSC1 and phosphorylated S6 (p-S6) expression from (D). Values were normalized to Tsc1-WT cell lines.
(F) IC50 values of cell lines derived from Tsc1-wild-type (WT) and Tsc1-knockout (KO) mouse tumors with the mTOR inhibitor AZD8055.
(G) Proliferation curves of mouse SCLC lines following transduction with Lenti-EFS-EGFP-T2A-Bsd (EGFP-Bsd) or Lenti-EFS-hTSC1-T2A-Bsd (hTSC1-Bsd) lentiviruses, as indicated. Exponential (Malthusian) growth least squares fit was used to model growth curves.
p values were determined using two-sided unpaired t test (B, E, and F) or extra sum-of-squares F test (G). Data are represented as mean ± SEM (B), mean ± SD for n = 3 or 4 cell lines derived from independent tumors (E), mean ± SEM for IC50 values calculated from n = 3–8 biological replicates with n = 3 technical replicates (F), or mean ± SD for a representative experiment from n = 2 biological replicates with n = 3 technical replicates (G). ns, not significant. *p < 0.05, **p < 0.01, ***p < 0.001, and ****p < 0.0001.
A subset of the SCLC and NSCLC compartments had high levels of S6 phosphorylation compared with untransformed lung, suggesting elevated mTORC1 activity resulting from TSC1 inactivation (Figure 4C). S6 phosphorylation was also increased in Tsc1-knockout (KO) SCLC cell lines (derived from RPR2;Tsc1 tumors) compared with Tsc1-wild-type (WT) SCLC cell lines (Figures 4D, 4E, S7D, and S7E). In addition, Tsc1-KO cell lines displayed significantly higher sensitivity to pharmacological mTOR inhibition using AZD8055 compared with Tsc1-WT SCLC cell lines (Figure 4F). We further validated the tumor-suppressive function of TSC1 by re-expressing human TSC1 (hTSC1) in mouse tumor-derived cell lines via lentiviral transduction. Compared with the mouse SCLC cells expressing EGFP (as a control), SCLC cells (either wild-type or Tsc1-KO) ectopically expressing hTSC1 showed a significant decrease in their ability to expand in culture (Figures 4G, S8A, and S8B).
In the RP mouse model, Lenti-Cre initiates SCLC inefficiently even after naphthalene pre-treatment, with only 2–4 tumors visible at 42 weeks following transduction (Figures S9A and S9B). This small number of tumors and variable tumor development made quantification difficult and suggests that this mouse model may not be readily amenable to the Tuba-seq platform. RP;R26LSL-tdTomato;H11LSL-Cas9 (RPT;Cas9) mice also developed giant cell lung adenocarcinoma following transduction with Lenti-sgTsc1/Cre vector (Figures S9C and S9D), suggesting a broader role for TSC1 in regulating lung cancer development in different genetic contexts in mice.
The RP and RPR2 models represent the SCLC-A subtype. In contrast, Rb1fl/fl;Trp53fl/fl;H11LSL-MycT58A (RPM) mice represent the MYC-overexpressing SCLC-N subtype (NEUROD1-high).7 We generated RP;R26LSL-tdTomato/+;H11LSL-MycT58A/LSL-Ca9 (RPMT;Cas9) mice and tested whether Tsc1 acts as a tumor suppressor in this context also. As Lenti-Cre alone generates tumors in the RPM model in only 8 weeks, we transduced RPMT;Cas9 mice without naphthalene pre-treatment (Figure S10A). Compared with RPMT;Cas9 mice transduced with Lenti-sgNeo1/Cre (Lenti-sgInert/Cre), mice transduced with Lenti-sgTsc1/Cre had increased tumor number and area (Figures S10A-S10C). Of note, although RPMT;Cas9 mice transduced with Lenti-sgInert/Cre generated NEUROD1-high SCLC, as expected, there were areas of NSCLC histology in RPMT;Cas9 mice transduced with Lenti-sgTsc1/Cre, similar to our observations in the RPR2 and RP models (Figures 4A and S10D).
In all, our results indicate that TSC1 is a tumor suppressor in both ASCL1-high and NEUROD1-high subtypes of SCLC and that Tsc1 inactivation also induces NSCLC development in the RPR2, RP, and RPM genetic backgrounds.
TSC1/TSC2 are tumor suppressors in human SCLC
Following validation of Tsc1 as a tumor suppressor gene in mouse models of SCLC, we next sought to validate the tumor-suppressive activity of TSC1 in human SCLC cells. We also investigated TSC2, the obligate partner of TSC1 within the tuberous sclerosis complex.31 We generated populations of NCI-H82 SCLC cells independently expressing six unique combinations of short epitopes (epitope-combinatorial-tag [EpicTag]32) and performed Cas9-RNA ribonucleoprotein nucleofection to generate TSC1-KO (in EpicTag 1 cells), TSC2-KO (in EpicTag 2 cells), and wild-type control cell lines (EpicTag 3–6 cells, which received non-targeting Cas9-sgRNA ribonucleoprotein) (Figures 5A and S11A). We then pooled EpicTag 1~6 NCI-H82 cells, cultured them for 21 days, and measured the relative change in epitope-tag representation using cytometry by time of flight (CyTOF) (Figure 5A). In this assay, TSC1-KO and TSC2-KO cells showed significantly increased expansion relative to the wild-type cell lines, making up the majority of the pool by day 21 (Figures 5B and S11B). TSC1-KO and TSC2-KO cells also showed increased phosphorylated S6 compared with wild-type cell lines (Figures 5C and S11C). In contrast to the development of NSCLC upon loss of Tsc1 at the time of initiation in the mouse models, inactivation of TSC1 or TSC2 in NCI-H82 cells did not lead to any obvious fate change toward a non-neuroendocrine fate, with no differences observed in markers indicative of epithelial-to-mesenchymal transition (EMT) and non-neuroendocrine differentiation (Figure S11D). TSC1-WT and TSC1-KO NCI-H82 cell lines did not show significant differences in half maximal inhibitory concentration (IC50) values in response to the AZD8055 mTORC1/2 inhibitor (Figure S11E), suggesting that TSC1 inactivation at a later stage of tumor progression may not sensitize to mTOR inhibition.
Figure 5. TSC1 is a tumor suppressor in human SCLC.

(A) Schematic of the pool competition assay (n = 1 experiment with n = 3 technical replicates) using epitope-tagged (EpicTag) NCI-H82 cells.
(B) Stacked bar plot of percentage representation of epitope-labeled populations on days 7, 14, and 21. Day 0 sample was unavailable. Statistical significance indicated next to epitope tags represent comparisons between days 7 and 14, days 7 and 21, and days 14 and 21.
(C) Modal distribution of phosphorylated S6 (p-S6) signal across the different epitope-labeled populations. Percentage values represent the proportion of p-S6-high population. One representative experimental replicate from day 21 is shown; all other replicates across days exhibit similar p-S6 signal distribution to what is shown.
(D) Immunoassay of TSC1-mTOR pathway members in human SCLC cell lines. Graph shows the ratio of p-S6 to S6 signal following normalization to HSP90 loading control.
(E) Growth curves of human SCLC lines following transduction with Lenti-EFS-EGFP-T2A-Bsd (EGFP-Bsd) or Lenti-EFS-hTSC1-T2A-Bsd (hTSC1-Bsd) lenti-viruses. NCI-H446 hTSC1-Bsd cells never reached sufficient numbers for plating post-transduction and selection.
Data are represented as mean ± SD for a representative experiment out of n = 2 biological replicates (B), a representative experiment (D), or n = 3 (E) biological replicates with n = 3 technical replicates. Exponential (Malthusian) growth least squares fit was used to model growth curves in (E). p values were determined using repeated measures two-way ANOVA with Geisser-Greenhouse correction followed by post-hoc Tukey test (B) or extra sum-of-squares F test (E). ns, not significant. *p < 0.05, **p < 0.01, ***p < 0.001, and ****p < 0.0001.
To further investigate TSC1 tumor-suppressive effects in SCLC, we profiled 9 human SCLC cell lines for their TSC1, TSC2, and phosphorylated S6 protein levels (Figure 5D). Two cell lines, NCI-H1694 and NCI-H146, exhibited higher levels of phosphorylated S6 compared with other human SCLC; in particular, NCI-H146 showed lower expression of TSC1. We ectopically expressed hTSC1 or EGFP in these two cell lines alongside two other cell lines with low levels of S6 phosphorylation (NCI-H526 and NCI-H446) and monitored their growth (Figure S12A). Although the phosphorylation of mTOR pathway members did not change significantly following ectopic expression of hTSC1 under the conditions examined, hTSC1-expressing human SCLC cell lines nonetheless showed significantly slower growth compared with EGFP-expressing controls (Figures 5E and S12B). Overall, these results validate TSC1 as a tumor suppressor in human SCLC.
DISCUSSION
In this study, we adapted a multiplexed and quantitative method to perform medium-throughput analysis of gene inactivation in mouse models of SCLC. Using this approach, we identified TSC1 as a potent tumor suppressor in SCLC. The implementation of the Tuba-seq platform to mouse models of SCLC will greatly accelerate the functional analysis of candidate drivers of SCLC initiation and growth in vivo.
Multiplexed gene knockouts in mouse models to investigate candidate tumor suppressors and genetic heterogeneity in SCLC
Lentiviral barcoding approaches have enabled breakthroughs in understanding tumor heterogeneity, clonal evolution, and multiplexed gene perturbation effects.33-35 In this study, we show that several advantages of lentiviral barcoding (e.g., multiplexed CRISPR screening and clonality analysis using barcoding approaches) can be captured in an autochthonous, in vivo context to study SCLC development. The application of Tuba-seq to mouse models of SCLC allowed us to investigate the gene perturbation effects at a much faster rate than previously capable. However, the lack of histological information (as exemplified with Tsc1 loss and the appearance of a giant cell carcinoma phenotype) and necessity for single-guide validation remain limitations of this approach. Nonetheless, the cost and time savings from using this approach to identify SCLC drivers cannot be overstated, and future approaches could take advantage of the lentiviral barcoding further, tracking metastasis drivers and dissecting tumor clonal evolution, for instance.
Although the MSK-IMPACT panel remains a major resource for cancer genomics, including SCLC, its focus on readily actionable cancer targets (341–468 genes) is a limitation.36,37 We sought to supplement and extend the currently available dataset in our meta-analysis from 37 different studies by adding more whole-genome/whole-exome sequencing studies in addition to studies profiling specific sets of genes. Because we aggregated our datasets for the sake of simplicity rather than keeping the individual patient IDs intact (i.e., keeping only the total number of patients with a given alteration in a gene), the cBioPortal remains a distinct resource for examining mutual exclusivity and co-occurrence patterns. Nonetheless, our meta-analysis database simplifies the search for novel cancer drivers by organizing aggregated patient alteration data alongside other useful metrics such as protein information for coding genes, RNA sequencing (RNA-seq) expression datasets, and dependency scores from the Cancer Dependency Map (DepMap) project.
Increasing evidence from human tumor sections and mouse models indicates that intra-tumoral heterogeneity on the basis of epigenetic/transcriptional program in SCLC cells plays a significant role in the growth of SCLC tumors and their response to treatment.10,38-41 In contrast, our understanding of the genetic determinants of SCLC development has been hampered by limited tumor samples and the complex genome of these tumors. The development of medium-throughput pre-clinical approaches such as described here will contribute to a more rapid functional validation of genes and pathways relevant to SCLC in the clinic. A future goal of the field will be to explore how epigenetic and genetic mechanisms together mold SCLC development and response to various therapies to identify more personalized treatment strategies.
The TSC1/2-mTOR pathway in SCLC
TSC1, alongside its complex partner TSC2, was first identified as a key gene whose mutation causes tuberous sclerosis complex (TSC).42 TSC patients present with several clinical features, including skin lesions, hamartomas, and subependymal giant cell tumor of the brain.42 The development of tumors in TSC patients, particularly giant cell tumors, is thought to stem from TSC1-TSC2 complex’s role as a negative regulator of the mTOR pathway, which controls multiple pathways including cell growth.43-45 We observed mTORCI activation and development of giant cell carcinoma of the lung upon Tsc1 inactivation in our mouse models of SCLC. In a recent preprint describing 3,600 SCLC tumor specimens analyzed for genomic alterations in ~300 cancer genes, ~1.5% and 0.7% of patients displayed alterations in TSC1 and TSC2, respectively.46 As we did not examine events such as silencing due to methylation or complex chromosomal rearrangements, it is possible that these percentages underestimate the prevalence of TSC1/TSC2 alteration in SCLC patients. Although only about 3%–4% of SCLC patients have TSC1 alterations according to our meta-analysis, a substantial fraction of SCLC patients possess PI3K-AKT-mTOR pathway alterations (e.g., 9%–10% patients with TSC2 alterations, 11%–12% with PTEN alterations). Although cases of combined SCLC/giant cell carcinoma of the lung are rare in the clinic,47,48 our data suggest that these tumors may arise from dysregulation of the TSC1/TSC2-mTOR axis alongside RB/p53 loss of function.
Our data in mice and human cells show the strong tumor-suppressive role of TSC1 in SCLC, as suggested by previous in vitro CRISPR-Cas9 knockout screens in mouse SCLC cell lines.49 Several recent pre-clinical studies using SCLC models have also indicated that mTOR inhibition could be a viable strategy to treat SCLC patients, especially those resistant to chemotherapy. Although rapamycin analogs (e.g., temsirolimus and RAD001), which preferentially inhibit mTORC1 rather than mTORC2, were met with little success in phase II clinical trials,50,51 ATP-competitive mTOR inhibitors (e.g., AZD8055), which inhibit both mTORC1 and mTORC2, may be more promising. mTOR inhibition using AZD8055 led to decreased tumor growth and sensitization to cisplatin/etoposide therapy in a subset of patient-derived xenograft models,52 and RICTOR amplification, which occurs in 10%–15% of SCLC patients, was also shown to predict response to mTOR inhibitors in SCLC cell lines.53 Data from our study with mouse cell lines further suggest that AZD8055 may produce greater therapeutic benefit for patients whose tumors lost TSC1 function early in the course of their disease. Furthermore, mTOR inhibition rescued the efficacy of Bcl-2 inhibition as well as WEE1 inhibition in in vivo models of SCLC,54,55 leading to an ongoing phase I/II clinical trial (NCT03366103). Taken together with our data, these results suggest that ATP-competitive mTOR inhibitors may produce therapeutic benefit in patients with alterations in the PI3K-AKT-TSC1/2-mTOR axis.
Limitations of the study
Aside from TSC1, most of the driver gene candidates tested in this study did not score significantly in the Tuba-seq analysis. Although it is possible that the non-scoring genes are truly passengers, three other possible explanations exist for the high prevalence of non-scoring genes: (1) the loss of Rbl2 in the RPR2 model is already such a strong tumor-suppressive event that it masks the tumor growth effects of knocking out other tumor suppressor genes; (2) alterations in some genes/pathways are strong drivers of SCLC development (e.g., loss of RB, loss of p53, activation of the MYC family, alterations in the PTEN pathway), whereas others have more minor roles that our approach did not detect at the time point examined; and (3) some alterations may play a larger (or different) role during tumor progression rather than tumor initiation. ARID1A, for example, has been shown to play a context-dependent role in liver cancer, where homozygous loss at initiation protected against HCC initiation but loss following initiation accelerated tumor growth and metastasis.56 Because our model possesses CRISPR-Cas9 activity at tumor initiation, the decrease in tumor size and number with sgRNAs against Arid1a and Arid1b is suggestive of a similar necessity for BAF complex activity at SCLC initiation and not necessarily indicative of their activity during progression. This difficulty in uncoupling the effect of gene inactivation at initiation with its role at progression may limit our interpretation of the roles that non-scoring candidate drivers may play in SCLC progression. Future studies, including investigating additional time points during cancer progression, are needed to uncover whether ARID1A/ARID1B and any of the non-scoring proposed candidate drivers show context-dependent or more nuanced roles in SCLC initiation and progression.
STAR★METHODS
RESOURCE AVAILABILITY
Lead contact
Further information and requests for resources and reagents should be directed to and will be fulfilled by lead contact, Julien Sage (julsage@stanford.edu).
Materials availability
Plasmids generated in this study have been deposited to Addgene (plasmids #193198–193249).
Data and code availability
RNA-seq, LCM sequencing, and Tuba-seq data are available through Gene Expression Omnibus (GEO: GSE198637). CyTOF data is available through Cytobank Community: #103066. Gene dependency data from the Cancer Dependency Map are publicly available at www.depmap.org. Protein data from UniProtKB are publicly available at www.uniprot.org. Original, raw data and images have been deposited at Mendeley and are publicly available (Mendeley Data: https://doi.org/10.17632/nr4ssx645r.12). All original code used to analyze data and generate figures are available at GitHub: https://github.com/noahlee577/SCLC_Tuba-seq (release v1.0.0 is archived at Zenodo: https://doi.org/10.5281/zenodo.7430243). All other data are available in the Supplementary Information, or from the corresponding author upon reasonable request. Any additional information required to re-analyze the data reported in this work is available from the lead contact upon request.
EXPERIMENTAL MODEL AND SUBJECT DETAILS
Ethics statement
Mouse maintenance and experiments were conducted in accordance with practices prescribed by the NIH, the Institutional Animal Care and Use Committee (IACUC), and Association for Assessment and Accreditation of Laboratory Animal Care (AAALAC). The study protocol was approved by the Administrative Panel on Laboratory Animal Care (APLAC) at Stanford University (protocol #APLAC-13565).
Mice and tumor initiation
Rb1fl/fl;Trp53fl/fl;Rbl2fl/fl (RPR2) mice has been described previously.11 RPR2 mice were crossed with KrasLSL-G12D/+;Trp53fl/fl;R26LSL-tdTomato/LSL-tdTomato;H11LSL-Cas9/LSL-Cas9 (KPTC) mice to generate RPR2;R26LSL-tdTomato/LSL-tdTomato;H11LSL-Cas9/LSL-Cas9 (RPR2T;Cas9) and RPR2;R26LSL-tdTomato/LSL-tdTomato (RPR2T) mice. Rb1fl/fl;Trp53fl/fl;R26LSL-tdTomato/+;H11LSL-MycT58A/LSL-Cas9 (RPMT;Cas9) mice were generated by crossing Rb1fl/fl;Trp53fl/fl;H11LSL-MycT58A/LSL-MycT58A (RPM) mice with Rb1fl/fl;Trp53fl/fl;R26LSL-tdTomato/LSL-tdTomato;H11 LSL-Cas9/LSL-Cas9 (RPT;Cas9) mice. 8- to 12-weeks-old mice were instilled with Lenti-sgRNA/Cre viruses via intratracheal delivery to generate lung tumors as previously described.68 Both male and female mice were used in this study. Viral titers used for experiments are detailed in Table S1. Ad5-CMV-Cre (Ad-Cre) and FIV-CMV-Cre (Lenti-Cre) were supplied by University of Iowa Viral Vector Core (VVC-U of Iowa-5 and VVC-U of Iowa-28).
Naphthalene (Sigma-Aldrich 184500) was dissolved into corn oil vehicle (Sigma-Aldrich C8267) at a concentration of 50 mg/mL and administered to mice via intraperitoneal (i.p.) injections at a dosage of 200 mg/kg.
Cell line models
Human SCLC cell lines (NCI-H1694, ATCC CRL-5888; NCI-H146, ATCC HTB-173; NCI-H2227, CRL-5934; NCI-H1876, CRL-5902; NCI-H889, CRL-5817; NCI-H526, CRL-5811; NCI-H2081, CRL-5920; NCI-H446, HTB-171; NCI-H524, CRL-5831; and NCI-H82, ATCC HTB-175) and mouse SCLC cell lines (KP11, described in,57 KP22, 12N1G, and N2N1G, described in15) were cultured in RPMI 1640 media (Corning 15-040-CV) supplemented with 10% bovine growth serum (BGS, Thermo Fisher Scientific SH3054103HI) and 1% Penicillin-Streptomycin-Glutamine (Gibco 10378–016). 293T cells used for lentiviral preparation were cultured in Dulbecco’s Modified Eagle Medium (DMEM) High-Glucose medium (Gibco 11965–118) supplemented with 10% fetal bovine serum (Omega Scientific FB-01). All cell lines were confirmed to be negative for mycoplasma (MycoAlert Detection Kit, Lonza LT07-418).
New mouse tumor-derived cell lines are described in Table S7. Briefly, tumor samples were microdissected and minced using a razor blade, digested with trypsin at 37°C for 5 minutes, quenched with RPMI media containing bovine growth serum (BGS), and centrifuged at 1000 RPM for 5 minutes to remove the supernatant. The pellet was resuspended in RPMI media, filtered through 40 μm membrane, and cultured at 37°C. Resulting tumor spheroids were checked for tdTomato fluorescence using Leica fluorescence microscope and imaged with LAS X software (v3.7.1, Leica Microsystems, Wetzlar, Germany). In vitro fluorescence images were pseudo-colored using Fiji (v1.53f51).63
METHOD DETAILS
Drug sensitivity and growth curve assays
For the drug sensitivity assays, cells were plated at a density of 10K cells per well in 100 μL media in 96-well plates on Day 0. On Day 1, 100 μL RPMI media containing 2X concentration of AZD8055 (Selleckchem S1555) were added to wells, and 20 μL of alamarBlue™ Cell Viability Reagent (Invitrogen DAL1100) was added to the wells on Day 4. Well fluorescence (530 nm excitation, 590 nm emission) was measured following 5 – 6 h of incubation at 37°C.
For EGFP- or hTSC1-expressing mouse and human SCLC cell lines, cell lines were transduced with lentiviral vectors (see below), selected with 16 μM blasticidin (Gibco A1113903) after 1–2 days, and plated for experiments 5 days following blasticidin selection, confirmation of EGFP fluorescence in EGFP-expressing lines, and <1% viability in un-transduced control cell lines with trypan blue cell counting. For growth curve experiments, cells were plated at a density of 100K cells in 1 mL RPMI media per well in a 6-well plate on Day 0. Cells were imaged using Leica fluorescence microscope controlled via LAS X software (v3.7.1, Leica Microsystems, Wetzlar, Germany). As with mouse tumor-derived cell lines, in vitro fluorescence images were pseudo-colored using Fiji (v1.53f51).63
Ribonucleoprotein nucleofection with Cas9
Control and targeting sgRNAs were generated as previously described.32 Briefly, for each region of interest, three sgRNAs were designed to hybridize approximately 150 bases apart, and 100 pmol of each sgRNA was resuspended in Tris-EDTA (Synthego) and mixed at a 1:1:1 ratio. In a 96-well v-bottom plate, 3 μL of the sgRNA (total 300 pmol) was added to 12 μL of SE buffer (Lonza V4XC-1032). In another well, 0.5 μL of Alt-R® S.p. Cas9 (Integrated DNA Technologies 1081059) was added to 10 μL of SE buffer, and the Cas9 mix was added to the sgRNA solution, mixed thoroughly, and incubated at 37°C for 15 minutes to form the RNP solution. 1 × 10⁶ NCI-H82 cells were resuspended in 5 μL of SE Buffer, and cells were nucleofected with Lonza 4D-Nucleofector™ X Unit (Lonza AAF-1002X) with the EN150 program immediately following addition of the RNP solution. Following the nucleofection, warm RPMI media was added to the cells, and cells were incubated at 37°C for 15 minutes then transferred to a 24-well plate.
Cell preparation for CyTOF
Frozen cell lines in RPMI media supplemented with 10% BGS and 10% DMSO (Fisher Scientific BP231) were thawed, and 3 million cells per sample were washed once with PBS. The cells were then fixed with 1.6% formaldehyde at room temperature for 20 minutes. We are using palladium (Pd) barcoding to pool up to 20 different samples and reduce tube-to-tube variability. Therefore, cells were washed twice with PBS before permeabilization with PBS and 0.02% Saponin (Sigma-Aldrich 84510) at 4°C. 11 μL of Pd barcode was added to 1 mL of PBS and 0.02% Saponin, of which 900 μL were used to resuspend each sample. This mix was incubated at room temperature for 15 min, washed three times with Cell Staining Media (CSM, PBS with 0.5% BSA (Thermo Fisher Scientific B14), 0.02% NaN3 (Fisher Scientific MP210289110)), and then pooled into a single tube for staining with metal-labeled antibodies (Table S8) for 1 hour at room temperature. Antibodies against Flag, mCherry, GFP, VSV, NWS, Prot C, Ha, AU1, Synaptophysin, Vimentin, S6, GMNN, EZH2, pYAP, CDT1, pI3K, HES1 were conjugated with MAXPAR X8 Multimetal Labeling Kit (Fluidigm 201300) according to the manufacturer’s protocol. Antibodies were diluted to 0.2 μg/mL and titered. Cells were stained with a range of 1:100 to 1:200 with each of the different antibodies in a staining volume of 150 μL (~3 × 10⁶ cells/mL). After antibody staining, the cells were washed twice with CSM and then incubated overnight at 4°C with an iridium-containing intercalator (Fluidigm 201192B) in PBS with 1.6% formaldehyde. The cells were then washed twice with water, diluted with water and 10 μL/mL EU Four Element Calibration Beads (Fluidigm 201078) to ~106 cells/mL, and filtered through a 70-μm membrane (Falcon 352350) just before analysis by mass cytometry.
Lentiviral vector generation and titering
Lentiviral vectors containing individual sgRNAs, barcode sequences, and Cre recombinase were generated as previously described, using unbarcoded Lenti-U6-sgNeo1/PGK-Cre vector as the template.20 Briefly, sgRNA sequences were picked based on an aggregated score from top hits on Desktop Genetics (formerly www.deskgen.com) and GPP sgRNA Designer offered by the Broad Institute (https://portals.broadinstitute.org/gpp/public/analysis-tools/sgrna-design). Several of the sgRNAs used have been validated in previous studies.20,59-62 Detailed sgRNA and barcoding primer sequence information can be found in Table S9. Lenti-sgRNA/Cre plasmids were barcoded individually with an 8-nucleotide ID specific to each sgRNA (sgID) and 20-nucleotide random barcode sequence (BC), and each plasmid was packaged separately in 293T cells via co-transfection with polyethylenimine alongside pCMV-VSV-G (Addgene #8454) envelope plasmid and pCMV-dR8.2 dvpr (Addgene #8455) packaging plasmid.58 Sodium butyrate (Sigma-Aldrich B5587-5G) was added eight hours following the transfection to increase viral titer. Viral supernatant was collected at 48 and 60 hour time points following transfection, filtered using 0.45 μm PES syringe filter (Millipore SLHP033RB), concentrated via ultracentrifugation at 25,000 RPM for 90 minutes at 4°C, resuspended in PBS overnight, and titered using LSL-YFP mouse embryonic fibroblasts (MEFs) as previously described.20
For the hTSC1 expression experiments, VectorBuilder was contracted to generate Lenti-EFS-EGFP-T2A-Bsd (Addgene #193198) and Lenti-EFS-hTSC1-T2A-Bsd (Addgene #193199) plasmids. Plasmids were co-transfected and packaged in the same way as the Lenti-sgRNA/Cre plasmids, with some differences: 1) sodium butyrate was not added and 2) the viral supernatant was collected at a 72-hour time point and added directly to the cells to be transduced after being filtered using 0.45 μm PES syringe filter.
Histology, immunohistochemistry, and immunofluorescence
Mouse tissues were dissected from animals immediately following euthanasia. Lungs were inflated with 10% neutral buffered formalin (NBF), and all tissues were fixed in 10% NBF overnight following a brief rinse in PBS. Tissues were transferred to 70% ethanol prior to paraffin embedding and processing.
Prior to immunohistochemistry, paraffin sections were rehydrated by 5-minute serial immersion in Histo-Clear, 100% ethanol, 95% ethanol, 70% ethanol, and water. Antigen retrieval was performed by immersing rehydrated slides in citrate-based antigen unmasking solution (H-3300, Vector Laboratories) at boiling temperature for 15 minutes. To block endogenous peroxidase activity, the slides were then incubated in 3% hydrogen peroxide for 1 hour. Slides were washed in PBS-T (PBS +0.1% Tween-20), blocked using blocking buffer (5% horse serum in PBS-T) for 1 hour at room temperature, and incubated with primary antibodies at 4°C overnight. Following incubation, slides were washed in PBS-T, incubated with the secondary antibody for 1 hour at room temperature, and developed using DAB reagent (Vector Laboratories SK-4100) following another series of PBS-T washes. For HES1, ImmPRESS® Excel Amplified Polymer Staining Kit, Anti-Rabbit IgG, Peroxidase (Vector Laboratories MP-7601) or TSA Plus Fluorescein kit (Akoya Biosciences NEL741001KT) were used to amplify signal for immunohistochemistry or immunofluorescence, respectively. Following development, slides were counterstained using hematoxylin (Sigma-Aldrich HHS32), dehydrated by 5-minute serial immersions in 70% ethanol, 100% ethanol and xylene, and mounted with Refrax Mounting Medium (Anatech Ltd 711).
For immunofluorescence, all the same steps as immunohistochemistry were followed until the secondary antibody step; slides were incubated with fluorescent secondary antibodies diluted in blocking buffer (5% horse serum in PBS-T) for 1 hour, washed in PBS-T, and stained with 0.6 nM DAPI in PBS for 10 minutes at room temperature. Slides were mounted with Fluoromount-G (SouthernBiotech 0100–01) and stored in 4°C overnight or −20°C for a few days before visualization.
The following antibodies were used for immunohistochemistry and immunofluorescence: ImmPRESS HRP Horse anti-Rabbit IgG (Vector Laboratories MP-7801-15), ImmPRESS HRP Horse anti-Mouse IgG (Vector Laboratories MP-7802-15), Alexa Fluor 594 Donkey anti-Goat IgG (H + L) Cross-Adsorbed Secondary Antibody (Invitrogen A11058), Alexa Fluor 488 Donkey anti-Rabbit IgG (H + L) Highly Cross-Adsorbed Secondary Antibody (Invitrogen A-21206), anti-RFP (for immunohistochemistry, Rockland 600-401-379, 1:200), anti-RFP (for immunofluorescence, MyBioSource MBS448122, 1:200), anti-CC10 (E–11, Santa Cruz sc-365992, 1:200), anti-HES1 (D6P2U, CST 11988S, 1:200), anti-NEUROD1 (Abcam ab109224, 1:200), anti-UCHL1 (Sigma-Aldrich HPA005993, 1:2,500), anti-phospho-S6 (Ser235/236, CST 2211, 1:200), and anti-MASH1 (BD Biosciences 556604, 1:200).
Quantitative immunoassay analysis
Cells were lysed in RIPA buffer (50 mM Tris-HCl pH 7.5, 1% NP40, 2 mM EDTA, 100 mM NaCl) supplemented with cOmplete™ ULTRA Protease Inhibitor Cocktail tablets (Roche 5892970001) and PhosSTOP™ phosphatase inhibitor tablets (Roche 4906845001). Pierce BCA Protein Assay Kit was used to quantify total protein concentration (Thermo Fisher Scientific 23227). For quantitative immunoassays, Simple Western™ assay was performed on the Wes™ system (ProteinSimple) according to manufacturer’s protocol, with 1 μg of protein loaded per lane. Primary antibodies against the protein of interest and a loading control protein were run simultaneously in each lane. Compass for SW (v5.0.1, SimpleWestern) software was used for protein quantification and size determination. The authors note that the protein sizes tend to run larger on the Wes system compared to traditional immunoblotting. The following antibodies were used: anti-HSP90 (CST 4877, 1:4,000), anti-TSC1 (D43E2, CST 6935, 1:200), anti-TSC2 (D93F12, CST 4308), anti-S6 (CST 2217, 1:200), anti-phospho-S6 (Ser235/236, CST 2211, 1:200), anti-GFP (D5.1, CST 2956, 1:200), anti-p-mTOR (D9C2, Ser2448, CST 55365, 1:200), anti-mTOR (CST 2972, 1:200), anti-phospho-4E-BP1 (Ser65, CST 9451, 1:200), and anti-4E-BP1 (53H11, CST 9644, 1:200).
Literature meta-analysis
Primary studies containing SCLC-specific alteration data were collated according to data availability and alteration profiling method. The patient and alteration counts for each gene were collected from data tables associated with the study where available. For studies without such data tables, the counts were determined by manual annotation of the OncoPrint figures. To determine the number of patients with alteration(s) as well as the total number of patients profiled for each gene, each of the two numbers were summed across all studies, and these two numbers were used to estimate the proportion of SCLC patients possessing an alteration for a given gene. The protein name and amino acid length associated with each gene were obtained through a UniProt DB query, and genes associated with multiple protein notations were each annotated with the overlapping UniProtKB entries (e.g. OR2A1, OR2A42 were both annotated with the UniProtKB entry for Olfactory receptor 2A1/2A42). To examine the expression level for each gene, we collated the data from both human SCLC samples as well as mouse models of SCLC.5,26 Percentile values for gene expression were determined from each dataset independently. To include a functional output from available in vitro experiment data, we also collected gene dependency scores from the CRISPR knockout screens (Achilles) conducted through the DepMap project.69,70 Cell lines were grouped according to cancer type (SCLC, NSCLC, and all cancers other than SCLC), and the median dependency score was calculated for each gene. AACR GENIE data was obtained from Synapse Platform with written permission.71 For patient samples with multiple alterations (e.g., missense and a frameshift), tally of specific alteration counts in Table S6 was performed by classifying patient samples by the most disruptive to the least disruptive (with fusion/rearrangement events being considered the most disruptive and synonymous mutations the least disruptive), going from the rightmost column to the leftmost column.
Preparation of tuba-seq sgID-BC amplicon libraries
Genomic DNA was extracted from tumor-bearing mouse lungs following the addition of three benchmark control cell lines (1 × 10⁵ cells per control) as previously described.20 Briefly, the lungs were homogenized and lysed with overnight protease K digestion, and genomic DNA was extracted from the lysate using phenol-chloroform and ethanol precipitation methods. Libraries were prepared by single-step PCR amplification of the sgID-BC region from 32 μg of gDNA per mouse split across eight 100 μL reactions with NEBNext Ultra II Q5 Master Mix (M0544L). Dual index primer pairs with unique i5 and i7 indices were used. PCR products were purified using Sera-Mag Select beads (GE Healthcare Life Sciences 29343052) and assessed for quality with Agilent High Sensitivity DNA kit (Agilent Technologies 5067–4626) on the Agilent 2100 Bioanalyzer (Agilent Technologies G2939BA). Purified libraries from each mouse were pooled at equal ratios based on lung weight to ensure even sequencing depth per cell, purified once more with Sera-Mag Select beads to remove excess free primers, and sequenced on the Illumina HiSeq 2500 or NextSeq 550 platform (Admera Health Biopharma Services).
Tuba-seq analysis
We identified the target gene and random barcodes from the sgID-BC region for each tumor cell as previously described.72 The absolute cell number in each tumor was calculated by normalizing the sgID-BC read number by that of the three benchmark control cell lines. We focused on tumors with at least 200 cells and calculated the LNmean (maximum likelihood estimator for mean tumor size assuming log-normal distribution) and tumor number for tumors carrying each target gene deletion. The LNmean and tumor number were normalized to that of Inert tumors to represent the relative growth advantage after inactivating these genes.
Laser capture microdissection and tumor clonality analysis
7 μM sections from formalin-fixed, paraffin-embedded (FFPE) tissue blocks were cut and mounted on PEN membrane slides (Thermo Fisher LCM0522). Slide was dissected immediately after staining on an Arcturus XT LCM System (Thermo Fisher A26818). The cells in different regions were separated and adhered to CapSure HS LCM Caps (Thermo Fisher LCM0215). Genomic DNA was isolated from these different caps using PicoPure DNA Extraction kit (Thermo Fisher KIT0103). 50 μL lysis buffer with proteinase K were added into each sample and incubated at 65°C overnight. After inactivating proteinase K at 95°C for 10 mins, the genomic DNA was cleaned up with AMPure XP beads at 3:1 ratio (Beckman Coulter A63880) and eluted in the 10 mM Tris-HCl (pH 8.0). The DNA concentration was measured by Qubit® dsDNA HS Assay Kit (Thermo Fisher Q32851).
sgID-BC amplicon libraries were prepared from genomic DNAs by single-step PCR amplification with NEBNext Ultra II Q5 Master Mix (M0544L) using dual indexing primer pairs. PCR products were purified first using MinElute PCR Purification Kit (Qiagen 28006), then with Agencourt AMPure XP beads (Beckman Coulter A63881) and assessed for quality with Agilent High Sensitivity DNA kit on the Agilent 2100 Bioanalyzer prior to sequencing on the Illumina MiSeq Nano platform (Admera Health Biopharma Services).
RNA-seq analysis
Tumor-derived cell lines were snap frozen and submitted for RNA analysis. Total RNA isolation, polyA selection, quality control, library preparation, and sequencing were performed by Azenta using Illumina HiSeq platform (2 × 150 bp, ~350M paired-end reads). Transcript quantification for the RNA-seq data was conducted with Salmon (v0.12.0)64 with mouse genome version GRCm38. DESeq2 (v1.34.0) was used to calculate differential expression across the mouse tumor-derived cell lines.65
QUANTIFICATION AND STATISTICAL ANALYSIS
ClueGo plugin (v2.5.6) running on Cytoscape (v3.8.0)66,67 was used to determine pathways enriched for 3285 genes that had been profiled for alterations on ≥250 patients, having an alteration proportion of ≥0.03, and coding for proteins ≤2000 amino acid residues long. Bonferroni step-down correction was applied on two-sided hypergeometric test to determine statistical significance. All other statistical details of experiments can be found in the figure legends. Unless otherwise indicated, all other statistical analyses were performed using GraphPad Prism (v9.1.0) for Windows (GraphPad Software, San Diego, California USA). Data are represented as mean ± standard error of the mean unless otherwise stated.
Supplementary Material
KEY RESOURCES TABLE
| REAGENT or RESOURCE | SOURCE | IDENTIFIER |
|---|---|---|
| Antibodies | ||
| Antibodies for CyTOF, please see Table S8 | This paper | N/A |
| ImmPRESS HRP Horse anti-Rabbit IgG | Vector Laboratories | Cat#MP-7401; RRID:AB_2336529 |
| ImmPRESS HRP Horse anti-Mouse IgG | Vector Laboratories | Cat#MP-7402 |
| Alexa Fluor 594 Donkey anti-Goat IgG (H + L) Cross-Adsorbed Secondary Antibody | Thermo Fisher Scientific | Cat#A11058; RRID:AB_2534105 |
| Alexa Fluor 488 Donkey anti-Rabbit IgG (H + L) Highly Cross-Adsorbed Secondary Antibody | Thermo Fisher Scientific | Cat#A-21206; RRID:AB_2535792 |
| Rabbit anti-RFP Pre-adsorbed Polyclonal | Rockland | Cat#600-401-379; RRID:AB_2209751 |
| Goat anti-RFP Polyclonal | MyBioSource | Cat#MBS448122 |
| Mouse anti-Uteroglobin/SCGB1A1/CC10 (E–11) Monoclonal | Santa Cruz Biotechnology | Cat#sc-365992; RRID:AB_10915481 |
| Rabbit anti-HES1 (D6P2U) Monoclonal | Cell Signaling Technology | Cat#11988; RRID:AB_2728766 |
| Rabbit anti-NEUROD1 [EPR4008] Monoclonal | Abcam | Cat#ab109224; RRID:AB_10861489 |
| Rabbit anti-UCHL1 Polyclonal | Sigma-Aldrich | Cat#HPA005993; RRID:AB_1858560 |
| Rabbit anti-phospho-S6 (Ser235/236) Polyclonal | Cell Signaling Technology | Cat#2211, RRID:AB_331679 |
| Rabbit anti-S6 (5G10) Monoclonal | Cell Signaling Technology | Cat#2217; RRID:AB_331355 |
| Rabbit anti-phospho-4E-BP1 (Ser65) Polyclonal | Cell Signaling Technology | Cat#9451; RRID:AB_330947 |
| Rabbit anti-4E-BP1 Monoclonal | Cell Signaling Technology | Cat#9644; RRID:AB_2097841 |
| Rabbit anti-GFP (D5.1) Monoclonal | Cell Signaling Technology | Cat#2956; RRID:AB_1196615 |
| Rabbit anti-p-mTOR (Ser2448) (D9C2) Monoclonal | Cell Signaling Technology | Cat#5536; RRID:AB_10691552 |
| Rabbit anti-mTOR Polyclonal | Cell Signaling Technology | Cat#2972; RRID:AB_330978 |
| Mouse anti-MASH1 Monoclonal | BD Biosciences | Cat#556604; RRID:AB_396479 |
| Rabbit anti-HSP90 (C45G5) Monoclonal | Cell Signaling Technology | Cat#4877; RRID:AB_2233307 |
| Rabbit anti-TSC1 (D43E2) Monoclonal | Cell Signaling Technology | Cat#6935; RRID:AB_10860420 |
| Rabbit anti-TSC2 (D93F12) Monoclonal | Cell Signaling Technology | Cat#4308; RRID:AB_10547134 |
| Bacterial and virus strains | ||
| Ad5-CMV-Cre | University of Iowa | VVC-U of Iowa-5 |
| Ad5-CMV-eGFP | University of Iowa | VVC-U of Iowa-4 |
| FIV-CMV-Cre | University of Iowa | VVC-U of Iowa-28 |
| Chemicals, peptides, and recombinant proteins | ||
| Naphthalene | Sigma-Aldrich | Cat#184500 |
| RPMI 1640 | Corning | Cat#15-040-CV |
| Bovine Growth Serum | Thermo Fisher Scientific | Cat#SH3054103HI |
| Penicillin-Streptomycin-Glutamine | Gibco | Cat#10378–016 |
| Dulbecco’s Modified Eagle Medium High-Glucose | Gibco | Cat#11965–118 |
| Fetal Bovine Serum | Omega Scientific | Cat#FB-01 |
| AZD8055 | Selleckchem | Cat#S1555 |
| alamarBlue™ Cell Viability Reagent | Invitrogen | Cat#DAL1100 |
| Blasticidin S HCL (10 mg/mL) | Gibco | Cat#A1113903 |
| Alt-R S.p. Cas9 | Integrated DNA Technologies | Cat#1081059 |
| Dimethyl sulfoxide (DMSO) | Fisher Scientific | Cat#BP231 |
| Saponin | Sigma-Aldrich | Cat#84510 |
| Bovine Serum Albumin (BSA) | Thermo Fisher Scientific | Cat#B14 |
| NaN3 | Fisher Scientific | Cat#MP210289110 |
| Sodium butyrate | Sigma-Aldrich | Cat#B5587-5G |
| Critical commercial assays | ||
| SE buffer | Lonza | Cat#V4XC-1032 |
| Lonza 4D-Nucleofector Unit | Lonza | Cat#AAF-1002X |
| MAXPAR X8 Multimetal Labeling Kit | Fluidigm | Cat#201300 |
| Cell-ID Intercalator-Ir | Fluidigm | Cat#201192B |
| Four Element Calibration Beads | Fluidigm | Cat#201078 |
| Antigen Unmasking Solution, Citrate-Based | Vector Laboratories | Cat#H-3300; RRID:AB_2336226 |
| DAB Substrate Kit | Vector Laboratories | Cat#SK-4100; RRID:AB_2336382 |
| ImmPRESS Excel Amplified Polymer Staining Kit, Anti-Rabbit IgG, Peroxidase | Vector Laboratories | Cat#MP-7601; RRID:AB_2336533 |
| TSA Plus Fluorescein Kit | Akoya Biosciences | Cat#NEL741001KT |
| Hematoxylin | Sigma-Aldrich | Cat#HHS32 |
| Refrax Mounting Medium | Anatech Ltd | Cat#711 |
| Fluoromount-G | SouthernBiotech | Cat#0100–01 |
| cOmplete ULTRA Protease Inhibitor Cocktail | Roche | Cat#5892970001 |
| Pierce BCA Protein Assay Kit | Thermo Fisher | Cat#23227 |
| Simple Western Quantitative Immunoassay (Wes) 12–230 kDa Plates | ProteinSimple | Cat#SM-W004 |
| Wes anti-Rabbit Secondary Kit | ProteinSimple | Cat#DM-001 |
| NEBNext Ultra II Q5 Master Mix | New England Biolabs | Cat#M0544L |
| Sera-Mag Select Beads | GE Healthcare Life Sciences | Cat#29343052 |
| Agilent High Sensitivity DNA Kit | Agilent Technologies | Cat#5067–4626 |
| Agilent 2100 Bioanalyzer | Agilent Technologies | Cat#G2939BA |
| PEN Membrane Slides | Thermo Fisher | Cat#LCM0522 |
| Arcturus XT LCM System | Thermo Fisher | Cat#A26818 |
| CapSure HS LCM Caps | Thermo Fisher | Cat#LCM0215 |
| PicoPure DNA Extraction Kit | Thermo Fisher | Cat#KIT0103 |
| AMPure XP Beads | Beckman Coulter | Cat#A63880 |
| Qubit dsDNA HS Assay Kit | Thermo Fisher | Cat#Q32851 |
| MinElute PCR Purification Kit | Qiagen | Cat#28006 |
| Deposited data | ||
| RNA-seq, LCM sequencing, and Tuba-seq data | This paper | GEO: GSE198637 |
| CyTOF data | This paper | Cytobank Community: https://community.cytobank.org/cytobank/experiments/103066 |
| Source data and images | This paper | Mendeley Data: https://doi.org/10.17632/nr4ssx645r.2 |
| Experimental models: Cell lines | ||
| Human: NCI-H1694 | ATCC | CRL-5888; RRID:CVCL_1489 |
| Human: NCI-H146 | ATCC | HTB-173; RRID:CVCL_1473 |
| Human: NCI-H2227 | ATCC | CRL-5934; RRID:CVCL_1542 |
| Human: NCI-H1876 | ATCC | CRL-5902; RRID:CVCL_1503 |
| Human: NCI-H889 | ATCC | CRL-5817; RRID:CVCL 1598 |
| Human: NCI-H526 | ATCC | CRL-5811; RRID:CVCL_1569 |
| Human: NCI-H2081 | ATCC | CRL-5920; RRID:CVCL_1522 |
| Human: NCI-H446 | ATCC | HTB-171; RRID:CVCL_1562 |
| Human: NCI-H524 | ATCC | CRL-5831; RRID:CVCL_1568 |
| Human: NCI-H82 | ATCC | HTB-175; RRID:CVCL_1591 |
| Human: NCI-H82-epicTAG-GFP-StrepTagII-ProtC-HA (EpicTag 1) | Rovira-Clavé et al.32 | N/A |
| Human: NCI-H82-epicTAG-GFP-VSVg-StrepTagII-HA (EpicTag 2) | Rovira-Clavé et al.32 | N/A |
| Human: NCI-H82-epicTAG-GFP-HA-FLAG-AU1 (EpicTag 3) | Rovira-Clavé et al.32 | N/A |
| Human: NCI-H82-epicTAG-GFP-StrepTagII-FLAG-AU1 (EpicTag 4) | Rovira-Clavé et al.32 | N/A |
| Human: NCI-H82-epicTAG-GFP-VSVg-ProtC-HA (EpicTag 5) | Rovira-Clavé et al.32 | N/A |
| Human: NCI-H82-epicTAG-GFP-VSVg-StrepTagII-ProtC (EpicTag 6) | Rovira-Clavé et al.32 | N/A |
| Mouse: KP11 | Sen et al.57 | N/A |
| Mouse: KP22 | Denny et al.26 | N/A |
| Mouse: 12N1G | Denny et al.26 | N/A |
| Mouse: N2N1G | Denny et al.26 | N/A |
| Mouse: LSL-YFP mouse embryonic fibroblasts | Rogers et al.20 | N/A |
| Cell lines generated from this paper, please see Table S7 | This paper | N/A |
| Experimental models: Organisms/strains | ||
| Mouse: RPR2 model | Schaffer et al.11 | N/A |
| Mouse: RPR2T | This paper | N/A |
| Mouse: RPR2T;Cas9 | This paper | N/A |
| Mouse: RP model | Schaffer et al.11 | N/A |
| Mouse: RPT;Cas9 | This paper | N/A |
| Mouse: RPM model | Mollaoglu et al.7 | N/A |
| Mouse: RPMT;Cas9 | This paper | N/A |
| Oligonucleotides | ||
| Primers for Tuba-seq vectors, please see Table S9 | This paper | N/A |
| Recombinant DNA | ||
| Plasmid: pCMV-VSV-G | Stewart et al.58 | Addgene Plasmid #8454 |
| Plasmid: pCMV-dR8.2 dvpr | Stewart et al.58 | Addgene Plasmid #8455 |
| Plasmid: Lenti-EFS-EGFP-T2A-Bsd | This paper | Addgene Plasmid #193198 |
| Plasmid: Lenti-EFS-hTSC1-T2A-Bsd | This paper | Addgene Plasmid #193199 |
| Plasmid: Lenti-sgNeo/Cre | Chiou et al.59 | Addgene Plasmid #67594 |
| Plasmid: Lenti-sgNeo2/Cre | Rogers et al.20 | Addgene Plasmid #89652 |
| Plasmid: Lenti-sgNeo3/Cre | Rogers et al.20 | Addgene Plasmid #89653 |
| Plasmid: Lenti-sgNT/Cre | Chiou et al.59 | Addgene Plasmid #66895 |
| Plasmid: Lenti-sgNT.2#2/Cre | Cai et al.60 | Addgene Plasmid #173661 |
| Plasmid: Lenti-sgAdgb#1/Cre | This paper | Addgene Plasmid #193200 |
| Plasmid: Lenti-sgAdgb#2/Cre | This paper | Addgene Plasmid #193201 |
| Plasmid: Lenti-sgAmbra1#1/Cre | Chaikovsky et al.61 | N/A |
| Plasmid: Lenti-sgAmbra1#2/Cre | Chaikovsky et al.61 | N/A |
| Plasmid: Lenti-sgAmbra1#3/Cre | Chaikovsky et al.61 | N/A |
| Plasmid: Lenti-sgApc/Cre | Rogers et al.20 | Addgene Plasmid #89641 |
| Plasmid: Lenti-sgApc#2/Cre | This paper | Addgene Plasmid #193202 |
| Plasmid: Lenti-sgArid1a#1/Cre | Cai et al.60 | Addgene Plasmid #173571 |
| Plasmid: Lenti-sgArid1a#2/Cre | Cai et al.60 | Addgene Plasmid #173572 |
| Plasmid: Lenti-sgArid1b#1/Cre | Cai et al.60 | Addgene Plasmid #173573 |
| Plasmid: Lenti-sgArid1b#2/Cre | Cai et al.60 | Addgene Plasmid #173574 |
| Plasmid: Lenti-sgAtrx#1/Cre | Cai et al.60 | Addgene Plasmid #173612 |
| Plasmid: Lenti-sgAtrx#2/Cre | Cai et al.60 | Addgene Plasmid #173616 |
| Plasmid: Lenti-sgBrca2#1/Cre | Cai et al.60 | Addgene Plasmid #173627 |
| Plasmid: Lenti-sgBrca2#2/Cre | Cai et al.60 | Addgene Plasmid #173628 |
| Plasmid: Lenti-sgBrip1#1/Cre | This paper | Addgene Plasmid #193203 |
| Plasmid: Lenti-sgBrip1#2/Cre | This paper | Addgene Plasmid #193204 |
| Plasmid: Lenti-sgCdkn2a#1/Cre | Cai et al.60 | Addgene Plasmid #173629 |
| Plasmid: Lenti-sgCdkn2a#2/Cre | Cai et al.60 | Addgene Plasmid #173630 |
| Plasmid: Lenti-sgCol11a1#1/Cre | This paper | Addgene Plasmid #193205 |
| Plasmid: Lenti-sgCol11a1#2/Cre | This paper | Addgene Plasmid #193206 |
| Plasmid: Lenti-sgCol22a1#1/Cre | This paper | Addgene Plasmid #193207 |
| Plasmid: Lenti-sgCol22a1#2/Cre | This paper | Addgene Plasmid #193208 |
| Plasmid: Lenti-sgCrebbp#1/Cre | This paper | Addgene Plasmid #193209 |
| Plasmid: Lenti-sgCrebbp#2/Cre | This paper | Addgene Plasmid #193210 |
| Plasmid: Lenti-sgEp300#1/Cre | Cai et al.60 | Addgene Plasmid #173591 |
| Plasmid: Lenti-sgEp300#2/Cre | Cai et al.60 | Addgene Plasmid #173592 |
| Plasmid: Lenti-sgErich3#1/Cre | This paper | Addgene Plasmid #193211 |
| Plasmid: Lenti-sgErich3#2/Cre | This paper | Addgene Plasmid #193212 |
| Plasmid: Lenti-sgFam135b#1/Cre | This paper | Addgene Plasmid #193213 |
| Plasmid: Lenti-sgFam135b#2/Cre | This paper | Addgene Plasmid #193214 |
| Plasmid: Lenti-sgFat1#1/Cre | Cai et al.60 | Addgene Plasmid #173633 |
| Plasmid: Lenti-sgFbxw7#1/Cre | Cai et al.60 | Addgene Plasmid #173635 |
| Plasmid: Lenti-sgFbxw7#2/Cre | Cai et al.60 | Addgene Plasmid #173636 |
| Plasmid: Lenti-sgFlt4#1/Cre | This paper | Addgene Plasmid #193215 |
| Plasmid: Lenti-sgFlt4#2/Cre | This paper | Addgene Plasmid #193216 |
| Plasmid: Lenti-sgGrin2a#1/Cre | This paper | Addgene Plasmid #193217 |
| Plasmid: Lenti-sgHcn1#2/Cre | This paper | Addgene Plasmid #193218 |
| Plasmid: Lenti-sgKdm6a#1/Cre | Cai et al.60 | Addgene Plasmid #173637 |
| Plasmid: Lenti-sgKdm6a#2/Cre | Cai et al.60 | Addgene Plasmid #173638 |
| Plasmid: Lenti-sgKmt2c#1/Cre | Cai et al.60 | Addgene Plasmid #173652 |
| Plasmid: Lenti-sgKmt2d#1/Cre | Cai et al.60 | Addgene Plasmid #173597 |
| Plasmid: Lenti-sgKmt2d#2/Cre | Cai et al.60 | Addgene Plasmid #173598 |
| Plasmid: Lenti-sgLrp1b#1/Cre | Cai et al.60 | Addgene Plasmid #173641 |
| Plasmid: Lenti-sgLrp1b#2/Cre | Cai et al.60 | Addgene Plasmid #173642 |
| Plasmid: Lenti-sgMroh2b#1/Cre | This paper | Addgene Plasmid #193219 |
| Plasmid: Lenti-sgMroh2b#2/Cre | This paper | Addgene Plasmid #193220 |
| Plasmid: Lenti-sgNkx2-1#1/Cre | This paper | Addgene Plasmid #193221 |
| Plasmid: Lenti-sgNkx2-1#2/Cre | This paper | Addgene Plasmid #193222 |
| Plasmid: Lenti-sgNotch1#1/Cre | This paper | Addgene Plasmid #193223 |
| Plasmid: Lenti-sgNotch1#2/Cre | This paper | Addgene Plasmid #193224 |
| Plasmid: Lenti-sgNotch2#1/Cre | This paper | Addgene Plasmid #193225 |
| Plasmid: Lenti-sgNotch2#2/Cre | This paper | Addgene Plasmid #193226 |
| Plasmid: Lenti-sgNotch3#1/Cre | This paper | Addgene Plasmid #193227 |
| Plasmid: Lenti-sgNotch3#2/Cre | This paper | Addgene Plasmid #193228 |
| Plasmid: Lenti-sgPcdh15#1/Cre | This paper | Addgene Plasmid #193229 |
| Plasmid: Lenti-sgPcdh15#2/Cre | This paper | Addgene Plasmid #193230 |
| Plasmid: Lenti-sgPcna#1/Cre | Tang et al.62 | N/A |
| Plasmid: Lenti-sgPrdm9#1/Cre | This paper | Addgene Plasmid #193231 |
| Plasmid: Lenti-sgPrdm9#2/Cre | This paper | Addgene Plasmid #193232 |
| Plasmid: Lenti-sgPten#1/Cre | Cai et al.60 | Addgene Plasmid #173645 |
| Plasmid: Lenti-sgRb1/Cre | Rogers et al.20 | Addgene Plasmid #89647 |
| Plasmid: Lenti-sgRb1#2/Cre | Chaikovsky et al.61 | N/A |
| Plasmid: Lenti-sgRos1#1/Cre | This paper | Addgene Plasmid #193233 |
| Plasmid: Lenti-sgRos1#2/Cre | This paper | Addgene Plasmid #193234 |
| Plasmid: Lenti-sgRunx1t1#1/Cre | This paper | Addgene Plasmid #193235 |
| Plasmid: Lenti-sgRunx1t1#2/Cre | This paper | Addgene Plasmid #193236 |
| Plasmid: Lenti-sgSis#1/Cre | This paper | Addgene Plasmid #193237 |
| Plasmid: Lenti-sgSis#2/Cre | This paper | Addgene Plasmid #193238 |
| Plasmid: Lenti-sgSpen#1/Cre | This paper | Addgene Plasmid #193239 |
| Plasmid: Lenti-sgSpen#2/Cre | This paper | Addgene Plasmid #193240 |
| Plasmid: Lenti-sgSphkap#2/Cre | This paper | Addgene Plasmid #193241 |
| Plasmid: Lenti-sgTmem132d#1/Cre | This paper | Addgene Plasmid #193242 |
| Plasmid: Lenti-sgTmem132d#2/Cre | This paper | Addgene Plasmid #193243 |
| Plasmid: Lenti-sgTnr#1/Cre | This paper | Addgene Plasmid #193244 |
| Plasmid: Lenti-sgTnr#2/Cre | This paper | Addgene Plasmid #193245 |
| Plasmid: Lenti-sgTsc1#1/Cre | This paper | Addgene Plasmid #193246 |
| Plasmid: Lenti-sgTsc1#2/Cre | This paper | Addgene Plasmid #193247 |
| Plasmid: Lenti-sgZfp536#1/Cre | This paper | Addgene Plasmid #193248 |
| Plasmid: Lenti-sgZfp536#2/Cre | This paper | Addgene Plasmid #193249 |
| Software and algorithms | ||
| LAS X v3.7.1 | Leica Microsystems | https://www.leica-microsystems.com/products/microscope-software/p/leica-las-x-ls/ |
| Fiji v1.53f51 | Schindelin et al.63 | https://imagej.net/software/fiji/downloads |
| Compass for SW v5.0.1 | ProteinSimple | https://www.proteinsimple.com/software_compass_simplewestern.html |
| Salmon V0.12.0 | Patro et al.64 | https://github.com/COMBINE-lab/salmon |
| DESeq2 v1.34.0 | Love et al.65 | https://bioconductor.org/packages/release/bioc/html/DESeq2.html |
| ClueGo v2.5.6 | Bindea et al.66 | https://apps.cytoscape.org/apps/cluego |
| Cytoscape v3.8.0 | Shannon et al.67 | https://cytoscape.org/download.html |
| GraphPad Prism v9.1.0 | GraphPad Software | https://www.graphpad.com/scientific-software/prism/ |
| Code for LCM Barcode clonality analysis, meta-analysis, and RNA-seq analysis | This paper | https://github.com/noahlee577/SCLC_Tuba-seq, archived at Zenodo: https://doi.org/10.5281/zenodo.7430243 |
Highlights.
A meta-analysis identifies candidate drivers of SCLC, including mTOR signaling
Naphthalene enhances SCLC development upon lentiviral infection in mouse models
Implementation of Tuba-seq in a mouse model of SCLC validates cancer drivers
TSC1 is a tumor suppressor in mice and humans with SCLC
ACKNOWLEDGMENTS
We thank Alyssa Ray for administrative support; Dr. Trudy Oliver for sharing the RPM mouse model; Pauline Chu and the Animal Histology Service Center at Stanford University for help with histology; the Stanford Shared FACS Facility for flow cytometry services (NIH S10 Shared Instrument Grant S10RR027431-01); the Stanford Veterinary Service Center for expert animal care; the Stanford Genomics Service Center as well as the Protein and Nucleic Acid Facility for help with Bioanalyzer runs; Hyoeun Jung for helping generate illustrations and organize the figures; and all the members of the laboratory of J.S. and M.M.W. for their help and support throughout this study. This work was supported by the NIH (grants CA231997 and CA217450 to J.S.; grants R01-CA207133, R01-CA231253, and R01-CA234349 to M.M.W. and D.A.P.; and grant F31CA257169-01 to J.H.K.), the Stanford Cancer Institute (NIH grant P30-CA124435), and the Agency for Science, Technology and Research (A*STAR) Singapore (Y.T.S.). M.C.L. was supported by the Tom and Susan Ford Stanford Graduate Fellowship in Science and Engineering and Tobacco-Related Disease Research Program (TRDRP) Predoctoral Fellowship (T32DT4747). H.C. was supported by a TRDRP Postdoctoral Fellowship (28FT-0019). C.W.M. was supported by the NSF Graduate Research Fellowship Program and an Anne T. and Robert M. Bass Stanford Graduate Fellowship. C.L. was the Connie and Bob Lurie Fellow of the Damon Runyon Cancer Research Foundation (DRG-2331). D.A.P. is a Chan Zuckerberg Biohub investigator. J.S. is the Elaine and John Chambers Professor in Pediatric Cancer. The authors would like to acknowledge the NCI Small Cell Lung Cancer Conortium (grant U24 CA213274) and the AACR Project GENIE registry for sharing SCLC data; interpretations are the responsibility of study authors.
INCLUSION AND DIVERSITY
We support inclusive, diverse, and equitable conduct of research.
Footnotes
SUPPLEMENTAL INFORMATION
Supplemental information can be found online at https://doi.org/10.1016/j.celrep.2023.111990.
DECLARATION OF INTERESTS
J.S. has equity in and is an advisor for DISCO Pharmaceuticals. M.M.W. and D.A.P. are founders of and hold equity in D2G Oncology.
REFERENCES
- 1.Beasley MB, Brambilla E, and Travis WD (2005). The 2004 World Health Organization classification of lung tumors. Semin. Roentgenol 40, 90–97. 10.1053/j.ro.2005.01.001. [DOI] [PubMed] [Google Scholar]
- 2.Travis WD, Brambilla E, Nicholson AG, Yatabe Y, Austin JHM, Beasley MB, Chirieac LR, Dacic S, Duhig E, Flieder DB, et al. (2015). The 2015 world Health organization classification of lung tumors: impact of genetic, clinical and radiologic advances since the 2004 classification. J. Thorac. Oncol 10, 1243–1260. 10.1097/JTO.0000000000000630. [DOI] [PubMed] [Google Scholar]
- 3.Barnholtz-Sloan JS, Sloan AE, Davis FG, Vigneau FD, Lai P, and Sawaya RE (2004). Incidence proportions of brain metastases in patients diagnosed (1973 to 2001) in the metropolitan detroit cancer surveillance system. J. Clin. Oncol 22, 2865–2872. 10.1200/JCO.2004.12.149. [DOI] [PubMed] [Google Scholar]
- 4.Reck M, Luft A, Szczesna A, Havel L, Kim S-W, Akerley W, Pietanza MC, Wu YL, Zielinski C, Thomas M, et al. (2016). Phase III randomized trial of ipilimumab plus etoposide and platinum versus placebo plus etoposide and platinum in extensive-stage small-cell lung cancer. J. Clin. Oncol 34, 3740–3748. 10.1200/JCO.2016.67.6601. [DOI] [PubMed] [Google Scholar]
- 5.George J, Lim JS, Jang SJ, Cun Y, Ozretić L, Kong G, Leenders F, Lu X, Fernández-Cuesta L, Bosco G, et al. (2015). Comprehensive genomic profiles of small cell lung cancer. Nature 524, 47–53. 10.1038/nature14664. [DOI] [PMC free article] [PubMed] [Google Scholar]
- 6.Howlader N, Forjaz G, Mooradian MJ, Meza R, Kong CY, Cronin KA, Mariotto AB, Lowy DR, and Feuer EJ (2020). The effect of advances in lung-cancer treatment on population mortality. N. Engl. J. Med 383, 640–649. 10.1056/NEJMoa1916623. [DOI] [PMC free article] [PubMed] [Google Scholar]
- 7.Mollaoglu G, Guthrie MR, Böhm S, Brägelmann J, Can I, Ballieu PM, Marx A, George J, Heinen C, Chalishazar MD, et al. (2017). MYC drives progression of small cell lung cancer to a variant neuroendocrine subtype with vulnerability to aurora kinase inhibition. Cancer Cell 31, 270–285. 10.1016/j.ccell.2016.12.005. [DOI] [PMC free article] [PubMed] [Google Scholar]
- 8.Augert A, Zhang Q, Bates B, Cui M, Wang X, Wildey G, Dowlati A, and MacPherson D (2017). Small cell lung cancer exhibits frequent inactivating mutations in the histone methyltransferase KMT2D/MLL2: CALGB 151111 (alliance). J. Thorac. Oncol 12, 704–713. 10.1016/j.jtho.2016.12.011. [DOI] [PMC free article] [PubMed] [Google Scholar]
- 9.Peifer M, Fernández-Cuesta L, Sos ML, George J, Seidel D, Kasper LH, Plenker D, Leenders F, Sun R, Zander T, et al. (2012). Integrative genome analyses identify key somatic driver mutations of small-cell lung cancer. Nat. Genet 44, 1104–1110. 10.1038/ng.2396. [DOI] [PMC free article] [PubMed] [Google Scholar]
- 10.Calbo J, van Montfort E, Proost N, van Drunen E, Beverloo HB, Meuwissen R, and Berns A (2011). A functional role for tumor cell heterogeneity in a mouse model of small cell lung cancer. Cancer Cell 19, 244–256. 10.1016/j.ccr.2010.12.021. [DOI] [PubMed] [Google Scholar]
- 11.Schaffer BE, Park K-S, Yiu G, Conklin JF, Lin C, Burkhart DL, Karnezis AN, Sweet-Cordero EA, and Sage J (2010). Loss of p130 accelerates tumor development in a mouse model for human small-cell lung carcinoma. Cancer Res. 70, 3877–3883. 10.1158/0008-5472.CAN-09-4228. [DOI] [PMC free article] [PubMed] [Google Scholar]
- 12.Meuwissen R, Linn SC, Linnoila RI, Zevenhoven J, Mooi WJ, and Berns A (2003). Induction of small cell lung cancer by somatic inactivation of both Trp53 and Rb1 in a conditional mouse model. Cancer Cell 4, 181–189. 10.1016/S1535-6108(03)00220-4. [DOI] [PubMed] [Google Scholar]
- 13.Cui M, Augert A, Rongione M, Conkrite K, Parazzoli S, Nikitin AY, Ingolia N, and MacPherson D (2014). PTEN is a potent suppressor of small cell lung cancer. Mol. Cancer Res 12, 654–659. 10.1158/1541-7786.MCR-13-0554. [DOI] [PMC free article] [PubMed] [Google Scholar]
- 14.Kim D-W, Wu N, Kim Y-C, Cheng PF, Basom R, Kim D, Dunn CT, Lee AY, Kim K, Lee CS, et al. (2016). Genetic requirement for Mycl and efficacy of RNA Pol I inhibition in mouse models of small cell lung cancer. Genes Dev. 30, 1289–1299. 10.1101/gad.279307.116. [DOI] [PMC free article] [PubMed] [Google Scholar]
- 15.Denny SK, Yang D, Chuang C-H, Brady JJ, Lim JS, Grüner BM, Chiou S-H, Schep AN, Baral J, Hamard C, et al. (2016). Nfib promotes metastasis through a widespread increase in chromatin accessibility. Cell 166, 328–342. 10.1016/j.cell.2016.05.052. [DOI] [PMC free article] [PubMed] [Google Scholar]
- 16.Jia D, Augert A, Kim D-W, Eastwood E, Wu N, Ibrahim AH, Kim K-B, Dunn CT, Pillai SPS, Gazdar AF, et al. (2018). Crebbp loss drives small cell lung cancer and increases sensitivity to HDAC inhibition. Cancer Discov. 8, 1422–1437. 10.1158/2159-8290.CD-18-0385. [DOI] [PMC free article] [PubMed] [Google Scholar]
- 17.Coles GL, Cristea S, Webber JT, Levin RS, Moss SM, He A, Sangodkar J, Hwang YC, Arand J, Drainas AP, et al. (2020). Unbiased proteomic profiling uncovers a targetable GNAS/PKA/PP2A Axis in small cell lung cancer stem cells. Cancer Cell 38, 129–143.e7. 10.1016/j.ccell.2020.05.003. [DOI] [PMC free article] [PubMed] [Google Scholar]
- 18.Ciampricotti M, Karakousi T, Richards AL, Quintanal-Villalonga À, Karatza A, Caeser R, Costa EA, Allaj V, Manoj P, Spainhower KB, et al. (2021). Rlf–mycl gene fusion drives tumorigenesis and metastasis in a mouse model of small cell lung cancer. Cancer Discov. 11, 3214–3229. 10.1158/2159-8290.CD-21-0441. [DOI] [PMC free article] [PubMed] [Google Scholar]
- 19.Ferone G, Lee MC, Sage J, and Berns A (2020). Cells of origin of lung cancers: lessons from mouse studies. Genes Dev. 34, 1017–1032. 10.1101/gad.338228.120. [DOI] [PMC free article] [PubMed] [Google Scholar]
- 20.Rogers ZN, McFarland CD, Winters IP, Naranjo S, Chuang C-H, Petrov D, and Winslow MM (2017). A quantitative and multiplexed approach to uncover the fitness landscape of tumor suppression in vivo. Nat. Methods 14, 737–742. 10.1038/nmeth.4297. [DOI] [PMC free article] [PubMed] [Google Scholar]
- 21.Murray CW, Brady JJ, Tsai MK, Li C, Winters IP, Tang R, Andrejka L, Ma RK, Kunder CA, Chu P, and Winslow MM (2019). An Lkb1-Sik axis suppresses lung tumor growth and controls differentiation. Cancer Discov. 9, 1590–1605. 10.1158/2159-8290. [DOI] [PMC free article] [PubMed] [Google Scholar]
- 22.Rudin CM, Poirier JT, Byers LA, Dive C, Dowlati A, George J, Heymach JV, Johnson JE, Lehman JM, MacPherson D, et al. (2019). Molecular subtypes of small cell lung cancer: a synthesis of human and mouse model data. Nat. Rev. Cancer 19, 289–297. 10.1038/s41568-019-0133-9. [DOI] [PMC free article] [PubMed] [Google Scholar]
- 23.Gazdar AF, Savage TK, Johnson JE, Berns A, Sage J, Linnoila RI, MacPherson D, McFadden DG, Farago A, Jacks T, et al. (2015). The comparative pathology of genetically engineered mouse models for neuroendocrine carcinomas of the lung. J. Thorac. Oncol 10, 553–564. 10.1097/JTO.0000000000000459. [DOI] [PMC free article] [PubMed] [Google Scholar]
- 24.Van Winkle LS, Buckpitt AR, Nishio SJ, Isaac JM, and Plopper CG (1995). Cellular response in naphthalene-induced Clara cell injury and bronchiolar epithelial repair in mice. Am. J. Physiol 269, L800–L818. 10.1152/ajplung.1995.269.6.L800. [DOI] [PubMed] [Google Scholar]
- 25.Xia Y, Zhan C, Feng M, Leblanc M, Ke E, Yeddula N, and Verma IM (2018). Targeting CREB pathway suppresses small cell lung cancer. Mol. Cancer Res 16, 825–832. 10.1158/1541-7786.MCR-17-0576. [DOI] [PMC free article] [PubMed] [Google Scholar]
- 26.Yang D, Denny SK, Greenside PG, Chaikovsky AC, Brady JJ, Ouadah Y, Granja JM, Jahchan NS, Lim JS, Kwok S, et al. (2018). Intertumoral heterogeneity in SCLC is influenced by the cell type of origin. Cancer Discov. 8, 1316–1331. 10.1158/2159-8290.CD-17-0987. [DOI] [PMC free article] [PubMed] [Google Scholar]
- 27.Wagner AH, Devarakonda S, Skidmore ZL, Krysiak K, Ramu A, Trani L, Kunisaki J, Masood A, Waqar SN, Spies NC, et al. (2018). Recurrent WNT pathway alterations are frequent in relapsed small cell lung cancer. Nat. Commun 9, 3787. 10.1038/s41467-018-06162-9. [DOI] [PMC free article] [PubMed] [Google Scholar]
- 28.Hollander MC, Philburn RT, Patterson AD, Velasco-Miguel S, Friedberg EC, Linnoila RI, and Fornace AJ (2005). Deletion of XPC leads to lung tumors in mice and is associated with early events in human lung carcinogenesis. Proc. Natl. Acad. Sci. USA 102, 13200–13205. 10.1073/pnas.0503133102. [DOI] [PMC free article] [PubMed] [Google Scholar]
- 29.Park S, Lee H, Lee B, Lee S-H, Sun J-M, Park W-Y, Ahn JS, Ahn M-J, and Park K (2019). DNA damage response and repair pathway alteration and its association with tumor mutation burden and platinum-based chemotherapy in SCLC. J. Thorac. Oncol 14, 1640–1650. 10.1016/j.jtho.2019.05.014. [DOI] [PubMed] [Google Scholar]
- 30.Jaskulski D, deRiel JK, Mercer WE, Calabretta B, and Baserga R (1988). Inhibition of cellular proliferation by antisense oligodeoxynucleotides to PCNA cyclin. Science 240, 1544–1546. 10.1126/science.2897717. [DOI] [PubMed] [Google Scholar]
- 31.Nellist M, van Slegtenhorst MA, Goedbloed M, van den Ouweland AM, Halley DJ, and van der Sluijs P (1999). Characterization of the cytosolic tuberin-hamartin complex: tuberin IS a cytosolic chaperone for hamartin. J. Biol. Chem 274, 35647–35652. 10.1074/jbc.274.50.35647. [DOI] [PubMed] [Google Scholar]
- 32.Rovira-Clavé X, Drainas AP, Jiang S, Bai Y, Baron M, Zhu B, Dallas AE, Lee MC, Chu TP, Holzem A, et al. (2022). Spatial epitope barcoding reveals clonal tumor patch behaviors. Cancer Cell 40, 1423–1439.e11. 10.1016/j.ccell.2022.09.014. [DOI] [PMC free article] [PubMed] [Google Scholar]
- 33.Wagenblast E, Soto M, Gutiérrez-Ángel S, Hartl CA, Gable AL, Maceli AR, Erard N, Williams AM, Kim SY, Dickopf S, et al. (2015). A model of breast cancer heterogeneity reveals vascular mimicry as a driver of metastasis. Nature 520, 358–362. 10.1038/nature14403. [DOI] [PMC free article] [PubMed] [Google Scholar]
- 34.Nguyen LV, Pellacani D, Lefort S, Kannan N, Osako T, Makarem M, Cox CL, Kennedy W, Beer P, Carles A, et al. (2015). Barcoding reveals complex clonal dynamics of de novo transformed human mammary cells. Nature 528, 267–271. 10.1038/nature15742. [DOI] [PubMed] [Google Scholar]
- 35.Dixit A, Parnas O, Li B, Chen J, Fulco CP, Jerby-Arnon L, Marjanovic ND, Dionne D, Burks T, Raychowdhury R, et al. (2016). Perturb-seq: dissecting molecular circuits with scalable single-cell RNA profiling of pooled genetic screens. Cell 167, 1853–1866.e17. 10.1016/j.cell.2016.11.038. [DOI] [PMC free article] [PubMed] [Google Scholar]
- 36.Zehir A, Benayed R, Shah RH, Syed A, Middha S, Kim HR, Srinivasan P, Gao J, Chakravarty D, Devlin SM, et al. (2017). Mutational landscape of metastatic cancer revealed from prospective clinical sequencing of 10,000 patients. Nat. Med 23, 703–713. 10.1038/nm.4333. [DOI] [PMC free article] [PubMed] [Google Scholar]
- 37.Bolton KL, Ptashkin RN, Gao T, Braunstein L, Devlin SM, Kelly D, Patel M, Berthon A, Syed A, Yabe M, et al. (2020). Cancer therapy shapes the fitness landscape of clonal hematopoiesis. Nat. Genet 52, 1219–1226. 10.1038/s41588-020-00710-0. [DOI] [PMC free article] [PubMed] [Google Scholar]
- 38.Williamson SC, Metcalf RL, Trapani F, Mohan S, Antonello J, Abbott B, Leong HS, Chester CPE, Simms N, Polanski R, et al. (2016). Vasculogenic mimicry in small cell lung cancer. Nat. Commun 7, 13322. 10.1038/ncomms13322. [DOI] [PMC free article] [PubMed] [Google Scholar]
- 39.Lim JS, Ibaseta A, Fischer MM, Cancilla B, O’Young G, Cristea S, Luca VC, Yang D, Jahchan NS, Hamard C, et al. (2017). Intratumoural heterogeneity generated by Notch signalling promotes small-cell lung cancer. Nature 545, 360–364. 10.1038/nature22323. [DOI] [PMC free article] [PubMed] [Google Scholar]
- 40.Gay CM, Stewart CA, Park EM, Diao L, Groves SM, Heeke S, Nabet BY, Fujimoto J, Solis LM, Lu W, et al. (2021). Patterns of transcription factor programs and immune pathway activation define four major subtypes of SCLC with distinct therapeutic vulnerabilities. Cancer Cell 39, 346–360.e7. 10.1016/j.ccell.2020.12.014. [DOI] [PMC free article] [PubMed] [Google Scholar]
- 41.Mahadevan NR, Knelson EH, Wolff JO, Vajdi A, Saigí M, Campisi M, Hong D, Thai TC, Piel B, Han S, et al. (2021). Intrinsic immunogenicity of small cell lung carcinoma revealed by its cellular plasticity. Cancer Discov. 11, 1952–1969. 10.1158/2159-8290.CD-20-0913. [DOI] [PMC free article] [PubMed] [Google Scholar]
- 42.Crino PB, Nathanson KL, and Henske EP (2006). The tuberous sclerosis complex. N. Engl. J. Med 355, 1345–1356. 10.1056/NEJMra055323. [DOI] [PubMed] [Google Scholar]
- 43.Tapon N, Ito N, Dickson BJ, Treisman JE, and Hariharan IK (2001). The Drosophila tuberous sclerosis complex gene homologs restrict cell growth and cell proliferation. Cell 105, 345–355. 10.1016/S0092-8674(01)00332-4. [DOI] [PubMed] [Google Scholar]
- 44.Garami A, Zwartkruis FJT, Nobukuni T, Joaquin M, Roccio M, Stocker H, Kozma SC, Hafen E, Bos JL, and Thomas G (2003). Insulin activation of rheb, a mediator of mTOR/S6K/4E-BP signaling, is inhibited by TSC1 and 2. Mol. Cell 11, 1457–1466. 10.1016/S1097-2765(03)00220-X. [DOI] [PubMed] [Google Scholar]
- 45.Brugarolas J, Lei K, Hurley RL, Manning BD, Reiling JH, Hafen E, Witters LA, Ellisen LW, and Kaelin WG (2004). Regulation of mTOR function in response to hypoxia by REDD1 and the TSC1/TSC2 tumor suppressor complex. Genes Dev. 18, 2893–2904. 10.1101/gad.1256804. [DOI] [PMC free article] [PubMed] [Google Scholar]
- 46.Sivakumar S, Moore JA, Montesion M, Sharaf R, Lin DI, Fleishmann Z, et al. (2022). Integrative analysis of a large real-world cohort of small cell lung cancer identifies distinct genetic subtypes and insights into histological transformation. Preprint at bioRxiv. 10.1101/2022.07.27.501738. [DOI] [PMC free article] [PubMed] [Google Scholar]
- 47.Saito T, Tsuta K, Fukumoto KJ, Matsui H, Konobu T, Torii Y, Yokoi T, Kurata T, Kurokawa H, Uemura Y, et al. (2017). Combined small cell lung carcinoma and giant cell carcinoma: a case report. Surg. Case Rep 3, 52. 10.1186/s40792-017-0328-9. [DOI] [PMC free article] [PubMed] [Google Scholar]
- 48.Ebisu Y, Ishida M, Saito T, Murakawa T, Uemura Y, and Tsuta K (2018). Combined small cell carcinoma with giant cell carcinoma component of the lung: a case successfully diagnosed by computed tomography-guided fine-needle aspiration cytology. Oncol. Lett 15, 1907–1911. 10.3892/ol.2017.7448. [DOI] [PMC free article] [PubMed] [Google Scholar]
- 49.Li L, Ng SR, Colón CI, Drapkin BJ, Hsu PP, Li Z, Nabel CS, Lewis CA, Romero R, Mercer KL, et al. (2019). Identification of DHODH as a therapeutic target in small cell lung cancer. Sci. Transl. Med 11, eaaw7852. 10.1126/scitranslmed.aaw7852. [DOI] [PMC free article] [PubMed] [Google Scholar]
- 50.Pandya KJ, Dahlberg S, Hidalgo M, Cohen RB, Lee MW, Schiller JH, and Johnson DH; Eastern Cooperative Oncology Group E1500 (2007). A randomized, phase II trial of two dose levels of temsirolimus (CCI-779) in patients with extensive-stage small-cell lung cancer who have responding or stable disease after induction chemotherapy: a trial of the Eastern Cooperative Oncology Group (E1500). J. Thorac. Oncol 2, 1036–1041. 10.1097/JTO.0b013e318155a439. [DOI] [PubMed] [Google Scholar]
- 51.Tarhini A, Kotsakis A, Gooding W, Shuai Y, Petro D, Friedland D, Belani CP, Dacic S, and Argiris A (2010). Phase II study of everolimus (RAD001)in previously treated small cell lung cancer. Clin. Cancer Res 16, 5900–5907. 10.1158/1078-0432.CCR-10-0802. [DOI] [PubMed] [Google Scholar]
- 52.Kern JA, Kim J, Foster DG, Mishra R, Gardner EE, Poirier JT, Rivard C, Yu H, Finigan JH, Dowlati A, et al. (2020). Role of mTOR as an essential kinase in SCLC. J. Thorac. Oncol 15, 1522–1534. 10.1016/j.jtho.2020.05.026. [DOI] [PMC free article] [PubMed] [Google Scholar]
- 53.Sakre N, Wildey G, Behtaj M, Kresak A, Yang M, Fu P, and Dowlati A (2017). RICTOR amplification identifies a subgroup in small cell lung cancer and predicts response to drugs targeting mTOR. Oncotarget 8, 5992–6002. 10.18632/oncotarget.13362. [DOI] [PMC free article] [PubMed] [Google Scholar]
- 54.Gardner EE, Connis N, Poirier JT, Cope L, Dobromilskaya I, Gallia GL, Rudin CM, and Hann CL (2014). Rapamycin rescues ABT-737 efficacy in small cell lung cancer. Cancer Res. 74, 2846–2856. 10.1158/0008-5472.CAN-13-3460. [DOI] [PMC free article] [PubMed] [Google Scholar]
- 55.Sen T, Tong P, Diao L, Li L, Fan Y, Hoff J, Heymach JV, Wang J, and Byers LA (2017). Targeting AXL and mTOR pathway overcomes primary and acquired resistance to WEE1 inhibition in small-cell lung cancer. Clin. Cancer Res 23, 6239–6253. 10.1158/1078-0432.CCR-17-1284. [DOI] [PMC free article] [PubMed] [Google Scholar]
- 56.Sun X, Wang SC, Wei Y, Luo X, Jia Y, Li L, Gopal P, Zhu M, Nassour I, Chuang J-C, et al. (2017). Arid1a has context-dependent oncogenic and tumor suppressor functions in liver cancer. Cancer Cell 32, 574–589.e6. 10.1016/j.ccell.2017.10.007. [DOI] [PMC free article] [PubMed] [Google Scholar]
- 57.Sen T, Rodriguez BL, Chen L, Corte CMD, Morikawa N, Fujimoto J, Cristea S, Nguyen T, Diao L, Li L, et al. (2019). Targeting DNA damage response promotes antitumor immunity through STING-mediated T-cell activation in small cell lung cancer. Cancer Discov. 9, 646–661. 10.1158/2159-8290.CD-18-1020. [DOI] [PMC free article] [PubMed] [Google Scholar]
- 58.Stewart SA, Dykxhoorn DM, Palliser D, Mizuno H, Yu EY, An DS, Sabatini DM, Chen ISY, Hahn WC, Sharp PA, et al. (2003). Lentivirus-delivered stable gene silencing by RNAi in primary cells. RNA N. Y. N 9, 493–501. 10.1261/rna.2192803. [DOI] [PMC free article] [PubMed] [Google Scholar]
- 59.Chiou S-H, Winters IP, Wang J, Naranjo S, Dudgeon C, Tamburini FB, Brady JJ, Yang D, Grüner BM, Chuang C-H, et al. (2015). Pancreatic cancer modeling using retrograde viral vector delivery and in vivo CRISPR/Cas9-mediated somatic genome editing. Genes Dev. 29, 1576–1585. 10.1101/gad.264861.115. [DOI] [PMC free article] [PubMed] [Google Scholar]
- 60.Cai H, Chew SK, Li C, Tsai MK, Andrejka L, Murray CW, Hughes NW, Shuldiner EG, Ashkin EL, Tang R, et al. (2021). A functional taxonomy of tumor suppression in oncogenic KRAS-driven lung cancer. Cancer Discov. 11, 1754–1773. 10.1158/2159-8290. [DOI] [PMC free article] [PubMed] [Google Scholar]
- 61.Chaikovsky AC, Li C, Jeng EE, Loebell S, Lee MC, Murray CW, Cheng R, Demeter J, Swaney DL, Chen S-H, et al. (2021). The AMBRA1 E3 ligase adaptor regulates the stability of cyclin D. Nature 592, 794–798. 10.1038/s41586-021-03474-7. [DOI] [PMC free article] [PubMed] [Google Scholar]
- 62.Tang R, Shuldiner EG, Kelly M, Murray CW, Hebert JD, Andrejka L, Tsai MK, Hughes NW, Parker MI, Cai H, et al. (2021). Multiplexed identification of RAS paralog imbalance as a driver of lung cancer growth. Preprint at bioRxiv. 10.1101/2021.07.08.451571. [DOI] [Google Scholar]
- 63.Schindelin J, Arganda-Carreras I, Frise E, Kaynig V, Longair M, Pietzsch T, Preibisch S, Rueden C, Saalfeld S, Schmid B, et al. (2012). Fiji: an open-source platform for biological-image analysis. Nat. Methods 9, 676–682. 10.1038/nmeth.2019. [DOI] [PMC free article] [PubMed] [Google Scholar]
- 64.Patro R, Duggal G, Love MI, Irizarry RA, and Kingsford C (2017). Salmon provides fast and bias-aware quantification of transcript expression. Nat. Methods 14, 417–419. 10.1038/nmeth.4197. [DOI] [PMC free article] [PubMed] [Google Scholar]
- 65.Love MI, Huber W, and Anders S (2014). Moderated estimation of fold change and dispersion for RNA-seq data with DESeq2. Genome Biol. 15, 550. 10.1186/s13059-014-0550-8. [DOI] [PMC free article] [PubMed] [Google Scholar]
- 66.Bindea G, Mlecnik B, Hackl H, Charoentong P, Tosolini M, Kirilovsky A, Fridman W-H, Pagès F, Trajanoski Z, and Galon J (2009). ClueGO: a Cytoscape plug-in to decipher functionally grouped gene ontology and pathway annotation networks. Bioinformatics 25, 1091–1093. 10.1093/bioinformatics/btp101. [DOI] [PMC free article] [PubMed] [Google Scholar]
- 67.Shannon P, Markiel A, Ozier O, Baliga NS, Wang JT, Ramage D, Amin N, Schwikowski B, and Ideker T (2003). Cytoscape: a software environment for integrated models of biomolecular interaction networks. Genome Res. 13, 2498–2504. 10.1101/gr.1239303. [DOI] [PMC free article] [PubMed] [Google Scholar]
- 68.DuPage M, Dooley AL, and Jacks T (2009). Conditional mouse lung cancer models using adenoviral or lentiviral delivery of Cre recombinase. Nat. Protoc 4, 1064–1072. 10.1038/nprot.2009.95. [DOI] [PMC free article] [PubMed] [Google Scholar]
- 69.Meyers RM, Bryan JG, McFarland JM, Weir BA, Sizemore AE, Xu H, Dharia NV, Montgomery PG, Cowley GS, Pantel S, et al. (2017). Computational correction of copy number effect improves specificity of CRISPR–Cas9 essentiality screens in cancer cells. Nat. Genet 49, 1779–1784. 10.1038/ng.3984. [DOI] [PMC free article] [PubMed] [Google Scholar]
- 70.Dempster JM, Rossen J, Kazachkova M, Pan J, Kugener G, Root DE, and Tsherniak A (2019). Extracting biological insights from the project achilles genome-scale CRISPR screens in cancer cell lines. Preprint at bioRxiv. 10.1101/720243. [DOI] [Google Scholar]
- 71.AACR Project GENIE Consortium (2017). AACR project GENIE: powering precision medicine through an international Consortium. Cancer Discov. 7, 818–831. 10.1158/2159-8290.CD-17-0151. [DOI] [PMC free article] [PubMed] [Google Scholar]
- 72.Li C, Lin W-Y, Rizvi H, Cai H, McFarland CD, Rogers ZN, Yousefi M, Winters IP, Rudin CM, Petrov DA, and Winslow MM (2021). Quantitative in vivo analyses reveal a complex pharmacogenomic landscape in lung adenocarcinoma. Cancer Res. 81, 4570–4580. 10.1158/0008-5472.CAN-21-0716. [DOI] [PMC free article] [PubMed] [Google Scholar]
Associated Data
This section collects any data citations, data availability statements, or supplementary materials included in this article.
Supplementary Materials
Data Availability Statement
RNA-seq, LCM sequencing, and Tuba-seq data are available through Gene Expression Omnibus (GEO: GSE198637). CyTOF data is available through Cytobank Community: #103066. Gene dependency data from the Cancer Dependency Map are publicly available at www.depmap.org. Protein data from UniProtKB are publicly available at www.uniprot.org. Original, raw data and images have been deposited at Mendeley and are publicly available (Mendeley Data: https://doi.org/10.17632/nr4ssx645r.12). All original code used to analyze data and generate figures are available at GitHub: https://github.com/noahlee577/SCLC_Tuba-seq (release v1.0.0 is archived at Zenodo: https://doi.org/10.5281/zenodo.7430243). All other data are available in the Supplementary Information, or from the corresponding author upon reasonable request. Any additional information required to re-analyze the data reported in this work is available from the lead contact upon request.