

Abstract
Objectives
To determine the initial fluoride (F) release and rerelease after recharge of three pediatric dental restorative materials when aged in artificial saliva (M1) and deionized water (M2).
Materials and methods
A total of 30 disks, 10 disks of each restorative material R1: Jen Rainbow, Jen Dent Ukraine; R2: Tetric® N-Flow, Ivoclar Vivadent, and R3: resin-modified glass ionomer cement (RMGIC) (Fuji II LC- GC Corporation) were fabricated and were tested for F dynamics in two different media, M1: artificial saliva, M2: deionized water group. The F initial release was measured on the 1st, 7th, 14th, 21st, and 30th day, and on the 31st day, acidulated phosphate F (APF) gel was applied and F rerelease was measured on the 31st, 37th, 44th, 51st, and 60th day using F ion-specific electrode (Orion). The result was statistically analyzed using two-way analysis of variance (ANOVA) and post hoc Bonferroni test.
Results
Fluoride (F) ion release was significantly higher in deionized water than in artificial saliva (M1), and F ion rerelease (after recharge) was significantly higher in artificial saliva (M1). Fuji-II LC demonstrated a significantly (p < 0.05) higher F release and rerelease among all the tested materials. Among the tested composites, R2: Tetric® N-Flow exhibited significantly higher F dynamics than R1: Jen Rainbow composite.
Conclusion
All the tested restorative materials exhibited optimum F release (0.024 ppm, that is, the range to prevent newer carious lesions) in both the pre and postrecharge conditions. Even though Fuji-II LC demonstrated significantly better F dynamics in the tested scenarios, Tetric® N-Flow has the additional advantage of improved mechanical retentive and esthetic properties along with the optimum F release in pre and postrecharge scenarios.
How to cite this article
Mathias MR, Rathi N, Bendgude VD, et al. Comparative Fluoride Ion Release Pre and Postrecharge Situations among Three Different Pediatric Dental Restorative Materials: An In Vitro Study. Int J Clin Pediatr Dent 2022;15(6):729-735.
Keywords: Acidulated phosphate fluoride gel, Fluoride release, Fluoride rerelease, Ion selective electrode
Introduction
Dental caries is a multifactorial disease affecting 60–90% of children and adults.1,2 F agents exhibit significant cariostatic activity.3,4 The F reduces the metabolic activity of bacteria and interferes with its adhesion by forming caries-resistant fluorohydroxyapatite crystals.5,6 The anticaries properties of F ions reduce the failure rate related to secondary caries in restorative materials. The amount of F released by the material is correlated with this property. Literature reports that the incorporation of F ions within the matrix or filler like yttrium F facilitates the release of F ions.7,8 Alternatively, hydrophobic materials are made hydrophilic by adding 2-hydroxyethyl methacrylate into the resin matrix to make them anticariogenic. Clinically, this is useful when the release is sustained over a longer period of time. Topical F application can restore F ions.9–11 Literature has demonstrated that F ions released in deionized water are stable. Nevertheless, it does not reflect the true complexity of the oral environment.8,12
Even though many advances have been made in restorative materials, the release of F from relatively newly developed materials like Jen Rainbow, Tetric® N-Flow, and Fuji II LC hasn't been studied in-depth, and the existing literature fails to explain the rechargeability of these materials. The purpose of this study is to evaluate F dynamics in artificial saliva (M1) and deionized water (M2) over different time intervals (release 1st, 7th, 14th, 21st, and 30th day and rerelease 31st, 37th, 44th, 51st, and 60th day).
Materials and Methods
This study was carried out after taking Ethical and Scientific Committee approval (DPU/1184/41/2019) by Dr D Y Patil Vidyapeeth (DPU) (Deemed to be University), Pune, and Environmental Science Technology Study Centre of Bapuji Institute of Engineering and Technology, Davangere, Karnataka, India. The materials used in this study were R1: Jen Rainbow composite (Jen Dent Ukraine), R2: Tetric® N-Flow (Ivoclar Vivadent), and R3: RMGIC Fuji II LC (GC Corporation) (Figs 1 to 3).
Fig. 1.

Jen Rainbow
Fig. 3.

RMGIC Fuji II LC
Fig. 2.

Tetric® N-Flow
Preparation of the Disk
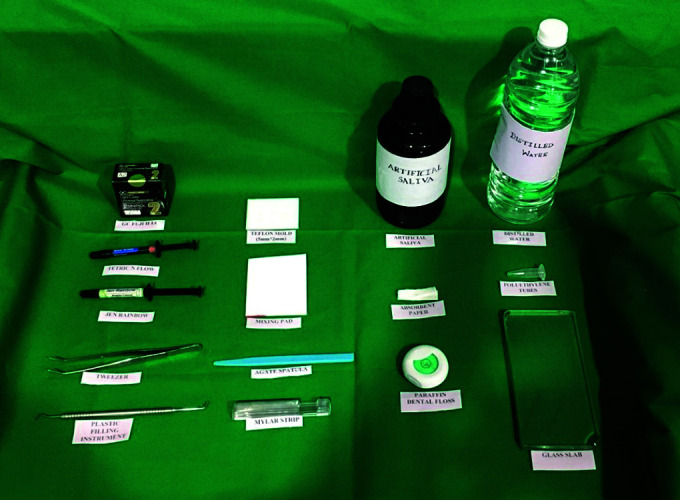
A total of 30 disks, 10 disks of each restorative material R1: Jen Rainbow, Jen Dent Ukraine; R2: Tetric® N-Flow, Ivoclar-Vivadent; and R3: RMGIC (Fuji II LC- GC Corporation) were fabricated in polytetrafluoroethylene mold (5 × 2 mm diameter), and were tested for F dynamics in two different media M1: artificial saliva, M2: deionized water group. Dental floss was incorporated into each disk, and a mylar strip was supported on either side by glass slabs prior to curing. The cured disk was stored at room temperature for 24 hours (Figs 4 and 5).13–15
Fig. 4.

Artificial saliva
Fig. 5.
Deionized water
Disk Specimens are grouped as follows
A total of 10 disks of each restorative material were divided equally between two storage media tested, media 1 and 2 [M1, artificial saliva (M1); M2, deionized water]. Each disk was suspended in a polyethylene tube containing 4 mL of storage media [artificial saliva (M1) or deionized water] in an airtight container for 24 hours. After 24 hours, the suspended disk was rinsed with 1 mL of respective media (wash media). A total of 5 mL was collected for F analysis (4 mL of storage media and 1 mL of wash media). The same disk was then transferred into a fresh storage media for subsequent analysis. The testing was carried out every week on the 1st, 7th, 14th, 21st, and 30th day of the month.
Replenishing Disks with APF Gel
On the 30th day of initial F release, all specimens from each material were exposed to 1.23% APF gel (Pascal International, USA) for 4 minutes. The excess gel was washed with respective media, and each disk was then dried with absorbent paper before being immersed in the airtight container containing 4 mL of fresh deionized water (M2) and artificial saliva (M1) in accordance with subgroups. Following the application of APF gel, F analysis was performed after the 31st, 37th, 44th, 51st, and 60th days.
Estimation of F Release before and after recharging
Fluoride (F) release was determined by buffering 5 mL of storage media with 0.1 mL of total ionic strengths buffer (TISAB III). In order to ensure the accuracy of the F concentration measurement, the manufacturer's recommendations were followed along with standard solutions used to calibrate the F electrode (Orion). Standard solutions at concentrations of 0.1, 1, 10, 50, and 100 ppm were prepared from a 100 ppm stock solution of F. The electrode was recalibrated after every 10 measurements with the standard solutions of 1 and 10 ppm.15,16 The collected data were analyzed statistically.
Statistical Analysis
Using Statistical Package for the Social Sciences 17.0 software, F release levels (ppm) of various dental restorative materials in different media were analyzed before and after the application of APF gel. The average and standard deviation were calculated for F release. We used the two-way ANOVA test followed by the post hoc Bonferroni test to compare intergroup and intragroup. The significance level was set at p < 0.05.
Result
Table 1 shows the F release from each material pre and postrecharge in the two storage media over a period of 10 weeks, expressed as mean ± standard deviation.
Table 1.
Comparing F ion release and recharge from three dental restorations between artificial saliva (M1) and deionized water medium (M2)
| Days | F release before application of 1.23% APF Gel | |||||
|---|---|---|---|---|---|---|
| Artificial saliva (M1) | Deionized water (M2) | |||||
| R1 Jen Rainbow | R2 Tetric® N-Flow | R3 Fuji II LC | R1 Jen Rainbow | R2 Tetric® N-Flow | R3 Fuji II LC | |
| 1st | 4.05 ± 0.14 | 4.05 ± 0.14 | 3.99 ± 0.01 | 3.79 ± 0.01 | 3.88 ± 0.10 | 3.77 ± 0.04 |
| 7th | 3.67 ± 0.01 | 3.72 ± 0.04 | 3.73 ± 0.00 | 3.56 ± 0.12 | 3.71 ± 0.01 | 3.73 ± 0.04 |
| 14th | 2.19 ± 0.20 | 3.67 ±0.01 | 3.72 ± 0.00 | 1.83 ± 0.13 | 1.87 ± 0.10 | 2.05 ± 0.06 |
| 21st | 1.32 ± 0.17 | 1.48 ± 0.03 | 1.50 ± 0.12 | 1.47 ± 0.04 | 1.54 ± 0.29 | 1.72 ± 0.14 |
| 30th | 1.25 ± 0.23 | 1.25 ± 0.18 | 1.48 ± 0.04 | 1.28 ± 0.03 | 1.36 ± 0.04 | 1.56 ± 0.05 |
| 270.465 0.001* |
931.613 p< 0.001* |
1289.508 p< 0.0001* |
411.925 p< 0.001* |
1125.461 p< 0.001* |
2694.810 p< 0.0001* |
|
| F release after application of 1.23% APF Gel | ||||||
| 31st | 1.78 ± 0.38 | 1.78 ± 0.38 | 1.70 ± 0.06 | 1.50 ± 0.23 | 1.45 ± 0.01* | 1.93 ± 0.15 |
| 37th | 1.14 ± 0.06 | 1.23 ± 0.08 | 1.32 ± 0.08 | 1.34 ± 0.07 | 1.47 ± 0.21 | 1.80 ± 0.07 |
| 44th | 1.04 ± 0.01 | 1.04 ± 0.01 | 1.11 ± 0.09 | 1.21 ± 0.17 | 1.35 ± 0.34 | 1.76 ± 0.01* |
| 51st | 0.74 ± 0.02 | 0.78 ± 0.04 | 0.95 ± 0.03 | 0.78 ± 0.04* | 0.78 ± 0.04 | 0.86 ± 0.05 |
| 60th | 0.03 ± 0.01 | 0.72 ± 0.04 | 0.73 ± 0.00 | 0.01 ± 0.02* | 0.70 ± 0.01* | 0.73 ± 0.00 |
| 19.319 p< 0.001* |
223.89 p< 0.0001* |
53.168 p< 0.0001* |
9.620 p< 0.001 |
45.033 p< 0.001* |
29.219 p = 0.001* |
|
*Significance at p < 0.005
Prerecharge release of F Ions in Artificial Saliva (M1) and Deionized Water Media
All the tested restorative materials exhibited peak F release on the 1st day, then decreased gradually from 7th to 21st day, and maintained a steady rate until the 30th day of prerecharge. The F release between the interval was statistically significant by all the materials (p < 0.05). In the artificial saliva media (M1), Jen Rainbow (R1) released a significant amount of F on 1st and 30th day compared to the 7th, 14th, and 21st day by Tetric® N-Flow (R2). Whereas, Fuji II LC (R3) released significant F from the 1st to the 30th day. In deionized water, Tetric® N-Flow (R2) and Fuji II C (R3) showed significant F released from the 7th day, whereas Jen Rainbow released statistically significant F until the 21st day (Table 1).
Postrecharge release of F Ions in Artificial Saliva (M1) and Deionized Water Media (M2)
All three materials released statistically significant F in decreasing order on the 31st, 37th, and 44th day in both media. Jen Rainbow material released a significant amount of F on the 31st day in artificial saliva (M1) media and on the 51st day in deionized water media (M2), whereas Tetric® N-Flow released a significant amount of F on the 37th, 44th, and 60th days. Compared to composite resin, Fuji II LC released significant F from the 31st to the 60th day (M1 and M2) (Tables 1 and 2). Both the media (M1 and M2) showed statistically significant postrecharge F release. Despite the lower F release rate during the postrecharge phase compared to the prerecharge phase (p < 0.05), the release was within the optimum range (0.024 ppm) (Table 1).
Table 2.
Difference in the F release after recharge between materials in artificial saliva (M1) and deionized water (M2) using post hoc Tukey's test
| Days | Artificial saliva (M1) | Deionized water (M2) | ||||||
|---|---|---|---|---|---|---|---|---|
| R1 | R2 | R3 | Mean F, p-value | R1 | R2 | R3 | Mean F, p-value | |
| 1st | 0.26200 0.003* |
0.25200 <0.0001* |
14.63 0.001* |
57.06 <0.0001* |
||||
| 7th | 0.0380 0.001* |
0.1580 0.021* |
57.15 <0.0001* |
0.18200 <0.0001* |
0.26800 0.041* |
0.101 0.905 |
||
| 14th | 1.83800 <0.0001* |
1.85200 <0.0001* |
3.61 0.59 |
0.38000 0.020* |
5.43 0.021* |
|||
| 21st | 0.09400 0.003* |
0.47200 0.002* |
56.15 <0.0001* |
0.0940 0.006* |
2.84 0.098 |
|||
| 30th | 0.1960 0.047* |
0.0780 0.019* |
15.45 <0.0001* |
0. 02400 0.040* |
0.05000 <0.0001* |
14.66 0.001* |
||
*Significance at p < 0.005; significant difference at 1st, 7th 14th, 21st, and 30th day interval; artificial saliva (M1) (AS); deionized water (M2) (DW); Jen Rainbow (R1); Tetric® N-Flow (R2); Fuji II LC (R3); F, fluoride
In the Intragroup Comparison of F Release
In intragroup comparison, the F release was found to be decreasing across all the time intervals, and the difference seen among them was statistically significant (p < 0.001). Similar results were obtained in the postrecharge phase, wherein R3 showed the highest F uptake and rerelease, followed by R2 and R1 in descending order (Table 3). And the F rerelease values were to be decreasing with time, and this was consistent with all the groups in both media (M1 and M2) (Table 3).
Table 3.
Intragroup comparison of F release and recharge values at specified time intervals in artificial saliva (M1) and deionized water (M2) using post hoc Bonferroni test for of Jen Rainbow, Tetric® N-Flow, and Fuji II LC
| Material | 1–7th | 1–14th | 1–21st | 1–30th | 7–14th | 7–21st | 7–30th | 14–21st | 14–30th | Mean F |
|---|---|---|---|---|---|---|---|---|---|---|
| F release | ||||||||||
| Artificial saliva (M1) | ||||||||||
| R1 | 1.860* <0.0001 |
2.804* 0.001 |
2.732* <0.0001* |
1.540* 0.001* |
2.484* <0.0001* |
2.412* <0.0001* |
270.465 0.001* |
|||
| R2 | 0.384* 0.031* |
0.384* 0.031* |
2.576* <0.0001* |
2.554* <0.0001* |
2.192* <0.0001* |
2.170* <0.0001* |
2.192* <0.0001* |
2.170* <0.0001* |
931.613 p< 0.001* |
|
| R3 | 0.266* <0.0001* |
0.266* <0.0001* |
2.738* <0.0001* |
2.508* <0.0001* |
2.472* <0.0001* |
2.242* <0.0001* |
2.472* <0.0001* |
2.242* <0.0001* |
1289.508 p< 0.0001* |
|
| Deionized water (M2) | ||||||||||
| R1 | 1.744* <0.0001* |
2.248* 0.001* |
2.274* <0.0001* |
1.722* <0.0001* |
1.722* <0.0001* |
2.252* <0.0001* |
411.925 p< 0.001* |
|||
| R2 | 2.052* <0.0001* |
2.500* <0.0001* |
2.412* <0.0001* |
1.876* <0.0001* |
2.324* <0.0001* |
2.324* <0.0001* |
1125.461 p< 0.001* |
|||
| R3 | 0.172 0.008* |
1.866* <0.0001* |
2.014* <0.0001* |
2.178* <0.0001* |
1.694* <0.0001* |
1.842* <0.0001* |
2.006* <0.0001* |
0.148* 0.033* |
0.312* 0.002* |
2694.810 p< 0.0001* |
| F recharge | ||||||||||
| Material | 31–37th | 31–44th | 31–5st | 31–60th | 37–44th | 37–51st | 37– 60th | 44–51st | 44–60th | Mean F |
| Artificial saliva (M1) | ||||||||||
| R1 |
0.566*
0.007* |
0.298*
0.006* |
.372*
0.001* |
0.074*
0.008* |
19.319 P= 0.001* |
|||||
| R2 |
0.878*
0.002* |
1.182*
0.001* |
1.182*
0.001* |
0.668*
<0.0001* |
0.972*
<0.0001* |
0.964*
<0.0001* |
0.304*
0.001* |
0.296*
<0.0001* |
223.89 P<0.0001* |
|
| R3 | 0.086* 0.008* |
0.366* <0.0001* |
0.412* 0.001* |
0.452* <0.0001* |
0.452* <0.0001* |
0.336* 0.047* |
0.382* 0.008* |
53.168 p<0.0001* |
||
| Deionized water (M2) | ||||||||||
| R1 | 0.444* <0.0001* |
0.596* <0.0001* |
0.612*
0.013* |
9.620 p< 0.001 |
||||||
| R2 | 0.410* 0.014* |
1.132* <0.0001* |
1.168* .001* | 0.722* <0.0001* |
0.758* <0.0001* |
45.033 p< 0.001* |
||||
| R3 | 0.556* <0.0001* |
556* <0.0001* |
0.286* 0.009* |
0.716* 0.042* |
716* 0.027* |
29.219 p = 0.001* |
||||
*Significance at p < 0.005
In the Intergroup Comparison of F Release
In the pre and postrecharge phase, Fuji II LC (R3) had the highest amount of F release, which was statistically different (p < 0.05) from all the other tested groups, followed by R2 and R1 showed the least amount of F release in artificial saliva (M1) and deionized water (M2) media (Tables 4 and 5).
Table 4.
Intergroup comparison of F release values at specified time intervals in artificial saliva (M1) and deionized water (M2) using post hoc Tukey's test
| F release (M1) | F release (M2) | ||
|---|---|---|---|
| 1st | R1-R2 | 0.14800* 0.008 |
|
| R2-R3 | |||
| R3-R1 | |||
| 7th | R1-R2 | 0.06400 0.003* |
0.14400* 0.027* |
| R2-R3 | 0.05200* 0.012* |
0.20600* 0.003* |
|
| R3-R1 | |||
| 14th | R1-R2 | 1.47600 <0.0001* |
0.21600* 0.012* |
| R2-R3 | 1.52800* <0.0001* |
||
| R3-R1 | 1.52800* <.0001* |
0.17800* 0.035* |
|
| 21st | R1-R2 | 0.33800* 0.035* |
|
| R2-R3 | |||
| R3-R1 | |||
| 30th | R1-R2 | ||
| R2-R3 | |||
| R3-R1 |
*Significance at p < 0.005; Significant difference at 1st, 7th, 14th, 21st, and 30th day interval; [artificial saliva (M1) (deionized water (M2); R1, Jen Rainbow; R2, Tetric® N-Flow; R3, Fuji II LC; F, fluoride]
Table 5.
Intergroup comparison of F recharge values at specified time intervals in artificial saliva (M1) and deionized water (M2) using post hoc Tukey's test
| F recharge (M1) | F recharge (M2) | ||
|---|---|---|---|
| 31st | R1-R2 | 0.13800 0.647 |
0.47800* <0.0001* |
| R2-R3 | 0.77200* 0.001* |
0.59600* <0.0001* |
|
| R3-R1 | 0.63400* 0.003* |
||
| 37th | R1-R2 | ||
| R2-R3 | 0.47600* <0.0001* |
||
| R3-R1 | |||
| 44th | R1-R2 | 0.58800* 0.001* |
|
| R2-R3 | |||
| R3-R1 |
0.57200*
0.002* |
||
| 51st | R1-R2 | 0.22000* <0.0001* |
|
| R2-R3 | |||
| R3-R1 | 0.17600* <0.0001* |
||
| 60th | R1-R2 | 0.47000* 0.001* |
0.40600* 0.016* |
| R2-R3 | |||
| R3-R1 | 0.48000* 0.001* |
*Significance at p < 0.005; Significant difference at 1st, 7th, 14th, 21st, and 30th day interval; [artificial saliva (M1) (deionized water (M2) R1, Jen Rainbow; R2, Tetric® N-Flow; R3, Fuji II LC; F, fluoride]
All restorative materials released F in the following order:
Both artificial saliva (M1) and deionized media: Tetric® N-Flow > Jen Rainbow > Fuji II LC after 24 hours and Fuji II LC > Tetric® N-Flow > Jen Rainbow on 7th, 14th, 21st, and 30th day.
After applying APF Gel, both artificial saliva (M1) and deionized water (M2) media: Tetric® N-Flow, Jen Rainbow > Fuji II LC in both media after 24 hours and Fuji II LC> >Tetric® N-Flow >Jen Rainbow from 37th day to the end of the experimental period.
The F release by Jen Rainbow, Tetric® N-Flow, and RMGIC (Fuji II LC) at all measurement intervals were maximum in deionized water (M1) > artificial saliva (M1) before recharge and artificial saliva (M1) > deionized water (M2) after recharge.
Discussion
Fluoride (F) Ions released from Artificial Saliva (M1) and Deionized Water (M2)
In materials, the amount of F ion released will determine how effective it is at preventing caries. F is released in two phases by GIC, first by rapid release and then by diffusion-facilitated slower release for the long run.3,13 F is released into the surrounding tissue immediately after GIC is set. Furthermore, it can recharge itself. The use of deionized water (M2) is considered to give the most accurate estimate of F released because there are no existing ions in it.15,17,18 The current study proposed artificial saliva (M1) in an attempt to provide more reliable oral conditions, an opinion that has been endorsed by other authors.17,19,20
The purpose of the current study was to compare F ion release before and after recharging artificial saliva (M1) and deionized water (M2). It has been determined that the environment in which the materials are stored has no effect on the sequence of materials but can affect F release quantities. Therefore, the contents of the materials are thought to play an important role in ion release. The greatest release was found in Fuji II LC, followed by composite resin. Similarly, Mousavinasab and Meyers21 compared F release in deionized water (M2) with high viscosity GIC, RMGIC, compomer, and giomer. This study suggests that F release is highest in the case of high viscosity GIC, followed by RMGIC, and lowest in the case of giomer, when RMGIC has a lower F release because the resin matrix surrounds them.21
All materials released the most F on the 1st day. Jen Rainbow and Tetric® N-Flow were the highest, followed by Fuji II LC. The initial high F release by Jen Rainbow and Tetric® N-Flow contributed to the material's composition of fluoridated fillers. Subsequently, the release was gradually reduced. As a result of F absorbed into the restorative materials, this release has occurred. In this process, ions present in the media are important.22
In comparison to Jen Rainbow, Tetric® N-Flow released higher F throughout the remaining period. This is said to be due to the presence of the main source of F containing ytterbium F filler within the matrix of the composite resin.10,12,23 Whereas RMGIC (Fuji II LC) released maximum F on the 1st day due to the initial acid–base reaction, where integrating powder particles into a matrix facilitates rapidly diffused F from the surface by ”the initial burst effect.” This surface lost F ions are later replaced by diffusion of ions from the subsurface layer of the set cement matrix, which facilitates gradual slow F release throughout the study period. This was in accordance with the study by Weidlich et al.3
Overall, all the materials have released a significant amount of F in both artificial saliva (M1) and deionized water (M2) media in the descending order of Fuji II LC, followed by Tetric® N-Flow and Jen Rainbow in both media. This was similar to the study by Gururaj et al.24 and Harhash et al.,25 who stated, RMGIC releases a significantly high amount of F compared to resin composites materials. Although the release of F by Jen Rainbow was lesser in both the media, still it was more than the minimum concentration required for the prevention of caries.
Fluoride (F) ions released after recharging in Artificial saliva (M1) and Deionized water (M2)
Literature shows that F release from restorative materials decreases over time, and they need to be recharged with topical F agents to maintain the anticavity property. F ions release depends on inbuilt matrix and filler content, as well as the length of time that the charging agent is in contact with the material.26,27
After the recharge with 1.23% APF gel, Tetric® N-Flow released maximum and a significant amount of F in both mediums, and Jen Rainbow released a significant amount of F in deionized water (M2) alone. Fuji II LC released significant amounts of F in artificial saliva (M1) compared to deionized water (M2). In principle, hydrophilic resin and Ytterbium F in high concentration may allow the release of F even in ionized media like artificial saliva (M1).12,22,25 Jen Rainbow may have contained a lower concentration of F, which led to decreased F release in the ionic salivary medium having a higher concentration gradient of ions. Our study is in accordance with the study by Dionysopoulos, who presented a similar pattern of F release.9
The Fuji II LC material released a significant amount of F into artificial saliva (M1). This may be due to the water absorption by the 2-hydroxyethyl methacrylate, which enables the diffusion of F ions that are otherwise firmly encapsulated within the polyacrylate matrix. As well, the hydrophilic additives in the material at a sufficient rate may be promoting F release from the restorative materials.16 The postrecharge results of our study are consistent with those of the studies by Gandolfi et al.22 and Vieira et al.,28 in which pH is associated with F release. It is known that the amount of F released from a material is directly correlated with the acidic environment, where increased storage media acidity increases F release. As reported by Quader et al.,29 high viscosity GIC, compomer, and giomer also exhibited F rechargeability, and the GIC tested released the highest levels of F ions before and after recharging. In the same way, our study showed all materials were released after recharge and were similar to the prerecharge sequence.
In a similar study, Ghajari et al.30 evaluated the F recharging properties of three GIC by using sodium F and APF gels. Despite all materials releasing F ions, the APF gel group released the maximum amount of F ions in his study. In a similar fashion, Bansal et al.31 evaluated F release and rechargeability of restorative materials, and concluded the highest level of F ions were released on the 1st day, followed by a sharp decline. According to these investigators, our results are in agreement. F levels were initially highest on the 31st day, then dropped abruptly by the 37th day, and continued to decline throughout the experiment.
Fluoride (F) Release in Artificial Saliva (M1) and Deionized Medium
Fluoride (F) was released at a higher rate in artificial saliva (M1) postrecharge due to its higher pH than in deionized water (M2). According to Naoum et al.,32 this difference can be explained by the fact that porous materials release more F ions in an acidic environment. This means that in oral conditions, all the tested materials have a greater potential for recharge and provide the greatest amount of F to help prevent caries. Yusoff et al.33 compared F ion release from conventional GIC, RMGIC, and composite in deionized water (M2) and artificial saliva (M1). The material releases more F into artificial saliva (M1) than into deionized water (M2). In accordance with these studies, in the present study, F release from all materials in artificial saliva (M1) showed a significantly lower release rate than deionized water (M2) in prerecharge phase (p < 0.05).
The present study is limited by the fact that the oral environment is dynamic and different from the laboratory environment. We did not test whether the above-tested material releases F effectively in an oral environment to prevent and inhibit caries. The daily use of fluoridated dentifrices provides constant F recharge more effectively than APF gel. Artificial saliva (M1) cannot mimic saliva from the mouth. Therefore, it is not possible to extrapolate the findings of this study to clinical settings.
Conclusion
Patients with moderate to high levels of caries are advised to use F-releasing materials that release the highest levels of F. In light of the limitations of this study, the following conclusion can be drawn:
All tested materials were capable of releasing and recharging F ions.
Of the tested materials, Fuji II LC consistently released the most F.
Fluoride (F)—releasing composite resins released fewer F ions and had lower recharge capacities.
Each of the tested materials released F in a similar manner after being recharged with 1.23% APF gel for 4 minutes.
From day 1 to 14, all materials released 1 ppm of F in both artificial saliva (M1) and deionized water (M2).
Clinical Significance
From a clinical standpoint, all of the tested materials could provide a controlled release of F in the oral cavity at the site of recurrent caries risk. However, the selection of the device should be based on specific clinical circumstances.
Footnotes
Source of support: Nil
Conflict of interest: None
Orcid
Merlyn R Mathias https://orcid.org/0000-0001-8051-2900
Nilesh Rathi https://orcid.org/0000-0003-0595-5191
Vikas D Bendgude https://orcid.org/0000-0002-9810-9527
Sunnypriyatham Tirupathi https://orcid.org/0000-0002-2593-0090
Rashmi S Chauhan https://orcid.org/0000-0002-5331-8616
Apurva Borde https://orcid.org/0000-0001-9320-8780
Tripti Lath https://orcid.org/0000-0002-3299-3671
Sejal S Shah https://orcid.org/0000-0002-1119-5857
References
- 1.Petersen PE, Bourgeois D, Ogawa H, et al. The global burden of oral diseases and risks to oral health. Bull World Health Organ. 2005;83(9):661–669. doi: 10.1590/S0042-96862005000900011. [DOI] [PMC free article] [PubMed] [Google Scholar]
- 2.Klai S, Altenburger M, Spitzmüller B, et al. Antimicrobial effects of dental luting glass ionomer cements on streptococcus mutans. Scientific World Journal. 2014;2014:807086. doi: 10.1155/2014/807086. [DOI] [PMC free article] [PubMed] [Google Scholar]
- 3.Weidlich P, Miranda LA, Maltz M, et al. Fluoride release and uptake from glass ionomer cements and composite resins. Braz Dent J. 2000;11(2):89–96. [PubMed] [Google Scholar]
- 4.World Health Organization. WHO expert consultation on public health intervention against early childhood caries report of a meeting, Bangkok, Thailand: 2016. pp. 26–28. [Google Scholar]
- 5.Neelakantan P, John S, Anand S, et al. Fluoride release from a new glass-ionomer cement. Oper Dent. 2011;36(1):80–85. doi: 10.2341/10-219-LR. [DOI] [PubMed] [Google Scholar]
- 6.Vermeersch G, Leloup G, Vreven J. Fluoride release from glass-ionomer cements, compomers and resin composites. J Oral Rehabil. 2001;28(1):26–32. doi: 10.1046/j.1365-2842.2001.00635.x. [DOI] [PubMed] [Google Scholar]
- 7.Pedrini D, Delbem AC, de França JG, et al. Fluoride release by restorative materials before and after a topical application of fluoride gel. Pesqui Odontol Bras. 2003;17(2):137–141. doi: 10.1590/s1517-74912003000200007. [DOI] [PubMed] [Google Scholar]
- 8.Attar N, Turgut MD. Fluoride release and uptake capacities of fluoride-releasing restorative materials. Oper Dent. 2003;28(4):395–402. [PubMed] [Google Scholar]
- 9.Dionysopoulos D. The effect of fluoride-releasing restorative materials on inhibition of secondary caries formation. Fluoride. 2014;47(3):258–265. [Google Scholar]
- 10.Jingarwar MM, Pathak A, Bajwa NK, et al. Quantitative assessment of fluoride release and recharge ability of different restorative materials in different media: an in vitro study. J Clin Diagn Res. 2014;8(12):ZC31–ZC34. doi: 10.7860/JCDR/2014/9985.5275. [DOI] [PMC free article] [PubMed] [Google Scholar]
- 11.Yoda A, Nikaido T, Ikeda M, et al. Effect of curing method and storage condition on fluoride ion release from a fluoride-releasing resin cement. Dent Mater J. 2006;25(2):261–266. doi: 10.4012/dmj.25.261. [DOI] [PubMed] [Google Scholar]
- 12.G Nigam A, Jaiswal J, Murthy R, et al. Estimation of fluoride release from various dental materials in different media-an in vitro study. Int J Clin Pediatr Dent. 2009;2(1):1–8. doi: 10.5005/jp-journals-10005-1033. [DOI] [PMC free article] [PubMed] [Google Scholar]
- 13.Upadhyay S, Rao A, Shenoy R. Comparison of the amount of fluoride release from nanofilled resin modified glass ionomer, conventional and resin modified glass ionomer cements. J Dent (Tehran) 2013;10(2):134–140. [PMC free article] [PubMed] [Google Scholar]
- 14.Gleisner H, Einax JW, Morés S, et al. A fast and accurate method for the determination of total and soluble fluorine in toothpaste using high-resolution graphite furnace molecular absorption spectrometry and its comparison with established techniques. J Pharm Biomed Anal. 2011;54(5):1040–1046. doi: 10.1016/j.jpba.2010.12.013. [DOI] [PubMed] [Google Scholar]
- 15.Paschoal MA, Gurgel CV, Rios D, et al. Fluoride release profile of a nanofilled resin-modified glass ionomer cement. Braz Dent J. 2011;22(4):275–279. doi: 10.1590/s0103-64402011000400002. [DOI] [PubMed] [Google Scholar]
- 16.Nagi SM, Moharam LM, Hoshy AZ. Fluoride release and recharge of enhanced resin modified glass ionomer at different time intervals. Futur Dent J. 2018;4(2):221–224. doi: 10.1016/j.fdj.2018.06.005. [DOI] [Google Scholar]
- 17.Preston AJ, Mair LH, Agalamanyi EA, et al. Fluoride release from aesthetic dental materials. J Oral Rehabil. 1999;26(2):123–129. doi: 10.1046/j.1365-2842.1999.00357.x. [DOI] [PubMed] [Google Scholar]
- 18.Lee SY, Dong DR, Huang HM, et al. Fluoride ion diffusion from a glass-ionomer cement. J Oral Rehabil. 2000;27(7):576–586. doi: 10.1046/j.1365-2842.2000.00554.x. [DOI] [PubMed] [Google Scholar]
- 19.Hattab FN, Amin WM. Fluoride release from glass ionomer restorative materials and the effects of surface coating. Biomaterials. 2001;22(12):1449–1458. doi: 10.1016/s0142-9612(00)00253-2. [DOI] [PubMed] [Google Scholar]
- 20.Kowsari A, Mahmoodian Jh, Ghavami T. An In-vitro study on the release of fluoride from two restorative materials and their rechargeability after exposure to daily 1000 ppm fluoride. J Dent (Tehran) 2005;2(3):79–85. [Google Scholar]
- 21.Mousavinasab SM, Meyers I. Fluoride release by glass ionomer cements, compomer and giomer. Dent Res J (Isfahan) 2009;6(2):75–81. [PMC free article] [PubMed] [Google Scholar]
- 22.Gandolfi MG, Chersoni S, Acquaviva GL, et al. Fluoride release and absorption at different pH from glass-ionomer cements. Dent Mater. 2006;22(5):441–449. doi: 10.1016/j.dental.2005.04.036. [DOI] [PubMed] [Google Scholar]
- 23.Karantakis P, Helvatjoglou-Antoniades M, Theodoridou-Pahini S, et al. Fluoride release from three glass ionomers, a compomer, and a composite resin in water, artificial saliva, and lactic acid. Oper Dent. 2000;25(1):20–25. [PubMed] [Google Scholar]
- 24.Gururaj M, Shetty R, Nayak M, et al. Fluoride releasing and uptake capacities of esthetic restorations. J Contemp Dent Pract. 2013;14(5):887–891. doi: 10.5005/jp-journals-10024-1421. [DOI] [PubMed] [Google Scholar]
- 25.Harhash AY, ElSayad II, Zaghloul AGS. A comparative in vitro study on fluoride release and water sorption of different flowable esthetic restorative materials. Eur J Dent. 2017;11(2):174–179. doi: 10.4103/ejd.ejd_228_16. [DOI] [PMC free article] [PubMed] [Google Scholar]
- 26.Hasan AMHR, Sidhu SK, Nicholson JW. Fluoride release and uptake in enhanced bioactivity glass ionomer cement (”glass carbomer™”) compared with conventional and resin-modified glass ionomer cements. J Appl Oral Sci. 2019;27(1):e20180230. doi: 10.1590/1678-7757-2018-0230. [DOI] [PMC free article] [PubMed] [Google Scholar]
- 27.Rao BS, Moosani GK, Shanmugaraj M, et al. Fluoride release and uptake of five dental restoratives from mouthwashes and dentifrices. J Int Oral Health. 2015;7(1):1–5. [PMC free article] [PubMed] [Google Scholar]
- 28.Vieira AR, de Souza IP, Modesto A. Fluoride uptake and release by composites and glass ionomers in a high caries challenge situation. Am J Dent. 1999;12(1):14–18. [PubMed] [Google Scholar]
- 29.Quader SA, Alam MS, Bashar A, et al. Compressive strength, fluoride release and recharge of giomer. Updat Dent Coll J. 2012;2(2):28–37. doi: 10.3329/updcj.v2i2.15533. [DOI] [Google Scholar]
- 30.Ghajari MF, Torabzadeh H, Safavi N, et al. Fluoride release from three glass ionomers after exposure to sodium fluoride and acidulated phosphate fluoride gels. Dent Res J (Isfahan) 2014;11(5):604–609. [PMC free article] [PubMed] [Google Scholar]
- 31.Bansal R, Bansal T. A comparative evaluation of the amount of fluoride release and re-release after recharging from aesthetic restorative materials: an in vitro study. J Clin Diagn Res. 2015;9(8):ZC11–ZC14. doi: 10.7860/JCDR/2015/11926.6278. [DOI] [PMC free article] [PubMed] [Google Scholar]
- 32.Naoum S, Ellakwa A, Martin F, et al. Fluoride release, recharge and mechanical property stability of various fluoride-containing resin composites. Oper Dent. 2011;36(4):422–432. doi: 10.2341/10-414-L. [DOI] [PubMed] [Google Scholar]
- 33.Yusoff NNAbN, Ariffin Z, Hassan A, et al. Fluoride release from dental restorations in de-ionized water and artificial saliva. Int Med J. 2013;20(5):635–638. [Google Scholar]