Abstract
Epigenetic inheritance describes the transmission of gene-regulatory information across generations without altering DNA sequences, allowing adaptation of offspring to environmental conditions. Small RNAs have been implicated in this, both via the oocyte and as well as the sperm. However, as much of the cellular content is extruded during spermatogenesis, it is unclear if cytoplasmic small RNAs can contribute to epigenetic inheritance via sperm. We identify a previously undescribed, sperm-specific germ granule, PEI granule, that mediates Paternal Epigenetic Inheritance, by retaining the cytoplasmic Argonaute protein WAGO-3 during spermatogenesis in Caenorhabditis elegans. We identify the PEI granule proteins PEI-1 and PEI-2, with distinct functions in this process: granule formation, Argonaute selectivity and subcellular localization. We further show that PEI granule segregation is coupled to transport of sperm-specific secretory vesicles via PEI-2, in an S-palmitoylation dependent manner. PEI-like proteins are found in human, suggesting that the identified mechanism may be conserved.
Keywords: Epigenetic inheritance, germ cell, RNAi, LLPS, condensate, WAGO-3, C. elegans, PEI-1, PEI-2, spermatogenesis, palmitoylation, FB-MO, germ granule, PEI granule
Editor Summary:
Schreier et al. report a previously undescribed cytoplasmic condensate, termed the Paternal Epigenetic Inheritance (PEI) granule, which contains the Argonaute protein WAGO-3 and 22G small RNAs and mediates paternal epigenetic inheritance in C. elegans.
Small RNAs, most notably short-interfering RNAs (siRNAs) and Piwi-interacting RNAs (piRNAs) 1, have been implicated in epigenetic inheritance. These molecules act as sequence-specific guides for Argonaute proteins, which in turn regulate gene expression 2-4. In the nematode C. elegans, siRNAs with an established role in epigenetic inheritance are the 22G RNAs 5-10. These are made in a process driven by the Mutator proteins MUT-16 and MUT-7 11-14, and are bound by members of the worm-specific Argonaute (WAGO) family, such as the cytoplasmic WAGO-4 and the nuclear HRDE-1 proteins 13-16, both of which have been implicated in maternal epigenetic inheritance 6,9,17. Also the Piwi protein PRG-1 is inherited via the oocyte, and maternal piRNAs can initiate WAGO-dependent silencing that can be inherited PRG-1-independently for many generations, in a process known as RNA-induced epigenetic silencing (RNAe) 18-20.
Interestingly, a second, Mutator-independent class of 22G RNAs also exists. These are bound by the Argonaute protein CSR-1, and are mostly derived from genes that are expressed and required in the germline 21. CSR-1-22G RNAs and Mutator-22G RNAs should not become mixed, lest important genes become inappropriately silenced, and epigenetic inheritance plays an important role in this. When embryos have a functional Mutator system, but their parents lacked both Mutator-22G RNAs and piRNAs, the Mutator system starts to produce 22G RNAs that are normally restricted to CSR-1 7,8. As a result, WAGO proteins such as HRDE-1 are loaded with CSR-1-type 22G RNAs, leading to the silencing of CSR-1 target genes, which in turn results in sterility 7,8. This phenotype, known as Mutator-induced sterility (Mis), effectively reveals a prominent self-targeting potential of the Mutator-22G RNAs, and shows that parental 22G RNAs and piRNAs play an essential role in suppressing this dangerous auto-immune-like property of the Mutator system.
Condensates are membraneless compartments that are important for sub-cellular organization29,30. In C. elegans, distinct condensates have been implicated in small RNA pathways and epigenetic inheritance: P granules, Z granules and Mutator foci, defined by PGL-1, ZNFX-1 and MUT-16, respectively 6,14,23. Interestingly, to date no such germ granule has been described in mature sperm24, and in fact P granules disappear during spermatogenesis 23. Possibly, this is linked to the massive cytoplasmic reduction during spermatogenesis. In C. elegans, during meiosis II a residual body is formed into which, for instance, ER, Golgi, free ribosomes 25 and the Argonaute protein ALG-3 are discarded 26. Hence, it is questionable whether paternal epigenetic inheritance 27-29 can be mediated via the cytoplasm.
RESULTS
WAGO-3 is required for inheritance
Mutants defective for epigenetic inheritance, such as hrde-1, often show a mortal germline phenotype (Mrt) 30, implying that fertility decreases over subsequent generations. We found that wago-3 mutants display a Mrt phenotype (Extended Data Fig. 1a), suggesting a role for WAGO-3 in epigenetic inheritance. To test this, we analyzed if WAGO-3 affects the heritability of a germline-specific mCherry::H2B transgene silenced RNAe 21-23,30-32. The RNAe status implies that the silencing was induced by PRG-1, but afterwards maintained in a prg-1 mutant background 21,23. Therefore, we assessed the RNAe-associated silencing in prg-1 mutant strains. We found that wago-3;prg-1 double mutants, but not prg-1 single mutants, stochastically lost silencing (Extended Data Fig. 1b-c). As expected 21-23, mut-7;prg-1 double mutants directly lost all silencing (Extended Data Fig. 1b-c). These data show that WAGO-3 has a role specifically in the inheritance of RNAe-related silencing.
WAGO-3 associates with paternal 22G RNAs
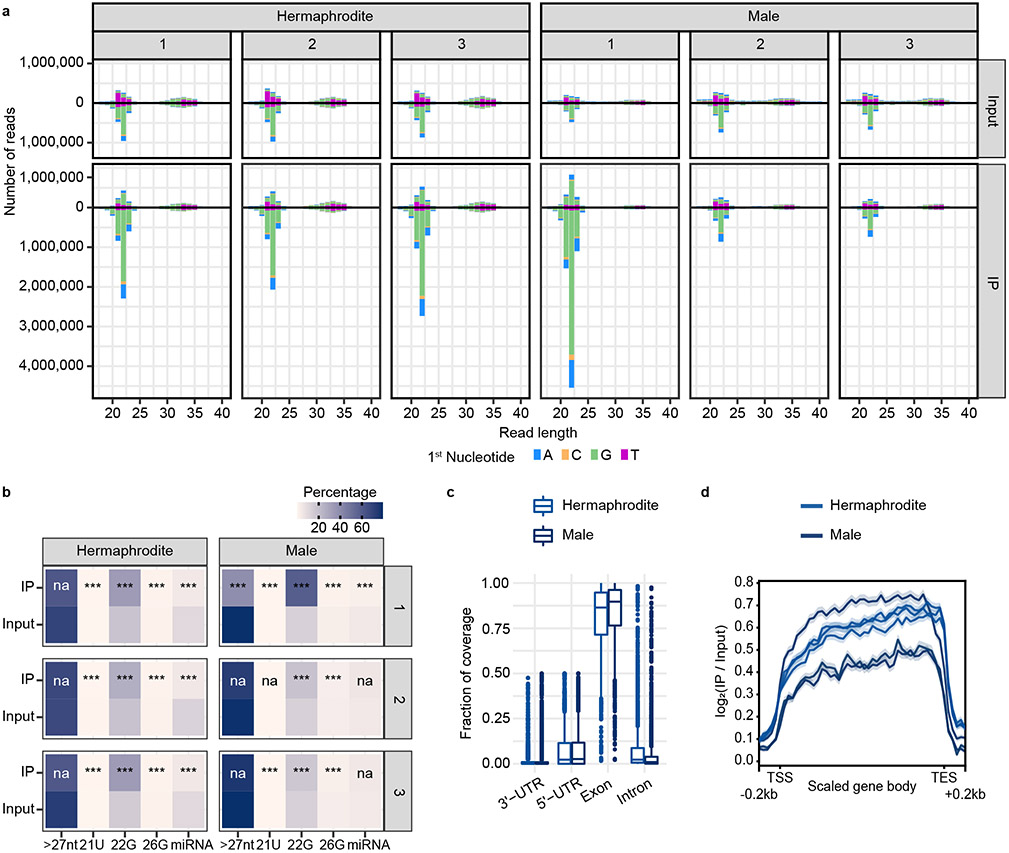
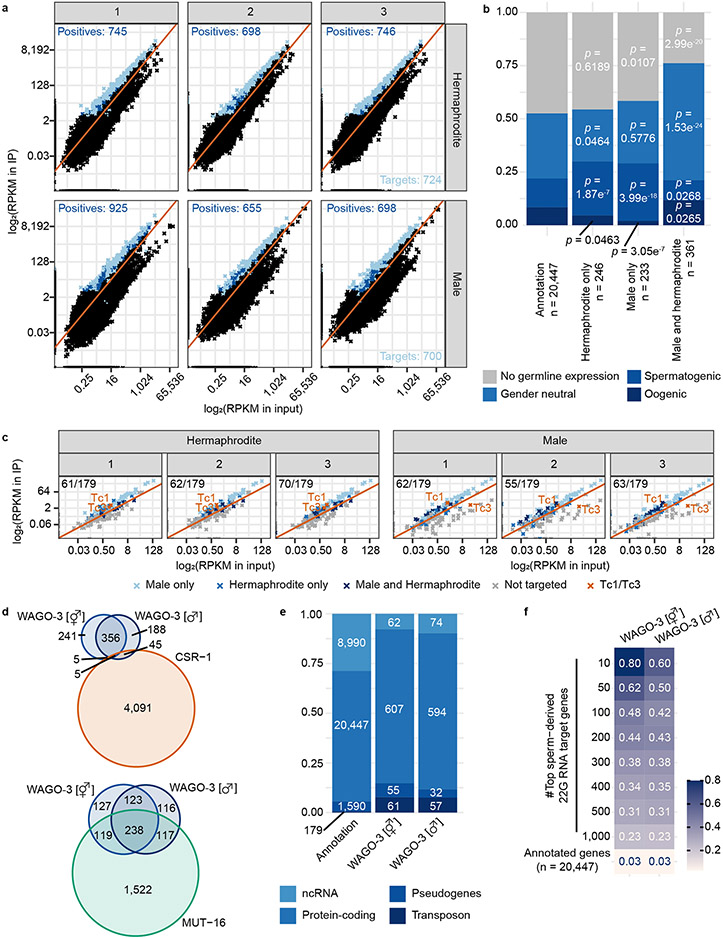
To enable immunoprecipitation (IP) experiments, we endogenously tagged WAGO-3 with GFP::3xFLAG at the N-terminus. We note that this may affect WAGO-3, as its N-terminus is processed 34. However, disruption of N-terminal WAGO-3 processing does not result in phenotypes when WAGO-1 is wild-type34, as is the case in our experiments. We used this tag to IP WAGO-3 from adult hermaphrodites, containing mature sperm and oogenic gonads, and adult males, and sequenced WAGO-3-bound 22G RNAs (Extended Data Fig. 2a-d) to identify WAGO-3 targets (Extended Data Fig. 3a-c). Many of these are protein-coding transcripts that are known Mutator targets (Phillips et al., 2012), while their overlap with CSR-1 targets is minor (Claycomb et al., 2009) (Extended Data Fig. 3d). In both sexes, many transposable elements were targeted by WAGO-3 (Extended Data Fig. 3c,e), including Tc1, consistent with WAGO-3’s role in Tc1 silencing 35,36. Interestingly, Tc3-derived 22G RNAs were consistently depleted from WAGO-3 in males (Extended Data Fig. 3c), suggesting sex-specific regulation of this element. Finally, we found a significant overlap between WAGO-3 targets and previously determined sperm-derived 22G RNA targets 37 (Extended Data Fig. 3f), suggesting that WAGO-3 is present in sperm.
WAGO-3 is guided into sperm by PEI granules
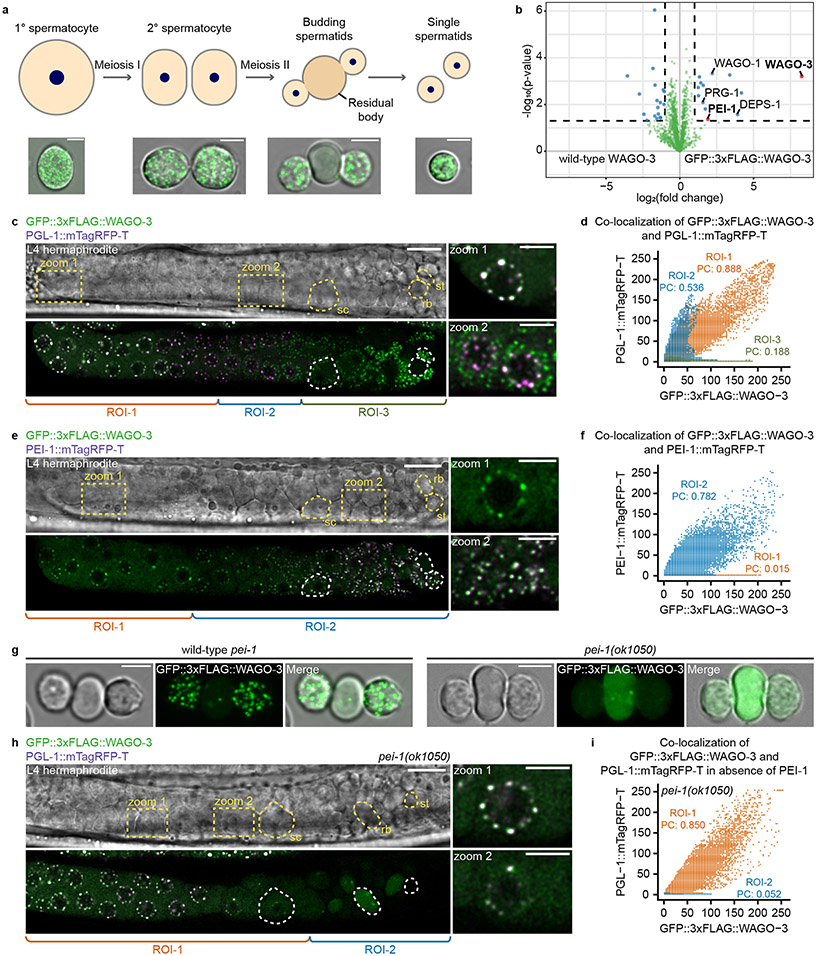
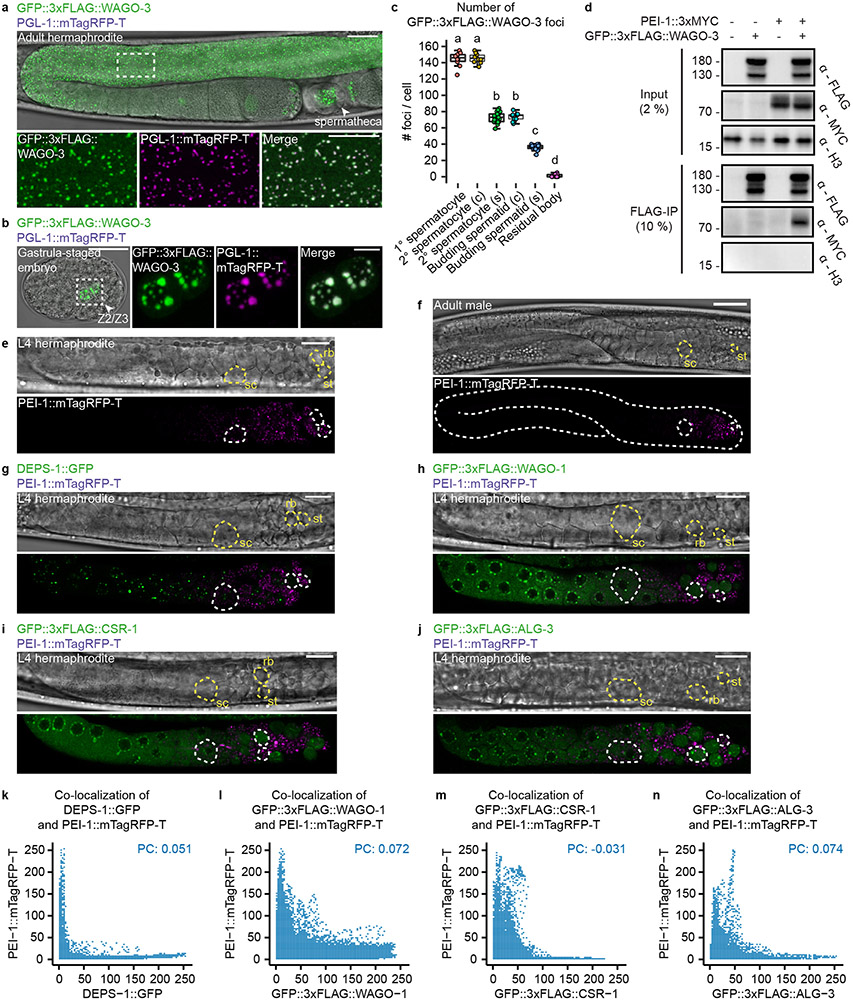
Confocal microscopy of GFP::3xFLAG::WAGO-3 (from here on referred to as WAGO-3) revealed expression throughout the germline at all stages, with localization to P granules in mitotic, meiotic and primordial germ cells (Extended Data Fig. 4a-b). Notably, we found strong WAGO-3 signals within the sperm-containing spermatheca (Extended Data Fig. 4a). WAGO-3 presence in sperm was confirmed by analyzing isolated, male-derived germ cells at different stages of spermatogenesis, which also revealed a punctate subcellular localization (Fig. 1a) (Extended Data Fig. 4c). Next, we performed IP of WAGO-3 from late-L4 stage hermaphrodites, a stage during which spermatogenesis is ongoing, followed by label-free quantitative mass spectrometry (IP-MS/MS). Besides known P granule components like DEPS-1, PRG-1 and WAGO-138 (Fig. 1b), we identified F27C8.5 (PEI-1: Paternal Epigenetic Inheritance defective-1). We confirmed the interaction (Extended Data Fig. 4d), and found that PEI-1::mTagRFP-T (from here on referred to as PEI-1) was exclusively expressed during later stages of spermatogenesis, both in L4 hermaphrodites (Extended Data Fig. 4e) and in males (Extended Data Fig. 4f).
Fig. 1 ∣. WAGO-3 is guided into sperm by PEI-1.
a, Schematic summarizing spermatogenesis in C. elegans. Corresponding confocal images of male-derived cells expressing GFP::3xFLAG::WAGO-3 are shown below. Scale bars: 4μm. b, Volcano plot representing label-free proteomic quantification of quadruplicate GFP::3xFLAG::WAGO-3 immunoprecipitation experiments from late-L4 stage hermaphrodite extracts. The X-axis indicates the mean fold enrichment of individual proteins in the control versus the genome-edited strain. The Y-axis represents −log10(p value) of observed enrichments. Dashed lines show thresholds at p = 0.05 and two-fold enrichment. Blue and green data points represent above and below threshold, respectively. WAGO-3 and PEI-1 are highlighted with red data points. c, Confocal micrograph showing spermatogenesis of late-L4 stage hermaphrodite expressing indicated proteins. PGL-1::mTagRFP-T serves as P granule marker. Germ cell development progresses from left to right. Zoom of two areas is provided. ROI1: PGL-1::mTagRFP-T and GFP::3xFLAG::WAGO-3 co-localize; ROI2: GFP::3xFLAG::WAGO-3 leaves P granules; ROI3: PGL-1::mTagRFP-T signal is not detectable anymore. sc – spermatocyte, rb – residual body, st – spermatid. Scale bars: 10 μm (proximal gonad), 4 μm (zoom). d, Co-localization analysis between GFP::3xFLAG::WAGO-3 and PGL-1::mTagRFP-T based on the image shown in c. Signals from ROI1-3 are plotted in orange, blue and green, respectively. X and Y axes indicate fluorescence intensity. PC: Pearson’s correlation coefficient. e, As c, for PEI-1::mTagRFP-T instead of PGL-1::mTagRFP-T. ROI1: no PEI-1::mTagRFP-T expression. ROI2: PEI-1::mTagRFP-T is expressed. sc – spermatocyte, rb – residual body, st – spermatid. Scale bars: 10 μm (proximal gonad), 4 μm (zoom). f, As d for PEI-1::mTagRFP-T instead of PGL-1::mTagRFP-T. g, Confocal maximum intensity projections of male-derived budding spermatids expressing GFP::3xFLAG::WAGO-3 in presence and absence of PEI-1. Scale bars: 4 μm. h, Confocal micrograph showing spermatogenesis of late-L4 stage hermaphrodite expressing GFP::3xFLAG::WAGO-3 and PGL-1::mTagRFP-T in a pei-1(ok1050) mutant background. Germ cell development progresses from left to right. Zoom of two areas is provided. ROI1: PGL-1::mTagRFP-T is expressed; ROI2: no PGL-1::mTagRFP-T expression detectable. sc – spermatocyte, rb – residual body, st – spermatid. Scale bars: 10 μm (proximal gonad), 4 μm (zoom). i, As d in a pei-1(ok1050) mutant background based on the image shown in h. c,e,g,h, Images represent three biologically independent experiments. Source data are provided.
We analyzed late-L4 stage hermaphrodites to look at PEI-1 and WAGO-3 expression in relation to P granules. In naïve germ cells, that are PEI-1 negative, WAGO-3 localized to peri-nuclear P granules, marked by PGL-1 (Fig. 1c-d; ROI1). Starting at the primary spermatocyte stage, WAGO-3 accumulated in non-peri-nuclear, cytoplasmic foci, and, as previously described 23, P granules began to disappear (Fig. 1c-d; ROI2-3). Additionally, PEI-1 started to be expressed and co-localized with WAGO-3 (Fig. 1e-f; ROI2). PEI-1 did not co-localize with the P granule marker DEPS-1 (Extended Data Fig. 4g,k).
WAGO-3 still co-localized with PGL-1 in pei-1 mutants, but was absent from spermatozoa and instead was found in the residual body (Fig. 1g-i). Thereby, WAGO-3 followed the same fate as the Argonaute proteins WAGO-1, ALG-3 and CSR-1 do in wild-type animals (Extended Data Fig. 4h-j,l-n).
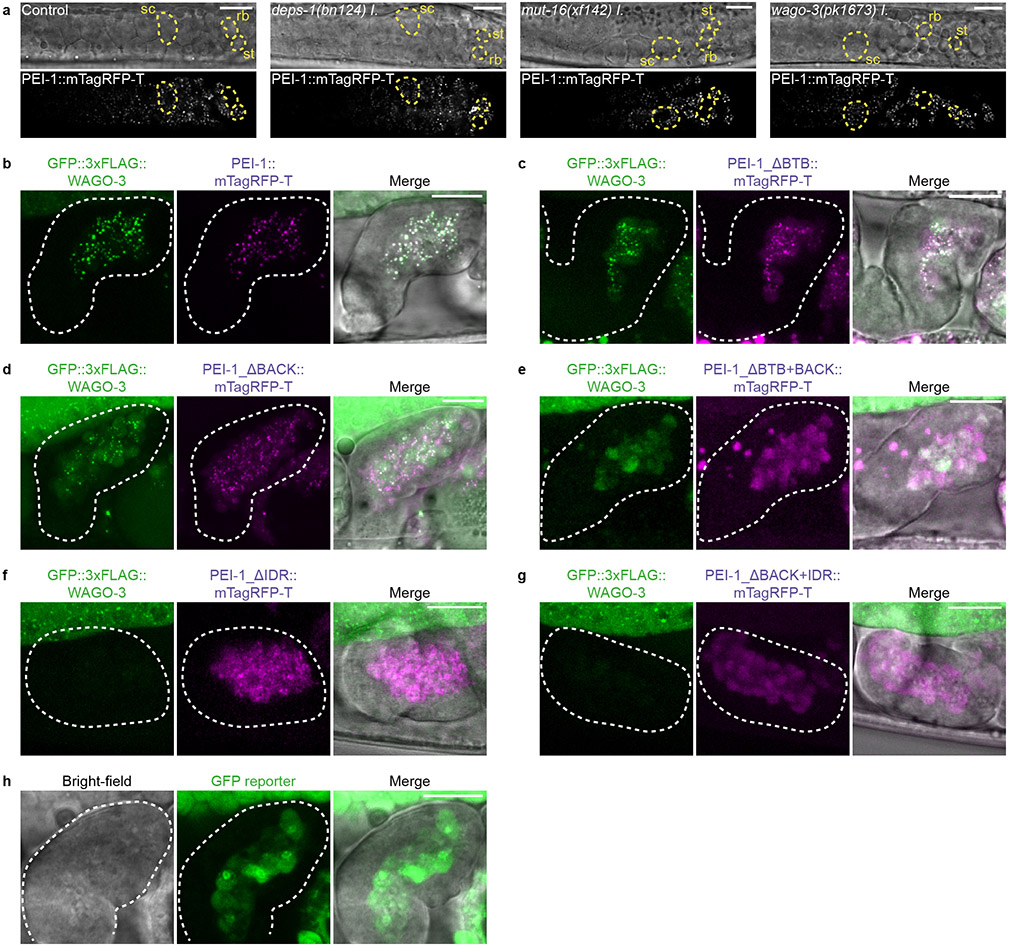
Finally, we tested whether PEI-1 foci depend on known germ granules by removing MUT-16 (Mutator foci), or DEPS-1 (P granules) 14,39, or on its resident Argonaute protein WAGO-3. None of these proteins were required for PEI-1 foci (Extended Data Fig. 5a).
We conclude that PEI-1 defines a previously undescribed, spermatogenesis-specific germ granule -the PEI granule-, which recruits WAGO-3 and enables its segregation into mature sperm.
Paternal epigenetic inheritance requires WAGO-3 and PEI-1
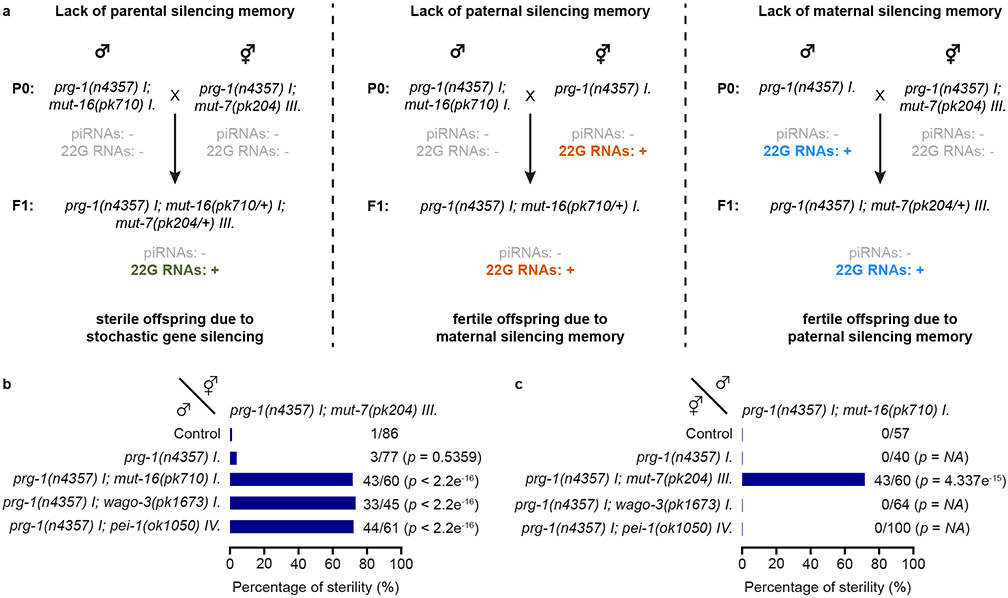
The Mis phenotype 7,8 (see Introduction) allows us to probe the relevance and mechanisms of epigenetic inheritance. The precise set-up we used in the experiment is shown in Fig. 2a. We note that mut-7 and mut-16 mutants can be used interchangeably in both sexes, as they both result in Mutator system dysfunction 7,8,13. This set-up generates embryos that can make Mutator-22G RNAs. Depending on the specific cross, the mother, the father or neither parent can make Mutator-22G RNAs. All strains carry a prg-1 mutation in order to remove the partially redundant activity of inherited piRNAs in this system 7,8. Using this set-up, we found that maternal or paternal 22G RNAs were sufficient to prevent the Mis phenotype (Fig. 2b-c, top three bars), allowing us to dissect male- and female-specific contributions to the Mis phenotype. Following up on this, we probed the roles of WAGO-3 and PEI-1 in this process, and found that both PEI-1 and WAGO-3 were specifically required in the male (Fig. 2b), but not in the female (Fig. 2c). We conclude that PEI-1 and WAGO-3 play critical roles in paternal epigenetic inheritance.
Fig. 2 ∣. WAGO-3 and PEI-1 are required for paternal epigenetic inheritance.
a, Schematic illustration of crosses used to probe the specific effects of maternal and paternal epigenetic inheritance on the Mutator-induced sterility (Mis) phenotype. The mut-7(pk204) and mut-16(pk710) alleles both cause global depletion of Mutator 22G RNAs, and can be used interchangeably. Colour code of the small RNAs: Grey – absent. Green – present, without parental influence. Orange – present, with maternal influence. Blue – present, with paternal influence. b-c, Percentage of fertile F1 animals generated by crosses between males and hermaphrodites of indicated genotypes. Fertility implies: presence of paternal (b) or maternal (c) epigenetic inheritance. Sterility implies: no epigenetic inheritance. Statistical significance was tested with a Pearson's Chi-squared test with Yates' continuity correction (NA - not available).
PEI-1 recruits WAGO-3 to PEI granules through its IDR
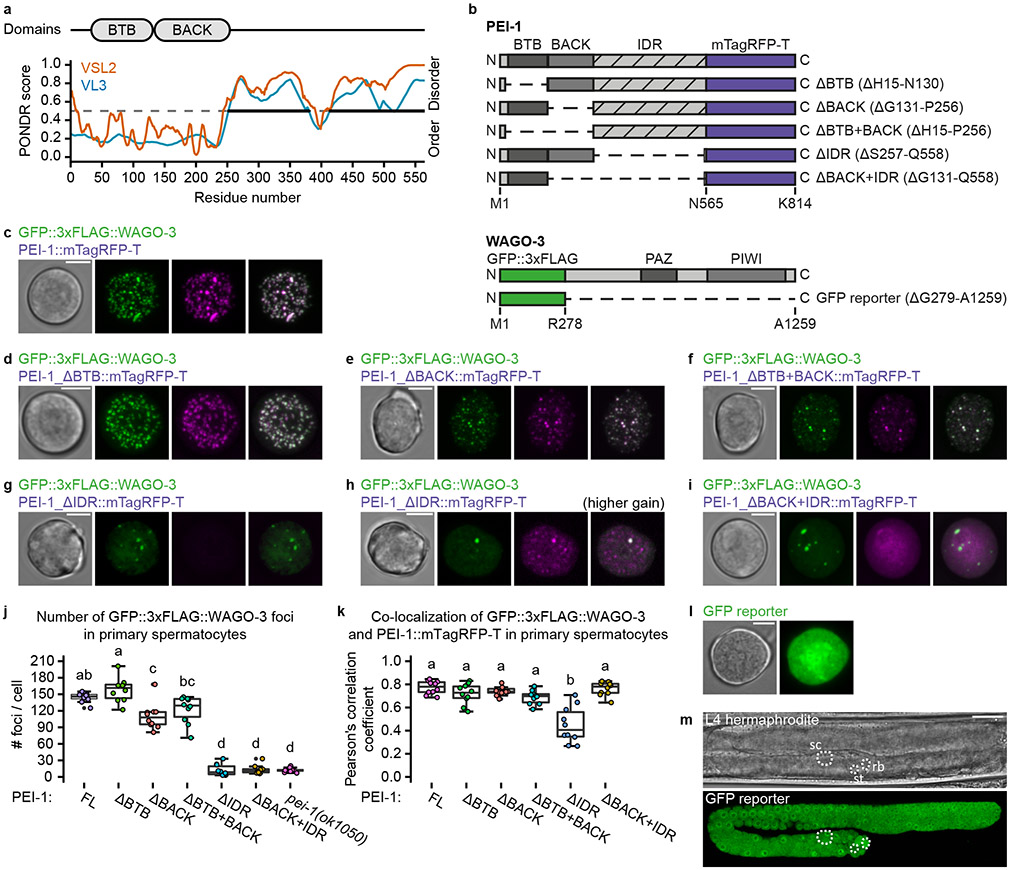
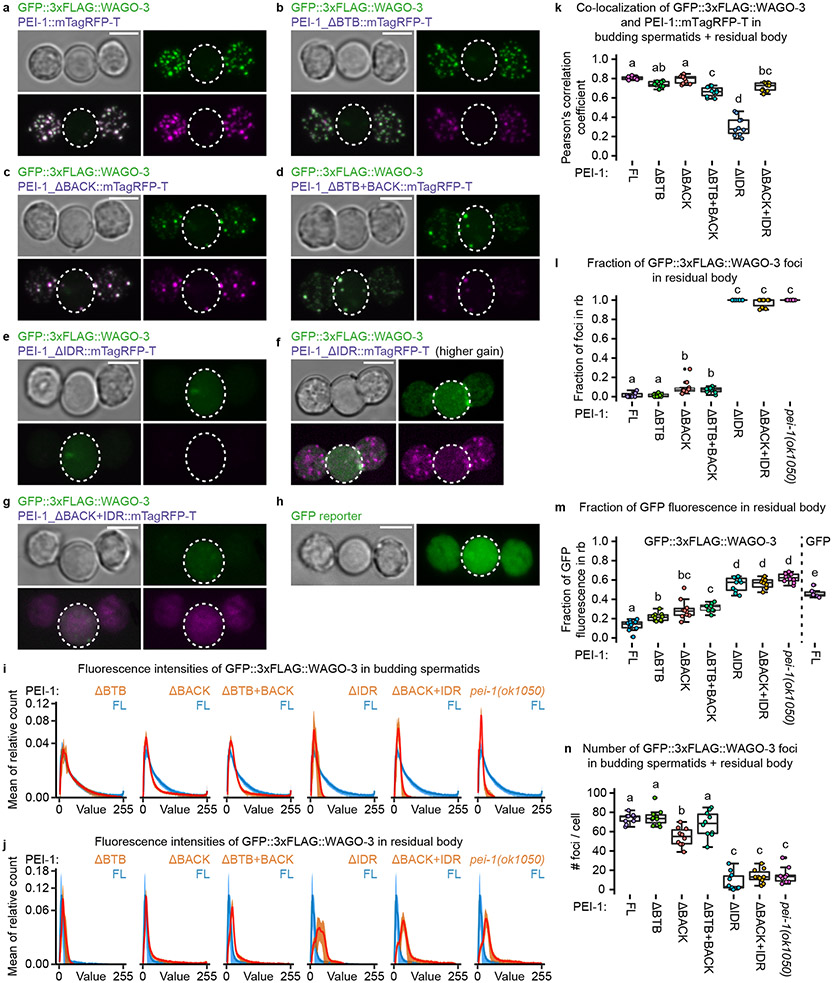
The N-terminal region of PEI-1 is predicted to adopt a BTB fold followed by a BACK domain 40,41, while the C-terminal part of PEI-1 is predicted to be an intrinsically disordered region (IDR) (Fig. 3a). Following these predictions, we edited the endogenous pei-1::mTagRfp-t locus to generate five different PEI-1 variants (Fig. 3b), and analyzed their effects on PEI-1 and WAGO-3 expression in primary spermatocytes (Fig. 3c-k) and budding spermatids (Fig. 4a-n). As control, free GFP was expressed from the wago-3 locus (Fig. 3b,l-m, Fig. 4h). This revealed that the BTB and BACK domains primarily affected granule number and intensity (Fig. 3j, Fig. 4i-j,n), but hardly affected co-localization between PEI-1 and WAGO-3 (Fig. 3k, Fig. 4k). In contrast, deletion of the PEI-1-IDR resulted in WAGO-3 which mostly localized to the residual body (Fig. 4e-f,l-m). WAGO-3 signal was diffuse, as quantified by a loss of high-intensity pixels (Fig. 4i-j),. PEI-1 signal itself was weaker, but remained in foci that segregated into the spermatids (Fig. 4e-f). Deletion of both the BACK and IDR domains did not further affect WAGO-3, but did result in diffuse PEI-1 signal that accumulated in the residual body, together with WAGO-3 (Fig. 4g,k).
Fig. 3 ∣. Granule formation and WAGO-3 interaction are mediated via different PEI-1 domains.
a, PEI-1 domain composition. Prediction of naturally disordered regions was performed using PONDR VSL2 and PONDR VL3 algorithms. b, Schematic representation of truncated PEI-1::mTagRFP-T and GFP::3xFLAG::WAGO-3 proteins generated by CRISPR/Cas9 mediated genome editing. IDR – intrinsically disordered region. c-i,l, Confocal maximum intensity projections of isolated, male-derived primary spermatocytes expressing indicated proteins. In all images: Green – GFP::3xFLAG::WAGO-3 (except l), magenta – PEI-1::mTagRFP-T variants. Images represent two biologically independent experiments. Scale bars: 4 μm. h, Compared to g, this image was acquired with a higher gain in order to visualize remaining PEI-1::mTagRFP-T signal within the spermatocyte. l, Free GFP is expressed from the wago-3 locus. j-k, Quantification of GFP::3xFLAG::WAGO-3 foci number (j), and co-localization of GFP::3xFLAG::WAGO-3 and PEI-1::mTagRFP-T (k) in isolated, male-derived primary spermatocytes expressing indicated PEI-1::mTagRFP-T variants (FL = full-length, n = 10 cells pooled from two independent experiments, for each condition). Statistically significant differences were determined by one-way ANOVA (p ≤ 0.001) followed by Tukey’s honestly significant difference post hoc test (p ≤ 0.05). Different letters represent significant differences. The exact P values are provided as source data. Boxplot centre and box edges indicate median and 25th or 75th percentiles, respectively, while whiskers indicate the median ± 1.5 x interquartile range. Note that the FL data in panel j and k are the same as those displayed in Extended Data Figure 4c (primary spermatocyte) and Extended Data Figure 10f (wild-type), and Extended Data Figure 10g (wild-type), respectively. m, Confocal micrograph of an L4 stage hermaphrodite expressing free GFP from the endogenous wago-3 locus. Image represents two biologically independent experiments. sc – spermatocyte, rb – residual body, st – spermatid. Scale bar: 20 μm. Source data are provided.
Fig. 4 ∣. The IDR of PEI-1 is required for WAGO-3 segregation into spermatids.
a-h, Confocal maximum intensity projections of isolated, male-derived budding spermatids expressing indicated proteins. In all images: Green – GFP::3xFLAG::WAGO-3 (except h), magenta – PEI-1::mTagRFP-T variants. Residual bodies are marked by a dashed circle. Scale bars: 4 μm. f, Compared to e, this image was acquired with higher gain in order to visualize remaining PEI-1::mTagRFP-T signal within the budding spermatids. h, Free GFP is expressed from the wago-3 locus. i-j, Plots displaying fluorescence intensity (X-axis) versus the mean of relative pixel count (Y-axis) of GFP::3xFLAG::WAGO-3 signal in budding spermatids (i) and residual bodies (j) expressing the indicated PEI-1::mTagRFP-T variants (n = 10 cells pooled from two independent experiments, for each condition). Relative pixel count is the number of pixels with a given intensity within a selected region, divided by the total number of pixels in that region. In each plot, the curve derived from full-length (FL) PEI-1::mTagRFP-T is also depicted in blue. The width of the curves reflects the standard deviation of the mean. k-n, Quantification of co-localization of GFP::3xFLAG::WAGO-3 and PEI-1::mTagRFP-T in budding spermatids + residual body (k), fraction of GFP::3xFLAG::WAGO-3 foci in residual body (l), total GFP::3xFLAG::WAGO-3 signal in residual body (m) and GFP::3xFLAG::WAGO-3 foci number in budding spermatids + residual body (n) of male-derived cells expressing indicated PEI-1::mTagRFP-T variants (FL = full-length, n = 10 cells pooled from two independent experiments, for each condition). Statistically significant differences were determined by one-way ANOVA (p ≤ 0.001) followed by Tukey’s honestly significant difference post hoc test (p ≤ 0.05). Different letters represent significant differences. The exact P values are provided as source data. Boxplot centre and box edges indicate median and 25th or 75th percentiles, respectively, while whiskers indicate the median ± 1.5 x interquartile range. Note that the FL data in k,l,m,n is the same as the wild-type data shown in Fig. 7i, Fig. 7k, Fig. 7l, and Fig. 7j and Extended Data Figure 4c (budding spermatid (c)), respectively. Representative images from two biologically independent experiments are shown in panels a-h. Source data are provided.
Residual PEI-1 signal was always detected in spermatozoa within the spermatheca, even when both the BACK and IDR domains were deleted (Extended Data Fig. 5b-g). We observed the same for free GFP (Extended Data Fig. 5h). WAGO-3, however, is undetectable in mature sperm when PEI-1 misses its IDR (Extended Data Fig. 5f-g), indicating that WAGO-3 cannot be stably maintained in sperm without PEI-1 interaction.
We conclude that the IDR of PEI-1 is essential to recruit and stabilize WAGO-3, while the BTB, BACK and IDR domains play an important role in forming and stabilizing PEI-1 foci during spermatogenesis.
PEI granule characteristics
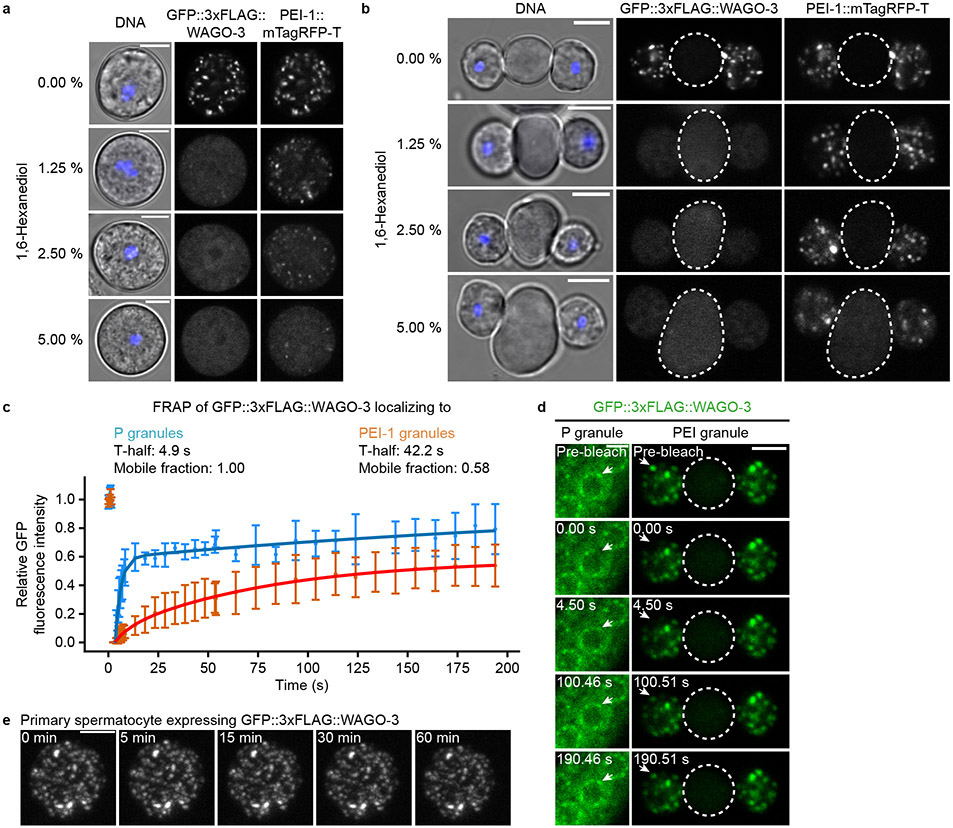
WAGO-3 was found to be highly sensitive to 1,6-hexanediol, a compound often used to probe condensates42, as no foci remained in the presence of merely 1.25 % (Extended Data Fig. 6a-b). In contrast, PEI-1 foci were more resistant, especially in budding spermatids where even a 5 % treatment did not cause complete disassembly of PEI granules (Extended Data Fig. 6b). Possibly, this resistance to 1,6-hexanediol derives from additional interactions between the folded BTB and BACK domains, which have been shown to drive oligomerization 41,43.
We also compared WAGO-3 mobility between PEI granules and P granules by measuring fluorescence recovery after photobleaching (FRAP) (Extended Data Fig. 6c-d). Proteins localizing to the liquid-phase of P granules have been reported to exhibit high recovery rates 44,45. Consistently, we found that WAGO-3 showed relatively rapid FRAP in P granules (t1/2 = 4.9 s). In PEI granules, in budding spermatids, WAGO-3 exhibited much slower exchange dynamics (t1/2 = 42.2 s). Moreover, we found that the mobile fraction of WAGO-3 was reduced in PEI granules compared to P granules.
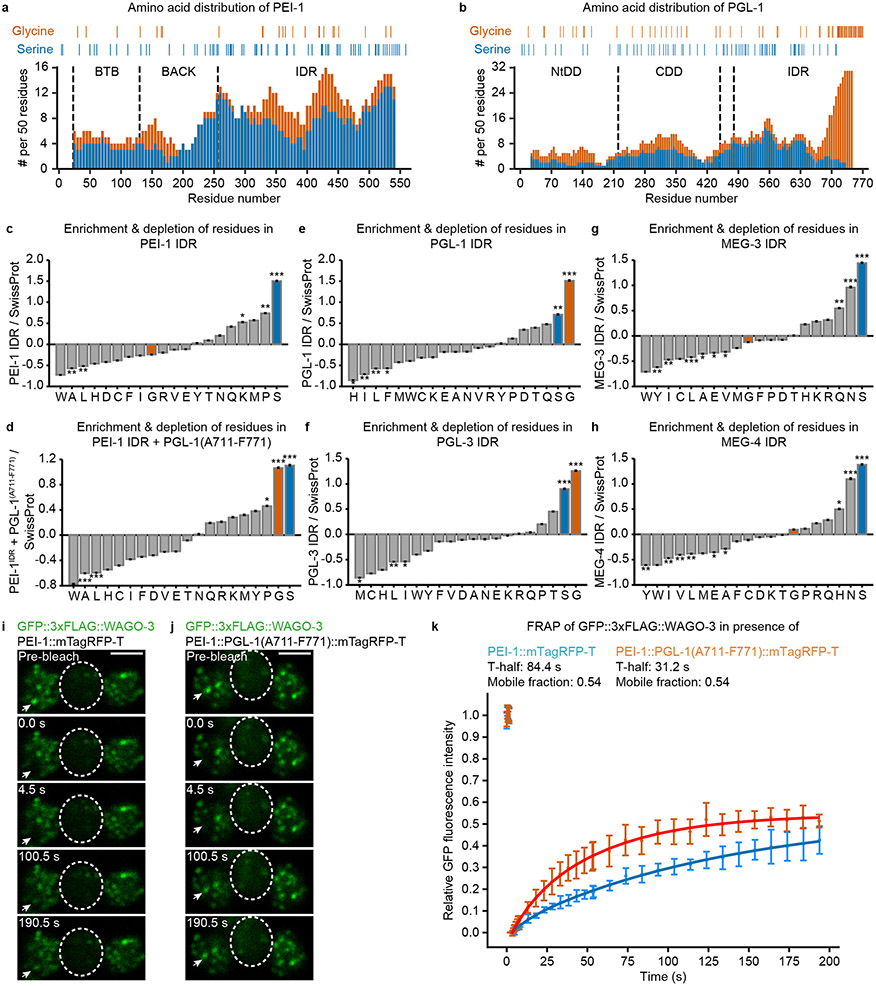
The prevalence of certain amino acids has been shown to modulate the material properties of condensates 46. In particular, glycine residues maintain liquidity, while serine and glutamine residues promote hardening. We analyzed the amino acid composition of the PEI-1 IDR, and compared it to the IDRs of PGL-1 and PGL-3, both known to localize to the liquid phase of P granules 47-49, and MEG-3 and MEG-4, both reported to form gel-like assemblies 45 (Extended Data Fig. 7a-h). This revealed that the PGL-1 and PGL-3 IDRs were strongly enriched for glycine, due to a glycine-rich C-terminal domain (Extended Data Fig. 7b,e-f), whereas such enrichment was absent from PEI-1, MEG-3 and MEG-4 (Extended Data Fig. 7c,g-h). Introduction of this PGL-1-derived glycine-rich stretch into PEI-1::mTagRFP-T made the glycine enrichment of the PEI-1 IDR similar to that of PGL-1 (Extended Data Fig. 7d), and enhanced WAGO-3 recovery (Extended Data Fig. 7i-k), indicating that the PEI-1 IDR composition affects WAGO-3 mobility. We note that the mTagRFP-T tag reduced WAGO-3 recovery compared to untagged PEI-1 (compare Extended Data Fig. 6c to Extended Data Fig. 7k), indicating that the tags we introduce affect PEI granule properties.
Finally, fusion and fission of individual foci is a strong indication for liquid-like properties of condensates. We therefore live-imaged PEI granules by monitoring WAGO-3. However, we found that they were rather static: we did not observe any major movements and hence no fission or fusion events in a period of one hour (Extended Data Fig. 6e, Extended Data Movie 1).
PEI granules associate with membranous organelles
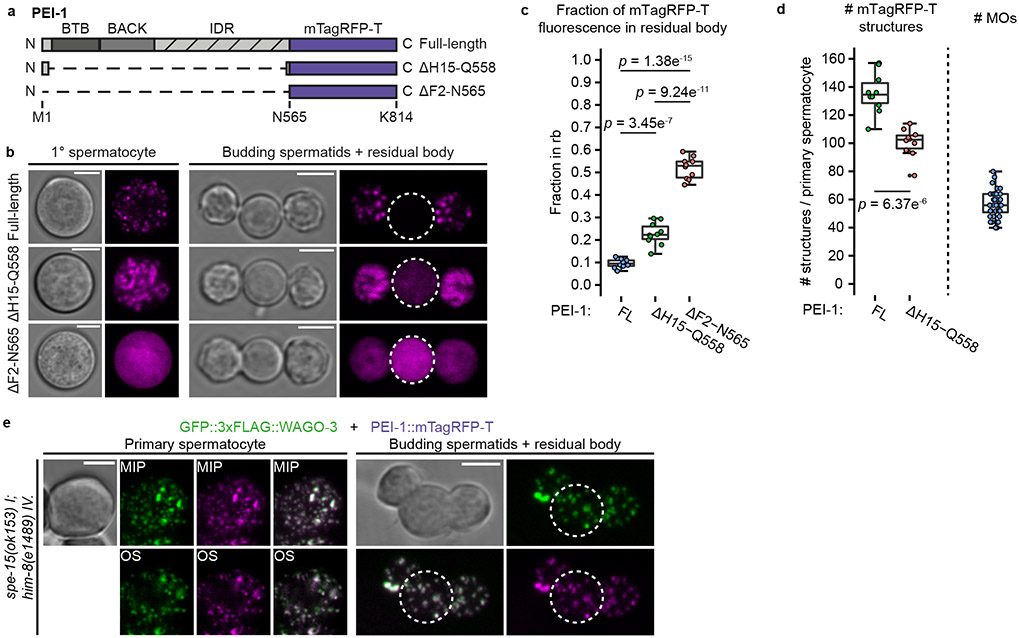
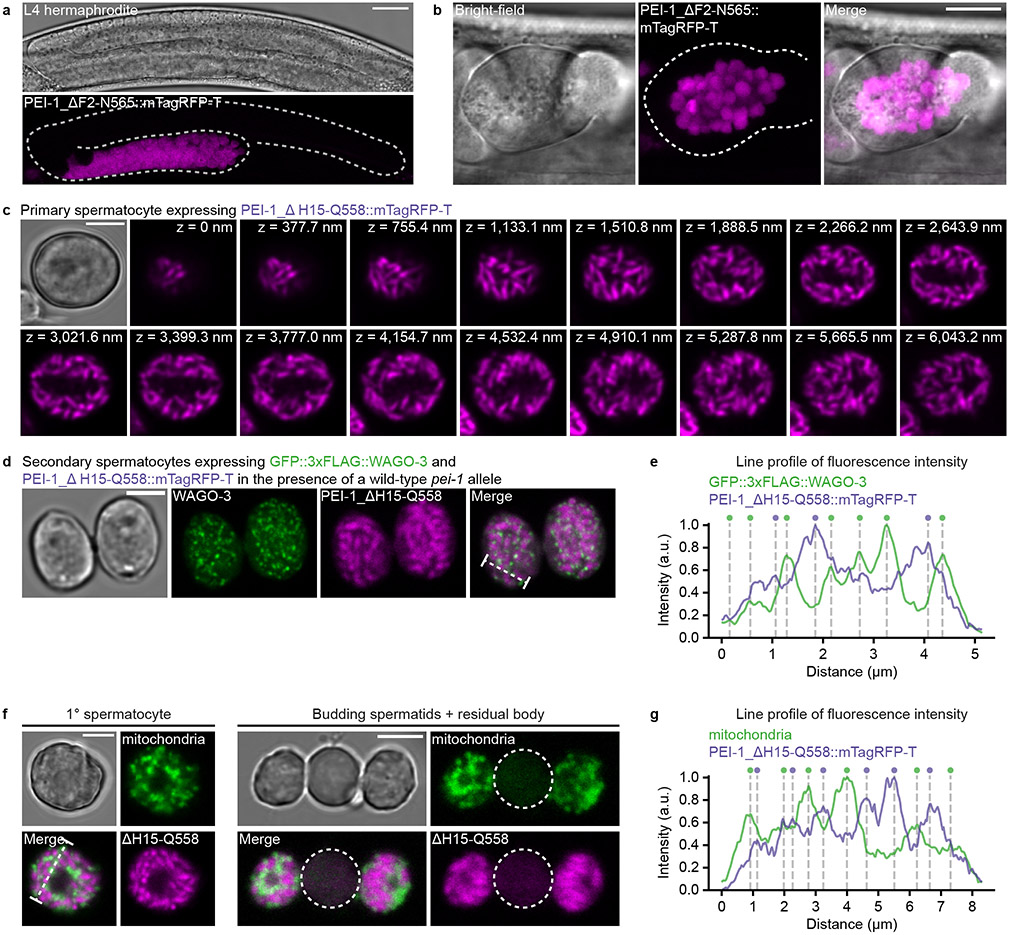
In our deletion analysis of PEI-1 we generated deletions that removed all of PEI-1, or all but a few amino acids at the N- and C-termini (Fig. 5a). While the full deletion produced diffuse signal that segregated significantly into the residual body, the remaining PEI-1 peptides guided the mTagRFP-T signal to discrete structures that were maintained in spermatids (Fig. 5b-c, Extended Data Fig. 8a-c), and that were distinct from PEI granules (Extended Data Fig. 8d-e). Besides the nucleus, only two organelles are sorted into spermatids: mitochondria and FB-MOs 25. The latter are sperm-specific membranous organelles that help to sort Major Sperm Protein (MSP) and other proteins into spermatids. They consist of a membranous part (MO) and a fibrous body (FB) made of MSP. The PEI-1-marked structures did not overlap with mitochondria (Extended Data Fig. 8f-g), and their numbers roughly match that of FB-MOs (Fig. 5d), suggesting that the large PEI-1 deletion possibly marks FB-MOs. Additionally, the sorting of PEI granules depends on the myosin VI motor protein SPE-15 (Fig. 5e), a protein known to drive FB-MO, but also mitochondria localization in sperm 50.
Fig. 5 ∣. PEI granule segregation is dependent on SPE-15.
a, Schematic representation of two mTagRFP-T proteins generated by CRISPR/Cas9 mediated genome editing of the pei-1 locus. The ΔH15-Q558 deletion leaves 14 and 7 amino acids from the PEI-1 N- and C-terminus, respectively. The ΔF2-N565 deletion removes all PEI-1-specific amino acids. IDR – intrinsically disordered region. b, Confocal micrographs of isolated, male-derived spermatocytes (left panel) and budding spermatids (right panel) each expressing one of the proteins shown in a. Dashed circles indicate residual bodies. Images represent two biologically independent experiments. Scale bars: 4 μm. c, Fraction of total mTagRFP-T signal within the residual body of male-derived budding spermatids expressing indicated proteins (FL = full-length, n = 10 cells, which were pooled from multiple experiments, for each condition). Note that the ΔH15–Q558 data is the same as the one displayed in Extended Data Figure 10c (wild-type). d, Quantification of mTagRFP-T structures in isolated, male-derived, primary spermatocytes expressing indicated proteins (FL = full-length, n = 10 cells pooled from two independent experiments, for each condition). To the right: extrapolated number of FB-MOs in primary spermatocytes based on LysoSensor™ Blue DND-192 staining in spermatids (n = 36 cells pooled from two independent experiments). c,d, Statistically significant differences were determined by one-way ANOVA (p ≤ 0.001) followed by Tukey’s honestly significant difference post hoc test (p ≤ 0.05). Boxplot centre and box edges indicate median and 25th or 75th percentiles, respectively, while whiskers indicate the median ± 1.5 x interquartile range. Representative images are shown in b. e, Confocal maximum intensity projections and optical sections of isolated, male-derived spermatocytes and budding spermatids expressing GFP::3xFLAG::WAGO-3 and PEI-1::mTagRFP-T in a spe-15(ok153) mutant background. The strain contained a him-mutation to increase the frequency of males in the cultures. Dashed circles indicate residual bodies. Images represent two biologically independent experiments. MIP - maximum intensity projection. OS – optical section. Scale bars: 4 μm. Source data are provided.
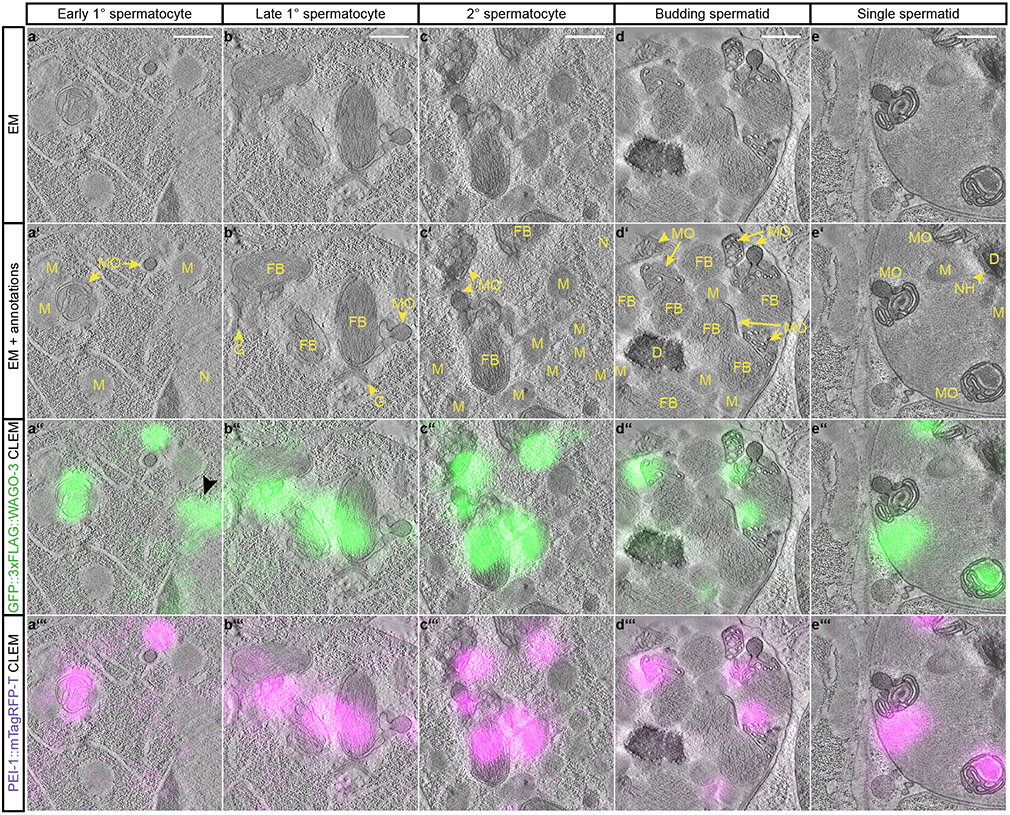
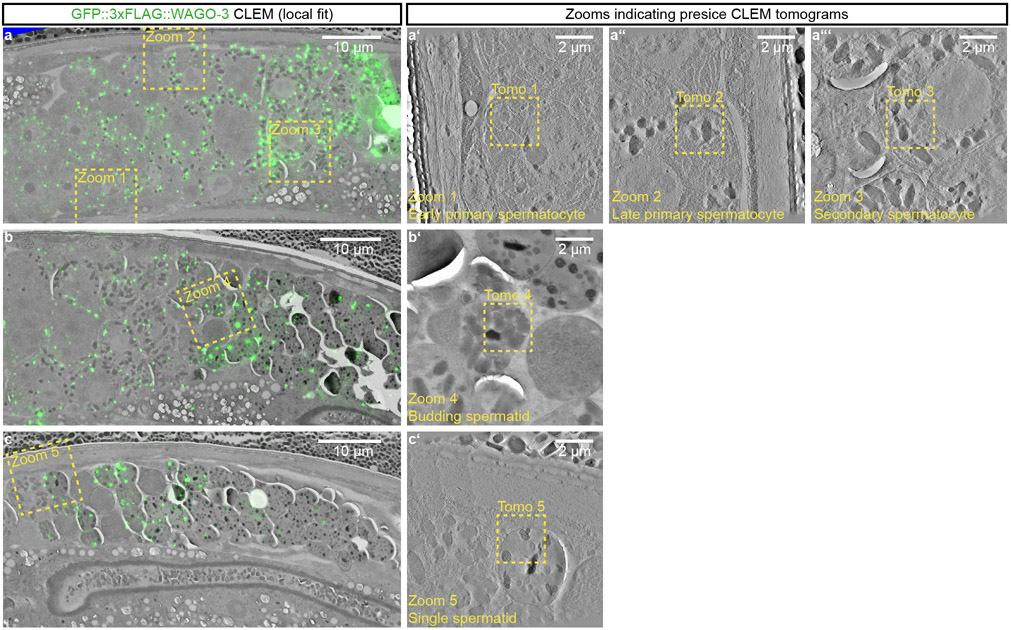
In order to resolve PEI granule localization at high resolution, we used correlative light and electron microscopy (CLEM) (Fig. 6a-e, Extended Data Fig. 9a-c; also see Supplemental BigDataViewer). In early primary spermatocytes, when the MOs are just starting to form from the Golgi, and no FBs are associated yet 25, PEI granules were found close to and overlapping with MOs (Fig. 6a). This situation remained also in later stages of spermatogenesis: when the FB showed its typical fibrous structure and was enwrapped by the MO (Fig. 6b-c), when the MO started to retract from the FB (Fig. 6d) and when FBs were fully released from the MOs (Fig. 6e). From a total of 10 precise CLEM overlays, we found 18/18 and 17/17 foci in spermatocytes and spermatids respectively to be positioned immediately next to, or overlapping with an MO. In both stages only three of these foci were found to also contact a mitochondrion. We conclude that PEI granules associate with MOs.
Fig. 6 ∣. PEI granules are associated with membranous organelles.
a-e, Representative dual-color CLEM images acquired in indicated germ cells of spermatogenesis (indicated at the top) of high-pressure frozen adult males expressing GFP::3xFLAG::WAGO-3 and PEI-1::mTagRFP-T. The four rows show the EM-only (a-e), EM with annotations (a’-e’), EM with GFP::3xFLAG::WAGO-3 fluorescence (a”-e”), and EM with PEI-1::mTagRFP-T fluorescence (a’”-e’”). The GFP::3xFLAG::WAGO-3-only positive focus in panel a” (black arrow head) is adjacent to the nucleus, and most likely representing a P granule. Images represent two biologically independent experiments. Annotations: EM - electron microscopy, CLEM - correlative light and electron microscopy, N – nucleus, M – mitochondrion, MO – membranous organelle, FB – fibrous body, GO – Golgi complex, NH – peri-nuclear halo, D – DNA. Scale bars: 500 nm. Source data are provided.
PEI granule segregation affects epigenetic inheritance
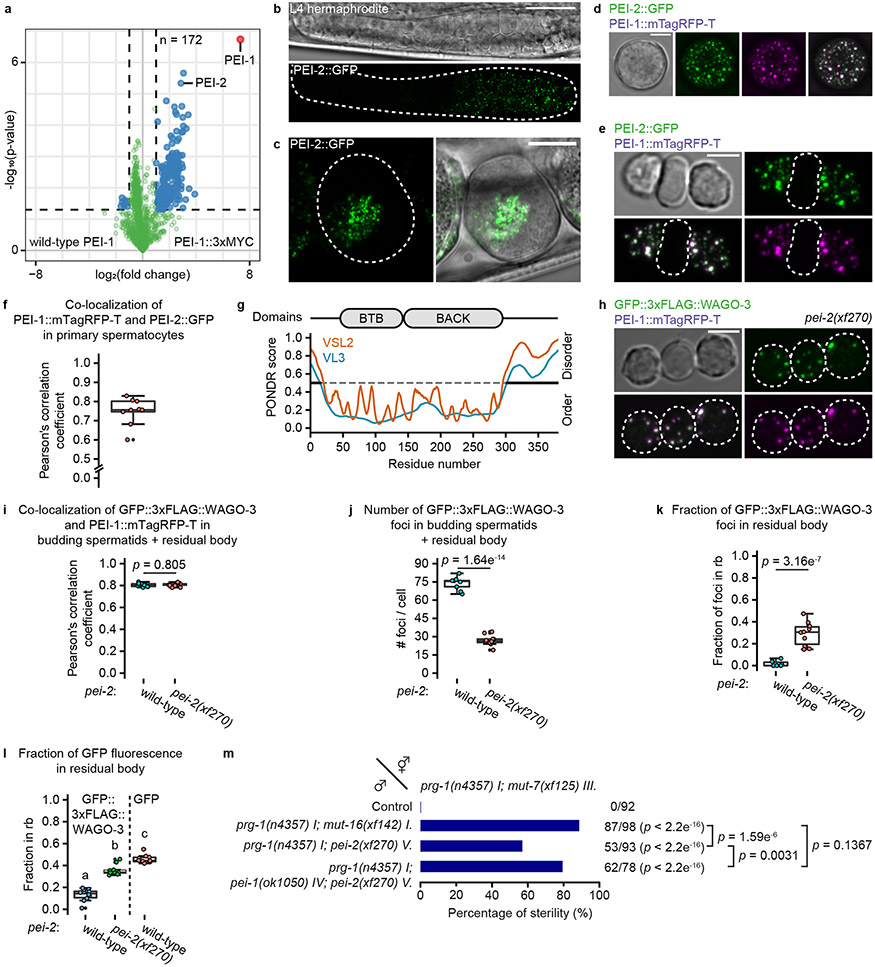
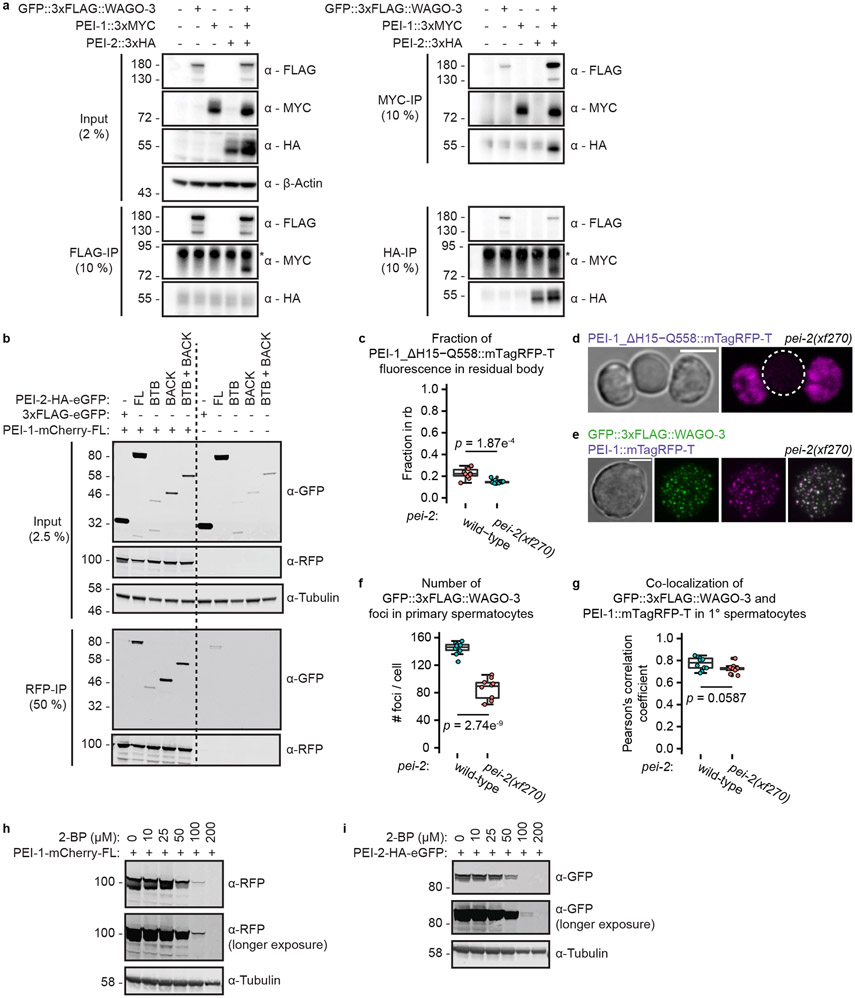
We identified R09A1.2, or PEI-2, as a PEI-1 interacting protein (Fig. 7a, Extended Data Fig. 10a) and revealed spermatogenesis-specific expression of PEI-2 (Fig. 7b-c), with strong co-localization to PEI-1 (Fig. 7d-f). Like PEI-1, PEI-2 has a BTB and BACK domain (Fig. 7g), and through co-immunoprecipitation experiments in a heterologous cell culture system, we could show that the BTB and BACK domains of PEI-2 interact with PEI-1 (Extended Data Fig. 10b).
Fig. 7 ∣. PEI-2 affects PEI granule segregation.
a, Volcano plot representing label-free proteomic quantification of PEI-1::3xMYC IP experiments from late-L4 stage hermaphrodite extracts. See Fig. 1b for further information. b, Confocal micrograph of an L4 hermaphrodite expressing PEI-2::GFP. Dashed line encloses the gonad. Scale bar: 20 μm. c, Confocal maximum intensity projection of spermatozoa within the spermatheca of an adult hermaphrodite expressing PEI-2::GFP. Dashed line encloses the spermatheca. Scale bar: 10 μm. d-e, Confocal maximum intensity projection of an isolated, male-derived primary spermatocyte (d) and budding spermatids (e) expressing PEI-1::mTagRFP-T and PEI-2::GFP. Dashed lines in e indicate the residual body. Scale bars: 4 μm. f, Co-localization analysis between PEI-1::mTagRFP-T and PEI-2::GFP in isolated, male-derived primary spermatocytes (n = 9 cells pooled from two independent experiments). g, PEI-2 domain organization. Features are as detailed in Fig. 3a. h, Confocal maximum intensity projections of isolated, male-derived budding spermatids expressing GFP::3xFLAG::WAGO-3 and PEI-1::mTagRFP-T in pei-2(xf270) mutant background. Dashed circles indicate cells. Scale bar: 4 μm. i-l, Quantification of GFP::3xFLAG::WAGO-3 and PEI-1::mTagRFP-T expression in wild-type and pei-2(xf270) mutant, male-derived budding spermatids (n = 10 cells pooled from two independent experiments, for each condition). i: Co-localization of GFP::3xFLAG::WAGO-3 and PEI-1::mTagRFP-T; j: Total number of GFP::3xFLAG::WAGO-3 foci; k: Fraction of GFP::3xFLAG::WAGO-3 foci within the residual body; l: Fraction of total GFP::3xFLAG::WAGO-3 signal within the residual body. The wild-type (i-l) and free GFP (l) data are the same as those shown as FL in Fig. 4k-n. Statistically significant differences were determined by one-way ANOVA (p ≤ 0.001) followed by Tukey’s honestly significant difference post hoc test (p ≤ 0.05). Different letters in l represent significant differences. m, Percentage of fertile F1 animals generated by crosses between males and hermaphrodites with the indicated genotypes. See Fig. 2 for further information. Statistical significance was tested with a Pearson's Chi-squared test with Yates' continuity correction. f,i,j,k,l, Boxplot centre and box edges indicate median and 25th or 75th percentiles, respectively, while whiskers indicate the median ± 1.5 x interquartile range. Images in b-e and h represent two biologically independent experiments. Exact P vaules (l) and source data are provided.
In pei-2 mutants, FB-MOs, as visualized by the ΔH15-Q558 PEI-1 deletion (Fig. 5a-b), segregated normally into spermatids (Extended Data Fig. 10c-d). Also PEI granules still formed (Extended Data Fig. 10e), and still recruited WAGO-3 (Fig. 7h-i, Extended Data Fig. 10e-g). However, in budding spermatids these PEI granules did not properly segregate and were often lost in the residual bodies (Fig. 7h-l), similar to spe-15 mutants (Fig. 5e). Mutants lacking SPE-15 are sterile, making it impossible to test the relevance of PEI granule segregation in paternal epigenetic inheritance using the Mis phenotype. However, pei-2 mutants were fertile, allowing us to reveal that effective PEI granule segregation is also required for epigenetic inheritance by sperm (Fig. 7m).
Segregation of PEI granules requires S-palmitoylation
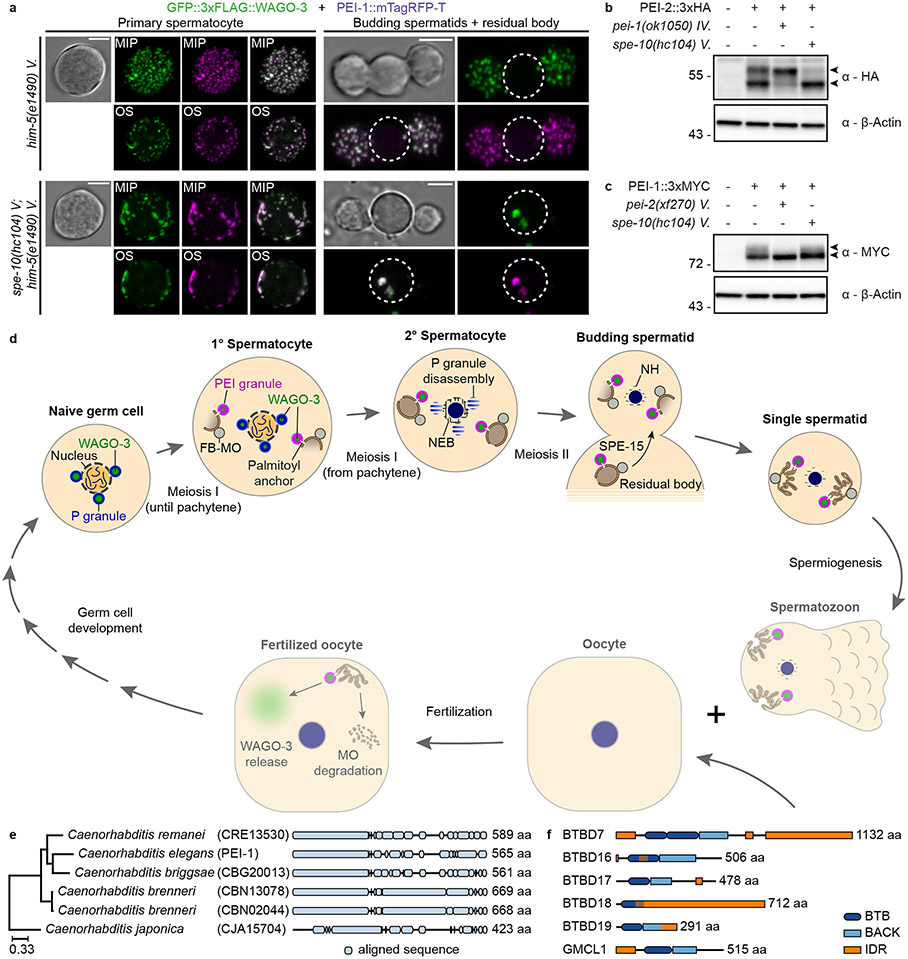
S-palmitoylation can guide proteins to membranes and typically occurs on Golgi-related membranes 51. The palmitoyltransferase SPE-10 localizes to MOs, and is required for their stable interaction with FBs52. We found that PEI granules were severely defective in spe-10 mutants. Large and irregularly shaped PEI granules formed along the cell periphery in spe-10 spermatocytes (Fig. 8a). Like the much smaller wild-type PEI granules, these structures were static and did not show signs of fusion or fission (Extended Data Movie 2). At later stages, large PEI-1 aggregates were detected in the residual body (Fig. 8a). WAGO-3 and PEI-1 still co-localized in absence of SPE-10 (Fig. 8a), indicating that S-palmitoylation affects the subcellular localization of PEI granules, but not their recruitment of WAGO-3.
Fig. 8 ∣. PEI granule formation and segregation depends on S-palmitoylation.
a, Confocal maximum intensity projections and optical sections of isolated, male-derived spermatocytes and budding spermatids expressing GFP::3xFLAG::WAGO-3 and PEI-1::mTagRFP-T in indicated mutants. Strains contained him-mutations to increase the frequency of males in the cultures. Dashed circles indicate residual bodies. Images represent two biologically independent experiments. MIP - maximum intensity projection. OS – optical section. Scale bars: 4 μm. b-c, Whole-worm extracts of late-L4 stage hermaphrodites were separated via SDS-PAGE, followed by Western transfer and chemiluminescence detection of PEI-2::3xHA (b) and PEI-1::3xMYC (c) in indicated mutants. The doublet signals of both proteins are indicated by arrow heads. β-actin served as loading control. Unprocessed original scans of blots are provided in source data. The experiment in b and c has been performed once. d, We provide data for the top half of the model: WAGO-3 starts in P granules, gradually moves to PEI granules that associate with FB-MOs via S-palmitoylation, which ensures spermatid localization via SPE-15 dependent transport. The bottom half is hypothetical, and depicted in reduced opacity. We speculate that PEI granules release their content into the oocyte, helping to establish/maintain silencing of specific targets (see Extended Data Figure 1). Schematic representation is not to scale. Annotations: MO – membranous organelle, FB – fibrous body, NH – peri-nuclear halo. e, Phylogenetic analysis showing PEI-1 conservation within the Caenorhabditis genus. The phylogenetic three was generated using EggNOG (v4.5.1). PEI-1 was defined as query and compared to all eukaryote entries. f, Protein length and domain composition of six human BTB domain-containing proteins that resemble PEI-1 protein composition.
Western blotting showed a clear doublet band for PEI-2 (Fig. 8b), compatible with palmitoylation 53,54. Interestingly, the upper band of PEI-2 disappeared in spe-10 mutants (Fig. 8b), suggesting PEI-2 is a substrate of the SPE-10 enzyme. Our Western blotting also revealed evidence for PEI-1 modification, although this appears more as a smear than as a discrete band (Fig. 8c). PEI-1 modification did not depend on SPE-10 (Fig. 8c), suggesting PEI-1 may carry a different kind of modification, or that another palmitoyltransferase may act on PEI-1. Strikingly, PEI-1 and PEI-2 affected each other’s modification status: while PEI-2 was required for PEI-1 modification (Fig. 8c), PEI-1 rather inhibited PEI-2 modification (Fig. 8b). In a heterologous expression system PEI-1 and PEI-2 also appeared as doublets, and showed decreased stability upon palmitoylation inhibition (Extended Data Fig. 10h-i), similar to what has been reported for the palmitoylated protein PD-L1 55. We conclude that PEI-2 is a potential direct substrate of SPE-10, and that PEI-1 can also be modified, but only in the presence of PEI-2.
Discussion
We identified a previously undescribed, sperm-specific compartment, the PEI granule, and define its role in sperm-borne cytoplasmic inheritance of a specific Argonaute protein, WAGO-3 (Fig. 8d). PEI granules are made by PEI-1 and PEI-2 proteins, which contain a BTB-BACK domain, followed by an IDR. Interestingly, BTB and BACK domains can mediate homo- and heteromeric oligomerization 40,43, providing multi-valency, a property known to drive phase separation 22. As has been found in other condensates 56, our data are consistent with the idea that BTB-BACK domain interactions help stabilize IDR-IDR interactions, together driving PEI granule formation. As such, we consider PEI-1 and PEI-2 as scaffold proteins 22 of PEI granules. We note, that the material state of the PEI granules has not been clarified. To examine if PEI granules have liquid character, are more gel-like or represent some other form of complex, experiments with purified proteins will be required.
The PEI-1 IDR also recruits WAGO-3, which we propose is a client 22 of PEI granules. Even though WAGO-1 and CSR-1 have been proposed to be also present in sperm 26,57, we found N-terminally tagged versions of these proteins expressed from their endogenous loci accumulated in the residual bodies. We speculate that the PEI-1 IDR may create a condensate that is selective for some feature of the WAGO-3 protein, or possibly non-permissive for characteristics of depleted proteins, such as WAGO-1 and CSR-1. Such features could be sequence intrinsic, but could also relate to post-translational modifications. Further experiments will be required to test these ideas.
PEI granules interact with MOs through S-palmitoylation and PEI-2 is likely palmitoylated by SPE-10, providing an example of how acylation of germ granule components may promote their membrane-affinity. S-palmitoylation is reversible 51, raising the possibility that PEI granules as a whole may be released from the MOs after fertilization by de-palmitoylation. However, other processes that may affect PEI granules and their cargo in the zygote are the effect of dilution, which could directly affect PEI granule stability, and potential post-translational modification of PEI granules by maternal factors. We note that also environmental cues, such as temperature could affect PEI granule behavior and hence paternal epigenetic inheritance.
When domain organization is considered, PEI-1-related proteins can be easily identified within nematodes (Fig. 8e), and in human, such as BTBD7 (Fig. 8f). Interestingly BTBD7 carries a predicted myristylation site close to its N-terminus, suggesting it may be membrane-associated, like PEI-2. The other human proteins shown in Fig. 8f are also known to be expressed in testis, and for two of these functions during spermatogenesis have been described 58,59. BTBD18 forms nuclear foci 58, and GMCL1 interacts with IDRs found in primate-specific GAGE proteins, and affects their localization 60. Hence, the mechanism we reveal may be broadly conserved.
METHODS
C. elegans culture and strains
Unless otherwise stated, all worm strains were cultured according to standard laboratory conditions at 20°C on Nematode Growth Medium (NGM) plates seeded with Escherichia coli OP50 1. Animals for IP-MS/MS experiments were grown on egg plates (90 mm diameter) 2 for one generation, synchronized by bleaching, and then grown on standard NGM plates (90 mm diameter) for one generation before harvest. Egg plates were generated by thoroughly mixing egg yolk with 50 ml LB media/egg. Following incubation at 65°C for 2-3 hours, the mixture was allowed to cool to room temperature before adding 10 ml OP50 culture/egg. About 10 ml was put on top of standard NGM plates (90 mm diameter) and incubated at room temperature. Next day, excess liquid was decanted and egg plates were incubated at room temperature for another two days. All strains are in the N2 Bristol background. Strains used in this study are listed in supplementary table 1.
Mortal germline assay
All mutant strains were out-crossed four times with wild-type animals before starting the experiment, to clean the genetic background from potential mutations that occurred during culturing. For each strain, 90 L2 or L3 animals were distributed to 15 NGM plates (90 mm diameter), resulting in six larvae per plate. Animals were grown at 25°C. Worms were picked onto fresh plates every second generation. The experiment was stopped after 17 generations.
RNAe reporter reactivation
A mCherry::H2B(RNAe) transgene (mjSi22) from a prg-1(n4357) mutant background was crossed into wago-3(pk1673) and mut-7(xf125) mutant backgrounds to generate prg-1(n4357);wago-3(pk1673/+) and prg-1(n4357);mut-7(xf125/+) animals that also were homozygous for the integrated mjSi22 transgene. From the offspring of these animals we identified, by PCR, homozygous mutant and homozygous wild-type animals. From these, ten offspring were singled, and 50 of their offspring were analyzed by microscopy for mjSi22 expression. If not all animals were expressing the mjSi22 transgene, again 10 non-expressing animals were singled, whose offspring were scored by microscopy..
Mutator-induced sterility crosses
All strains were confirmed and out-crossed two times before setting up crosses. We note that out-crossing ensured comparable results as an enhanced Mis phenotype was observed when using non-out-crossed animals. The transgenic allele otIs45[unc-119p::gfp] V. was always present in paternal strains and served as mating control to avoid picking self-fertilized offspring. Only L2 stage F1 animals were picked onto individual plates to avoid any biased selection. After three days, male or dead F1 animals were excluded from the analysis. Fertility of F1 animals was determined by the presence of F2 animals after another two to four days.
CRISPR/Cas9-mediated genome editing
All protospacer sequences were chosen using CRISPOR (http://crispor.tefor.net) 3 and, unless otherwise stated, cloned in either pRK2411 (plasmid expressing Cas9 + sgRNA(F+E) 4; derived from pDD162) or pRK2412 (plasmid expressing sgRNA(F+E) 4 with Cas9 deleted; derived from pRK2411) via site-directed, ligase-independent mutagenesis (SLIM) 5,6. pDD162 (Peft-3::Cas9 + Empty sgRNA) was a gift from Bob Goldstein (Addgene plasmid # 47549; http://n2t.net/addgene:47549; RRID:Addgene_47549) 7. SLIM reactions were transformed in Subcloning Efficiency™ DH5α™ Competent Cells (Art. No. 18265017, Invitrogen™) and plated on LB agar plates supplemented with 100 μg/ml ampicillin. All protospacer sequences are listed in supplementary table 2.
Insertions of a gfp::3flag sequence were based on plasmid DNA donor templates containing a self-excising drug selection casseste (SEC), which were designed and cloned as previously described 8. pDD282 was a gift from Bob Goldstein (Addgene plasmid # 66823; http://n2t.net/addgene:66823; RRID:Addgene_66823) 8. pJW1259 was used as Cas9 plasmid and was a gift from Jordan Ward (Addgene plasmid # 61251; http://n2t.net/addgene:61251; RRID:Addgene_61251) 9. pGH8, pCFJ90 and pCFJ104 served as co-injection markers and were gifts from Erik Jorgensen (Addgene plasmid # 19359; http://n2t.net/addgene:19359; RRID:Addgene_19359, Addgene plasmid # 19327; http://n2t.net/addgene:19327; RRID:Addgene_19327, Addgene plasmid # 19328; http://n2t.net/addgene:19328; RRID:Addgene_19328) 10. All plasmids were purified from 4 ml bacterial culture using either NucleoSpin® Plasmid (REF 740588.50, Macherey-Nagel®) or PureLink™ HiPure Plasmid Miniprep Kit (Art. No. K210011, Invitrogen™), eluted in sterile water and confirmed by enzymatic digestion and sequencing.
PCR products served as linear, double-stranded DNA donor templates for the insertion of mTagRfp-t and gfp sequences. The mTagRfp-t coding sequence including three introns and flanking homology regions was amplified from pDD286, which was a gift from Bob Goldstein (Addgene plasmid # 70684; http://n2t.net/addgene:70684; RRID:Addgene_70684). The gfp coding sequence including three introns and flanking homology regions was amplified from pDD282. All PCR products were purified using the QIAquick® PCR Purification Kit (Art. No. 28106, QIAGEN®), eluted in sterile water and confirmed by agarose gel electrophoresis. For all epitope tag insertions, co-conversions and precise deletions, we ordered 4 nmole Ultramer® DNA oligodeoxynucleotides from Integrated DNA Technologies™, which serves as linear, single-stranded DNA (ssODN) donor templates. All Ultramer® DNA oligodeoxynucleotides were resuspended in sterile water. All linear DNA donor templates contained ~35 bp homology regions 11,12. All DNA donor templates are listed in supplementary table 3.
To generate the mut-16, mut-7 and pei-2 deletion alleles, we injected animals with 50 ng/μl pJW1259, 30 ng/μl of each sgRNA(F+E), 10 ng/μl pGH8, 5 ng/μl pCFJ104, and 2.5 ng/μl pCFJ90. F1 animals expressing all three co-injection markers were selected for subsequent screening of deletion alleles. To insert gfp::3xflag sequences, injection mixes included 50 ng/μl pJW1259, 50 ng/μl sgRNA(F+E), 10 ng/μl SEC donor plasmid, 10 ng/μl pGH8, 5 ng/μl pCFJ104, and 2.5 ng/μl pCFJ90. Screening of F1 animals was performed as previously described 8. Every other CRISPR/Cas9-mediated genome editing was performed using either dpy-10(cn64) or unc-58(e665) co-conversion strategies 13. To insert epitope tag or protospacer sequences, we injected 50 ng/μl Cas9 + sgRNA(F+E) (co-conversion), 50 ng/μl sgRNA(F+E) (gene of interest), 750 nM ssODN donor1 (co-conversion), and 750 nM ssODN donor2 (gene of interest). To insert a mTagRfp-t sequence in pei-1 and pgl-1, we first transplanted the protospacer sequence used for the dpy-10 co-conversion directly upstream of the respective stop codon to generate d10-entry strains 14. These strains served as reference strains for the insertion of a mTagRfp-t sequence by injecting 50 ng/μl Cas9 + sgRNA(F+E) (dpy-10 co-conversion), 1,000 nM ssODN donor (dpy-10 co-conversion), and 300 ng/μl linear, double-stranded DNA donor. Analogous, a gfp sequence was inserted in pei-2. Precise deletions in pei-1 and wago-3 were generated by injecting 50 ng/μl Cas9 + sgRNA(F+E) (co-conversion), 50 ng/μl of each sgRNA(F+E) (gene of interest), 750 nM ssODN donor1 (co-conversion), and 750 nM ssODN donor2 (gene of interest). Unless otherwise stated, DNA injection mixes were injected in both gonad arms of five to 20 young adult N2 hermaphrodites maintained at 20°C. Selected F1 progeny were screened for insertion or deletion by PCR. Successful editing events were confirmed by Sanger sequencing. All generated mutant strains were out-crossed at least two times prior to any further cross or analysis.
Immunoprecipitation experiments
Unless otherwise stated, synchronized animals were cultured at 20°C until late-L4 stage, harvested with M9 buffer and frozen on dry ice in sterile water and 200 μl aliquots. Aliquots were thawed on ice, mixed with same volume of 2x lysis buffer (50 mM Tris HCl pH 7.5, 300 mM NaCl, 3 mM MgCl2, 2 mM DTT, 0.2 % Triton™ X-100, cOmplete™ Mini EDTA-free Protease Inhibitor Cocktail (Art. No. 11836170001, Roche)) and sonicated using a Bioruptor® Plus device (Art. No. B01020001, Diagenode) (4°C, 10 cycles à 30 seconds ON and 30 seconds OFF). Following centrifugation for 10 min at 4°C and 21,000 xg, supernatants were carefully transferred into a fresh tube without taking any material from the pellet or lipid phase. Pellet fractions were washed three times in 1x lysis buffer and resuspended in 1x Novex™ NuPAGE™ LDS sample buffer (Art. No. NP0007, Invitrogen™) supplemented with 100 mM DTT. Total protein concentrations of soluble worm extracts were determined using the Pierce™ BCA™ Protein-Assay (Art. No. 23225, Thermo Scientific™) and an Infinite® M200 Pro plate reader (Tecan). Extracts were diluted with 1x lysis buffer to reach 550 μl and a total protein concentration of 3 μg/μl. For each sample, 50 μl of this extract was added to 50 μl 1x Novex™ NuPAGE™ LDS sample buffer supplemented with 100 mM DTT and served as input control sample. For each immunoprecipitation (IP) experiment, 30 μl Novex™ DYNAL™ Dynabeads™ Protein G (Art. No. 10004D, Invitrogen™) were washed three times with 500 μl 1x wash buffer (25 mM Tris HCl pH 7.5, 150 mM NaCl, 1.5 mM MgCl2, 1 mM DTT, cOmplete™ Mini EDTA-free Protease Inhibitor Cocktail), combined with the remaining 500 μl extract and incubated with rotation for 1 h at 4°C. In the meantime, 8 μg antibody (Monoclonal ANTI-FLAG® M2, Art. No. F3165, Sigma-Aldrich® / Myc-Tag (9B11) Mouse mAb, Art. No. 2276, Cell Signaling Technology® / Monoclonal anti-HA (12CA5) mouse antibody, in-house production) was conjugated to another 30 μl Novex™ DYNAL™ Dynabeads™ Protein G according to the manufacturer’s instructions. Extracts were separated from non-conjugated Dynabeads™, combined with antibody-conjugated Dynabeads™ and incubated with rotation for 2 h at 4°C. Following three washes with 500 μl 1x wash buffer, antibody-conjugated Dynabeads™ were resuspended in 25 μl 1.2x Novex™ NuPAGE™ LDS sample buffer supplemented with 120 mM DTT.
For RIP experiments, immunoprecipitations were performed as described above with the following modifications: i) adult animals were harvested, ii) soluble worm extracts were diluted to 650 μl and a total protein concentration of 7 μg/μl, of which 150 μl served as input sample for later RNA extraction, iii) antibody-conjugated Dynabeads™ were resuspended in 50 μl nuclease-free water.
For RIP experiments on males, synchronized wago-3(xf119) I;him-5(1490) V. animals were cultured at 20°C until adulthood. Adults were collected in M9 buffer and filtered through a 35 μm mesh using CellMicroSieves™ (35 micron pore size; Art. No. N35R, BioDesign Inc. of New York)15. Animals at the bottom of the mesh (> 98 % males) were collected and frozen on dry ice in sterile water and 200 μl aliquots.
Immunoprecipitation experiments associated with mass spectrometry and small RNA sequencing were performed in quadruplicates and triplicates, respectively.
Western Blot
Equal amounts of input samples (2 %) and IP samples (10 %) were adjusted to same volume with 1x Novex™ NuPAGE™ LDS sample buffer (Art. No. NP0007, Invitrogen™) supplemented with 100 mM DTT and incubated for 10 min at 95°C. Together with PageRuler™ Prestained Protein Ladder (10 to 180 kDa, Art. No. 26616, Thermo Scientific™) or Color Prestained Protein Standard (10 to 250 kDa, Art. No. P7719S, New England BioLabs® GmbH), samples were separated on a Novex™ NuPAGE™ 4-12 % Bis-Tris Mini Protein Gel (Art. No. NP0323, Invitrogen™) in 1x Novex™ NuPAGE™ MOPS SDS Running Buffer (Art. No. NP0001, Invitrogen™) at 50 mA. Afterwards, proteins were transferred on an Immobilon™-P Membran (PVDF, 0.45 μm, Art. No. IPVH00010, Merck Millipore) for 16 h at 15 V using a Mini Trans-Blot® Cell (Art. No. 1703930, Bio-Rad) and 1x NuPAGE™ Transfer Buffer (Art. No NP0006, Invitrogen™) supplemented with 20 % methanol. Following incubation in 1x PBS supplemented with 5 % skim milk and 0.05 % Tween®20 for 1 h, the PVDF membrane was cut according to the molecular weight of the proteins of interest. Each part was incubated in 1x PBS supplemented with 0.5 % skim milk, 0.05 % Tween®20 and the primary antibody (1:5,000 monoclonal ANTI-FLAG® M2, Art. No. F3165, Sigma-Aldrich® / 1:1,000 Myc-Tag (9B11) Mouse mAb, Art. No. 2276, Cell Signaling Technology® / 1:5,000 anti-Histone H3, Art. No. H0164, Sigma-Aldrich® / 1:1,000 polyclonal ANTI-FLAG® antibody produced in rabbit, Art. No. F7425, Lot. No. 086M4803V, Sigma-Aldrich® / 1:1,000 Myc-Tag (71D10) Rabbit mAb, Art. No. 2278, Cell Signaling Technology® / 1:1,000 polyclonal anti-HA-Tag antibody produced in rabbit, Art. No. SAB4300603, Lot. No. 5117T501, Sigma-Aldrich® / 1:1,000 β-Actin (D6A8) Rabbit mAb, Art. No. 8457, Cell Signaling Technology® / 1:2,500 monoclonal anti-α-Tubulin antibody produced in mouse, clone B-5-1-2, Art. No. T6074, Sigma-Aldrich / 1:1,000 monoclonal anti-GFP antibody (clone B-2), Santa Cruz, Art. No. sc-9996, Lot.#K1115 / 1:1,000 polyclonal anti-RFP antibody pre-adsorbed, produced in rabbit, Lot. #33754, Art. No. 600-4001-379, ROCKLAND) for 1 h, followed by three washes with 1x PBS supplemented with 0.05 % Tween®20 (hereinafter referred to as 0.05 % PBS-T) for 10 min each, one hour incubation in 0.05 % PBS-T supplemented with the secondary antibody (1:10,000 anti-mouse IgG, HRP-linked antibody, Art. No. 7076, Cell Signaling Technology® / 1:10,000 anti-rabbit IgG, HRP-linked antibody, Art. No. 7074, Cell Signaling Technology®) and three final washes with 0.05 % PBS-T for 10 min each. Chemiluminescence detection was performed using Amersham™ ECL Select™ Western Blotting Detection Reagent (Art. No. RPN2235, GE Healthcare) and a ChemiDoc™ XRS+ System (Art. No. 1708265, Bio-Rad). Samples shown in Fig. 8b-c were separated on a Novex™ NuPAGE™ 10 % Bis-Tris Mini Protein Gel (Art. No. NP0301, Invitrogen™).
Mass spectrometry and proteome comparison
IP’s were performed in quadruplicate. Following resuspension of the precipitates in Novex™ NuPAGE™ LDS sample buffer (Art. No. NP0007, Invitrogen™), samples were incubated at 70°C for 10 min and separated on a Novex™ NuPAGE™ 4-12 % Bis-Tris Mini Protein Gel (Art. No. NP0321, Invitrogen™) in 1x Novex™ NuPAGE™ MOPS SDS Running Buffer (Art. No. NP0001, Invitrogen™) at 180 V for 10 min. After separation the samples were processed by in-gel digest as previously described 16,17. Following protein digest, the peptides were desalted using a C18 StageTip 18. For measurement the digested peptides were separated on a 25 cm reverse-phase capillary (75 μm inner diameter) packed with Reprosil C18 material (Dr. Maisch GmbH). Elution was carried out along a two hour gradient of 2 to 40 % of a mixture of 80 % acetonitrile/0.5 % formic acid with the EASY-nLC 1000 system (Art. No. LC120, Thermo Scientific™). A Q Exactive™ Plus mass spectrometer (Thermo Scientific™) operated with a Top10 data-dependent MS/MS acquisition method per full scan was used for measurement 19. Processing of the obtained results was performed with the MaxQuant software, version 1.5.2.8 against the Wormbase protein database (version WS263) for quantitation 20. The processed data was visualized with R® and R-Studio® using in-house scripts.
RNA extraction, library preparation and sequencing
RNA of input and GFP::3xFLAG::WAGO-3 immunoprecipitation samples was extracted using TRIzol™ LS Reagenz (Art. No. 10296010, Invitrogen™) according to the manufacturer’s instructions, and resuspended in nuclease-free water. RNA quality and quantity was assessed using the Bioanalyzer RNA 6000 Nano Kit (Art. No. 5067-1511, Agilent Technologies) and Qubit™ RNA BR Assay Kit (Art. No. Q10210, Invitrogen™), respectively.
RNA 5' Pyrophosphohydrolase (RppH) (Art. No. M0356S, New England BioLabs®) treatment was performed with a starting amount of 690 ng. After purification samples were quantified using the Qubit™ RNA HS Assay Kit (Art. No. Q32852, Invitrogen™). NGS library preparation was performed with NEXTFLEX® Small RNA-Seq Kit v3 (Bioo Scientific®) following Step A to Step G of the manufacturer’s standard protocol (v16.06). Libraries were prepared with a starting amount ranging between 426 ng – 896 ng and amplified in 16 PCR cycles. Amplified libraries were purified by running an 8 % TBE gel and size-selected for 15 – 50 bp. Libraries were profiled in a High Sensitivity DNA Chip on a 2100 Bioanalyzer Instrument (Agilent Technologies) and quantified using the Qubit™ dsDNA HS Assay Kit (Art. No. Q32851, Invitrogen™), in a Qubit™ 2.0 Fluorometer (Invitrogen™). All samples were pooled in equimolar ratio and sequenced on one NextSeq 500/550 Flowcell, SR for 1x 84 cycles plus seven cycles for the index read.
Read processing and mapping
Raw sequenced reads from high quality libraries, as assessed by FastQC, were processed with Cutadapt 21 for adapter removal (-a TGGAATTCTCGGGTGCCAAGG -O 5 -m 26 -M 48) and low-quality reads were filtered out using the FASTX-Toolkit (fastq_quality_filter, -q 20 -p 100 -Q 33). Unique molecule identifiers (UMIs) were used to remove PCR duplicates via an in-house script and were subsequently removed using seqtk (trimfq-l 4 – b 4). Finally, reads shorter than 15 nt were removed with seqtk (seq -L 15).
A custom GTF-file was created by adding transposons retrieved from Wormbase (PRJNA13758.WS264) to the Ensembl reference WBcel235.84 and reads were aligned using bowtie v1.2.2 22(–phred33-quals –tryhard –best –strata –chunkmbs 256 -v 2 -M 1).
Small RNA classification and target identification
All mapped reads were divided into sense and antisense reads using BEDTools intersect 23, and reads of differing lengths and 5’-nucleotides were counted using a custom python script.
Small RNA classes were then extracted from the mapped reads with the different classes defined as: 21U-RNAs, 21 nucleotide long mapped reads that map sense to annotated piRNA loci; 22G-RNAs, mapped reads of lengths 20-23 nucleotides with a G at the 5’ position that map antisense to protein-coding genes/ncRNAs/pseudogenes; 26G-RNAs, mapped reads 26 nucleotides long that map antisense to annotated protein-coding genes/ncRNAs/pseudogenes; miRNAs are 20-24 nt reads mapping sense to annotated miRNA loci; finally all mapped reads longer than 26 nucleotides were classed in a separate group. ncRNAs were defined to include not only annotated ncRNAs but also RNAs annotated as lincRNAs, snRNAs, snoRNAs, tRNAs, and rRNAs. Read filtering was done with a python script based on pysam v0.15 24 in combination with BEDTools intersect to extract miRNA and piRNA information 23.
All mapped reads from sequences of 20-23 nucleotides in length regardless of 5’-nucleotide and mapping direction were counted using htseq-count v0.11.1 25(-s no -m intersection-nonempty). RPKMs were calculated for 22Gs mapping to protein-coding genes/ncRNA/pseduogenes relative to all mapped reads. Targets were defined as genes that were positive in at least two out of three replicates, with positive meaning that the 22G RPKM was i) above 4 in the IP, ii) at least twice as high in the IP relative to the input, and iii) non-zero in the input.
For 22Gs mapping to transposons, RPKMs were calculated relative to the predicted number and length of insertions in the custom annotation file and positives were defined using only requirements ii and iii above with no minimal RPKM requirement in the IP.
Protein-coding target genes of WAGO-3 were compared to: i) protein-coding target genes of CSR-126, ii) protein-coding target genes of siRNAs downregulated in mut-16 mutantanimals 27, and iii) protein-coding target genes of sperm-derived 22G RNAs 28. To determine germline expression, protein-coding target genes of WAGO-3 were compared to lists of genes expressed in the C. elegans germline of either fem-3 or fog-2 mutant animals 29.
22G RNA coverage on protein-coding genes
Coverage of 22Gs along targeted protein-coding genes was visualized by i) creating bigwig tracks normalized to mapped non-structural reads (rRNA/tRNA/snoRNA/snRNA) * 1 million (RPM) using a combination of BEDTools (genomeCoverageBed -bg -scale -split) 23followed by bedGraphToBigWig; ii) log2(IP/input) normalized tracks were created with deepTools v3.4.1 30 (bigwigCompare –binSize 10 –ratio log2); iii) coverage for each gene was determine with deepTools (computeMatrix scale-regions --metagene --missingDataAsZero -b 250 -a 250 --regionBodyLength 2000 --binSize 50 --averageTypeBins median) with the male samples only being compared to targets found in males and hermaphrodite samples only being compared to targets found in hermaphrodites; and plots were generated with plotProfile (--plotType se --averageType mean --perGroup) to scale and visualize 22G abundance along targeted genes.
Reads mapping to intronic, exonic, or untranslated regions were counted using a custom Python script with reads mapping at exon-intron junctions counted as 0.5 intronic and 0.5 exonic regardless of the spanned region.
Microscopy
For L4 larvae, adults and males, 20 – 30 animals were washed in a drop of 100 μl M9 buffer and subsequently transferred to a drop of 50 μl M9 buffer supplemented with 40 mM sodium azide on a coverslip. After 15 to 30 min, excess buffer was removed and a glass slide containing a freshly made agarose pad (2 % (w/v) in water) was placed on top of the coverslip. For imaging embryos, adult hermaphrodites were washed and dissected in M9 buffer before mounting. To image sperm, L4 males were singled from hermaphrodites, grown over night, washed and dissected in SMG buffer (50 mM HEPES pH 7.5, 50 mM NaCl, 25 mM KCl, 5 mM CaCl2, and 1 mM MgSO4, 10 mM glucose) by cutting near the vas deferens. Animals and sperm were immediately imaged using a TCS SP5 Leica confocal microscope equipped with a HCX PL APO 63x water objective (NA 1.2) or HCX PL APO CS 40x oil objective (NA 1.3). Fluorescence emission was detected by either photomultiplier tubes (PMTs) or hybrid detectors (HyDs). Depending on the experiment, SMG buffer was supplemented with 1:2,000 Hoechst33342 (Art. No. H1399, Invitrogen™), 200 nM MitoTracker® Green FM (Art. No. M7514, Invitrogen™) or 1,6-hexanediol (Art. No. 240117, Sigma-Aldrich®), and sperm were imaged after 30 min incubation. To score the expression of a germline-specific mCherry::H2B transgene, we used a Leica DM6000 B research microscope equipped with a HC PL Fluotar 20x dry objective (NA 0.5). Images were processed using ImageJ v1.53i. The following figures were deconvolved using the Huygens Remote Manager v3.6: Fig. 1c,e,h, Fig. 7b, Extended Data Fig. 4a,b, e-j, Extended Data Fig. 5a, Extended Data Fig. 8c.
Time series of spermatocytes expressing GFP::3xFLAG::WAGO-3 were acquired with a fluorescence spinning disk confocal microscope (SDCM) from Visitron Systems (VisiSope 5Elements) based on a Nikon Ti-2E stand and a spinning disk from Yokogawa (CSU-W, 50 μm pinhole) controlled by the VisiView® software. The microscope was equipped with a 60x plan apochromatic water immersion objective (CFI Plan Apo VC, NA 1.2), a twofold magnification lens in front of the sCMOS camera (BSI, Photometrics), and a stage-top incubation chamber for live imaging (20°C, ambient CO2). The sample was excited by an argon laser at λex = 488 nm (200 mW, power set to 20 %) and the emission was detected in a range of λem = 500 - 550 nm (ET525/50m, Chroma).
Image quantification
Co-localization analyses of confocal micrographs of C. elegans gonads were performed using ImageJ v1.53i and the JACoP plugin. Foci quantification and co-localization analyses of confocal Z-stacks of isolated, male-derived germ cells were performed using IMARIS 9.7.2. Distribution of fluorescence intensities between budding spermatids and residual body, as well as quantification of pixel counts per fluorescence intensity (grey value) were determined using ImageJ v1.53i. The relative pixel count is the number of pixels with a given fluorescence intensity within a selected region of interest (either spermatid or residual body), divided by the total number of pixels in that region. Every other data distribution is represented as box plot, with the whiskers defining the maximum and minimum values, a rectangle marking the first and third quartile, and the median. Outliers are defined as values, which fall more than 1.5 times the interquartile range above the third quartile, or 1.5 times the interquartile range below the first quartile.
FRAP
FRAP measurements were performed on a TCS SP5 Leica confocal microscope equipped with a FRAP-booster and a HCX PL APO 63x water objective (NA 1.2). An entire granule was bleached in a fixed region of interest (ROI) (0.9 μm diameter), while two additional control ROIs of same size were used to detect fluorescence emission of an unbleached granule and background signal, respectively. Five pre-bleach frames were recorded (5x 0.374 s/frame), followed by two bleach frames (2x 0.374 s/frame), and 3 sets of post-bleach frames (10x 0.5 s/frame, 10x 5 s/frame, 15x 10 s/frame). Data analysis including full scale normalization and curve fitting using a double term exponential equation was performed using EasyFRAP-web 31.
MO counting
The LysoSensor™Blue DND-192 stained MOs 32 within living spermatids were viewed using an Olympus BX60 with a 1.35 numerical aperture 100x oil-immersion objective lens. Epi-fluorescence of stained MOs was imaged using a DAPI filter pack and captured with a SensiCam digital camera (Cooke, Auburn Hills, MI) controlled by SlideBook software (Intelligent Imaging Innovations, Denver, CO). SlideBook software was used to collect Z-axis stacks of 11-30, and 12-bit images were captured every 0.44 - 0.88 μm. The majority of images within the Z-stacks were collected approximately every 0.65 μm. A nearest-neighbor deconvolution algorithm within the SlideBook software was applied to the images. Images were then converted to Z-axis projections, again using capabilities of the SlideBook software. The diameters of individual spermatids were measured within SlideBook using the software’s ruler function over images captured with a DIC filter. The manipulated images were exported from SlideBook as 16-bit tif images. The 16-bit tif images exported from SlideBook were re-opened in ImageJ software (NIH, Bethesda, MD). The cell counter plugin within ImageJ was used to assist in counting MOs. Images were compiled using PhotoShop CS3 (Adobe Systems, San Jose, CA).
BmN4 cell culture and transfection
BmN4 cells were cultured at 27°C in IPL-41 (Gibco) medium supplemented with 10% FBS (Gibco) and 1% Pen-Strep. 6.0 x 10⁵ BmN4 cells were seeded in a single well of a 6-wells format and the next day transfected with 2 μg of plasmid DNA using X-tremeGene HP (Roche). 2-BP was added 3 hours post transfection and after 24 hours cells were harvested and lysed in IP-150 lysis buffer (30 mM Hepes [pH 7.4], 150 mM potassium acetate, 5 mM magnesium acetate, 5 mM dithiothreitol, 0.1% Tergitol-type NP-40, 2 mg/ml pepstatin, 2 mg/ml leupeptin, and 0.5% aprotinin).
For the immunoprecipitation experiments 4.0 x 10⁶ BmN4 cells were seeded in a 10-cm dish and transfected with 10 μg of plasmid DNA. Cells were lysed in IP-150 lysis buffer (supplemented with 0.5% Triton X-100) and immunoprecipitation experiments were performed using ChromoTek RFP-TRAP beads. Following immunoprecipitation, beads were washed five times in IP-150 lysis buffer (supplemented with 0.5% Triton X-100).
Correlative Light and Electron Microscopy (CLEM)
For Correlative light and electron microscopy (CLEM) analyses, C. elegans males (wago-3(xf119) I; pei-1(xf193) IV; him-5(e1490) V.) were selected using a stereomicroscope. Using a platinum wire, around 50 worms were transferred into the 100 μm deep cavity of an A-type carrier (Wohlwend, imbibed with 1-hexadecene) filled with thick E. coli paste (serving as a cryo-protectant; thick OP50 E.coli suspension in M9 worm buffer, 20 % BSA, 150 mM NaCl), closed with the flat side of a B-type carrier and subsequently high-pressure frozen (HPM010, AbraFluid). All samples were further processed by freeze-substitution (FS) in a temperature-controlling device (EM-AFS2, Leica Microsystems). FS was carried out at −90°C for 72 h with 0.1 % (w/v) uranyl acetate in glass distilled acetone (EMS). The temperature was then raised to −45°C (3.5°C/h), and samples were further incubated for 5 h. After rinsing in acetone, samples were infiltrated with increasing concentrations (10, 25, 50, and 75 %; 6 h each) of Lowicryl HM20 resin (EMS) in acetone, while the temperature was further raised to −25°C. 100 % Lowicryl was exchanged three times in 10 h steps, and samples were UV polymerized at −25°C for 48 h, after which the temperature was raised to 20°C (5°C/h), and UV polymerization continued for 6 h. 300 nm thick longitudinal sections were cut with an ultra-microtome (UC7, Leica) and a diamond knife (ultra semi, DiATOME). Targeting of areas containing spermatocytes and spermatids was performed using toluidine blue staining. Sections of interest were picked up onto carbon-coated formvar-slot grids. Ultramicrotomy and acquisition of the in-resin retained fluorescence within the sections were best performed on the same day to avoid bleaching of the fluorescence. The fluorescence microscopy (FM) imaging of the sections (stained additionally with HOECHST) was carried out as previously described 33 using a wide field fluorescence microscope (Olympus IX81) equipped with an Olympus PlanApo 100x 1.40 NA oil immersion objective. After post-staining, tilt series of the area of interest (1° increment, −60° to 60°) were acquired using a FEI TECNAI F30 TEM operated at 300 kV and a fast Gatan OneView 4K camera. Tomograms were reconstructed at a final voxel size of 1.56 nm using gold fiducials and weighted-back projection algorithms of the software package IMOD 34. Correlation between light and electron micrographs was carried out with the plugin ec-CLEM 35 of the software platform Icy 36. The coordinates of pairs of corresponding features in the two imaging modalities (50 nm Tetraspecks, HOECHST-stained condensed chromosomes, auto-fluorescent uranyl-acetate-stained E. coli) were used to calculate a linear transformation, which allowed mapping the coordinates of the fluorescent spots of interest to overlay them on the electron micrograph. Electron tomograms were displayed and analyzed using the IMOD software package 34.
Statistics & Reproducibility
Statistical analyses were performed using R-based packages. The log-rank-test was used for the mortal germline assay. For multiple group comparison, either one-way analysis of variance (ANOVA) test followed by Tukey’s honestly significant difference post hoc test, or Pearson's Chi-squared test with Yates' continuity correction, or Fisher’s exact test was used. P values of less than 0.05 were considered significant. Pearson’s correlation analyses were performed to determine the relationship between two different factors. No statistical method was used to predetermine sample size. No data were excluded from the analyses. Fluorescence microscopy, correlative electron and light microscopy (CLEM), time lapse microscopy, 1,6-hexanediol assays as well as C. elegans experiments comprising mCherry::H2B(RNAe) reactivation and Mutator-induced sterility have been performed two times. Mortal germline assay (Extended Data Fig. 1a) and Western Blots (Figure 8a-b, Extended Data Fig. 10a-b,h-i) have been performed once unless specified in the legends. Immunoprecipitation experiments associated with mass spectrometry and small RNA sequencing were performed in biological quadruplicates and triplicates, respectively. Quantification and statistical analyses of microscopy images were derived from the number of cells analyzed across two independent experiments as indicated in the figure legends, with presented data being derived from one representative, independent experiment.
Extended Data
Extended Data Fig. 1. WAGO-3 is required for germline immortality and transgenerational maintenance of RNAe.
a, Mortal germline assay representing loss of fertility of strains with indicated genotype at 25°C. Statistical significance was tested with a log-rank-test (n = 15 populations per strain assayed in a single experiment). b, Diagram displaying mCherry::H2B(RNAe) reactivation in prg-1(n4357), prg-1(n4357);mut-7(xf125) and prg-1(n4357);wago-3(pk1673) mutant generations. F2-F5: second-fifth homozygous generation. For each generation, reactivation in 10 populations of 50 animals each was scored. Each plotted point represents the fraction of 50 animals that express the mCherry::H2B transgene. Since no prg-1(n4357) single mutant animal was found to reactivate mCherry::H2B expression, the value of this group is deterministically zero due to lack of variability/statistical noise. Thus, any positive number of animals that expresses the mCherry::H2B transgene in either the prg-1(n4357);mut-7(xf125) or prg-1(n4357);wago-3(pk1673) group causes a significant difference from the prg-1(n4357) group. c, Micrographs of three example animals with the mCherry::H2B transgene in either RNAe (prg-1(n4357)) or activated (prg-1(n4357);wago-3(pk1673) and prg-1(n4357);mut-7(xf125)) status. Top panel shows schematic representation of an adult hermaphroditic gonad. Activity status of the transgene was homogeneous in F2 homozygous prg-1(n4357) and prg-1(n4357);mut-7(xf125) mutants. Images represent two biologically independent experiments. Scale bars: 30 μm. Source data are provided.
Extended Data Fig. 2. WAGO-3 is associated with 22G RNAs.
a, Read length distribution and first nucleotide bias of indicated small RNA libraries. Both hermaphrodite and male libraries were prepared and sequenced in biological triplicates. Each panel represents a replicate, top and bottom bars represent sense and anti-sense small RNAs mapping to annotated loci. b, Heat map showing the enrichment or depletion of small RNA species of the libraries shown in a. >27 nt are non-specific RNA fragments, also including fragments of structural RNAs, such as rRNA and tRNA. 21U, 22G, 26G and miRNA are known Argonaute-associated small RNA species. Statistically significant differences between small RNA types were determined by Fisher’s exact tests (***: p ≤ 0.001, ns: p > 0.05). The exact P values are provided as source data. c, Box plots displaying the distribution of WAGO-3 associated 22G RNAs mapping to protein-coding genes across the indicated gene segments. Each box plot represents average data from three biological replicates. Boxplot centre and box edges indicate median and 25th or 75th percentiles, respectively, while whiskers indicate the median ± 1.5 x interquartile range. d, Metagene analysis of 22G RNA reads mapping to protein-coding WAGO-3 target genes. TSS – transcription start site, TES – transcription end site. Shading around each line represents the standard error of the median of each bin. Source data are provided.
Extended Data Fig. 3. WAGO-3 targets overlap with Mutator targets and sperm-derived 22G RNAs.
a, Scatter plots displaying the RPKM of 22G RNAs mapping to individual genes in immunoprecipitation (IP) (Y-axis) versus input (X-axis) samples for all six sequenced libraries. Transposons are not included in these plots. Light blue: significant enrichment of genes in at least two replicates. Dark blue: significant enrichment of genes in only one replicate. b, Germline expression status of protein-coding WAGO-3 target genes. Left column shows the distribution of expression profiles of all annotated protein-coding genes. Columns 2 and 3 show the same, but for hermaphrodite and male-specific WAGO-3 targets, respectively. Column 4 shows the same for targets found in both sexes. Statistically significant differences with respect to complete gene annotations were determined by Chi-square tests. c, Scatter plots displaying the RPKM of 22G RNAs mapping to transposons in the six individual experiments in input (X-axes) and IP samples (Y-axes). Red line represents the diagonal. d, Venn diagrams displaying the overlaps of WAGO-3 targets (protein-coding) called in hermaphrodites and males with previously determined CSR-1 and MUT-16 targets. e, Stacked bar plot showing number and types of WAGO-3 targets. f, Heat map showing the overlap of WAGO-3 targets (protein-coding) with previously determined sperm-derived 22G RNA targets (protein-coding), which were binned into indicated groups. Values inside the boxes indicate fraction of overlap. Source data are provided.
Extended Data Fig. 4. PEI granules specifically recruit WAGO-3.
a-b, Confocal maximum intensity projections of an adult hermaphrodite (a) and gastrula-staged embryo (b) expressing indicated proteins. Zooms show perinuclear co-localization of GFP::3xFLAG::WAGO-3 and PGL-1::mTagRFP-T in meiotic (a) and primordial (b) germ cells. Z2/Z3 are the primordial germ cells of C. elegans. Scale bars: 20 μm (a, adult), 20 μm (b, embryo), 10 μm (a, zoom), 4 μm (b, zoom). c, Quantification of GFP::3xFLAG::WAGO-3 foci number within indicated, male-derived germ cells (n = 10 cells pooled from two independent experiments, for each condition). Statistically significant differences were determined by one-way ANOVA (p ≤ 0.001) followed by Tukey’s honestly significant difference post hoc test (p ≤ 0.05). Different letters represent significant differences. Note that the values for primary spermatocytes and budding spermatids (c) are the same as those shown in Fig. 3j (FL) and Extended Data Figure 10f (wild-type), and Fig. 4n (FL) and Fig. 7j (wild-type), respectively. Secondary spermatocyte and budding spermatid stages are separated into ‘c’ and ‘s’. c: coupled; due to incomplete cytokinesis, leaving the two sister cells coupled and both cells were analyzed; s: separate, each of the coupled cells in ‘c’ was analyzed individually. Boxplot centre and box edges indicate median and 25th or 75th percentiles, respectively, while whiskers indicate the median ± 1.5 x interquartile range. d, Co-immunoprecipitation experiments using whole-worm extracts of late-L4 stage hermaphrodites analyzed by Western blotting. Sample processing control was run on a different gel. Data represent two biologically independent experiments. e-j, Confocal micrographs of an adult male (f) and late-L4 stage hermaphrodites (e,g-j) expressing indicated proteins. sc – spermatocyte, st – spermatid, rb – residual body. Scale bars: 10 μm (e-j). a,b,e-j, Images represent two biologically independent experiments. k-n, Co-localization analyses between PEI-1::mTagRFP-T and DEPS-1::GFP (k), GFP::3xFLAG::WAGO-1 (l), GFP::3xFLAG::CSR-1 (m) and GFP::3xFLAG::ALG-3 (n) based on the images shown in g-j, respectively (n = 10 worms for each condition). X and Y axes indicate fluorescence intensity. PC: Pearson’s correlation coefficient. Exact P values (c), unprocessed original scans of blots and the source data for all graphical representations are provided.
Extended Data Fig. 5. Presence of WAGO-3 in spermatozoa is dependent on the IDR of PEI-1.
a, Confocal micrographs showing spermatogenesis of late-L4 stage hermaphrodites expressing PEI 1::mTagRFP-T in indicated mutants. sc – spermatocyte, rb – residual body, st – spermatid. Images represent two biologically independent experiments. Scale bars: 10 μm. b-h, Confocal maximum intensity projections of hermaphrodite-derived spermatozoa within the spermatheca expressing indicated proteins. In all panels, except c, a piece of a gonad arm expressing GFP::3xFLAG::WAGO-3 is visible in the top part of the image. Dashed lines indicate spermatheca. Images represent two biologically independent experiments. Scale bars: 10 μm.
Extended Data Fig. 6. PEI granules are static condensates with liquid-like properties.
a-b, Confocal micrographs of isolated, male-derived spermatocytes (a) and budding spermatids (b) expressing GFP::3xFLAG::WAGO-3 and PEI-1::mTagRFP-T. Images were taken after a 30 minute treatment with 1,6-hexanediol. Hoechst33342 was used to stain DNA. Residual bodies are marked by a dashed circle. Images represent two biologically independent experiments. Scale bars: 4 μm. c, FRAP recovery curve of GFP::3xFLAG::WAGO-3 localizing to either P granules in L4 gonads or PEI granules in male-derived spermatids. Normalized data is presented as mean +/− SD and was fitted to a double exponential curve (n = 4 granules pooled from one independent experiment). d, Time sequence showing fluorescence recovery after photobleaching (FRAP) of GFP::3xFLAG::WAGO-3 localizing to either P granules in L4 gonads or PEI granules in male-derived spermatids. Residual bodies are marked by a dashed circle. Images represent two biologically independent experiments. Scale bars: 4 μm. e, Time sequence of GFP::3xFLAG::WAGO-3, taken from Extended Data Movie 1. Images are confocal maximum intensity projections of an isolated, male-derived spermatocyte. Images represent two biologically independent experiments. Scale bar: 4 μm. Source data are provided.
Extended Data Fig. 7. The amino acid composition of the PEI-1 IDR affects exchange dynamics of WAGO-3.
a-b, Occurrence of glycine and serine residues in PEI-1 (a) and PGL-1 (b) was counted in amino acid 50-mers, starting at position one, shifting 5 residues at a time, and displayed as stacked columns. Indicated residue positions in the diagrams are the mid-point of the 50-mer. Y-axes display number of relevant residues in amino acid 50-mers. X-axes indicate the position along the respective proteins. The various domains are indicated by vertical, dashed lines. NtDD and CDD indicate the N-terminal and C-terminal dimerization domains of PGL-1, respectively. The exact positions of glycine and serine residues for each protein are indicated above the stacked bar diagrams. IDR – intrinsically disordered region. c-h, Amino acid composition profiles of the intrinsically disordered region of the indicated proteins. Bars representing serine and glycine residues are highlighted in blue and orange, respectively. Panel d reflects a fusion between the PEI-1 IDR and the very C-terminal end of PGL-1(A711-F771). The profiles were generated using Composition profiler. Sequences were analyzed against the SwissProt database using 10,000 bootstrap iterations. Statistical significance was tested using the two sample t test (***: p ≤ 0.001, **: p ≤ 0.01, *: p ≤ 0.05, ns: p > 0.05). The exact P values are provided as source data. i-j, Time lapse images showing fluorescence recovery after photobleaching (FRAP) of GFP::3xFLAG::WAGO-3 localizing to PEI granules via PEI-1::mTagRFP-T (i) or via PEI-1::PGL-1(A711-F771)::mTagRFP-T (j) in isolated, male-derived budding spermatids. Residual bodies are marked by a dashed circle. Images represent two biologically independent experiments. Scale bars: 4 μm. k, FRAP recovery curves of GFP::3xFLAG::WAGO-3 localizing to PEI granules, containing indicated PEI-1 proteins, in male-derived budding spermatids. Normalized data is presented as mean +/− SD and was fitted to a double exponential curve (n = 5 granules pooled from one independent experiment). Source data are provided.
Extended Data Fig. 8. PEI-1 peptides at the N- and C-termini localize to asymmetrically segregated structures of defined shape.
a, Confocal micrograph of an L4 hermaphrodite expressing free mTagRFP-T from the pei-1 locus. The dashed line indicates the outline of the gonad. Scale bar: 20 μm. b, Confocal maximum intensity projection of spermatozoa within the spermatheca of an adult hermaphrodite expressing free mTagRFP-T from the pei-1 locus. The dashed line indicates the outline of the spermatheca. Scale bar: 10 μm. c, Confocal Z-stack of an isolated, male-derived spermatocyte expressing PEI-1_ΔH15-Q558::mTagRFP-T (see Fig. 4a, middle construct). Z-size: 125.9 nm. Scale bar: 4 μm. d, Confocal micrograph of two isolated, male-derived secondary spermatocytes expressing GFP::3xFLAG::WAGO-3 and PEI-1_ΔH15-Q558::mTagRFP-T. The pei-1 locus was heterozygous: pei-1_ΔH15-Q558::mTagRfp-t/pei-1(+). This allowed the formation and visualization of both PEI granules and PEI-1_ΔH15-Q558-specific structures within the same animal. Scale bar: 4 μm. e, Line profiles displaying relative fluorescence intensity for PEI-1_ΔH15-Q558::mTagRFP-T signals versus GFP::3xFLAG::WAGO-3 signals over the indicated, dashed line shown in panel d. Vertical lines and colored circles indicate fluorescence peaks. a.u. – arbitrary unit. f, Confocal micrograph of an isolated, male-derived spermatocyte (left) and budding spermatids (right) showing the subcellular distribution of mitochondria and PEI-1_ΔH15-Q558-specific structures. MitoTracker® Green FM was used to stain mitochondria. Residual bodies are marked by dashed circles. Scale bar: 4 μm. g, Line profiles displaying relative fluorescence intensity for PEI-1_ΔH15-Q558::mTagRFP-T signals versus mitochondria signals over the indicated, dashed line shown in panel f. Vertical lines and colored circles indicate fluorescence peaks. a.u. – arbitrary unit. All images represent two biologically independent experiments. Source data are provided.
Extended Data Fig. 9. PEI granules are associated with membranous organelles throughout spermatogenesis.
a-c, Overview GFP::3xFLAG::WAGO-3 CLEM montages acquired from three high-pressure frozen adult males expressing GFP::3xFLAG::WAGO-3 and PEI-1::mTagRFP-T. The depicted animals were used to collect the high-resolution CLEM images shown in Fig. 6a-e. In all three panels, germ cell development progresses from left to right. The GFP::3xFLAG::WAGO-3 signal is fitted locally, implying that fluorescence signal was fitted using landmarks (tetraspecks and Hoechst staining) spread over the entire region of interest, spanning a larger field of view. The panels a’-a’”, b’ and c’ depict zoom-ins of the indicated areas in panels a-c. The indicated ‘Tomo’ regions within these zoomed-in panels are shown in greater detail in Fig. 6a-e. Precise CLEM overlays at specific ROIs (Tomos 1 to 5) were done using landmarks more locally and close to each ROI, covering a smaller field of view. The EM grids shown in panels a-c can be navigated using Fiji software and data deposited to Mendeley Data (https://data.mendeley.com/datasets/dgb8d7h2hz/1) , following the instruction listed in Supplementary Information. All images represent two biologically independent experiments.
Extended Data Fig. 10. PEI-2 interacts with PEI-1.
a, Co-immunoprecipitation experiments using whole-worm extracts of late-L4 stage hermaphrodites analyzed by Western blotting. Labels above the blots indicate the presence (+) or absence (−) of the respective tags. Asterisks indicate non-specific signals. b, Pull-down experiments on extracts of transfected BmN4 cells expressing the indicated PEI-1 and PEI-2 variants. Full-length (FL) PEI-1-mCherry was pulled down, followed by detection of the various PEI-2 fragments. Expression of free 3xFLAG-eGFP served as negative control. c, Fraction of total mTagRFP-T signal within the residual body of male-derived budding spermatids expressing PEI-1_ΔH15-Q558::mTagRFP-T in wild-type or pei-2(xf270) mutant background (n = 10 cells pooled from two independent experiments, for each condition). Note that the wild-type data is the same as shown in Fig. 5c (ΔH15-Q558). d, Confocal maximum intensity projection of isolated, male-derived budding spermatids expressing PEI-1_ΔH15-Q558::mTagRFP-T in pei-2(xf270) mutant background. The residual body is marked by a dashed circle. Scale bar: 4 μm. e, Confocal maximum intensity projection of an isolated, male-derived primary spermatocyte expressing GFP::3xFLAG::WAGO-3 and PEI-1::mTagRFP-T in pei-2(xf270) mutant background. Scale bar: 4μm. d,e, Images represent two biologically independent experiments. f-g, Co-localization analysis between GFP::3xFLAG::WAGO-3 and PEI-1::mTagRFP-T (g), and quantification of GFP::3xFLAG::WAGO-3 foci number (f) in wild-type and pei-2(xf270) mutant, male-derived primary spermatocytes (n = 10 cells pooled from two independent experiments, for each condition). c,f,g, Statistically significant differences were determined by one-way ANOVA (p ≤ 0.001). Boxplot centre and box edges indicate median and 25th or 75th percentiles, respectively, while whiskers indicate the median ± 1.5 x interquartile range. Note that the wild-type data in f and g are the same as those shown in Fig. 3j (FL) and Extended Data Figure 4c (primary spermatocyte), and Fig. 3k (FL), respectively. h-i, Transfected BmN4 cells were treated with the palmitoylation inhibitor 2-BP at indicated concentrations, followed by Western Blot detection of PEI-1-mCherry (h) and PEI-2-HA-eGFP (i). α-tubulin served as loading control. a,b,h,i, The experiment has been performed once. Unprocessed original scans of blots are provided in source data.
Supplementary Material
Supplementary Video 1 Time sequence of an isolated, male-derived spermatocyte expressing GFP::3xFLAG::WAGO-3 as shown in Extended Data Fig. 6e. Images are confocal maximum intensity projections. Scale bar: 4 μm.
Supplementary Video 2 Time sequence of an isolated, male-derived spermatocyte expressing GFP::3xFLAG::WAGO-3 in absence of SPE-10. Images are confocal maximum intensity projections. Scale bar: 4 μm.
Supplementary Table 1: List of C. elegans strains used in this study.
Supplementary Table 2: List of sgRNA sequences used in this study.
Supplementary Table 3: List of DNA donor templates used in this study.
ACKNOWLEDGEMENTS
We thank the members of the Ketting laboratory for helpful discussions. We are grateful to Helge Grosshans for critical reading of the manuscript. A special thanks to Miroslav Dörr and Svenja Hellmann for excellent technical support. Clara Werner and Annabelle Dold of the IMB Genomics Core Facility are thanked for small RNA library preparation. We thank the IMB Media Laboratory, Microscopy, Proteomic and Genomic Core Facilities for consumables, equipment and experimental support. Simone Köhler and Martin Schorb are thanked for their help in CLEM sample preparation and visualization. Some strains were provided by the Caenorhabditis Genetics Center (CGC), funded by NIH Office of Research Infrastructure Programs (P40 OD010440). We acknowledge the GenEvo RTG funded by the Deutsche Forschungsgemeinschaft (DFG) – 407023052/GRK2526/1 enabling the conception of this project. This work was supported by grants of the DFG KE 1888/1-1, KE1888/1-2 and KE 1888/6-1 (R.F.K.) and the National Institute of Health R35 GM119656 (C.M.P.), and T32 GM118289 (D.H.N.).
Footnotes
FINANCIAL AND NON-FINANCIAL COMPETING INTERESTS
The authors declare no financial and non-financial competing interests.
Code availability
All code developed for this analysis is available via https://github.com/Tunphie/SequencingTools/blob/main/smRNA_TypeCounter.py and https://github.com/Tunphie/SequencingTools/blob/main/CoverageOnProteinCodingGenes.py.
Data Availability
The accession number for the smRNA-seq data generated in this study is PRJNA629991. The mass spectrometry proteomics data have been deposited to the ProteomeXchange Consortium via the PRIDE 37 partner repository with the dataset identifier PXD019099. Supplemental BigDataViewer supporting the CLEM analyses is available online: Mendeley Data, V1, doi: 10.17632/dgb8d7h2hz.1 (https://data.mendeley.com/datasets/dgb8d7h2hz/1). Source data are provided with this study. All other data supporting the findings of this study are available from the corresponding author on reasonable request.
MAIN MANUSCRIPT REFERENCES
- 1.Bošković A & Rando OJ Transgenerational epigenetic inheritance. Annu. Rev. Genet 52, 21–41 (2018). [DOI] [PubMed] [Google Scholar]
- 2.Hutvagner G & Simard MJ Argonaute proteins: Key players in RNA silencing. Nat. Rev. Mol. Cell Biol 9, 22–32 (2008). [DOI] [PubMed] [Google Scholar]
- 3.Peters L & Meister G Argonaute Proteins: Mediators of RNA Silencing. Mol. Cell 26, 611–623 (2007). [DOI] [PubMed] [Google Scholar]
- 4.Castel SE & Martienssen RA RNA interference in the nucleus: Roles for small RNAs in transcription, epigenetics and beyond. Nat. Rev. Genet 14, 100–112 (2013). [DOI] [PMC free article] [PubMed] [Google Scholar]
- 5.Xu F, Guang S & Feng X Distinct nuclear and cytoplasmic machineries cooperatively promote the inheritance of RNAi in Caenorhabditis elegans. Biol. Cell 110, 217–224 (2018). [DOI] [PubMed] [Google Scholar]
- 6.Wan G et al. Spatiotemporal regulation of liquid-like condensates in epigenetic inheritance. Nature 557, 679–683 (2018). [DOI] [PMC free article] [PubMed] [Google Scholar]
- 7.de Albuquerque BFM, Placentino M & Ketting RF Maternal piRNAs Are Essential for Germline Development following De Novo Establishment of Endo-siRNAs in Caenorhabditis elegans. Dev. Cell 34, 448–456 (2015). [DOI] [PubMed] [Google Scholar]
- 8.Phillips CM, Brown KC, Montgomery BE, Ruvkun G & Montgomery TA PiRNAs and piRNA-Dependent siRNAs Protect Conserved and Essential C. elegans Genes from Misrouting into the RNAi Pathway. Dev. Cell 34, 457–465 (2015). [DOI] [PMC free article] [PubMed] [Google Scholar]
- 9.Buckley BA et al. A nuclear Argonaute promotes multigenerational epigenetic inheritance and germline immortality. Nature 489, 447–451 (2012). [DOI] [PMC free article] [PubMed] [Google Scholar]
- 10.Mao H et al. The Nrde Pathway Mediates Small-RNA-Directed Histone H3 Lysine 27 Trimethylation in Caenorhabditis elegans. Curr. Biol 25, 2398–2403 (2015). [DOI] [PubMed] [Google Scholar]
- 11.Gent JI et al. Distinct Phases of siRNA Synthesis in an Endogenous RNAi Pathway in C. elegans Soma. Mol. Cell 37, 679–689 (2010). [DOI] [PMC free article] [PubMed] [Google Scholar]
- 12.Ketting RF, Haverkamp THA, Van Luenen HGAM & Plasterk RHA mut-7 of C. elegans, required for transposon silencing and RNA interference, is a homolog of werner syndrome helicase and RNaseD. Cell 99, 133–141 (1999). [DOI] [PubMed] [Google Scholar]
- 13.Zhang C et al. mut-16 and other mutator class genes modulate 22G and 26G siRNA pathways in Caenorhabditis elegans. Proc. Natl. Acad. Sci. U. S. A 108, 1201–1208 (2011). [DOI] [PMC free article] [PubMed] [Google Scholar]
- 14.Phillips CM, Montgomery TA, Breen PC & Ruvkun G MUT-16 promotes formation of perinuclear Mutator foci required for RNA silencing in the C. elegans germline. Genes Dev. 26, 1433–1444 (2012). [DOI] [PMC free article] [PubMed] [Google Scholar]
- 15.Gu W et al. Distinct Argonaute-Mediated 22G-RNA Pathways Direct Genome Surveillance in the C. elegans Germline. Mol. Cell 36, 231–244 (2009). [DOI] [PMC free article] [PubMed] [Google Scholar]
- 16.Yigit E et al. Analysis of the C. elegans Argonaute Family Reveals that Distinct Argonautes Act Sequentially during RNAi. Cell 127, 747–757 (2006). [DOI] [PubMed] [Google Scholar]
- 17.Xu F et al. A Cytoplasmic Argonaute Protein Promotes the Inheritance of RNAi. Cell Rep. 23, 2482–2494 (2018). [DOI] [PubMed] [Google Scholar]
- 18.Ashe A et al. PiRNAs can trigger a multigenerational epigenetic memory in the germline of C. elegans. Cell 150, 88–99 (2012). [DOI] [PMC free article] [PubMed] [Google Scholar]
- 19.Shirayama M et al. PiRNAs initiate an epigenetic memory of nonself RNA in the C. elegans germline. Cell 150, 65–77 (2012). [DOI] [PMC free article] [PubMed] [Google Scholar]
- 20.Luteijn MJ et al. Extremely stable Piwi-induced gene silencing in Caenorhabditis elegans. EMBO J. 31, 3422–3430 (2012). [DOI] [PMC free article] [PubMed] [Google Scholar]
- 21.Claycomb JM et al. The Argonaute CSR-1 and Its 22G-RNA Cofactors Are Required for Holocentric Chromosome Segregation. Cell 139, 123–134 (2009). [DOI] [PMC free article] [PubMed] [Google Scholar]
- 22.Banani SF, Lee HO, Hyman AA & Rosen MK Biomolecular condensates: Organizers of cellular biochemistry. Nat. Rev. Mol. Cell Biol 18, 285–298 (2017). [DOI] [PMC free article] [PubMed] [Google Scholar]
- 23.Updike D & Strome S P granule assembly and function in Caenorhabditis elegans germ cells. J. Androl 31, 53–60 (2010). [DOI] [PMC free article] [PubMed] [Google Scholar]
- 24.Voronina E, Seydoux G, Sassone-Corsi P & Nagamori I RNA granules in germ cells. Cold Spring Harb. Perspect. Biol 3, (2011). [DOI] [PMC free article] [PubMed] [Google Scholar]
- 25.Ellis RE & Stanfield GM The regulation of spermatogenesis and sperm function in nematodes. Semin. Cell Dev. Biol 29, 17–30 (2014). [DOI] [PMC free article] [PubMed] [Google Scholar]
- 26.Conine CC et al. Argonautes ALG-3 and ALG-4 are required for spermatogenesis-specific 26G-RNAs and thermotolerant sperm in Caenorhabditis elegans. Proc. Natl. Acad. Sci. U. S. A 107, 3588–3593 (2010). [DOI] [PMC free article] [PubMed] [Google Scholar]
- 27.Alcazar RM, Lin R & Fire AZ Transmission dynamics of heritable silencing induced by double-stranded RNA in Caenorhabditis elegans. Genetics 180, 1275–1288 (2008). [DOI] [PMC free article] [PubMed] [Google Scholar]
- 28.Lev I et al. Germ Granules Govern Small RNA Inheritance. Curr. Biol 29, 2880–2891.e4 (2019). [DOI] [PMC free article] [PubMed] [Google Scholar]
- 29.Grishok A, Tabara H & Mello CC Genetic requirements for inheritance of RNAi in C. elegans. Science (80-. ) 287, 2494–2497 (2000). [DOI] [PubMed] [Google Scholar]
- 30.Perez MF & Lehner B Intergenerational and transgenerational epigenetic inheritance in animals. Nat. Cell Biol 21, 143–151 (2019). [DOI] [PubMed] [Google Scholar]
- 31.Bagijn MP et al. Function, Targets, and Evolution of Caenorhabditis elegans piRNAs. Science (80-. ) 337, 574–578 (2012). [DOI] [PMC free article] [PubMed] [Google Scholar]
- 32.Ozata DM, Gainetdinov I, Zoch A, O’Carroll D & Zamore PD PIWI-interacting RNAs: small RNAs with big functions. Nat. Rev. Genet 20, 89–108 (2019). [DOI] [PubMed] [Google Scholar]
- 33.Lee HC et al. C. elegans piRNAs mediate the genome-wide surveillance of germline transcripts. Cell 150, 78–87 (2012). [DOI] [PMC free article] [PubMed] [Google Scholar]
- 34.Gudipati RK et al. Protease-mediated processing of Argonaute proteins controls small RNA association. Mol. Cell 1–15 (2021). doi: 10.1016/j.molcel.2021.03.029 [DOI] [PubMed] [Google Scholar]
- 35.Robert VPV, Sijen T, van Wolfswinkel J & Plasterk RHA Chromatin and RNAi factors protect the C. elegans germline against repetitive sequences. Genes Dev. 19, 782–787 (2005). [DOI] [PMC free article] [PubMed] [Google Scholar]
- 36.Vastenhouw NL et al. A genome-wide screen identifies 27 genes involved in transposon silencing in C. elegans. Curr. Biol 13, 1311–1316 (2003). [DOI] [PubMed] [Google Scholar]
- 37.Stoeckius M, Grün D & Rajewsky N Paternal RNA contributions in the Caenorhabditis elegans zygote. EMBO J. 33, 1740–1750 (2014). [DOI] [PMC free article] [PubMed] [Google Scholar]
- 38.Barucci G et al. Small RNA-mediated transgenerational silencing of histone genes impairs fertility in piRNA mutants. Nat. Cell Biol 22, (2020). [DOI] [PMC free article] [PubMed] [Google Scholar]
- 39.Spike CA, Bader J, Reinke V & Strome S DEPS-1 promotes P-granule assembly and RNA interference in C. elegans germ cells. Development 135, 983–993 (2008). [DOI] [PMC free article] [PubMed] [Google Scholar]
- 40.Collins T, Stone JR & Williams AJ All in the Family: the BTB/POZ, KRAB, and SCAN Domains. Mol. Cell. Biol 21, 3609–3615 (2001). [DOI] [PMC free article] [PubMed] [Google Scholar]
- 41.Stogios PJ & Privé GG The BACK domain in BTB-kelch proteins. Trends Biochem. Sci 29, 634–637 (2004). [DOI] [PubMed] [Google Scholar]
- 42.Kroschwald S, Maharana S & Simon A Hexanediol: a chemical probe to investigate the material properties of membrane-less compartments. Matters 1–7 (2017). doi: 10.19185/matters.201702000010 [DOI] [Google Scholar]
- 43.Marzahn MR et al. Higher-order oligomerization promotes localization of SPOP to liquid nuclear speckles . EMBO J. 35, 1254–1275 (2016). [DOI] [PMC free article] [PubMed] [Google Scholar]
- 44.Brangwynne CP et al. Germline P granules are liquid droplets that localize by controlled dissolution/condensation. Science (80-. ) 324, 1729–1732 (2009). [DOI] [PubMed] [Google Scholar]
- 45.Putnam A, Cassani M, Smith J & Seydoux G A gel phase promotes condensation of liquid P granules in Caenorhabditis elegans embryos. Nat. Struct. Mol. Biol 26, 220–226 (2019). [DOI] [PMC free article] [PubMed] [Google Scholar]
- 46.Wang J et al. A Molecular Grammar Governing the Driving Forces for Phase Separation of Prion-like RNA Binding Proteins. Cell 174, 688–699.e16 (2018). [DOI] [PMC free article] [PubMed] [Google Scholar]
- 47.Hanazawa M, Yonetani M & Sugimoto A PGL proteins self associate and bind RNPs to mediate germ granule assembly in C. elegans. J. Cell Biol 192, 929–937 (2011). [DOI] [PMC free article] [PubMed] [Google Scholar]
- 48.Kawasaki I et al. The PGL family proteins associate with germ granules and function redundantly in Caenorhabditis elegans germline development. Genetics 167, 645–661 (2004). [DOI] [PMC free article] [PubMed] [Google Scholar]
- 49.Kawasaki I et al. PGL-1, a predicted RNA-binding component of germ granules, is essential for fertility in C. elegans. Cell 94, 635–645 (1998). [DOI] [PubMed] [Google Scholar]
- 50.Kelleher JF et al. Myosin VI is required for asymmetric segregation of cellular components during C. elegans spermatogenesis. Curr. Biol 10, 1489–1496 (2000). [DOI] [PubMed] [Google Scholar]
- 51.Tabaczar S, Czogalla A, Podkalicka J, Biernatowska A & Sikorski AF Protein palmitoylation: Palmitoyltransferases and their specificity. Exp. Biol. Med 242, 1150–1157 (2017). [DOI] [PMC free article] [PubMed] [Google Scholar]
- 52.Gleason EJ, Lindsey WC, Kroft TL, Singson AW & L’Hernault SW Spe-10 encodes a DHHC-CRD zinc-finger membrane protein required for endoplasmic reticulum/golgi membrane morphogenesis during Caenorhabditis elegans spermatogenesis. Genetics 172, 145–158 (2006). [DOI] [PMC free article] [PubMed] [Google Scholar]
- 53.Gonzalo S & Linder ME SNAP-25 Palmitoylation and Plasma Membrane Targeting Require a Functional Secretory Pathway. Mol. Biol. Cell 9, 585–597 (1998). [DOI] [PMC free article] [PubMed] [Google Scholar]
- 54.Fukata Y, Bredt DS, Fukata M, Kittler JT & Moss SJ Protein Palmitoylation by DHHC Protein Family. in The Dynamic Synapse: Molecular Methods in Ionotropic Receptor Biology (2006). [PubMed] [Google Scholar]
- 55.Yao H et al. Inhibiting PD-L1 palmitoylation enhances T-cell immune responses against tumours. Nat. Biomed. Eng 3, 306–317 (2019). [DOI] [PubMed] [Google Scholar]
- 56.Wu H & Fuxreiter M The Structure and Dynamics of Higher-Order Assemblies: Amyloids, Signalosomes, and Granules. Cell 165, 1055–1066 (2016). [DOI] [PMC free article] [PubMed] [Google Scholar]
- 57.Conine CC et al. Argonautes promote male fertility and provide a paternal memory of germline gene expression in C. Elegans. Cell 155, 1532–1544 (2013). [DOI] [PMC free article] [PubMed] [Google Scholar]
- 58.Zhou L et al. BTBD18 Regulates a Subset of piRNA-Generating Loci through Transcription Elongation in Mice. Dev. Cell 40, 453–466.e5 (2017). [DOI] [PubMed] [Google Scholar]
- 59.Kleiman SE et al. Reduced Human Germ Cell-Less (HGCL) Expression in Azoospermic Men with Severe Germinal Cell Impairment. Journal of Andrology 24, 670–675 (2003). [DOI] [PubMed] [Google Scholar]
- 60.Gjerstorff MF et al. GAGE Cancer-Germline Antigens Are Recruited to the Nuclear Envelope by Germ Cell-Less (GCL). PLoS One 7, e45819 (2012). [DOI] [PMC free article] [PubMed] [Google Scholar]
METHOD REFERENCES
- 1.Brenner S The genetics of Caenorhabditis elegans. Genetics 77, 71–94 (1974). [DOI] [PMC free article] [PubMed] [Google Scholar]
- 2.Schweinsberg PJ & Grant BD C. elegans gene transformation by microparticle bombardment. in WormBook 1–10 (2013). doi: 10.1895/wormbook.1.166.1 [DOI] [PMC free article] [PubMed] [Google Scholar]
- 3.Haeussler M et al. Evaluation of off-target and on-target scoring algorithms and integration into the guide RNA selection tool CRISPOR. Genome Biol. 17, 148 (2016). [DOI] [PMC free article] [PubMed] [Google Scholar]
- 4.Chen B et al. Dynamic imaging of genomic loci in living human cells by an optimized CRISPR/Cas system. Cell 155, 1479–1491 (2013). [DOI] [PMC free article] [PubMed] [Google Scholar]
- 5.Chiu J, March PE, Lee R & Tillett D Site-directed, Ligase-Independent Mutagenesis (SLIM): a single-tube methodology approaching 100% efficiency in 4 h. Nucleic Acids Res. 32, (2004). [DOI] [PMC free article] [PubMed] [Google Scholar]
- 6.Chiu J, Tillett D, Dawes IW & March PE Site-directed, Ligase-Independent Mutagenesis (SLIM) for highly efficient mutagenesis of plasmids greater than 8kb. J. Microbiol. Methods 73, 195–198 (2008). [DOI] [PubMed] [Google Scholar]
- 7.Dickinson DJ, Ward JD, Reiner DJ & Goldstein B Engineering the Caenorhabditis elegans genome using Cas9-triggered homologous recombination. Nat. Methods 10, 1028–1034 (2013). [DOI] [PMC free article] [PubMed] [Google Scholar]
- 8.Dickinson DJ, Pani AM, Heppert JK, Higgins CD & Goldstein B Streamlined genome engineering with a self-excising drug selection cassette. Genetics 200, 1035–1049 (2015). [DOI] [PMC free article] [PubMed] [Google Scholar]
- 9.Ward JD Rapid and precise engineering of the caenorhabditis elegans genome with lethal mutation co-conversion and inactivation of NHEJ repair. Genetics 199, 363–377 (2014). [DOI] [PMC free article] [PubMed] [Google Scholar]
- 10.Frøkjær-Jensen C et al. Single-copy insertion of transgenes in Caenorhabditis elegans. Nat. Genet 40, 1375–1383 (2008). [DOI] [PMC free article] [PubMed] [Google Scholar]
- 11.Paix A et al. Scalable and versatile genome editing using linear DNAs with microhomology to Cas9 sites in Caenorhabditis elegans. Genetics 198, 1347–1356 (2014). [DOI] [PMC free article] [PubMed] [Google Scholar]
- 12.Paix A, Schmidt H & Seydoux G Cas9-assisted recombineering in C. elegans: Genome editing using in vivo assembly of linear DNAs. Nucleic Acids Res. 44, e128 (2016). [DOI] [PMC free article] [PubMed] [Google Scholar]
- 13.Arribere JA et al. Efficient marker-free recovery of custom genetic modifications with CRISPR/Cas9 in caenorhabditis elegans. Genetics 198, 837–846 (2014). [DOI] [PMC free article] [PubMed] [Google Scholar]
- 14.El Mouridi S et al. Reliable CRISPR/Cas9 genome engineering in Caenorhabditis elegans using a single efficient sgRNA and an easily recognizable phenotype. G3 Genes, Genomes, Genet 7, 1429–1437 (2017). [DOI] [PMC free article] [PubMed] [Google Scholar]
- 15.Klass MR & Hirsh D Sperm isolation and biochemical analysis of the major sperm protein from Caenorhabditis elegans. Dev. Biol 84, 299–312 (1981). [DOI] [PubMed] [Google Scholar]
- 16.Shevchenko A, Tomas H, Havliš J, Olsen JV & Mann M In-gel digestion for mass spectrometric characterization of proteins and proteomes. Nat. Protoc 1, 2856–2860 (2007). [DOI] [PubMed] [Google Scholar]
- 17.Kappei D et al. HOT1 is a mammalian direct telomere repeat-binding protein contributing to telomerase recruitment. EMBO J. 32, 1681–1701 (2013). [DOI] [PMC free article] [PubMed] [Google Scholar]
- 18.Rappsilber J, Mann M & Ishihama Y Protocol for micro-purification, enrichment, pre-fractionation and storage of peptides for proteomics using StageTips. Nat. Protoc 2, 1896–1906 (2007). [DOI] [PubMed] [Google Scholar]
- 19.Bluhm A, Casas-Vila N, Scheibe M & Butter F Reader interactome of epigenetic histone marks in birds. Proteomics 16, 427–436 (2016). [DOI] [PubMed] [Google Scholar]
- 20.Cox J & Mann M MaxQuant enables high peptide identification rates, individualized p.p.b.-range mass accuracies and proteome-wide protein quantification. Nat. Biotechnol 26, 1367–1372 (2008). [DOI] [PubMed] [Google Scholar]
- 21.Martin M Cutadapt removes adapter sequences from high-throughput sequencing reads. EMBnet.journal 17, 10 (2011). [Google Scholar]
- 22.Langmead B, Trapnell C, Pop M & Salzberg SL Ultrafast and memory-efficient alignment of short DNA sequences to the human genome. Genome Biol. 10, (2009). [DOI] [PMC free article] [PubMed] [Google Scholar]
- 23.Quinlan AR & Hall IM BEDTools: A flexible suite of utilities for comparing genomic features. Bioinformatics 26, 841–842 (2010). [DOI] [PMC free article] [PubMed] [Google Scholar]
- 24.Li H et al. The Sequence Alignment/Map format and SAMtools. Bioinformatics 25, 2078–2079 (2009). [DOI] [PMC free article] [PubMed] [Google Scholar]
- 25.Anders S, Pyl PT & Huber W HTSeq-A Python framework to work with high-throughput sequencing data. Bioinformatics 31, 166–169 (2015). [DOI] [PMC free article] [PubMed] [Google Scholar]
- 26.Claycomb JM et al. The Argonaute CSR-1 and Its 22G-RNA Cofactors Are Required for Holocentric Chromosome Segregation. Cell 139, 123–134 (2009). [DOI] [PMC free article] [PubMed] [Google Scholar]
- 27.Phillips CM et al. MUT-14 and SMUT-1 DEAD box RNA helicases have overlapping roles in germline RNAi and endogenous siRNA formation. Curr. Biol 24, 839–844 (2014). [DOI] [PMC free article] [PubMed] [Google Scholar]
- 28.Stoeckius M, Grün D & Rajewsky N Paternal RNA contributions in the Caenorhabditis elegans zygote. EMBO J. 33, 1740–1750 (2014). [DOI] [PMC free article] [PubMed] [Google Scholar]
- 29.Ortiz MA, Noble D, Sorokin EP & Kimble J A New Dataset of Spermatogenic vs . Oogenic Transcriptomes in the Nematode Caenorhabditis elegans. G3 Genes, Genomes, Genet. 4, 1765–1772 (2014). [DOI] [PMC free article] [PubMed] [Google Scholar]
- 30.Ramírez F, Dündar F, Diehl S, Grüning BA & Manke T DeepTools: A flexible platform for exploring deep-sequencing data. Nucleic Acids Res. 42, 187–191 (2014). [DOI] [PMC free article] [PubMed] [Google Scholar]
- 31.Koulouras G et al. EasyFRAP-web: A web-based tool for the analysis of fluorescence recovery after photobleaching data. Nucleic Acids Res. 46, W467–W472 (2018). [DOI] [PMC free article] [PubMed] [Google Scholar]
- 32.Gleason EJ et al. Developmental Genetics of Secretory Vesicle Acidification During Caenorhabditis elegans Spermatogenesis. Genetics 191, 477–491 (2012). [DOI] [PMC free article] [PubMed] [Google Scholar]
- 33.Kukulski W et al. Correlated fluorescence and 3D electron microscopy with high sensitivity and spatial precision. J. Cell Biol 192, 111–119 (2011). [DOI] [PMC free article] [PubMed] [Google Scholar]
- 34.Kremer JR, Mastronarde DN & McIntosh JR Computer Visualization of Three-Dimensional Image Data Using IMOD. J. Struct. Biol 116, 71–76 (1996). [DOI] [PubMed] [Google Scholar]
- 35.Paul-Gilloteaux P et al. eC-CLEM: flexible multidimensional registration software for correlative microscopies. Nat. Methods 14, 102–103 (2017). [DOI] [PubMed] [Google Scholar]
- 36.de Chaumont F et al. Icy: an open bioimage informatics platform for extended reproducible research. Nat. Methods 9, 690–696 (2012). [DOI] [PubMed] [Google Scholar]
- 37.Perez-Riverol Y et al. The PRIDE database and related tools and resources in 2019: Improving support for quantification data. Nucleic Acids Res. 47, D442–D450 (2019). [DOI] [PMC free article] [PubMed] [Google Scholar]
Associated Data
This section collects any data citations, data availability statements, or supplementary materials included in this article.
Supplementary Materials
Supplementary Video 1 Time sequence of an isolated, male-derived spermatocyte expressing GFP::3xFLAG::WAGO-3 as shown in Extended Data Fig. 6e. Images are confocal maximum intensity projections. Scale bar: 4 μm.
Supplementary Video 2 Time sequence of an isolated, male-derived spermatocyte expressing GFP::3xFLAG::WAGO-3 in absence of SPE-10. Images are confocal maximum intensity projections. Scale bar: 4 μm.
Supplementary Table 1: List of C. elegans strains used in this study.
Supplementary Table 2: List of sgRNA sequences used in this study.
Supplementary Table 3: List of DNA donor templates used in this study.
Data Availability Statement
All code developed for this analysis is available via https://github.com/Tunphie/SequencingTools/blob/main/smRNA_TypeCounter.py and https://github.com/Tunphie/SequencingTools/blob/main/CoverageOnProteinCodingGenes.py.
The accession number for the smRNA-seq data generated in this study is PRJNA629991. The mass spectrometry proteomics data have been deposited to the ProteomeXchange Consortium via the PRIDE 37 partner repository with the dataset identifier PXD019099. Supplemental BigDataViewer supporting the CLEM analyses is available online: Mendeley Data, V1, doi: 10.17632/dgb8d7h2hz.1 (https://data.mendeley.com/datasets/dgb8d7h2hz/1). Source data are provided with this study. All other data supporting the findings of this study are available from the corresponding author on reasonable request.


