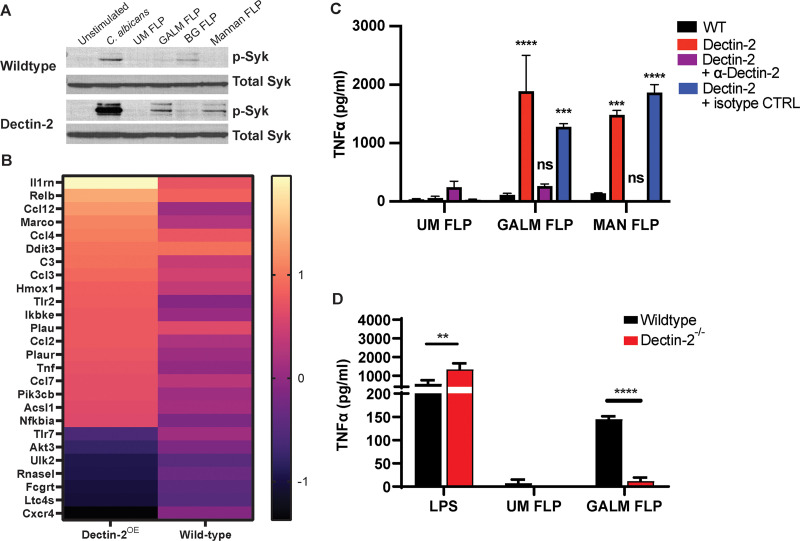
FIG 3.
Galactomannan FLPs activate Dectin-2-dependent signaling in macrophages. (A) Immunoblot of immortalized wild-type C57BL/6 macrophages or C57BL/6 macrophages expressing Dectin-2 stimulated with live C. albicans (SC5314), unmodified FLPs (UM FLP), galactomannan FLPs (GALM FLP), β-1,3 glucan FLPs (BG FLP), or mannan FLPs at an MOI of 10:1 for 1 h at 37°C and probed for both total Syk and phosphorylated (active) Syk. Overexpression of Dectin-2 increased phosphorylation of Syk in response to C. albicans, galactomannan and mannan FLPs, but not to unmodified or β-1,3 glucan FLPs. (B) Heatmap displaying the genes differentially expressed in Dectin-2OE macrophages stimulated with GALM-FLP compared with unstimulated. The heatmap depicts the log2 fold change in Dectin-2OE cells and wild-type cells demonstrating a higher degree of change for most genes in the Dectin-2OE cells compared to those of the WT. (C) Immortalized wild-type C57BL/6 macrophages or C57BL/6 macrophages expressing Dectin-2 were stimulated overnight with unmodified (UM), galactomannan (GALM), or mannan (MAN) FLPs at a target to effector ratio of 10:1. Prior to FLP stimulation, macrophages were pretreated for 30 min with either a Dectin-2-neutralizing antibody or an isotype control antibody as indicated. Supernatants were analyzed for TNF-α using ELISA. Both galactomannan and mannan FLPs induced robust TNF-α production by macrophages expressing Dectin-2, which was blocked by Dectin-2-neutralizing antibody but not the isotype control. The significance indicated is in relation to the wild-type cell stimulated with the same FLPs. (D) BMDMs from wild-type C57BL/6 and Dectin-2−/− mice were stimulated with LPS (500 ng/mL), and unmodified (UM) or galactomannan (GALM) FLPs at an effector to target ration of 20:1 for 18 h. Supernatants were analyzed for TNF-α using ELISA. Dectin-2−/− BMDM produced less TNF-α when stimulated with galactomannan FLP compared with wild-type BMDM. Error bars represent standard error of three biological replicates, statistics were calculated with two-way analysis of variance (ANOVA) using PRISM 9 software (not significant, ns; ***, P < 0.001; ****, P < 0.0001).

