

Abstract
Purpose:
To evaluate the accuracy of T2-based whole-brain oxygen extraction fraction (OEF) estimation by comparing it with gold standard 15O-PET measurements.
Methods:
Sixteen healthy adult subjects underwent MRI and 15O-PET OEF measurements on the same day. On MRI, whole-brain OEF was quantified by T2-relaxation-under-spin-tagging (TRUST) MRI, based on subject-specific hematocrit. The TRUST OEF was compared to the whole-brain averaged OEF produced by 15O-PET. Agreement between TRUST and 15O-PET whole-brain OEF measurements was examined in terms of intraclass correlation coefficient (ICC) and in absolute OEF values. In a subset of ten subjects, test-retest reproducibility of whole-brain OEF was also evaluated and compared between the two modalities.
Results:
Across the 16 subjects, the mean whole-brain OEF of TRUST and 15O-PET were 36.44±4.07% and 36.45±3.65%, respectively, showing no difference between the two modalities (P=0.99). TRUST whole-brain OEF strongly correlated with that of 15O-PET (N=16, ICC=0.90, P=4×10⁻⁷). The coefficient-of-variation of TRUST and 15O-PET whole-brain OEF measurements were 1.79±0.67% and 2.06±1.55%, respectively, showing no difference between the two modalities (N=10, P=0.64). Further analyses on the effect of hematocrit revealed that correlation between PET OEF and TRUST OEF with assumed hematocrit remained significant (ICC=0.8, P<2×10⁻⁵).
Conclusion:
Whole-brain OEF measured by TRUST was in excellent agreement with gold standard 15O-PET, with highly comparable accuracy and reproducibility. These findings suggest that TRUST MRI can provide accurate quantification of whole-brain OEF non-invasively.
Keywords: oxygen extraction fraction, 15O PET, TRUST, venous oxygenation, oxygen saturation fraction, reproducibility
1. INTRODUCTION
Cerebral oxygen extraction fraction (OEF) is a potential biomarker in a variety of diseases, such as Alzheimer’s disease (1,2), cerebrovascular diseases (3–8), multiple sclerosis (9), and sickle cell anemia (3,10–12). The current gold-standard for image-based OEF quantification inside the human brain is positron emission tomography (PET) with three different 15O-labeled radiotracers (13), including 15O-labeled carbon monoxide (C15O) to estimate cerebral blood volume (CBV), 15O-labeled water (H215O) to measure cerebral blood flow (CBF), and 15O-labeled oxygen (15O2) to measure oxygen utilization. OEF is computed from the three in combination (13). In addition, arterial blood samples need to be collected during the PET scan, in order to provide an arterial input function for quantification. Although the 15O-PET method is accurate, well-validated and useful (4,5,7,8,14), it is logistically quite challenging, requiring onsite production of the 15O isotope (half-life = 122s), and is therefore available only at a handful of highly specialized research centers.
With the advances of MRI, a variety of MRI-based methods have been proposed to measure OEF non-invasively, by utilizing the association between blood oxygenation and MRI properties such as T2 (15–20) and susceptibility (21–26), or by exploiting gas-challenges (27,28). Among these techniques, some provide a whole-brain or global estimation of cerebral OEF (15,16,20,21), while some can measure regional OEF (17–19,22–28). Many of these MRI-based methods have found clinical utility in various diseases (1–3,6,9,29,30). However, few studies have validated MRI-based OEF estimations with gold standard 15O-PET (31), which would be important to ensure the accuracy of these methods and facilitate their broader clinical applications.
T2-relaxation-under-spin-tagging (TRUST) is a widely used MRI technique to measure whole-brain OEF based on the relationship between blood T2 and oxygenation (15,32,33). The advantages of TRUST include its relatively short scan time (1.2min), excellent reproducibility (34), and scalability across multiple sites (35) and across different vendors (36). The results of TRUST blood oxygenation measurement has been previously compared with pulse oximetry (33), in arterial vessels under a special condition of hypoxia. To conduct a general validation under typical physiological conditions, the present work aims to compare the TRUST whole-brain OEF estimation to gold standard 15O-PET measurements.
2. METHODS
2.1. Participants
The study protocol was approved by the Institutional Review Board of The University of Texas Health Science Center at San Antonio (IRB number: HSC20170187H). The radioactive contrast agents used in this study were approved by Radioactive Drug Research Committee and Investigational New Drug Application (IND number: 039789). Written informed consent was obtained from each subject before participating in the study.
Sixteen healthy adult subjects (8 males and 8 females, 27.5±5.0 years old) participated in this study. Each subject was scanned on an MRI and a PET scanner on the same day. The two scanners were physically adjacent to each other (less than 30 meters). Procedures performed on each subject are illustrated in Figure 1. A break of 15 min was given between the MRI and PET experiment.
Figure 1.

Illustration of the experimental design. Each subject was scanned on an MRI and a PET scanner on the same day. (A) Scan orders of the MRI experiment. (B) Procedures performed during the PET experiment. All 16 subjects completed the first 15O session, while a subset of 10 subjects also completed the second 15O session. (C) Detailed steps of the 15O scan session during the PET experiment.
The hematocrit level of each subject was measured from venous blood samples obtained before the PET experiment.
2.2. MRI Experiment
All MRI experiments were performed on a Siemens 3T system (Trio, Siemens Healthcare, Erlangen, Germany), using a body coil for transmission and a 12-channel head coil for receiving. Foam padding was placed around the subject’s head to minimize motion during the scans.
The MRI scans performed on each subject are shown in Figure 1A. Each subject first underwent an anatomical T1-weighted Magnetization-Prepared-RApid-Gradient-Echo (MPRAGE) scan, with the following parameters: sagittal imaging plane, FOV = 256 (readout, foot-head) × 224 (phase-encoding, anterior-posterior) × 176 (slice, left-right) mm3; voxel size = 1.0×1.0×1.0 mm3; TR = 2.1 s; TE = 4.2 ms; echo-spacing = 9.4 ms; TI = 1.1 s; and scan duration = 4.3 min.
Next, three TRUST scans were acquired to obtain whole-brain venous oxygenation (Yv) and also to evaluate its reproducibility. The TRUST MRI sequence has been detailed previously (15,32). Briefly, this technique uses spin labeling principle to isolate pure venous signals in the superior sagittal sinus (SSS). Then, a series of non-selective T2-preparation pulses are applied to modulate the T2-weighting, from which venous blood T2 is estimated. Finally, the venous blood T2 is converted to Yv based on a well-established calibration plot (33). The imaging parameters of TRUST were: transverse imaging plane, single-slice, FOV = 220×220×5 mm3; voxel size = 3.44×3.44×5 mm3; TR = 3 s; TE = 3.8 ms; TI = 1.02 s; labeling slab thickness = 100 mm, gap = 22.5 mm; four effective TEs (eTEs): 0, 40, 80 and 160 ms; and scan duration = 1.2 min. During the TRUST scans, the arterial oxygenation level (Ya) of each subject was measured using a pulse oximeter (Invivo 4500, Invivo, Gainesville, FL) attached to a finger. Whole-brain OEF was computed based on the Ya and Yv values (see MRI Data Processing subsection for details).
2.3. PET Experiment
The PET data were acquired on a CTI ECAT HR+ scanner (Siemens, Knoxville, TN). A thermoplastic facial mask was used to restrain the head motion during the scans. The 15O-labeled radiotracers were produced by an on-site cyclotron (MC-17, Scanditronix Magnet AB, Vislanda, Sweden).
The PET procedures performed on each subject are displayed in Figure 1B. Before the PET scans, an arterial catheter was placed in the radial artery of one arm based on the result of Allen’s test; while an antecubital venous catheter was placed in the contralateral arm. Additionally, a transmission scan was performed for attenuation correction.
Subsequently, two sessions of 15O PET scans were performed to quantify PET-based OEF. Each 15O PET session consisted of three PET scans with different radiotracers: C15O, H215O, and 15O2, providing a complete dataset of CBV, CBF and OEF. All of the 16 subjects completed the first 15O PET session. A subset of 10 subjects (5 males and 5 females, 26.1±4.3 years old) also completed the second 15O PET session, which allowed us to evaluate the reproducibility of PET-based OEF measurements relative to that of MRI.
Figure 1C illustrates the components of each 15O PET session. For the C15O PET scan, after a bolus inhalation of C15O gas, we waited for 2 min to allow uniform tracer distribution in the vascular compartment. Then, two frames of 3D emission scans were acquired, the first with 180 s duration and the second with 300 s duration. Fifteen arterial blood samples (about 1 mL each) were collected every 30 s during the C15O scan for normalization and quantification purposes.
For the H215O and 15O2 PET scans, after a bolus intravenous injection of H215O or inhalation of 15O2 gas, 37 frames of 3D dynamic emission scans were acquired. The first 25 frames were acquired with 3 s duration, while the rest of 12 frames were acquired with 10 s duration. During each of the H215O and 15O2 PET scans, 30 arterial blood samples (about 1 mL each) were collected from the radial artery to determine the arterial input function. The first 28 arterial blood samples were collected every 5 s, while the last two were collected with an interval of 30 s.
The dosage of each 15O-labeled radiotracer administration was 50±5 mCi. We had an interval of 10–20 minutes between consecutive 15O PET scans to allow for radioactive decay (note: half-life of 15O is 122 s), radiation counting of the blood samples and preparation of the next radiotracer. The total duration of one 15O PET session was 45 min to 1 h.
2.4. MRI Data Processing
The TRUST MRI data processing followed established procedures (15). Briefly, after motion correction, pairwise subtraction between labeled and control images yielded difference images in which the static tissue signals were canceled out, leaving pure venous blood signals in the SSS. A preliminary region-of-interest (ROI) surrounding the SSS was manually drawn, and the 4 voxels with the highest signal intensities inside the preliminary ROI were selected as the final mask. Venous blood signals in the final mask were spatially averaged and fitted monoexponentially as a function of eTEs. The decay rate of the monoexponential function gave the blood T2, which was then converted to Yv via established calibration plots, based on the subject-specific measured hematocrit level (33).
Then, the TRUST whole-brain OEF was calculated as:
| [1] |
where Ya was measured by pulse oximetry during the TRUST MRI scans.
2.5. PET Data Processing
All PET images were reconstructed via Filter Back Projection with a 3 mm full-width-at-half-maximum, resulting in a matrix size of 128×128×63 and a voxel size of 2×2×2.4 mm3.
The computation of CBV and CBF maps from the 15O-PET data followed established procedures in the literature (13,37–39). The brain tissue density was assumed to be 1.05g/ml (13). The PET OEF map was then calculated as (13):
| [2] |
where PETobs is the observed decay corrected tissue activity, estimated from the 15O2 PET images; and are the time-dependent concentration of H215O and 15O2 in the arterial blood, respectively, and were estimated from the total 15O radiation counting using the physiological model proposed by Iida et al. (37); R is the small vessel to large vessel hematocrit ratio and was assumed to be 0.85 (13); the factor 0.835 indicates “effective venous fraction” which is the ratio between venous blood volume and total blood volume; λ is the brain:blood partition coefficient for water and was assumed to be 0.9mL/g (40); t1 and t2 are the start and stop times of the 15O2 PET image time series used for modelling (41).
A whole brain mask was obtained from segmentation of the MPRAGE MRI images and then registered to the PET image space using a six-parameter rigid body transformation (42), with manual adjustment to correct for any registration errors. The whole-brain OEF of PET, OEFPET, was calculated as the mean OEF of all non-zero voxels inside the whole brain mask.
PET and MRI data were processed by two different investigators, respectively, and each was blinded to the results of the other modality.
2.6. Statistical Analysis
To evaluate the accuracy of TRUST OEF measurements, the average of the three TRUST OEF results was compared to PET whole-brain OEF of the first session. A paired Student’s t-test was used to examine whether there was a systematic difference between TRUST and PET OEF values. Consistency between TRUST and PET OEF was evaluated by intraclass correlation coefficient (ICC) based on a single-rating 2-way mixed-effects model (43,44). Bland-Altman analysis was also used to examine the difference between TRUST and PET.
To examine the test-retest reproducibility of each modality, in the subset of 10 subjects who had two 15O PET sessions, we calculated the coefficient-of-variation (CoV) for TRUST and PET OEF measures. The CoV values were compared across modality using a paired t-test.
A two-tailed P<0.05 was considered statistically significant.
RESULTS
Figure 2 presents the TRUST and PET data of a representative subject. For TRUST, strong venous blood signal in the SSS can be seen in the difference images and decaying as a function of eTEs. The TRUST whole-brain OEF agrees well with the PET whole-brain OEF. The PET OEF map appears noisy, but is typical for an unsmoothed image when compared to those in the literature (45).
Figure 2.
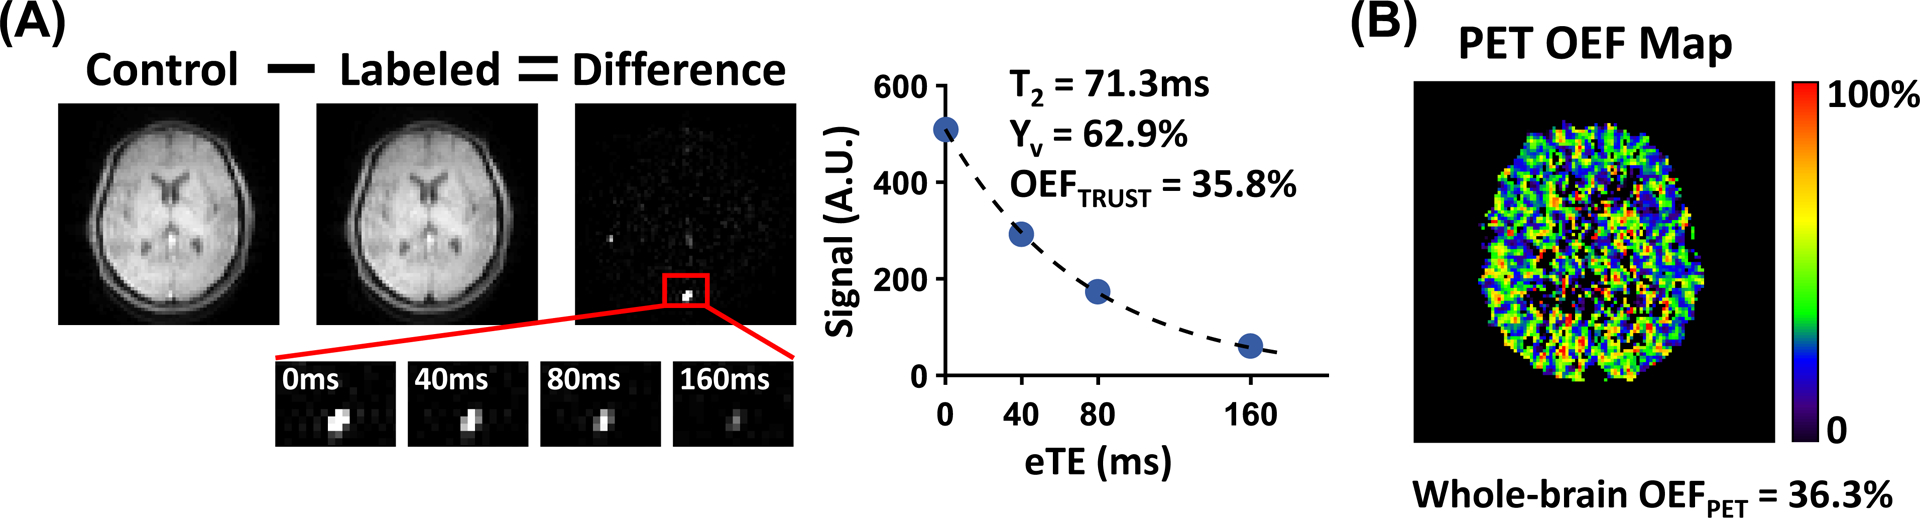
TRUST and PET data of a representative subject. (A) For TRUST, subtraction between control and labeled images yields strong venous blood signal in the SSS (red box). Control and labeled images are only shown for eTE=0ms, while zoom-in views of difference images are shown for all four eTEs. The plot shows averaged blood signal as a function of eTEs. The resulting blood T2, Yv and TRUST OEF in this subject are also shown. (B) PET OEF map of the same subject. The whole-brain averaged PET OEF is shown at the bottom.
Table 1 summarizes the data from all subjects. Across the 16 subjects, the mean whole-brain OEF measured by TRUST and PET (first session) were 36.44±4.07% and 36.45±3.65%, respectively, which agreed well with previous literature of TRUST (33,34,46) and 15O-PET (47,48). Paired t-test revealed no differences between TRUST and PET whole-brain OEF values (N=16, P=0.99).
Table 1.
Summary of data from the subjects (N=16).
| Parameter | Hematocrit | Ya | Yv,TRUST | OEFTRUST | OEFPET |
|---|---|---|---|---|---|
| Value (%) | 40.59±3.85 | 98.27±0.87 | 62.46±4.13 | 36.44±4.07 | 36.45±3.65 |
Ya: arterial oxygenation; Yv,TRUST: venous oxygenation measured by TRUST; OEFTRUST: whole-brain oxygen extraction fraction measured by TRUST; OEFPET: whole-brain oxygen extraction fraction measured by 15O-PET.
Figure 3A displays a scatter plot between whole-brain OEF values measured by TRUST and PET, showing a strong correlation (N=16, ICC=0.90 with 95% C.I. [0.74, 0.96], P=4×10⁻⁷). Figure 3B shows a Bland-Altman plot comparing TRUST and PET whole-brain OEF values, also demonstrating good agreement between the two modalities.
Figure 3.

Comparison between TRUST and PET whole-brain OEF measurements. (A) Scatter plot between whole-brain OEF measured by PET and TRUST MRI. Each dot represents data from one subject. The dashed line indicates the fitted linear regression line. (B) Bland-Altman plot comparing whole-brain OEF measured by TRUST and PET. The solid line represents the mean OEF difference between TRUST and PET. The dashed lines indicate the 95% confidence interval. Subject-specific hematocrit was used in TRUST MRI processing.
In the subset of 10 subjects who had two PET sessions, the CoVs of TRUST and PET whole-brain OEF measurements were 1.79±0.67% and 2.06±1.55%, respectively, showing no difference between the two modalities (N=10, P=0.64). The CoV values reported in the present study are slightly lower than previous literature which reported a CoV of 3.19±1.20% for TRUST (34) and 4.6±3.5% for PET OEF measurements (49).
In the abovementioned correlation analyses between TRUST and PET, the calibration from blood T2 to oxygenation in TRUST MRI used subject-specific hematocrit levels measured through a blood draw. In many studies, however, hematocrit is not measured thus needs to be assumed (2,17,20,23–25,50). Therefore, we also tested the role of hematocrit in the OEF estimation with TRUST MRI. We re-analyzed the data by using two common strategies when making assumptions on the hematocrit. One is to assume different hematocrit levels for males and females (i.e. 0.42 for males and 0.40 for females) (2,25). The other is to assume a fixed hematocrit of 0.41 for all subjects (17,20,23,24). As shown in Supporting Information Figure S1, the correlation between PET OEF and TRUST OEF with assumed hematocrit remained significant (ICC=0.8, P<2×10⁻⁵ for both strategies), although the correlations were slightly weaker than that using subject-specific hematocrit. Paired t-tests also found no significant differences between PET and TRUST OEF using assumed hematocrit (P>0.27 for both strategies). These results suggest that when subject-specific hematocrit is unavailable, TRUST OEF using assumed hematocrit still has good accuracy.
DISCUSSION
This work presents the first in vivo comparison between T2-based MR oximetry and gold standard 15O-PET method. We demonstrated that whole-brain OEF measured by TRUST was in excellent agreement with that measured by 15O-PET, both in terms of correlation and in absolute OEF values. In addition, test-retest reproducibility was also similar between the two modalities.
OEF is an important index of the homeostasis of the brain’s oxygen metabolism, and has found clinical utility in a variety of diseases. For example, in cerebral arterial occlusive diseases, it is known that higher OEF predicts higher risk for stroke (4,5,7,8). Diminished OEF was reported in patients with mild cognitive impairment (1) and multiple sclerosis (9), while increased OEF was demonstrated in patients with moyamoya disease (3,14), systemic lupus erythematosus (29), hepatic encephalopathy (51), or end-stage renal disease (52). Traditionally, 15O-PET is the method of choice to investigate brain OEF abnormalities (4,5,7,8,14). However, broader clinical applications of the 15O-PET method have been hampered by its complexity and radiation exposure.
Over the past decade, several MRI-based techniques have been developed to measure cerebral OEF in a non-invasive and radiation-free manner (15–28). However, partly attributed to the limited availability of 15O-PET, few studies have been conducted to validate the accuracy of MR-based oximetry by direct comparison with 15O-PET. One study by Kudo et al. compared OEF measured by quantitative susceptibility mapping (QSM) MRI with that measured by 15O-PET in patients with chronic cerebral arterial stenosis or occlusion (31). They showed a significant correlation of relative OEF ratio (affected hemisphere / contralateral hemisphere) between QSM and 15O-PET (31). However, in terms of absolute OEF quantification, QSM OEF was significantly higher (by 7–8 units) than that measured by 15O-PET. This significant difference may be attributed to partial voluming effects in the QSM method or to the fact their MRI and PET scans were acquired on different days. In the present work, all MRI and PET scans were performed on the same day within a short interval, which is expected to reduce confounding factors associated with day-to-day fluctuations in brain physiology.
We note that T2-based MR oximetry such as TRUST relies on the association between blood T2 and oxygenation. While this relationship is generally well-understood (53), different calibration models have been proposed to convert blood T2 to oxygenation (10,11,33,54,55). In this work of healthy adults, we used a bovine blood model proposed by Lu et al. (33), which seems to have provided results in excellent agreement with the PET data. Bovine blood has similar characteristics as human blood. Bovine and human hemoglobin both have two α polypeptide chains and two β chains, and both erythrocytes have a biconcave shape of similar diameters (5–6μm for bovine, ~7μm for human) (56,57). While reports have shown T2 variations when using blood of different species (10,33,54), some of them may be attributed to experimental conditions such as blood preparation procedure (circulating blood versus static blood), pulse sequence (turbo-field-echo-T2 versus conventional T2), and width of the T2-preparation RF pulses. A study directly comparing blood types while ensuring other experimental conditions constant is needed to further elucidate this issue. Therefore, for adult populations with typical erythrocytes and normal-range hematocrits, the bovine blood model used appears appropriate. For patient populations with atypical red blood cells, such as patients with sickle cell disease or neonatal patients, other calibration models should be carefully chosen (10,11,54,55).
There are a few limitations of the present study. First, the comparisons between TRUST and 15O-PET were performed on healthy adult volunteers at resting state. Further validations should compare MRI and 15O-PET oximetry under different physiological (e.g. after intake of caffeine or acetazolamide) or pathological conditions (e.g. in multiple sclerosis). Second, the OEF measurement provided by TRUST MRI is whole-brain only, lacking spatial information. Thus, although 15O-PET actually provides spatial maps of OEF, we only compared its whole-brain averaged OEF value with TRUST. However, we emphasize that TRUST only takes 1.2 min while the 15O-PET method takes 45min to 1h to measure OEF. As region-specific OEF techniques are being developed in the MRI field (17–19,22–28), future work should evaluate the accuracy of these regional techniques by comparing them with gold standard 15O-PET in different brain regions.
CONCLUSION
In this work, we demonstrated that whole-brain OEF measured by TRUST was strongly correlated with that measured by gold standard 15O-PET, with highly comparable accuracy and reproducibility. These findings suggest that TRUST MRI can provide accurate quantification of whole-brain OEF non-invasively.
Supplementary Material
Supporting Information Figure S1: Correlation between TRUST and PET whole-brain OEF measurements, when using assumed hematocrit for TRUST. (A) Hematocrit was assumed to be 0.42 for males and 0.40 for females. (B) Hematocrit was assumed to be 0.41 for all subjects. Dashed lines indicate the fitted linear regression lines.
Grant Sponsors:
National Institutes of Health, R01 MH084021, R01 NS106711, R01 NS106702, R01 AG047972, R21 NS095342, R21 NS085634, P41 EB015909, and S10 OD021648.
REFERENCES
- 1.Thomas BP, Sheng M, Tseng BY, Tarumi T, Martin-Cook K, Womack KB, Cullum MC, Levine BD, Zhang R, Lu H. Reduced global brain metabolism but maintained vascular function in amnestic mild cognitive impairment. J Cereb Blood Flow Metab 2017;37:1508–1516. [DOI] [PMC free article] [PubMed] [Google Scholar]
- 2.Lin Z, Sur S, Soldan A et al. Brain Oxygen Extraction by Using MRI in Older Individuals: Relationship to Apolipoprotein E Genotype and Amyloid Burden. Radiology 2019;292:140–148. [DOI] [PMC free article] [PubMed] [Google Scholar]
- 3.Watchmaker JM, Juttukonda MR, Davis LT et al. Hemodynamic mechanisms underlying elevated oxygen extraction fraction (OEF) in moyamoya and sickle cell anemia patients. J Cereb Blood Flow Metab 2018;38:1618–1630. [DOI] [PMC free article] [PubMed] [Google Scholar]
- 4.Grubb RL Jr., Derdeyn CP, Fritsch SM, Carpenter DA, Yundt KD, Videen TO, Spitznagel EL, Powers WJ. Importance of hemodynamic factors in the prognosis of symptomatic carotid occlusion. JAMA 1998;280:1055–1060. [DOI] [PubMed] [Google Scholar]
- 5.Yamauchi H, Fukuyama H, Nagahama Y, Nabatame H, Nakamura K, Yamamoto Y, Yonekura Y, Konishi J, Kimura J. Evidence of misery perfusion and risk for recurrent stroke in major cerebral arterial occlusive diseases from PET. J Neurol Neurosurg Psychiatry 1996;61:18–25. [DOI] [PMC free article] [PubMed] [Google Scholar]
- 6.Fan AP, Khalil AA, Fiebach JB, Zaharchuk G, Villringer A, Villringer K, Gauthier CJ. Elevated brain oxygen extraction fraction measured by MRI susceptibility relates to perfusion status in acute ischemic stroke. J Cereb Blood Flow Metab 2020;40:539–551. [DOI] [PMC free article] [PubMed] [Google Scholar]
- 7.Derdeyn CP, Videen TO, Grubb RL Jr., Powers WJ. Comparison of PET oxygen extraction fraction methods for the prediction of stroke risk. J Nucl Med 2001;42:1195–1197. [PubMed] [Google Scholar]
- 8.Derdeyn CP, Videen TO, Yundt KD, Fritsch SM, Carpenter DA, Grubb RL, Powers WJ. Variability of cerebral blood volume and oxygen extraction: stages of cerebral haemodynamic impairment revisited. Brain 2002;125:595–607. [DOI] [PubMed] [Google Scholar]
- 9.Ge Y, Zhang Z, Lu H, Tang L, Jaggi H, Herbert J, Babb JS, Rusinek H, Grossman RI. Characterizing brain oxygen metabolism in patients with multiple sclerosis with T2-relaxation-under-spin-tagging MRI. J Cereb Blood Flow Metab 2012;32:403–412. [DOI] [PMC free article] [PubMed] [Google Scholar]
- 10.Li W, Xu X, Liu P, Strouse JJ, Casella JF, Lu H, van Zijl PCM, Qin Q. Quantification of whole-brain oxygenation extraction fraction and cerebral metabolic rate of oxygen consumption in adults with sickle cell anemia using individual T2 -based oxygenation calibrations. Magn Reson Med 2020;83:1066–1080. [DOI] [PMC free article] [PubMed] [Google Scholar]
- 11.Bush AM, Coates TD, Wood JC. Diminished cerebral oxygen extraction and metabolic rate in sickle cell disease using T2 relaxation under spin tagging MRI. Magn Reson Med 2018;80:294–303. [DOI] [PMC free article] [PubMed] [Google Scholar]
- 12.Jordan LC, Gindville MC, Scott AO et al. Non-invasive imaging of oxygen extraction fraction in adults with sickle cell anaemia. Brain 2016;139:738–750. [DOI] [PMC free article] [PubMed] [Google Scholar]
- 13.Mintun MA, Raichle ME, Martin WR, Herscovitch P. Brain oxygen utilization measured with O-15 radiotracers and positron emission tomography. J Nucl Med 1984;25:177–187. [PubMed] [Google Scholar]
- 14.Ikezaki K, Matsushima T, Kuwabara Y, Suzuki SO, Nomura T, Fukui M. Cerebral circulation and oxygen metabolism in childhood moyamoya disease: a perioperative positron emission tomography study. J Neurosurg 1994;81:843–850. [DOI] [PubMed] [Google Scholar]
- 15.Lu H, Ge Y. Quantitative evaluation of oxygenation in venous vessels using T2-Relaxation-Under-Spin-Tagging MRI. Magn Reson Med 2008;60:357–363. [DOI] [PMC free article] [PubMed] [Google Scholar]
- 16.Oja JM, Gillen JS, Kauppinen RA, Kraut M, van Zijl PC. Determination of oxygen extraction ratios by magnetic resonance imaging. J Cereb Blood Flow Metab 1999;19:1289–1295. [DOI] [PubMed] [Google Scholar]
- 17.Guo J, Wong EC. Venous oxygenation mapping using velocity-selective excitation and arterial nulling. Magn Reson Med 2012;68:1458–1471. [DOI] [PMC free article] [PubMed] [Google Scholar]
- 18.Bolar DS, Rosen BR, Sorensen AG, Adalsteinsson E. QUantitative Imaging of eXtraction of oxygen and TIssue consumption (QUIXOTIC) using venular-targeted velocity-selective spin labeling. Magn Reson Med 2011;66:1550–1562. [DOI] [PMC free article] [PubMed] [Google Scholar]
- 19.Krishnamurthy LC, Liu P, Ge Y, Lu H. Vessel-specific quantification of blood oxygenation with T2-relaxation-under-phase-contrast MRI. Magn Reson Med 2014;71:978–989. [DOI] [PMC free article] [PubMed] [Google Scholar]
- 20.Jain V, Magland J, Langham M, Wehrli FW. High temporal resolution in vivo blood oximetry via projection-based T2 measurement. Magn Reson Med 2013;70:785–790. [DOI] [PMC free article] [PubMed] [Google Scholar]
- 21.Jain V, Langham MC, Wehrli FW. MRI estimation of global brain oxygen consumption rate. J Cereb Blood Flow Metab 2010;30:1598–1607. [DOI] [PMC free article] [PubMed] [Google Scholar]
- 22.Haacke EM, Lai S, Reichenbach JR, Kuppusamy K, Hoogenraad FGC, Takeichi H, Lin WL. In vivo measurement of blood oxygen saturation using magnetic resonance imaging: A direct validation of the blood oxygen level-dependent concept in functional brain imaging. Hum Brain Mapp 1997;5:341–346. [DOI] [PubMed] [Google Scholar]
- 23.He X, Yablonskiy DA. Quantitative BOLD: mapping of human cerebral deoxygenated blood volume and oxygen extraction fraction: default state. Magn Reson Med 2007;57:115–126. [DOI] [PMC free article] [PubMed] [Google Scholar]
- 24.Xu B, Liu T, Spincemaille P, Prince M, Wang Y. Flow compensated quantitative susceptibility mapping for venous oxygenation imaging. Magn Reson Med 2014;72:438–445. [DOI] [PMC free article] [PubMed] [Google Scholar]
- 25.Fan AP, Benner T, Bolar DS, Rosen BR, Adalsteinsson E. Phase-based regional oxygen metabolism (PROM) using MRI. Magn Reson Med 2012;67:669–678. [DOI] [PMC free article] [PubMed] [Google Scholar]
- 26.An H, Lin W. Impact of intravascular signal on quantitative measures of cerebral oxygen extraction and blood volume under normo- and hypercapnic conditions using an asymmetric spin echo approach. Magn Reson Med 2003;50:708–716. [DOI] [PubMed] [Google Scholar]
- 27.Bulte DP, Kelly M, Germuska M, Xie J, Chappell MA, Okell TW, Bright MG, Jezzard P. Quantitative measurement of cerebral physiology using respiratory-calibrated MRI. Neuroimage 2012;60:582–591. [DOI] [PMC free article] [PubMed] [Google Scholar]
- 28.Gauthier CJ, Hoge RD. Magnetic resonance imaging of resting OEF and CMRO(2) using a generalized calibration model for hypercapnia and hyperoxia. Neuroimage 2012;60:1212–1225. [DOI] [PubMed] [Google Scholar]
- 29.Miyata M, Kakeda S, Kudo K, Iwata S, Tanaka Y, Wang Y, Korogi Y. Evaluation of oxygen extraction fraction in systemic lupus erythematosus patients using quantitative susceptibility mapping. J Cereb Blood Flow Metab 2019;39:1648–1658. [DOI] [PMC free article] [PubMed] [Google Scholar]
- 30.Jain V, Buckley EM, Licht DJ et al. Cerebral oxygen metabolism in neonates with congenital heart disease quantified by MRI and optics. J Cereb Blood Flow Metab 2014;34:380–388. [DOI] [PMC free article] [PubMed] [Google Scholar]
- 31.Kudo K, Liu T, Murakami T et al. Oxygen extraction fraction measurement using quantitative susceptibility mapping: Comparison with positron emission tomography. J Cereb Blood Flow Metab 2016;36:1424–1433. [DOI] [PMC free article] [PubMed] [Google Scholar]
- 32.Xu F, Uh J, Liu P, Lu H. On improving the speed and reliability of T2-relaxation-under-spin-tagging (TRUST) MRI. Magn Reson Med 2012;68:198–204. [DOI] [PMC free article] [PubMed] [Google Scholar]
- 33.Lu H, Xu F, Grgac K, Liu P, Qin Q, van Zijl P. Calibration and validation of TRUST MRI for the estimation of cerebral blood oxygenation. Magn Reson Med 2012;67:42–49. [DOI] [PMC free article] [PubMed] [Google Scholar]
- 34.Liu P, Xu F, Lu H. Test-retest reproducibility of a rapid method to measure brain oxygen metabolism. Magn Reson Med 2013;69:675–681. [DOI] [PMC free article] [PubMed] [Google Scholar]
- 35.Liu P, Dimitrov I, Andrews T et al. Multisite evaluations of a T2-relaxation-under-spin-tagging (TRUST) MRI technique to measure brain oxygenation. Magn Reson Med 2016;75:680–687. [DOI] [PMC free article] [PubMed] [Google Scholar]
- 36.Jiang D, Liu P, Li Y, Mao D, Xu C, Lu H. Cross-vendor harmonization of T2 -relaxation-under-spin-tagging (TRUST) MRI for the assessment of cerebral venous oxygenation. Magn Reson Med 2018;80:1125–1131. [DOI] [PMC free article] [PubMed] [Google Scholar]
- 37.Iida H, Jones T, Miura S. Modeling approach to eliminate the need to separate arterial plasma in oxygen-15 inhalation positron emission tomography. J Nucl Med 1993;34:1333–1340. [PubMed] [Google Scholar]
- 38.Golish SR, Hove JD, Schelbert HR, Gambhir SS. A fast nonlinear method for parametric imaging of myocardial perfusion by dynamic (13)N-ammonia PET. J Nucl Med 2001;42:924–931. [PubMed] [Google Scholar]
- 39.Vlassenko AG, McConathy J, Couture LE et al. Aerobic Glycolysis as a Marker of Tumor Aggressiveness: Preliminary Data in High Grade Human Brain Tumors. Dis Markers 2015;2015:874904. [DOI] [PMC free article] [PubMed] [Google Scholar]
- 40.Herscovitch P, Raichle ME. What is the correct value for the brain--blood partition coefficient for water? J Cereb Blood Flow Metab 1985;5:65–69. [DOI] [PubMed] [Google Scholar]
- 41.Raichle ME, Martin WR, Herscovitch P, Mintun MA, Markham J. Brain blood flow measured with intravenous H2(15)O. II. Implementation and validation. J Nucl Med 1983;24:790–798. [PubMed] [Google Scholar]
- 42.Hyder F, Herman P, Bailey CJ, Moller A, Globinsky R, Fulbright RK, Rothman DL, Gjedde A. Uniform distributions of glucose oxidation and oxygen extraction in gray matter of normal human brain: No evidence of regional differences of aerobic glycolysis. J Cereb Blood Flow Metab 2016;36:903–916. [DOI] [PMC free article] [PubMed] [Google Scholar]
- 43.Shrout PE, Fleiss JL. Intraclass correlations: uses in assessing rater reliability. Psychol Bull 1979;86:420–428. [DOI] [PubMed] [Google Scholar]
- 44.Koo TK, Li MY. A Guideline of Selecting and Reporting Intraclass Correlation Coefficients for Reliability Research. J Chiropr Med 2016;15:155–163. [DOI] [PMC free article] [PubMed] [Google Scholar]
- 45.Bremmer JP, van Berckel BN, Persoon S, Kappelle LJ, Lammertsma AA, Kloet R, Luurtsema G, Rijbroek A, Klijn CJ, Boellaard R. Day-to-day test-retest variability of CBF, CMRO2, and OEF measurements using dynamic 15O PET studies. Mol Imaging Biol 2011;13:759–768. [DOI] [PMC free article] [PubMed] [Google Scholar]
- 46.Xu F, Uh J, Brier MR, Hart J Jr., Yezhuvath US, Gu H, Yang Y, Lu H. The influence of carbon dioxide on brain activity and metabolism in conscious humans. J Cereb Blood Flow Metab 2011;31:58–67. [DOI] [PMC free article] [PubMed] [Google Scholar]
- 47.Perlmutter JS, Powers WJ, Herscovitch P, Fox PT, Raichle ME. Regional asymmetries of cerebral blood flow, blood volume, and oxygen utilization and extraction in normal subjects. J Cereb Blood Flow Metab 1987;7:64–67. [DOI] [PubMed] [Google Scholar]
- 48.Hatazawa J, Fujita H, Kanno I et al. Regional cerebral blood flow, blood volume, oxygen extraction fraction, and oxygen utilization rate in normal volunteers measured by the autoradiographic technique and the single breath inhalation method. Ann Nucl Med 1995;9:15–21. [DOI] [PubMed] [Google Scholar]
- 49.Coles JP, Fryer TD, Bradley PG, Nortje J, Smielewski P, Rice K, Clark JC, Pickard JD, Menon DK. Intersubject variability and reproducibility of 15O PET studies. J Cereb Blood Flow Metab 2006;26:48–57. [DOI] [PubMed] [Google Scholar]
- 50.Fan AP, Bilgic B, Gagnon L, Witzel T, Bhat H, Rosen BR, Adalsteinsson E. Quantitative oxygenation venography from MRI phase. Magn Reson Med 2014;72:149–159. [DOI] [PMC free article] [PubMed] [Google Scholar]
- 51.Zheng G, Lu H, Yu W et al. Severity-specific alterations in CBF, OEF and CMRO2 in cirrhotic patients with hepatic encephalopathy. Eur Radiol 2017;27:4699–4709. [DOI] [PubMed] [Google Scholar]
- 52.Zheng G, Wen J, Lu H et al. Elevated global cerebral blood flow, oxygen extraction fraction and unchanged metabolic rate of oxygen in young adults with end-stage renal disease: an MRI study. Eur Radiol 2016;26:1732–1741. [DOI] [PubMed] [Google Scholar]
- 53.van Zijl PC, Eleff SM, Ulatowski JA, Oja JM, Ulug AM, Traystman RJ, Kauppinen RA. Quantitative assessment of blood flow, blood volume and blood oxygenation effects in functional magnetic resonance imaging. Nat Med 1998;4:159–167. [DOI] [PubMed] [Google Scholar]
- 54.Bush A, Borzage M, Detterich J, Kato RM, Meiselman HJ, Coates T, Wood JC. Empirical model of human blood transverse relaxation at 3 T improves MRI T2 oximetry. Magn Reson Med 2017;77:2364–2371. [DOI] [PMC free article] [PubMed] [Google Scholar]
- 55.Liu P, Chalak LF, Krishnamurthy LC, Mir I, Peng SL, Huang H, Lu H. T1 and T2 values of human neonatal blood at 3 Tesla: Dependence on hematocrit, oxygenation, and temperature. Magn Reson Med 2016;75:1730–1735. [DOI] [PMC free article] [PubMed] [Google Scholar]
- 56.Turgeon M Erythrocyte morphology and inclusions. In: Turgeon M, editor. Clinical hematology: theory and procedures. 5th ed. Philadelphia: Lippincott Williams & Wilkins; 2012. p 126–144. [Google Scholar]
- 57.Wood D, Quiroz-Rocha G. Normal hematology of cattle. In: Weiss D, Wardrop K, editors. Schalm’s veterinary hematology. 6th ed. Ames: Blackwell Publishing; 2010. p 829–835. [Google Scholar]
Associated Data
This section collects any data citations, data availability statements, or supplementary materials included in this article.
Supplementary Materials
Supporting Information Figure S1: Correlation between TRUST and PET whole-brain OEF measurements, when using assumed hematocrit for TRUST. (A) Hematocrit was assumed to be 0.42 for males and 0.40 for females. (B) Hematocrit was assumed to be 0.41 for all subjects. Dashed lines indicate the fitted linear regression lines.