Abstract
The purpose of this study is to ascertain the pharmacodynamic properties of exendin-4, a glucose-dependent insulinotropic agent, from plasma glucose and insulin concentration-time profiles following a 60-min intravenous infusion in healthy and type 2 diabetic subjects. Plasma glucose and insulin concentrations were obtained from a previous clinical study, whereby a hyperglycemic clamp was established and maintained in healthy (n = 7) and type 2 diabetic (n = 7) volunteers (plasma glucose raised 5.4 mM above fasting level). Exendin-4 was infused (0.15 pmol/kg/min) during the 2nd hour of a 5-h clamp. A physiological pharmacodynamic model was developed and fitted to individual glucose and insulin responses simultaneously. Because drug concentrations were unavailable, hypothetical pharmacokinetic driving functions were approximated during the modeling process and used to enhance a proportionality constant relating elevated glucose and the rate of second-phase insulin release. Exendin-4 infusions produced substantial insulin release in both subject populations that required higher glucose infusion rates to maintain stable hyperglycemia. Observed plasma glucose-insulin profiles were well characterized by the final pharmacodynamic model. Apparent exendin-4 elimination rate constants for healthy and diabetic subjects were similar (0.0386 ± 0.0192 and 0.0460 ± 0.0145 min−1). Capacity and sensitivity parameters of drug effect were 2-fold lower in diabetic subjects, but mean differences were not statistically significant. Simulations confirm that diabetic subjects exhibit a reduced capacity to enhance second-phase insulin release in response to exendin-4 compared with healthy subjects. Type 2 diabetic subjects demonstrate a significant response to exendin-4, but to a lesser extent than nondiabetic subjects, despite comparable measures of apparent drug exposure and efficacy.
Pharmacological agents that directly modulate the secretion of insulin (insulinotropics) represent an important class of drugs for the treatment of diabetes mellitus (Doyle and Egan, 2003). Glucagon-like peptide-1 (GLP-1) is a potent glucose-dependent insulinotropic agent that also elicits multiple effects in β-cells that may provide further therapeutic benefits to diabetic patients, including increase in β-cell mass (differentiation and neogenesis) and the number of cells secreting insulin, and up-regulation of genes involved in insulin regulation (Doyle and Egan, 2001). However, the development of GLP-1 as a therapeutic drug is seriously limited by a short pharmacokinetic and biological half-life (Orskov et al., 1993), primarily resulting from in vivo hydrolysis by the enzyme dipeptidyl peptidase IV (Kieffer et al., 1995). In contrast, exendin-4 is a 39-amino acid peptide GLP-1 receptor agonist produced in the saliva of the Gila monster lizard (Heloderma suspectum) that exhibits greater potency and a longer duration of action than GLP-1 (Goke et al., 1993; Thorens et al., 1993; Doyle and Egan, 2001). It contains amino acid substitutions so that it is not a substrate for dipeptidyl peptidase IV and a 9-amino acid C-terminal addition, which stabilizes the molecule on the GLP-1 receptor (Doyle et al., 2003). Exendin-4 has been shown to produce significant glucose-dependent insulinotropic effects in healthy and type 2 diabetic subjects (Edwards et al., 2001; Egan et al., 2002).
To date the in vivo pharmacological effects of exendin-4 have been evaluated either qualitatively (Egan et al., 2002) or by comparing empirical measures such as the area under the plasma glucose and insulin concentration-time curves (Edwards et al., 2001). On the contrary, mechanism-based pharmacodynamic (PD) models can be used to characterize the temporal and causal relationships between plasma drug concentrations (pharmacokinetics, PK) and biological responses (Mager et al., 2003). Early physiological models provided key quantitative insights into the control of insulin on glucose metabolism (Insel et al., 1975). Most contemporary mathematical models of the glucose-insulin system rely on the so-called minimal model (Bergman et al., 1979) that is often applied in a piecewise manner by fixing glucose and modeling insulin concentrations and/or vice versa (Toffolo et al., 1980; Pacini et al., 1982). This integrative physiological approach has proven highly useful for over 20 years in the analysis of experimental data and, more importantly, for understanding the pathogenesis, clinical course, and treatment of diabetes (Bergman, 1989, 2002). Recently, the minimal model was adapted to simultaneously evaluate the effects of NN2211, another GLP-1 derivative, on glucose and insulin concentrations over time during an i.v. glucose tolerance test in healthy volunteers (Agerso and Vicini, 2003). This represents a more desirable case, where both sets of data are modeled simultaneously in a unified model that continues to capture the major features of this dynamical system. Similar modifications have also been used to model the PK/PD properties of insulin aspart and human insulin in healthy volunteers under euglycemic clamp conditions (Osterberg et al., 2003). In this study, the effects of exendin-4 on glucose-insulin homeostasis under hyperglycemic clamp conditions in healthy and type 2 diabetic subjects were quantified via a proposed mechanistic PD model.
Materials and Methods
We obtained plasma glucose and insulin concentrations and glucose infusion rates from a recent clinical study (Egan et al., 2002). The previous study was approved by the Johns Hopkins Bayview Medical Center Institutional Review Board [with investigator-initiated investigational new drug (IND) obtained from the U.S. Food and Drug Administration], and this secondary data analysis was approved by the MedStar Research Institute Institutional Review Board with a waiver from further informed consent.
Database.
Details of the experimental design are fully described in the original study (Egan et al., 2002). Briefly, seven nondiabetic subjects (three males, four females; five Caucasians, two African Americans) and seven noninsulin-treated type 2 diabetic subjects (five males, two females; two Caucasians, four African Americans, one Hispanic) were enrolled. Age ranges were 24 to 56 years and 45 to 74 years, and body mass index ranges were 20.2 to 36.4 and 32.7 to 46.8 kgm2 for healthy and diabetic subjects, respectively. Four of the seven diabetic volunteers were taking oral sulfonylureas, which were voluntarily withheld for 3 days prior to testing. After an over-night fast and determining a stable fasting state, a hyperglycemic clamp was initiated (Elahi, 1996), whereby plasma glucose levels were raised and maintained at 5.4 mM above fasting levels for 5 h. These elevated levels were held stable for the duration of the clamp by a variable glucose infusion rate, determined from algorithms based on the prevailing plasma glucose, which was measured at 5-min intervals at the bedside (for a complete overview of clamp methodology, see Elahi, 1996). Exendin-4 (AC2993; Amylin Pharmaceuticals, Inc., San Diego, CA) was diluted in 50 ml of normal saline containing 2 ml of each subject’s blood and infused for 60 min during the 2nd hour of the 5-h clamp. The drug infusion rate was changed at 2-min intervals from 0.59 to 0.25, 0.23, 0.22, and 0.20, and was held constant from 10 min to the end of the hour at 0.15 pmol/kg/min. Once the clamp was initiated, plasma glucose and insulin concentrations were measured every 2 min for the first 10 min, and then every 5 min (glucose) or 10 min (insulin) until 30 min after the termination of the hyperglycemic clamp. Blood samples (3, 0.5, and 10 ml for 2-, 5-, and 10-min samples, respectively) were collected with heparinized syringes and processed as previously described (Elahi et al., 1993). Plasma glucose was measured immediately at the bedside using a Beckman glucose analyzer 2 (Beckman Coulter, Inc., Fullerton, CA). The remaining blood was placed in prechilled test tubes containing aprotonin (400,000 IU/ml) and EDTA (1.5 mg/ml) and centrifuged at 4°C. Samples were stored at −70°C until analysis, where plasma insulin concentrations were measured by radioimmunoassay (Linco Research, Inc., St. Charles, MO) using the human insulin-specific radioimmunoassay kit (catalog no. HI-14K). Glucose infusion rates were recorded (milligrams per kilogram per minute) at the same intervals as the plasma glucose measurements.
PD Model.
The proposed PD model is based on modifications by Agerso and Vicini (2003) to the minimal model paradigm, and a schematic is shown in Fig. 1. Single compartments are shown for glucose (G) and insulin (I) concentrations, along with a separate remote insulin compartment (X), which acts as an “effect” compartment. This system can be defined by the following series of differential equations:
| (1) |
| (2) |
| (3) |
where R(t) is the variable glucose infusion rate, V is the glucose volume of distribution, p1 is the first-order insulin-independent loss rate of glucose, p2 is the first-order remote insulin removal rate constant, p3 represents insulin action or the product of insulin sensitivity and p2, n is the first-order insulin elimination rate constant, and IR1 and IR2 are the first and second phases of insulin release in response to elevated glucose concentrations. The initial conditions of eqs. 1 (G0) and 3 (I0) were fixed to mean values of four measurements made at 10-min intervals just before initiating the hyperglycemic clamp, and the initial condition of eq. 2 is zero. Plasma glucose concentrations were modeled in units of milligrams per deciliter, whereas insulin concentrations were microunits per milliliter and converted to picomoles per liter in the output equation (μU/ml = 6.0 pM). The IR1 was described by an empirical Gaussian function:
| (4) |
where Irel is the function amplitude, Tdur and Tsec are the duration and time of maximal insulin release, and t is time. The IR2 is given by the following equation:
| (5) |
where γ is a proportionality constant between elevated glucose and the rate of IR2, and h is the threshold glucose concentration (IR2 = 0 for G < h). As plasma exendin-4 concentrations were unavailable, a hypothetical PK function was defined for the amount of drug (A) present at the biophase as a function of time (Gabrielsson et al., 2000):
| (6) |
where K0(t) is the primed zero-order exendin-4 infusion rate, and ke is the first-order exendin-4 elimination rate constant. The initial condition of eq. 6 is obviously zero. The PK driving function is used to enhance γ with a standard Emax equation (eq. 5), where Emax is the maximum effect and EA50 is the amount of exendin-4 producing 50% of Emax.
Fig. 1.
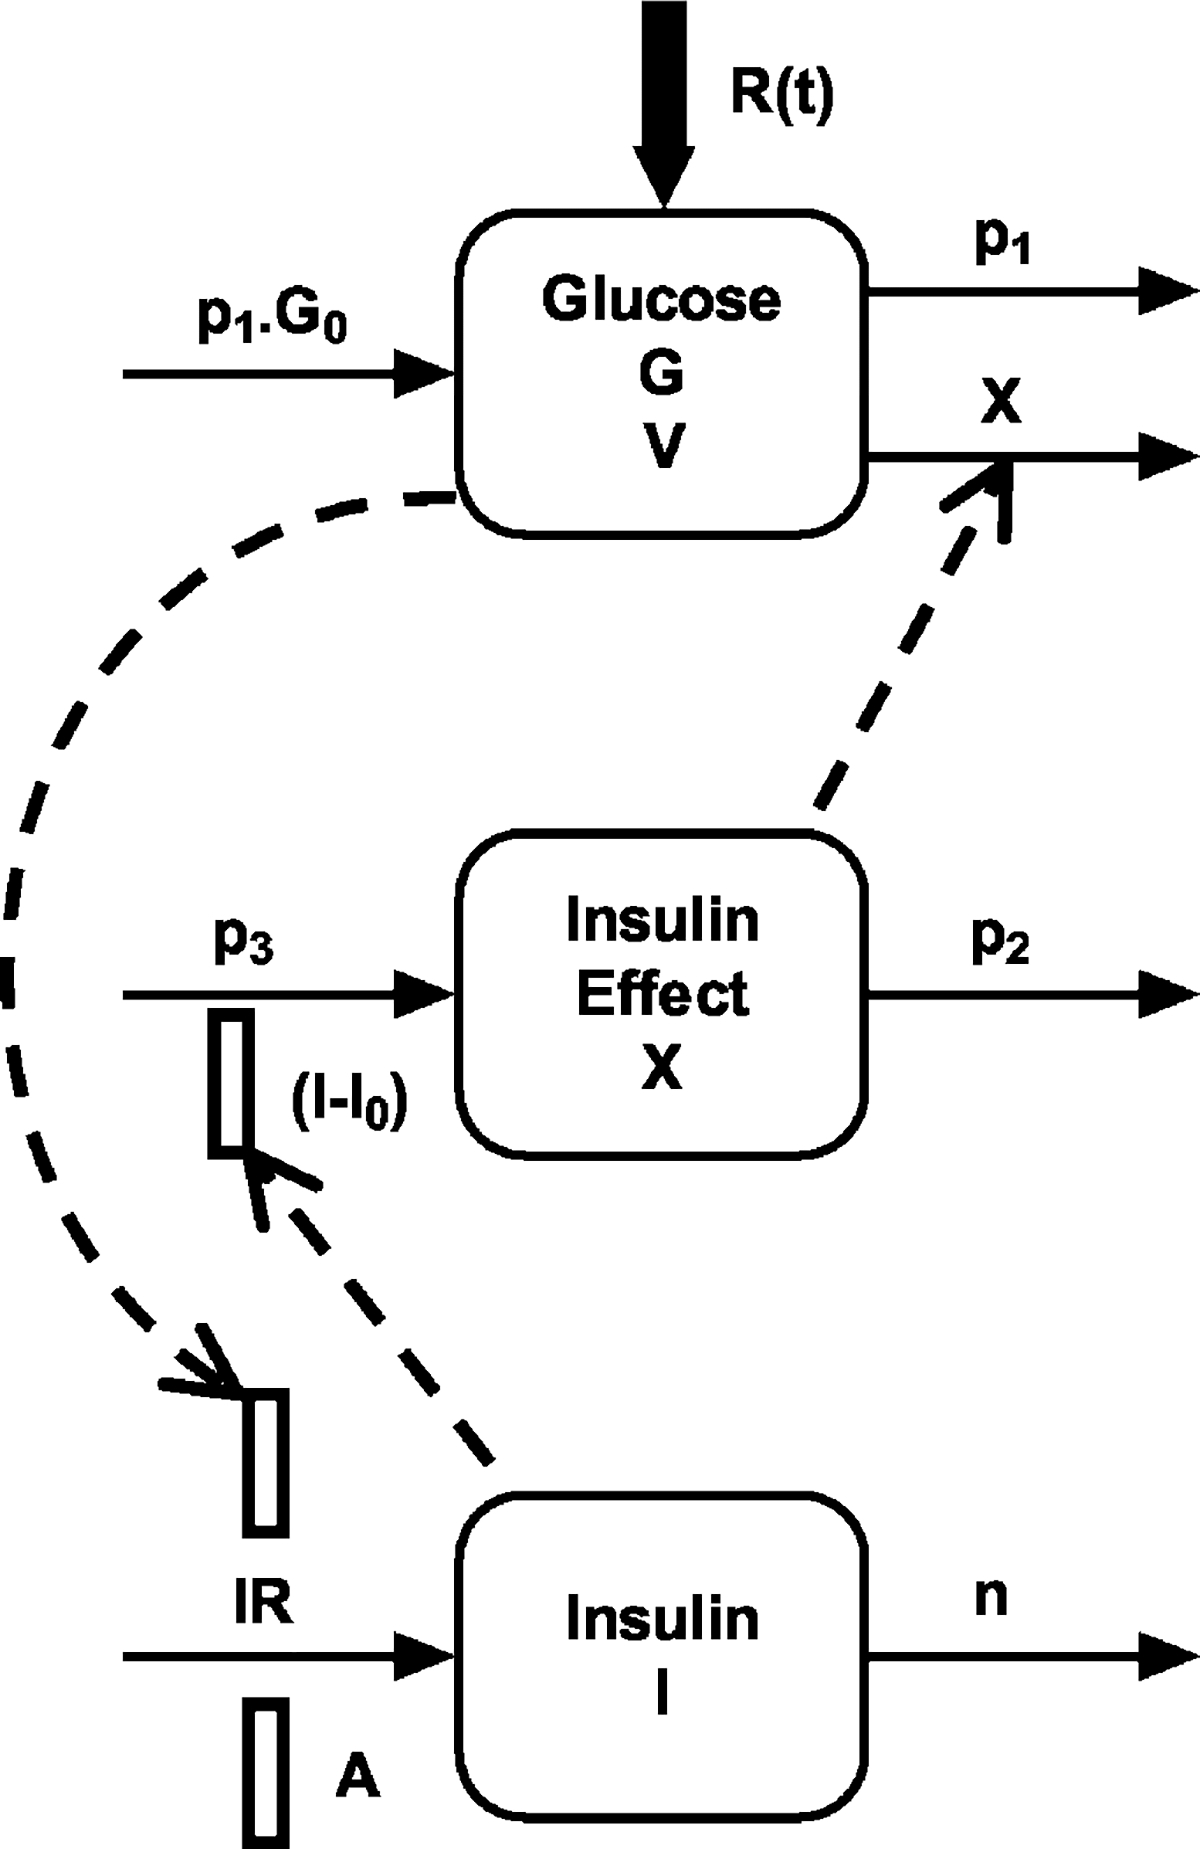
Physiological pharmacodynamic model of exendin-4 effects on glucose and insulin regulation during controlled hyperglycemia. Symbols are defined under PD Model under Materials and Methods.
Data and Statistical Analysis.
Areas under the glucose infusion rate and plasma insulin concentration-time curves from time 0 to 60 min (AUC0–60) were calculated using the linear trapezoidal method. For insulin profiles, net AUC values were calculated according to AUCnet = AUC0–60 – AUCbaseline, where AUCbaseline = I0 · 60 min. Comparisons of AUCs between groups were made by the Mann-Whitney U test conducted with GraphPad InStat (version 3.0 for Win 95/NT; GraphPad Software, Inc., San Diego CA).
Individual subject data sets of plasma glucose and insulin concentration-time profiles were modeled simultaneously (eqs. 1–6), and glucose infusion rates were entered as known values [R(t) in eq. 1]. Owing to the complexity of the model, parameters were estimated using maximum a posteriori (MAP) Bayesian estimation as implemented in the ADAPT II computer program (D’Argenio and Schumitzky, 1997). Where available, prior mean values were obtained from the literature and specified with empirical prior standard deviations (20–30% of mean values) and assuming log-normal distributions. No prior information was entered for Irel, Emax, EA50, and ke (i.e., noninformative priors). A standard variance model was specified as follows:
| (7) |
where separate variance model parameters (σi) were used for glucose and insulin, and yi(tj) represents model predicted values. Goodnessof-fit and model selection were assessed using the generalized information criterion for MAP estimation (D’Argenio and Schumitzky, 1997), correlation coefficients, residual distributions, and visual inspection.
Final estimated parameters were reported as mean (CV%) for healthy and diabetic subjects. Unpaired Student’s t tests with Welch correction were performed to assess differences between mean values using GraphPad InStat.
Results
A square wave of hyperglycemia was achieved in both diabetic subjects and nondiabetic volunteers (Fig. 2, top panels). The mean time-zero or fasting glucose concentration was significantly higher in the diabetic group compared with healthy subjects (G0 = 193 ± 68.3 versus 99.3 ± 5.5 mg/dl; p < 0.01), whereas fasting insulin was higher but the difference not statistically significant (I0 = 18.0 ± 7.9 versus 12.6 ± 6.9 μU/ml). During the 1st hour of the hyperglycemic clamp, there was an initial release of insulin (first-phase insulin release), which was less or absent for subjects in the diabetic group, followed by a linear increase in insulin concentrations (second-phase insulin release) over time (Fig. 2, bottom panels). The AUC0–60 values for the glucose infusion rates were not statistically significant (299 ± 24 versus 285 ± 14 mg/kg for healthy and diabetic subjects; mean ± S.E.), whereas AUC0–60 values for insulin profiles were significantly greater in healthy subjects (15,800 ± 8100 versus 2570 ± 940 pmol min/l; mean S.E.; p = 0.007). As would be expected, these AUC comparisons reflect a decreased capacity for glucose-dependent insulin release in diabetic subjects. A rapid and significant increase in insulin concentrations was observed in both groups upon the initiation of the exendin-4 infusion, and insulin concentrations remained above fasting levels for the duration of the hyperglycemic clamp (Fig. 2, bottom panels).
Fig. 2.
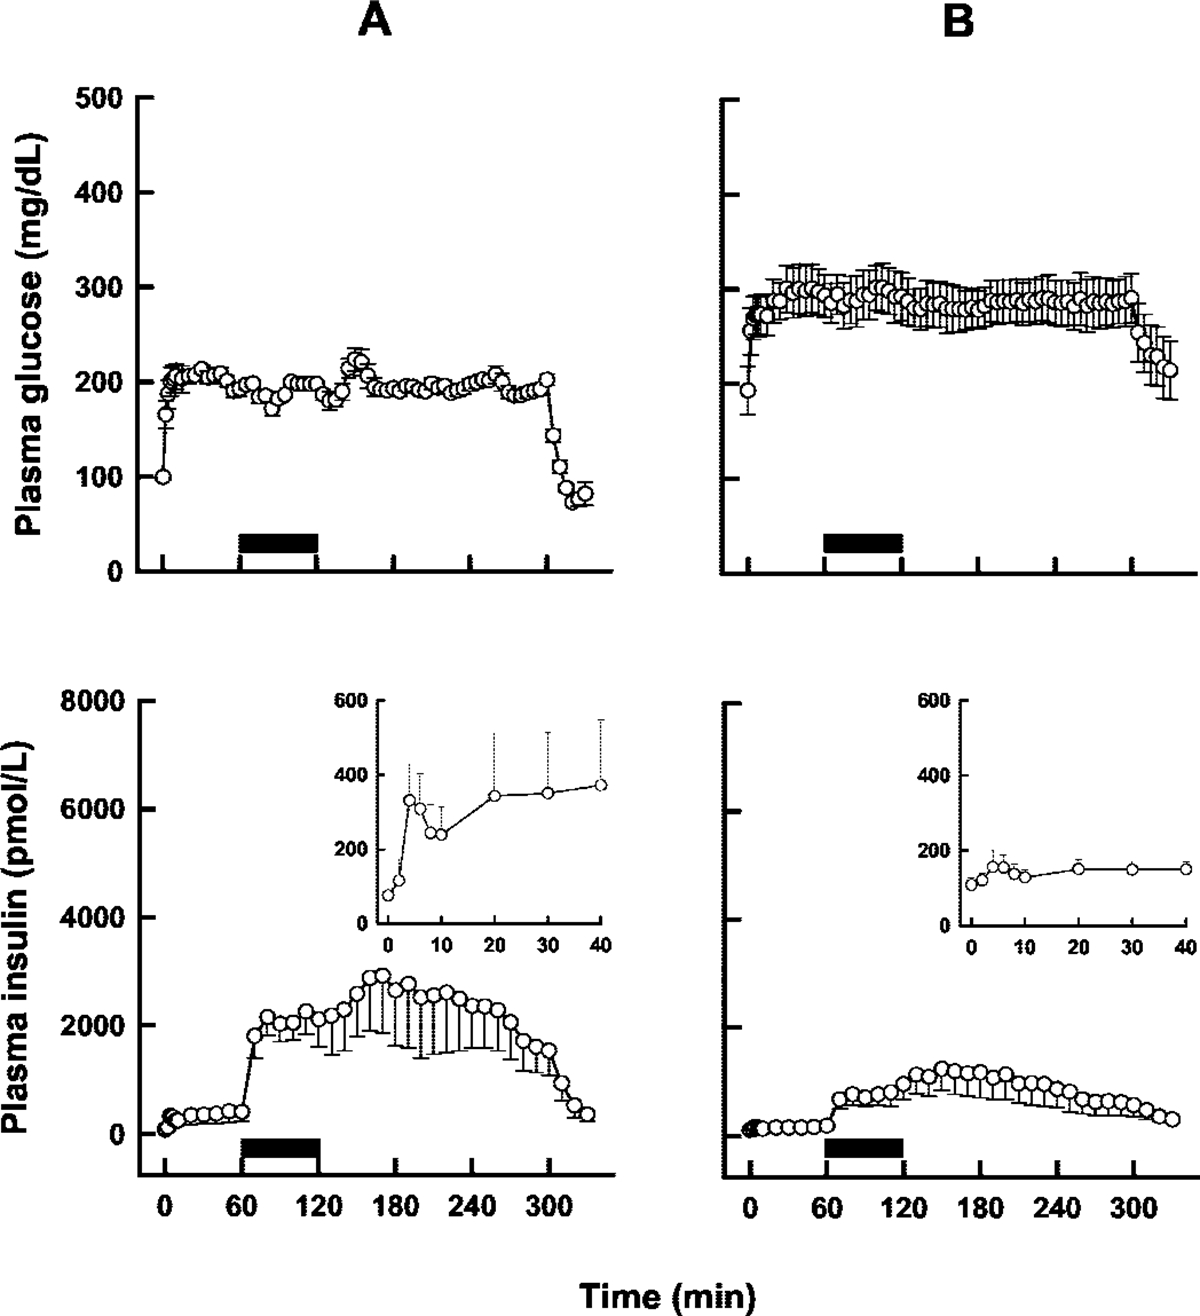
Mean plasma glucose (top panels) and insulin (bottom) concentrations after a hyperglycemic clamp (0–300 min) and an exendin-4 infusion (solid bars; 60–120 min) in nondiabetic (A) and type 2 diabetic (B) subjects. The insets in the bottom panels show first-phase insulin release on an adjusted scale. Error bars represent standard error (n = 7). Adapted from Egan et al. (2002).
Individual sets of plasma glucose and insulin concentration-time profiles were modeled simultaneously using the proposed PD model (Fig. 1), and representative plots are shown in Fig. 3. Although residual distributions seemed smaller for diabetic subjects, the data were well characterized overall with good agreement between model predicted and observed concentrations for both populations (Fig. 4). The mean estimated model parameters are listed in Table 1. Significant differences were found between the two groups for p3, γ, h, and the two variance model parameters. There was also a trend for lower values in the diabetic group for Irel, p2, Emax, and EA50; however, the differences were not statistically significant.
Fig. 3.
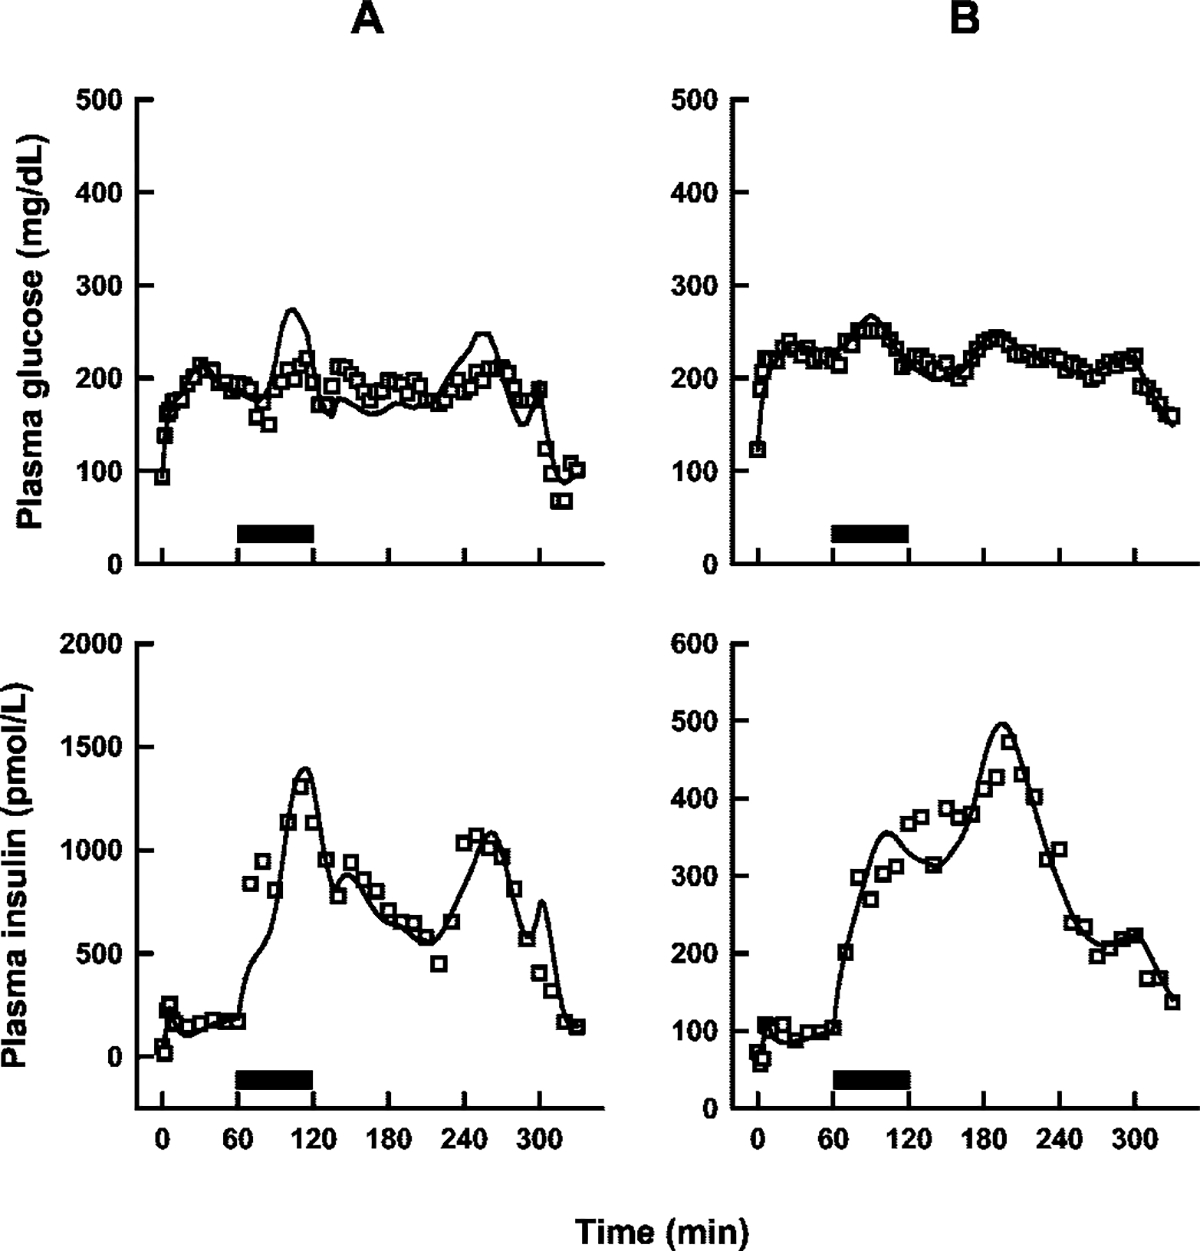
Representative plots of model (Fig. 1) fitted profiles (solid lines) in one nondiabetic (A) and one type 2 diabetic (B) subject. Solid bars show the duration of the exendin-4 infusions.
Fig. 4.
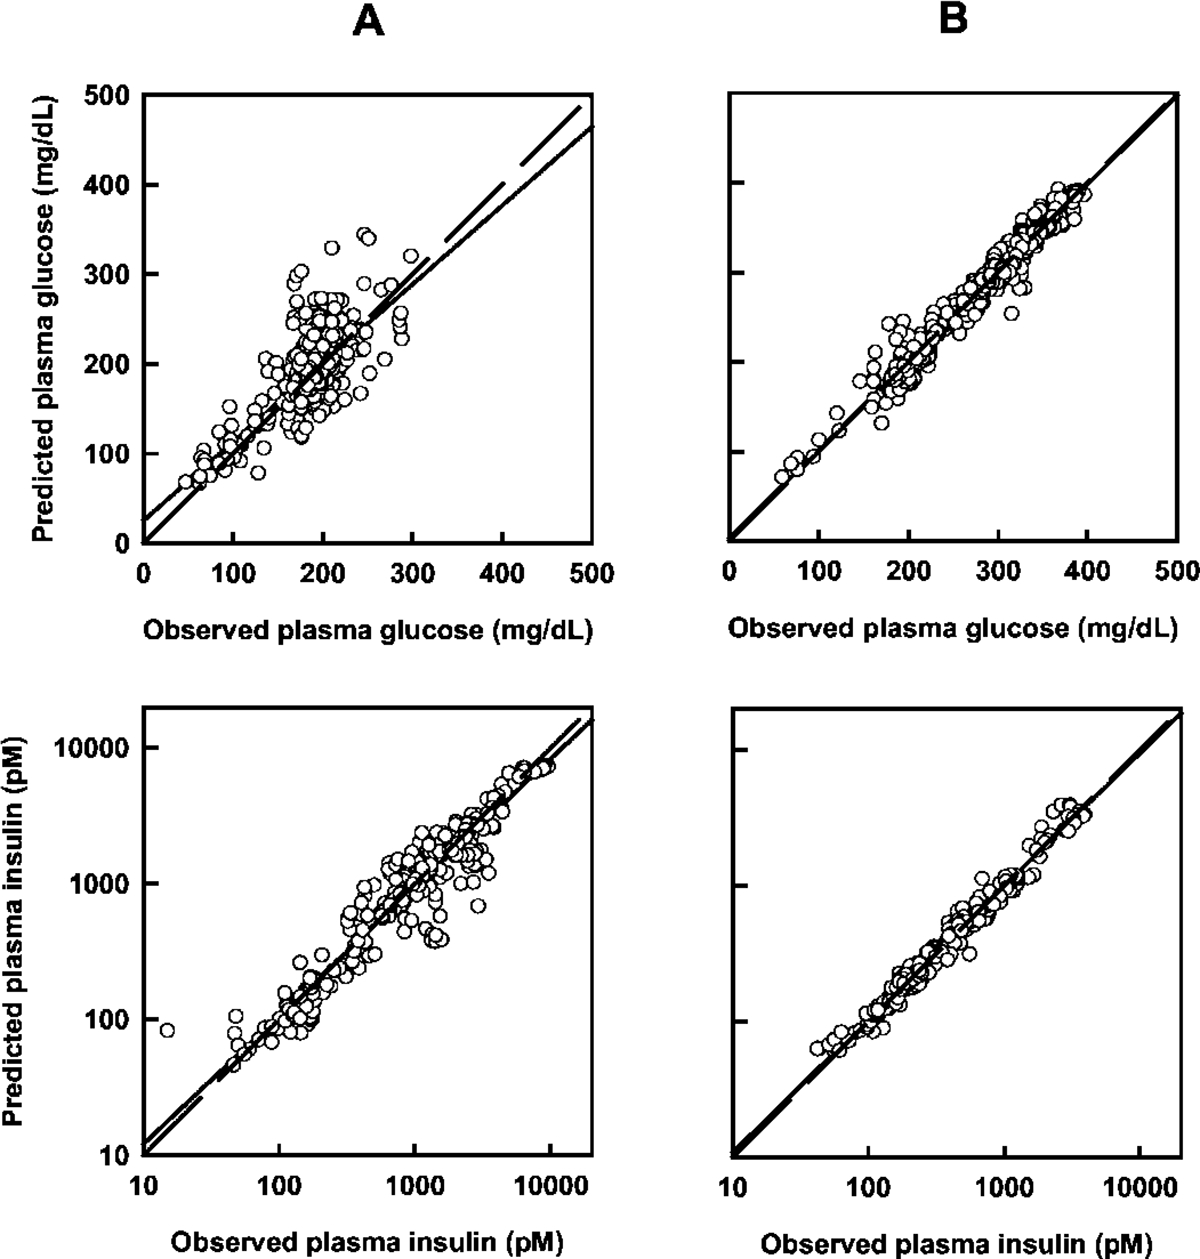
Model predicted and observed glucose (top panels) and insulin (bottom panels) concentrations in the nondiabetic (A) and diabetic (B) groups. Each panel contains lines of identity (dashed) and linear regression (solid).
TABLE 1.
Mean estimated model parameters following a 60-min intravenous infusion of exendin-4 in healthy and type 2 diabetic subjects under hyperglycemic clamp conditions
| Healthy Subjects |
Type 2 Diabetic Subjects |
|||||
|---|---|---|---|---|---|---|
| Parameter (Units) | Prior | Mean | CV% | Prior | Mean | CV% |
|
| ||||||
| Tdur (min) | 1.9 | 1.71 | 7.1 | 1.9 | 1.76 | 7.3 |
| Tsec (min) | 3.5 | 3.41 | 8.6 | 3.5 | 3.54 | 20 |
| Irel (μU/ml) | NI | 49.9 | 85 | NI | 13.0a | 199 |
| V (dl/kg) | 1.3 | 1.39 | 20 | 1.3 | 1.42 | 14 |
| p1 (min−1) | 3.0 × 10⁻² | 2.28 × 10⁻² | 20 | 1.3 × 10⁻² | 2.09 × 10⁻² | 35 |
| p2 (min−1) | 3.0 × 10⁻² | 3.39 × 10⁻² | 57 | 1.3 × 10⁻² | 1.61 × 10⁻²a | 47 |
| p3 (min−2/μU/ml) | 7.50 × 10⁻⁶ | 5.60 × 10⁻⁶ | 52 | 3.0 × 10⁻⁶ | 1.49 × 10⁻⁶† | 72 |
| γ (μU ml−1min−2/mg dl−1) | 2.8 × 10⁻⁴ | 5.52 × 10⁻⁴ | 43 | 3.0 × 10⁻⁴ | 2.43 × 10⁻⁴* | 76 |
| h (mg/dl) | 98 | 63.2 | 28 | 137 | 144† | 40 |
| n (min−1) | 0.21 | 0.165 | 41 | 0.13 | 0.204 | 26 |
| Emax (μU ml−1min−2/mg dl−1) | NI | 2.81 × 10⁻³ | 55 | NI | 1.54 × 10⁻³a | 86 |
| EA50 (pmol/kg) | NI | 0.268 | 64 | NI | 0.111a | 69 |
| ke (min−1) | NI | 3.86 × 10⁻² | 50 | NI | 4.60 × 10⁻² | 32 |
| σ G | N/A | 0.137 | 37 | N/A | 5.02 × 10⁻²† | 62 |
| σ I | N/A | 0.433 | 55 | N/A | 0.146* | 26 |
N/A, not applicable; NI, non-informative.
Trend for values lower than for healthy subjects (p = 0.081, 0.057, 0.12, and 0.058 for Irel, p2, Emax, and EA50 respectively).
Significantly different than healthy subjects (p < 0.05).
Significantly different than healthy subjects (p ≤ 0.01).
The pharmacological properties of exendin-4 were directly evaluated through PK/PD simulations of effective drug exposure (A in eq. 6) and effective γ values (γeff), defined as
| (8) |
Simulations over time were conducted using mean parameter estimates for ke, γ, Emax, and EA50 (Table 1). The hypothetical PK profiles shown in Fig. 5 (top panel) indicate that the PK properties of exendin-4 are expected to be similar between nondiabetic and diabetic subjects. Although apparent effective drug exposure was approximated to be similar between groups, the lower Emax term for diabetic volunteers, coupled with a lower baseline γ value, reflects a decreased capacity to enhance second-phase insulin release (Fig. 5, bottom panel), despite a comparable or slightly lower EA50 value (measure of drug sensitivity).
Fig. 5.
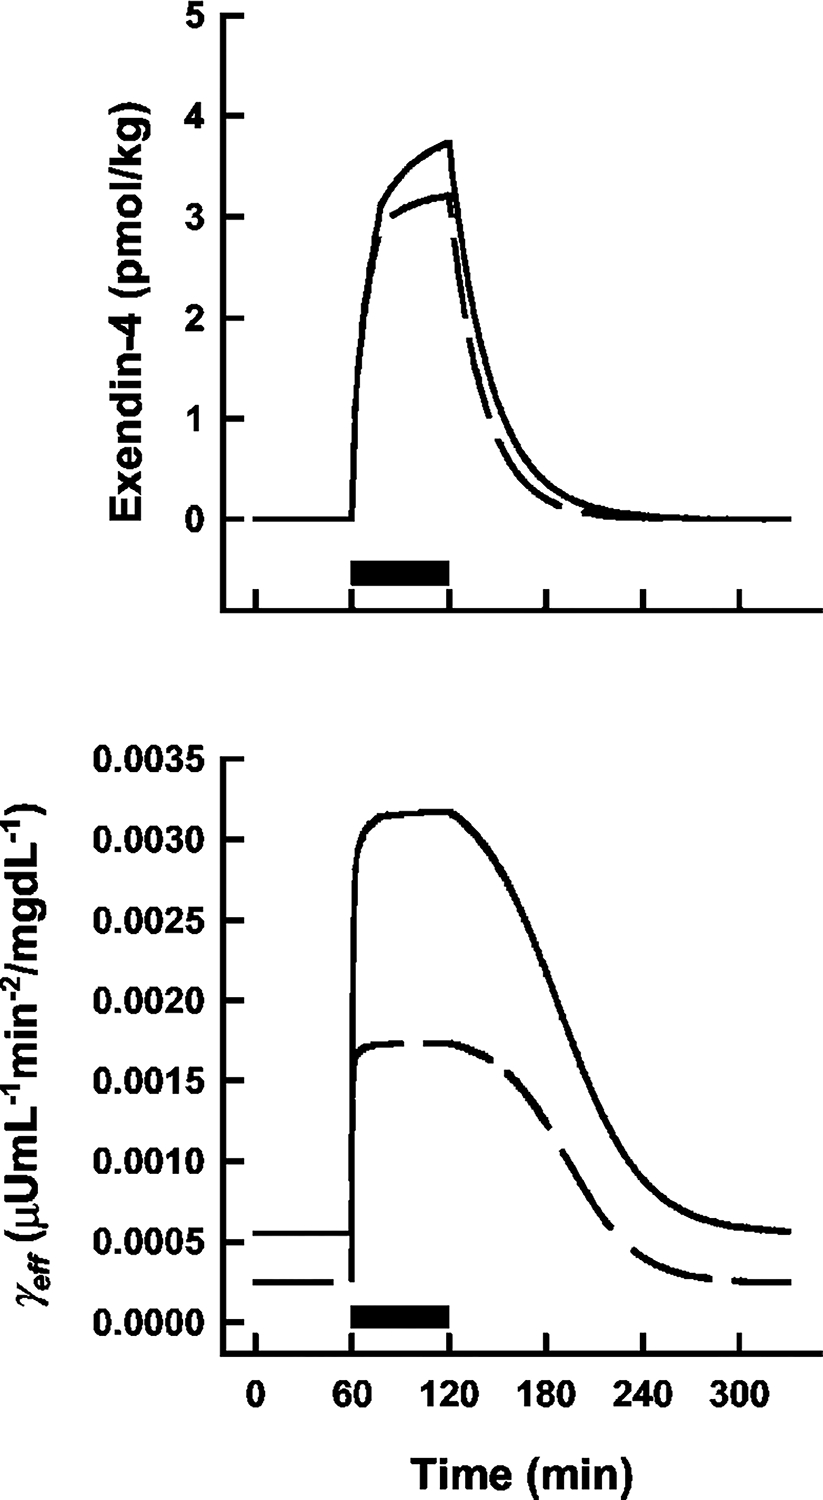
Simulated effective exendin-4 exposure (top panel) and γeff values (bottom panel) as a function of time in nondiabetic (solid lines) and diabetic (dashed lines) populations using mean parameter estimates (Table 1). Solid bars show the duration of the exendin-4 infusions. Equations are defined in text.
Discussion
GLP-1 receptor agonists represent a new class of insulinotropic agents that are being evaluated for their potential as therapeutic agents for the treatment of type 2 diabetes (Doyle and Egan, 2001, 2003). To our knowledge, this study is the first instance of applying a mechanistic model to quantify the dynamics of exendin-4 under hyperglycemic clamp conditions. The likely mechanism of action of exendin-4 was integrated into an existing model of the glucose-insulin system, thereby facilitating the simultaneous analysis of glucose and insulin responses to hyperglycemia and drug effects. Drug concentrations could not be obtained in the previous study because the available Amylin radioimmunoassay at that time lacked the necessary sensitivity for the administered dosing regimen. In the absence of measured drug concentrations, an inverse PD modeling approach was used, with PK driving functions that are approximated during the process of modeling response profiles (Gabrielsson et al., 2000).
In general, the final estimated parameters controlling glucose and insulin regulation (Table 1) are in accordance with most literature values (Bergman et al., 1979; Weber et al., 1989; Neatpisarnvanit and Boston, 2002; Pillonetto et al., 2002; Agerso and Vicini, 2003; Osterberg et al., 2003), as would be expected from the MAP Bayesian estimation approach used herein. However, some discrepancies were evident. For example, the linear first-order uptake of glucose (p1) and insulin (n) are typically greater in nondiabetic subjects compared with diabetic subjects (approximately 2-fold). In addition, the threshold glucose concentrations (h) should be in proximity to baseline measures (G0), whereas the estimated value in healthy subjects seems underestimated. Sources of these inconsistencies are varied and can range from significant intersubject variability (among individuals within the same group) to model complexity and/or misspecification. With regard to the latter, systematic appraisals of the minimal model have yielded cautionary statements involving model assumptions, especially when applications are intended to provide clinical assessments of patient conditions (Avogaro et al., 1996; Mari, 1997; Cobelli et al., 1998). For our purposes, however, the model structure provided a suitable framework in which to incorporate exendin-4 PK/PD properties, and the final model is proposed for such analyses. Furthermore, the use of Bayesian estimation has been shown to effectively deal with the modeling difficulties associated with the structure of the minimal model (Pillonetto et al., 2003).
In a previous study, the single point plasma concentrations of NN2211 (a different GLP-1 analog) at the time of administering an i.v. glucose tolerance test were found to correlate with several of the model parameters (Tsec, Irel, and γ) (Agerso and Vicini, 2003). Effects on Tsec and Irel would not be observed in this study as the first-phase insulin release was completed long before exendin-4 was administered (simulations of eq. 4 show that IR1 is essentially zero by the time the exendin-4 infusion is started; data not shown). The final model of NN2211 included a linear relationship between the single point drug concentrations and the effective γ parameter (γeff). Our final model is thus a logical extension based on these observations and the mechanisms of action of GLP-1 agonists (Doyle and Egan, 2001). Although Emax values were approximately 2-fold lower in diabetic volunteers, relative stimulatory capacity (Emax/γ) or apparent efficacy is similar (6.75 ± 1.89 versus 6.31 ± 0.76 for healthy and type 2 diabetic subjects; mean ± S.E.). Effective PK functions were approximated using a simple one-compartment model with linear first-order elimination (eq. 6). Interestingly, a previous PK study of exendin-4 reported that drug concentrations after an i.v. infusion (0.028 pmol/kg/min) decreased with first-order kinetics and a half-life of 26 ± 3 min (Edwards et al., 2001). That would correspond with a mean terminal elimination rate of 0.0267 min−1 [ln(2)/T1/2] and is similar to our estimates of ke (Table 1). Finally, the overall impact of the estimated pharmacological properties of exendin-4 was ascertained via PK/PD simulations (Fig. 5), revealing a reduced capacity for diabetic subjects to release insulin in response to exendin-4, despite comparable PK (ke), sensitivity (EA50), and efficacy (Emax/γ) parameters, which makes sense intuitively.
In conclusion, a mechanistic PD model was developed that provides quantitative insights into the in vivo PK/PD properties of exendin-4 in nondiabetic and type 2 diabetic subjects, extracted from glucose and insulin response profiles. Although future studies that include measured drug concentrations are needed, this inverse PD modeling study suggests that exendin-4 exposure and efficacy may be similar between these populations; however, diabetic subjects still exhibit a decreased capacity for insulin release as a function of their baseline system parameters. This model may prove useful in future clinical studies of other GLP-1 derivatives that employ the hyperglycemic clamp technique.
Acknowledgments
We thank Drs. Henrik Agerso and Paolo Vicini for helpful comments. None of the authors report any financial relationships that could potentially be perceived as influencing this research.
This study was funded in part by the Intramural Research Program of the National Institute on Aging and by Grant NIA-00599 (to D.E.) from the National Institutes of Health.
ABBREVIATIONS:
- GLP-1
glucagon-like peptide-1
- PD
pharmacodynamics
- PK
pharmacokinetics
- AUC
area under the curve
- MAP
maximum a posteriori
Contributor Information
Donald E. Mager, National Institute on Aging, National Institutes of Health, Gerontology Research Center, Baltimore, Maryland
Darrell R. Abernethy, National Institute on Aging, National Institutes of Health, Gerontology Research Center, Baltimore, Maryland
Josephine M. Egan, National Institute on Aging, National Institutes of Health, Gerontology Research Center, Baltimore, Maryland
Dariush Elahi, Department of Surgery and Medicine, University of Massachusetts Medical School, Worcester, Massachusetts.
References
- Agerso H and Vicini P (2003) Pharmacodynamics of NN2211, a novel long acting GLP-1 derivative. Eur J Pharm Sci 19:141–150. [DOI] [PubMed] [Google Scholar]
- Avogaro A, Vicini P, Valerio A, Caumo A, and Cobelli C (1996) The hot but not the cold minimal model allows precise assessment of insulin sensitivity in NIDDM subjects. Am J Physiol 270:E532–E540. [DOI] [PubMed] [Google Scholar]
- Bergman RN (1989) Lilly lecture 1989. Toward physiological understanding of glucose tolerance. Minimal-model approach. Diabetes 38:1512–1527. [DOI] [PubMed] [Google Scholar]
- Bergman RN (2002) Pathogenesis and prediction of diabetes mellitus: lessons from integrative physiology. Mt Sinai J Med 69:280–290. [PubMed] [Google Scholar]
- Bergman RN, Ider YZ, Bowden CR, and Cobelli C (1979) Quantitative estimation of insulin sensitivity. Am J Physiol 236:E667–E677. [DOI] [PubMed] [Google Scholar]
- Cobelli C, Bettini F, Caumo A, and Quon MJ (1998) Overestimation of minimal model glucose effectiveness in presence of insulin response is due to undermodeling. Am J Physiol 275:E1031–E1036. [DOI] [PubMed] [Google Scholar]
- D’Argenio DZ and Schumitzky A (1997) ADAPT II user’s guide. Biomedical Simulations Resource, Los Angeles, CA. [Google Scholar]
- Doyle ME and Egan JM (2001) Glucagon-like peptide-1. Recent Prog Horm Res 56:377–399. [DOI] [PubMed] [Google Scholar]
- Doyle ME and Egan JM (2003) Pharmacological agents that directly modulate insulin secretion. Pharmacol Rev 55:105–131. [DOI] [PubMed] [Google Scholar]
- Doyle ME, Theodorakis MJ, Holloway HW, Bernier M, Greig NH, and Egan JM (2003) The importance of the nine-amino acid C-terminal sequence of exendin-4 for binding to the GLP-1 receptor and for biological activity. Regul Pept 114:153–158. [DOI] [PMC free article] [PubMed] [Google Scholar]
- Edwards CM, Stanley SA, Davis R, Brynes AE, Frost GS, Seal LJ, Ghatei MA, and Bloom SR (2001) Exendin-4 reduces fasting and postprandial glucose and decreases energy intake in healthy volunteers. Am J Physiol 281:E155–E161. [DOI] [PubMed] [Google Scholar]
- Egan JM, Clocquet AR, and Elahi D (2002) The insulinotropic effect of acute exendin-4 administered to humans: comparison of nondiabetic state to type 2 diabetes. J Clin Endocrinol Metab 87:1282–1290. [DOI] [PubMed] [Google Scholar]
- Elahi D (1996) In praise of the hyperglycemic clamp. A method for assessment of beta-cell sensitivity and insulin resistance. Diabetes Care 19:278–286. [DOI] [PubMed] [Google Scholar]
- Elahi D, McAloon-Dyke M, Fukagawa NK, Sclater AL, Wong GA, Shannon RP, Minaker KL, Miles JM, Rubenstein AH, Vandepol CJ, et al. (1993) Effects of recombinant human IGF-I on glucose and leucine kinetics in men. Am J Physiol 265:E831–E838. [DOI] [PubMed] [Google Scholar]
- Gabrielsson J, Jusko WJ, and Alari L (2000) Modeling of dose-response-time data: four examples of estimating the turnover parameters and generating kinetic functions from response profiles. Biopharm Drug Dispos 21:41–52. [DOI] [PubMed] [Google Scholar]
- Goke R, Fehmann HC, Linn T, Schmidt H, Krause M, Eng J, and Goke B (1993) Exendin-4 is a high potency agonist and truncated exendin-(9–39)-amide an antagonist at the glucagon-like peptide 1-(7–36)-amide receptor of insulin-secreting beta-cells. J Biol Chem 268:19650–19655. [PubMed] [Google Scholar]
- Insel PA, Liljenquist JE, Tobin JD, Sherwin RS, Watkins P, Andres R, and Berman M (1975) Insulin control of glucose metabolism in man. J Clin Investig 55:1057–1066. [DOI] [PMC free article] [PubMed] [Google Scholar]
- Kieffer TJ, McIntosh CH, and Pederson RA (1995) Degradation of glucose-dependent insulinotropic polypeptide and truncated glucagon-like peptide 1 in vitro and in vivo by dipeptidyl peptidase IV. Endocrinology 136:3585–3596. [DOI] [PubMed] [Google Scholar]
- Mager DE, Wyska E, and Jusko WJ (2003) Diversity of mechanism-based pharmacodynamic models. Drug Metab Dispos 31:510–518. [DOI] [PubMed] [Google Scholar]
- Mari A (1997) Assessment of insulin sensitivity with minimal model: role of model assumptions. Am J Physiol 272:E925–E934. [DOI] [PubMed] [Google Scholar]
- Neatpisarnvanit C and Boston JR (2002) Estimation of plasma insulin from plasma glucose. IEEE Trans Biomed Eng 49:1253–1259. [DOI] [PubMed] [Google Scholar]
- Orskov C, Wettergren A, and Holst JJ (1993) Biological effects and metabolic rates of glucagonlike peptide-1 7–36 amide and glucagonlike peptide-1 7–37 in healthy subjects are indistinguishable. Diabetes 42:658–661. [DOI] [PubMed] [Google Scholar]
- Osterberg O, Erichsen L, Ingwersen SH, Plum A, Poulsen HE, and Vicini P (2003) Pharmacokinetic and pharmacodynamic properties of insulin aspart and human insulin. J Pharmacokinet Pharmacodyn 30:221–235. [DOI] [PubMed] [Google Scholar]
- Pacini G, Finegood DT, and Bergman RN (1982) A minimal-model-based glucose clamp yielding insulin sensitivity independent of glycemia. Diabetes 31:432–441. [DOI] [PubMed] [Google Scholar]
- Pillonetto G, Sparacino G, and Cobelli C (2003) Numerical non-identifiability regions of the minimal model of glucose kinetics: superiority of Bayesian estimation. Math Biosci 184:53–67. [DOI] [PubMed] [Google Scholar]
- Pillonetto G, Sparacino G, Magni P, Bellazzi R, and Cobelli C (2002) Minimal model S(I) = 0 problem in NIDDM subjects: nonzero Bayesian estimates with credible confidence intervals. Am J Physiol 282:E564–E573. [DOI] [PubMed] [Google Scholar]
- Thorens B, Porret A, Buhler L, Deng SP, Morel P, and Widmann C (1993) Cloning and functional expression of the human islet GLP-1 receptor. Demonstration that exendin-4 is an agonist and exendin-(9–39) an antagonist of the receptor. Diabetes 42:1678–1682. [DOI] [PubMed] [Google Scholar]
- Toffolo G, Bergman RN, Finegood DT, Bowden CR, and Cobelli C (1980) Quantitative estimation of beta cell sensitivity to glucose in the intact organism: a minimal model of insulin kinetics in the dog. Diabetes 29:979–990. [DOI] [PubMed] [Google Scholar]
- Weber KM, Martin IK, Best JD, Alford FP, and Boston RC (1989) Alternative method for minimal model analysis of intravenous glucose tolerance data. Am J Physiol 256:E524–E535. [DOI] [PubMed] [Google Scholar]


