

SUMMARY
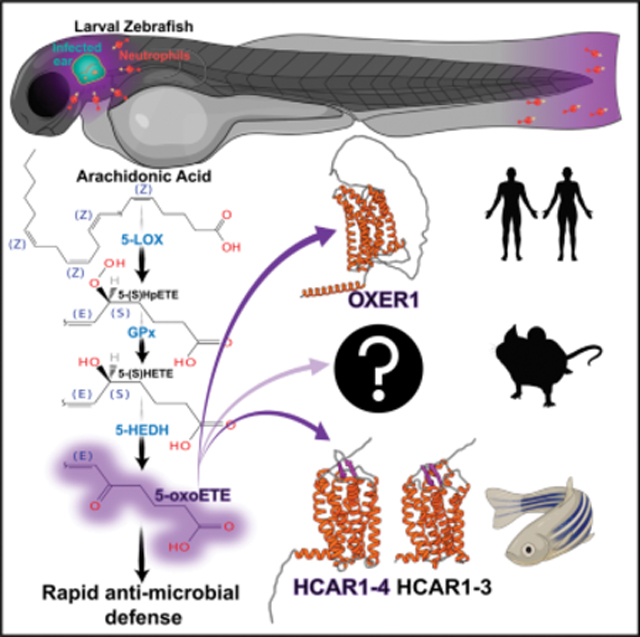
5-oxoETE is a bioactive lipid derived from arachidonic acid generated when phospholipase A2 activation coincides with oxidative stress. Through its G protein-coupled receptor OXER1, pure 5-oxoETE is a potent leukocyte chemoattractant. Yet, its physiological function has remained elusive owing to the unusual OXER1 conservation pattern. OXER1 is conserved from fish to primates but not in rodents, precluding genetic loss-of-function studies in mouse. To determine its physiological role, we combine transcriptomic, lipidomic, and intravital imaging assays with genetic perturbations of the OXER1 ortholog hcar1–4 in zebrafish. Pseudomonas aeruginosa infection induces the synthesis of 5-oxoETE and its receptor, along with other inflammatory pathways. Hcar1–4 deletion attenuates neutrophil recruitment and decreases post-infection survival, which could be rescued by ectopic expression of hcar1–4 or human OXER1. By revealing 5-oxoETE as dominant lipid regulator of the early antimicrobial response in a non-rodent vertebrate, our work expands the current, rodent-centric view of early inflammation.
In brief
5-oxoETE is an inflammatory lipid derived from arachidonic acid. 5-oxoETE’s physiological functions are little understood, partly because its G protein-coupled receptor, OXER1, has no known rodent orthologs. Here, Ma et al. use zebrafish, which express OXER1 orthologs, to illuminate the pathway’s essential physiological functions in rapid innate immune defense against bacterial infection.
Graphical Abstract
INTRODUCTION
Arachidonic acid (AA)-derived metabolites are a large family of signaling lipids termed eicosanoids. They have essential roles in cell-to-cell communication during inflammation and innate immune defense. Drugs that target eicosanoid signaling are among the most prescribed of any medicines, but innovation has largely ceased in recent years. This could reflect that eicosanoid biology is already completely understood and therapeutically exploited. Or it may reflect an over-reliance on rodent models that do not always accurately predict human pathophysiology.1,2 Many of the synthesis routes, receptor mechanisms, and physiological roles of eicosanoids remain little characterized. A prime example is 5-oxoETE (5-oxo-6E,8Z,11Z,14Z-eicosatetraenoic acid, also called 5-oxoETE), which is derived from AA by the action of 5-lipoxygenase (ALOX5) and the genetically unidentified enzyme 5-hydroxyeicosanoid dehydrogenase (5-HEDH), or by non-enzymatic lipid peroxidation.3 Like the well-studied neutrophil chemoattractant leukotriene B4 (LTB4), which is generated from AA by ALOX5 and leukotriene A4 hydrolase (LTA4H), pure 5-oxoETE attracts leukocytes, most potently eosinophils.4 Ischemic or allergic challenge elevates 5-oxoETE levels in vivo.5,6 Pharmacologic antagonism of OXER1 alleviates allergic inflammation in monkey.7,8 In human cancers, the OXER1 gene shows a frequent frameshift mutation (S78Pfs*64 and S78Vfs*61).9 Cell culture studies reported 5-oxoETE to act proliferative or antiproliferative depending on concentration.10,11 In any case, whether or how tumorigenesis is influenced by OXER1 is hard to predict without knowing the receptor’s physiological function. In zebrafish, morpholino-mediated knockdown of the OXER1 ortholog hcar1–4 inhibits neutrophil recruitment to uninfected tail fin wounds.12 Since those usually heal rapidly without impairing larval survival, they do not exert enough selective pressure to reveal the broader importance of oxoeicosanoid signaling during immune defense. To this end, we set out to illuminate the role of oxoeicosanoid signaling in a zebrafish infection model.
RESULTS
For studying innate immunity, transparent zebrafish larvae are a powerful alternative to mice.13 All major innate immune cell types are present in zebrafish.14 Owing to the thinness and translucency of zebrafish larvae, they can be conveniently studied in situ by intravital imaging. Along with many other human genes (including CASP10, ADA2, etc.), OXER1 has no described orthologs in mouse or rat, but in fish (Figures 1A and S1A; Table S1). As pure 5-oxoETE and chemical OXER1 antagonists also show effects on rodents,15–19 there might be unknown OXER1 substitutes. But until those are found—given they exist—the oxoeicosanoid pathway cannot be interrogated using mouse genetics.
Figure 1. The 5-oxoETE pathway is induced by ear infection of zebrafish larvae with P. aeruginosa.
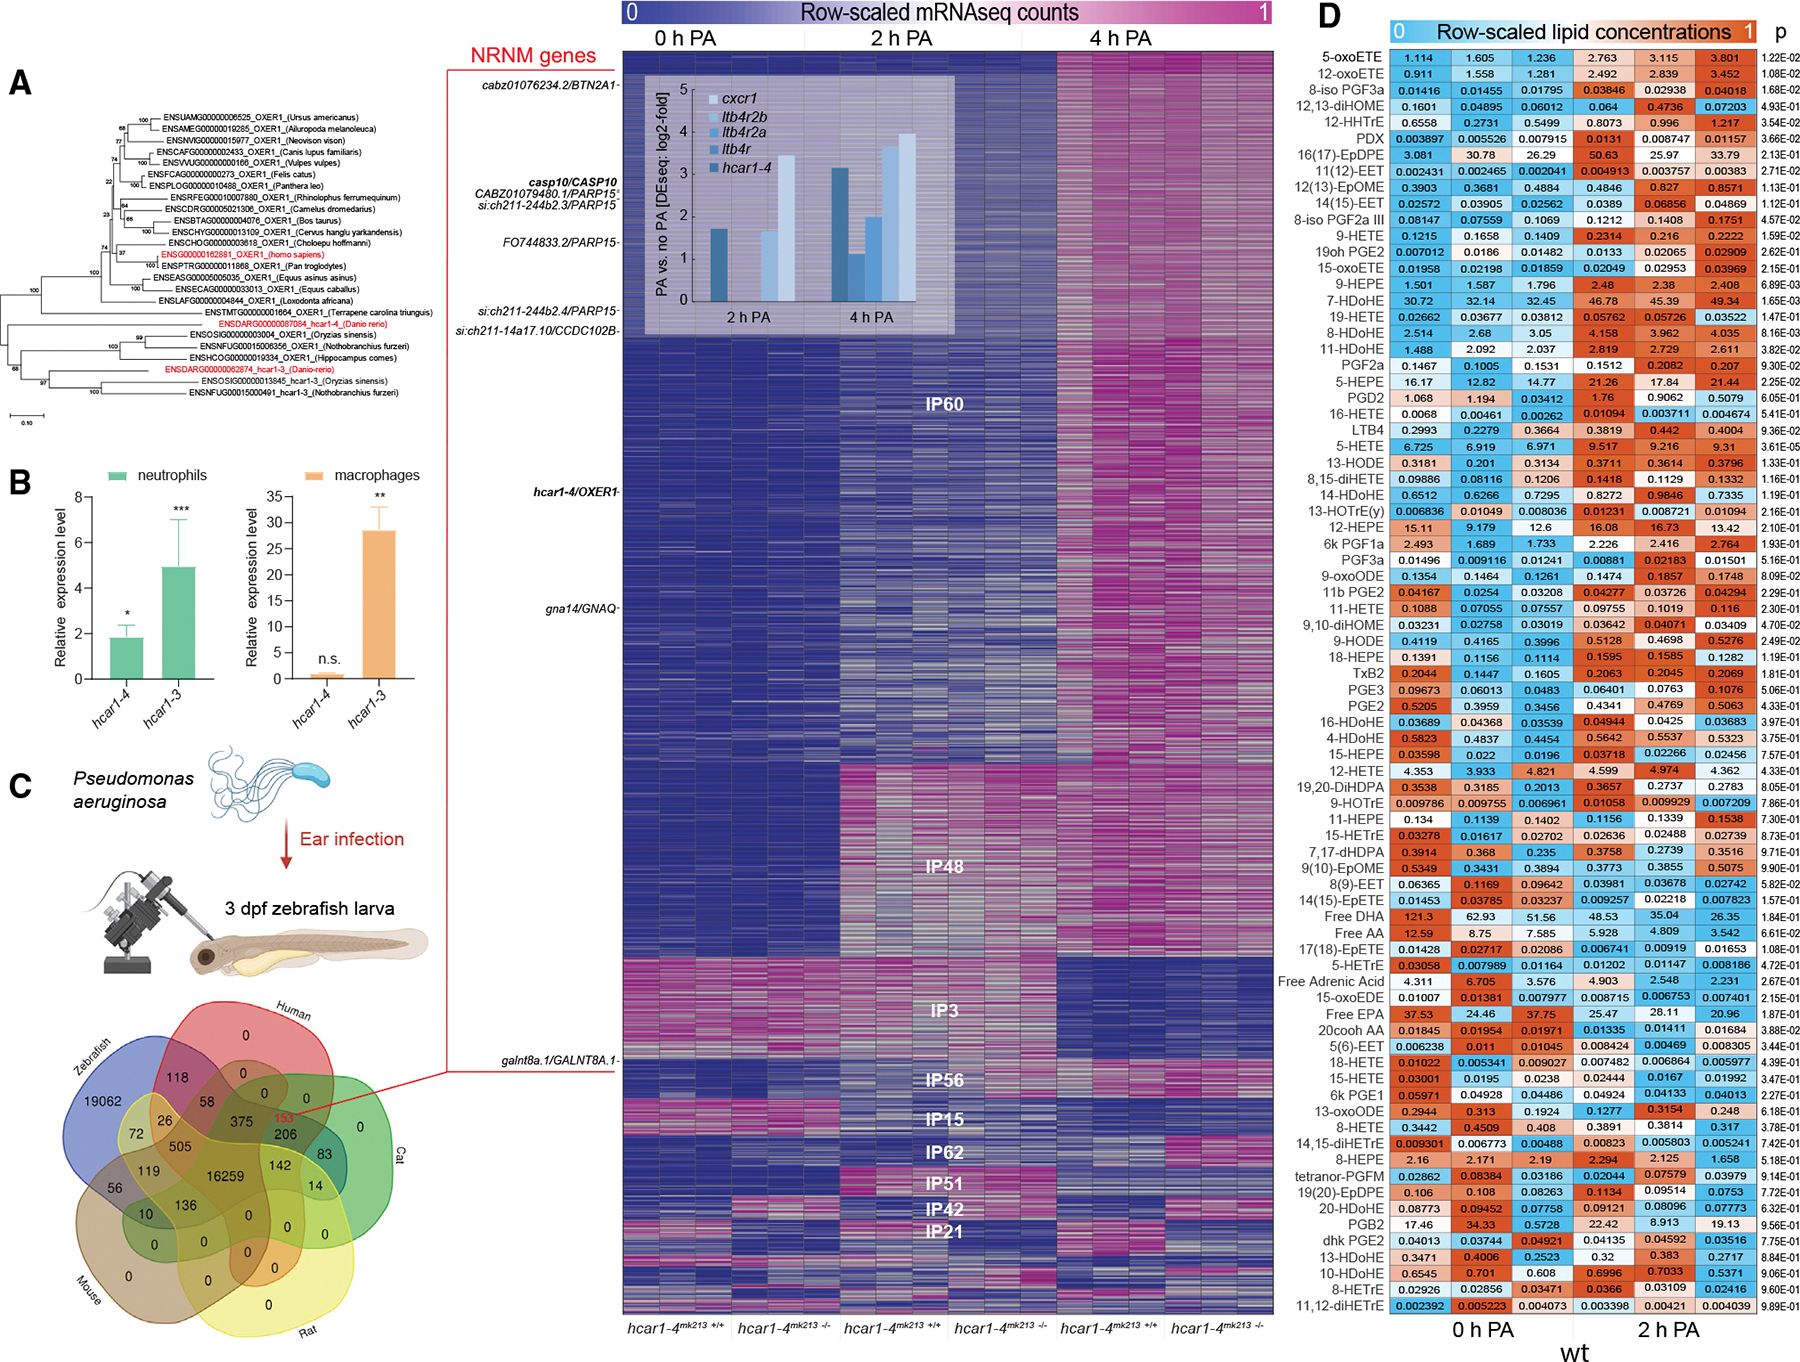
(A) OXER1 phylogenetic tree.
(B) Relative expression levels of hcar1–3 and hcar1–4 mRNA in leukocytes compared with the rest of the body determined by FACS-sorting of dissociated neutrophil (left panel, TG(lyz:pm2-mk2)) or macrophage (right panel, TG(mpeg1: eGFP)) reporter zebrafish larvae and qRT-PCR. Error bars, SD of three different pools of zebrafish leukocytes. *p < 0.05, **p < 0.01, ***p < 0.001, n.s., p > 0.05; Student’s t test (two tailed, two sample unequal variance test).
(C) Top left panel: experimental cartoon scheme. This figure was created with BioRender. Bottom left panel: Venn diagram of zebrafish genes with ENSEMBL orthologs (ENSEMBL release 107) in human, cat, mouse, and rat. Red number, number of DIOPT-filtered NRNM genes (see STAR Methods). Right panel: sorted sGCA heatmap of significantly regulated mRNA-seq expression profiles (fold-regulation > 2, padj < 0.05 by Benjamini and Hochberg method) with high similarity to the respective binary expression phenotypes (correlation distance < 0.25, Figure S1B, also see STAR Methods and MATLAB sGCA script). Color scale, mRNA-seq profiles are row-scaled between 0 (blue) and 1 (pink). Shown are three biological replicates per experimental condition. Heatmap inset: significant (padj < 0.05) fold-upregulation of select inflammatory receptor mRNAs 2 and 4 h after PA infection as calculated by DEseq2. DIOPT-filtered NRNM genes are marked on the left side of the heatmap (zebrafish gene/human ortholog). NRNM genes with “high”-ranked (criteria see STAR Methods) human orthologs are printed in bold.
(D) Heatmap of row-scaled lipid concentrations as measured by LIPIDMAPS full panel eicosanoid mass spectroscopical analysis. Color scale, relative lipid concentrations are row-scaled between 0 (blue) and 1 (orange). Boxed numbers, absolute lipid concentrations in pmol/mg tissue (~μM). Note that the color scale does not represent these absolute lipid concentrations, but that it highlights the relative changes for each lipid. Shown are three biological replicates (i.e., ~400 3 dpf zebrafish larvae per pool) per experimental condition. Numbers right of heatmap, p values of Student’s t test (two tailed, two sample unequal variance test) comparing 0 h PA vs. 2 h PA.
According to the ENSEMBL database (release 107), there are 206 not-rat-nor-mouse (NRNM) genes (Table S1), defined here as zebrafish genes conserved in human and cat but not in rat or mouse. This list includes some genes with known rodent homologs, such as the high-affinity LTB4 receptor (BLT1) and others. We used the DIOPT20 metasearch engine (version 9.0, Sept 2021) to filter out such potential false positives, which left us with 153 likely NRNM genes (Table S1). For illuminating their physiological roles, the zebrafish model is a compelling choice, because intravital imaging and genetic loss-of-function studies are prohibitively challenging in most non-rodent mammals.
Fluorescence-activated cell sorting (FACS) of dissociated leukocyte reporter larvae and quantitative RT-PCR (qRT-PCR) confirmed that the transcripts of the two zebrafish orthologs, hcar1–3 and hcar1–4, are enriched in neutrophils (Figure 1B).12,21 Unlike hcar1–4, hcar1–3 mRNA is also highly enriched in macrophages. To profile early transcriptional responses to infection, we performed mRNA sequencing (mRNAseq) of larvae before and 2 and 4 h after injection of Pseudomonas aeruginosa (PA) into the otic vesicle of 3 days post fertilization (dpf) zebrafish larvae as previously described (Figure 1C).22–24 The mRNAseq expression profiles were sorted by their correlation distance to all possible binary gene expression phenotypes by a novel gene correlation analysis method we developed for this study (Figure S1B, Table S2, first tab). Our simple Gene Correlation Analysis (sGCA) does not cluster gene expression profiles by their mutual correlation as other, unbiased clustering methods, but by their similarity to binary, “ideal phenotypes” (IPs, i.e., logical gates) defined by the experimental groups (Figure S1B). sGCA associated hcar1–4 with the largest inflammatory cluster (IP60), which comprises genes maximally induced at 4 h post infection (Figure 1C, Table S2, second and third tab). By its highest-ranking gene ontology terms, functional profiling classifies the IP60 cluster as “immune system process” and “defense response” (Table S2, fourth tab). Functional profiling results for all IP clusters are listed in Table S2. The time course of hcar1–4 expression upon infection is reminiscent of known immune genes, including cxcr1 (GPCR for interleukin 8) and ltb4r, ltb4r2a and ltb4r2b (high- and low-affinity GPCRs for LTB4) (Figure 1C, inset). Whereas hcar1–3 was hardly detectable by mRNAseq, qRT-PCR indicated its modest induction upon infection (Figure S1C). To test whether Hcar1–4 regulates inflammatory gene transcription, we generated two hcar1–4 mutant alleles (hcar1–4mk213 and hcar1–4mk214) using CRISPR-Cas9 (Figures S1D and S1E). IP21 and IP42 include genes either significantly induced or suppressed by hcar1–4 mutation. Although some of those genes are immune related, we did not detect significant inflammatory signatures by functional profiling. Hcar1–4 may be more a target than a regulator of inflammatory gene transcription. The zebrafish mucin mucms1 (567x down, P21) and caspase 6 (casp6a, 167x up, P42) are the most regulated genes in these IP clusters (Figure 1C, Table S2, second and third tab). Interestingly, pharmacologic OXER1 inhibition in monkeys was shown to decrease the number of mucus-producing cells in the bronchial epithelium,8 consistent with additional, non-inflammatory functions of the OXER1 pathway in mucosal homeostasis.
To test whether microbial infection gives rise to physiologically relevant concentrations of 5-oxoETE, we conducted liquid chromatography coupled mass spectroscopic analysis of infected zebrafish larvae at the UC San Diego LIPIDMAPS facility.25 The baseline concentrations of the 78 detected lipid species showed considerable differences, with the 5-oxoETE precursor 5-HETE being among the most abundant and significantly induced species. Whereas the baseline of this and other oxidized fatty acid derivatives may include contributions of passive sample oxidation, the baseline-corrected, infection-induced concentration changes are likely of biological origin. 5-oxoETE, but not LTB4, showed a strong and significant infection-induced ~2 μM increase over baseline (Figure 1D). According to earlier studies,12,26 this concentration range is optimal for attracting neutrophils in vitro and in vivo.
We next asked whether the OXER1 pathway conveys any relevant antimicrobial protection. Indeed, control of microbial growth and post-infection survival of hcar1–4 mutants were significantly reduced compared with wild-type (WT) sibling controls (Figures 2A–2C and S2A), yet rescued by ectopic expression of human OXER1 or Hcar1–4 fused with red fluorescent protein (mKate2, mk2) (Figures 2C and S2B). Since neutrophils are the main antimicrobial immune cell type in vertebrates, and because the observed 5-oxoETE levels are expected to mediate chemotaxis of human and zebrafish neutrophils,12,26 the reduced post-infection survival may be, at least in part, caused by a decrease in neutrophil recruitment. In line with earlier experiments using zebrafish tail fins,12 exposure to pure 5-oxoETE triggered significant neutrophil migration to infected ears in WT but not in hcar1–4mk214 mutant larvae under isotonic bathing conditions that block the endogenous release of AA-derived chemoattractants12,24,27 (Figure 2D). Importantly, Sudan black-staining revealed a pronounced decrease in neutrophil recruitment to the infected ears of hcar1–4 mutants under normal (hypotonic) infection conditions (Figures 2E, S2C, and S2D). At the same time, overall neutrophil counts between WT and mutant animals remained about the same (Figures S2E and S2F). Furthermore, after systematically infecting larvae by PA injection into the common cardinal vein/duct of Cuvier (CCV/DC),28 animal survival and neutrophil numbers in the caudal hematopoietic tissue (CHT) were significantly reduced in hcar1–4mk213 −/− but not WT larvae (Figures S2G–S2J). It remains to be delineated whether these latter observations reflect defects in leukocyte chemotaxis, degranulation, survival, or all the above. Collectively, our results suggest that 5-oxoETE/OXER1 signaling is broadly involved in infection defense.
Figure 2. The 5-oxoETE pathway mediates early antimicrobial neutrophil recruitment to infection sites.
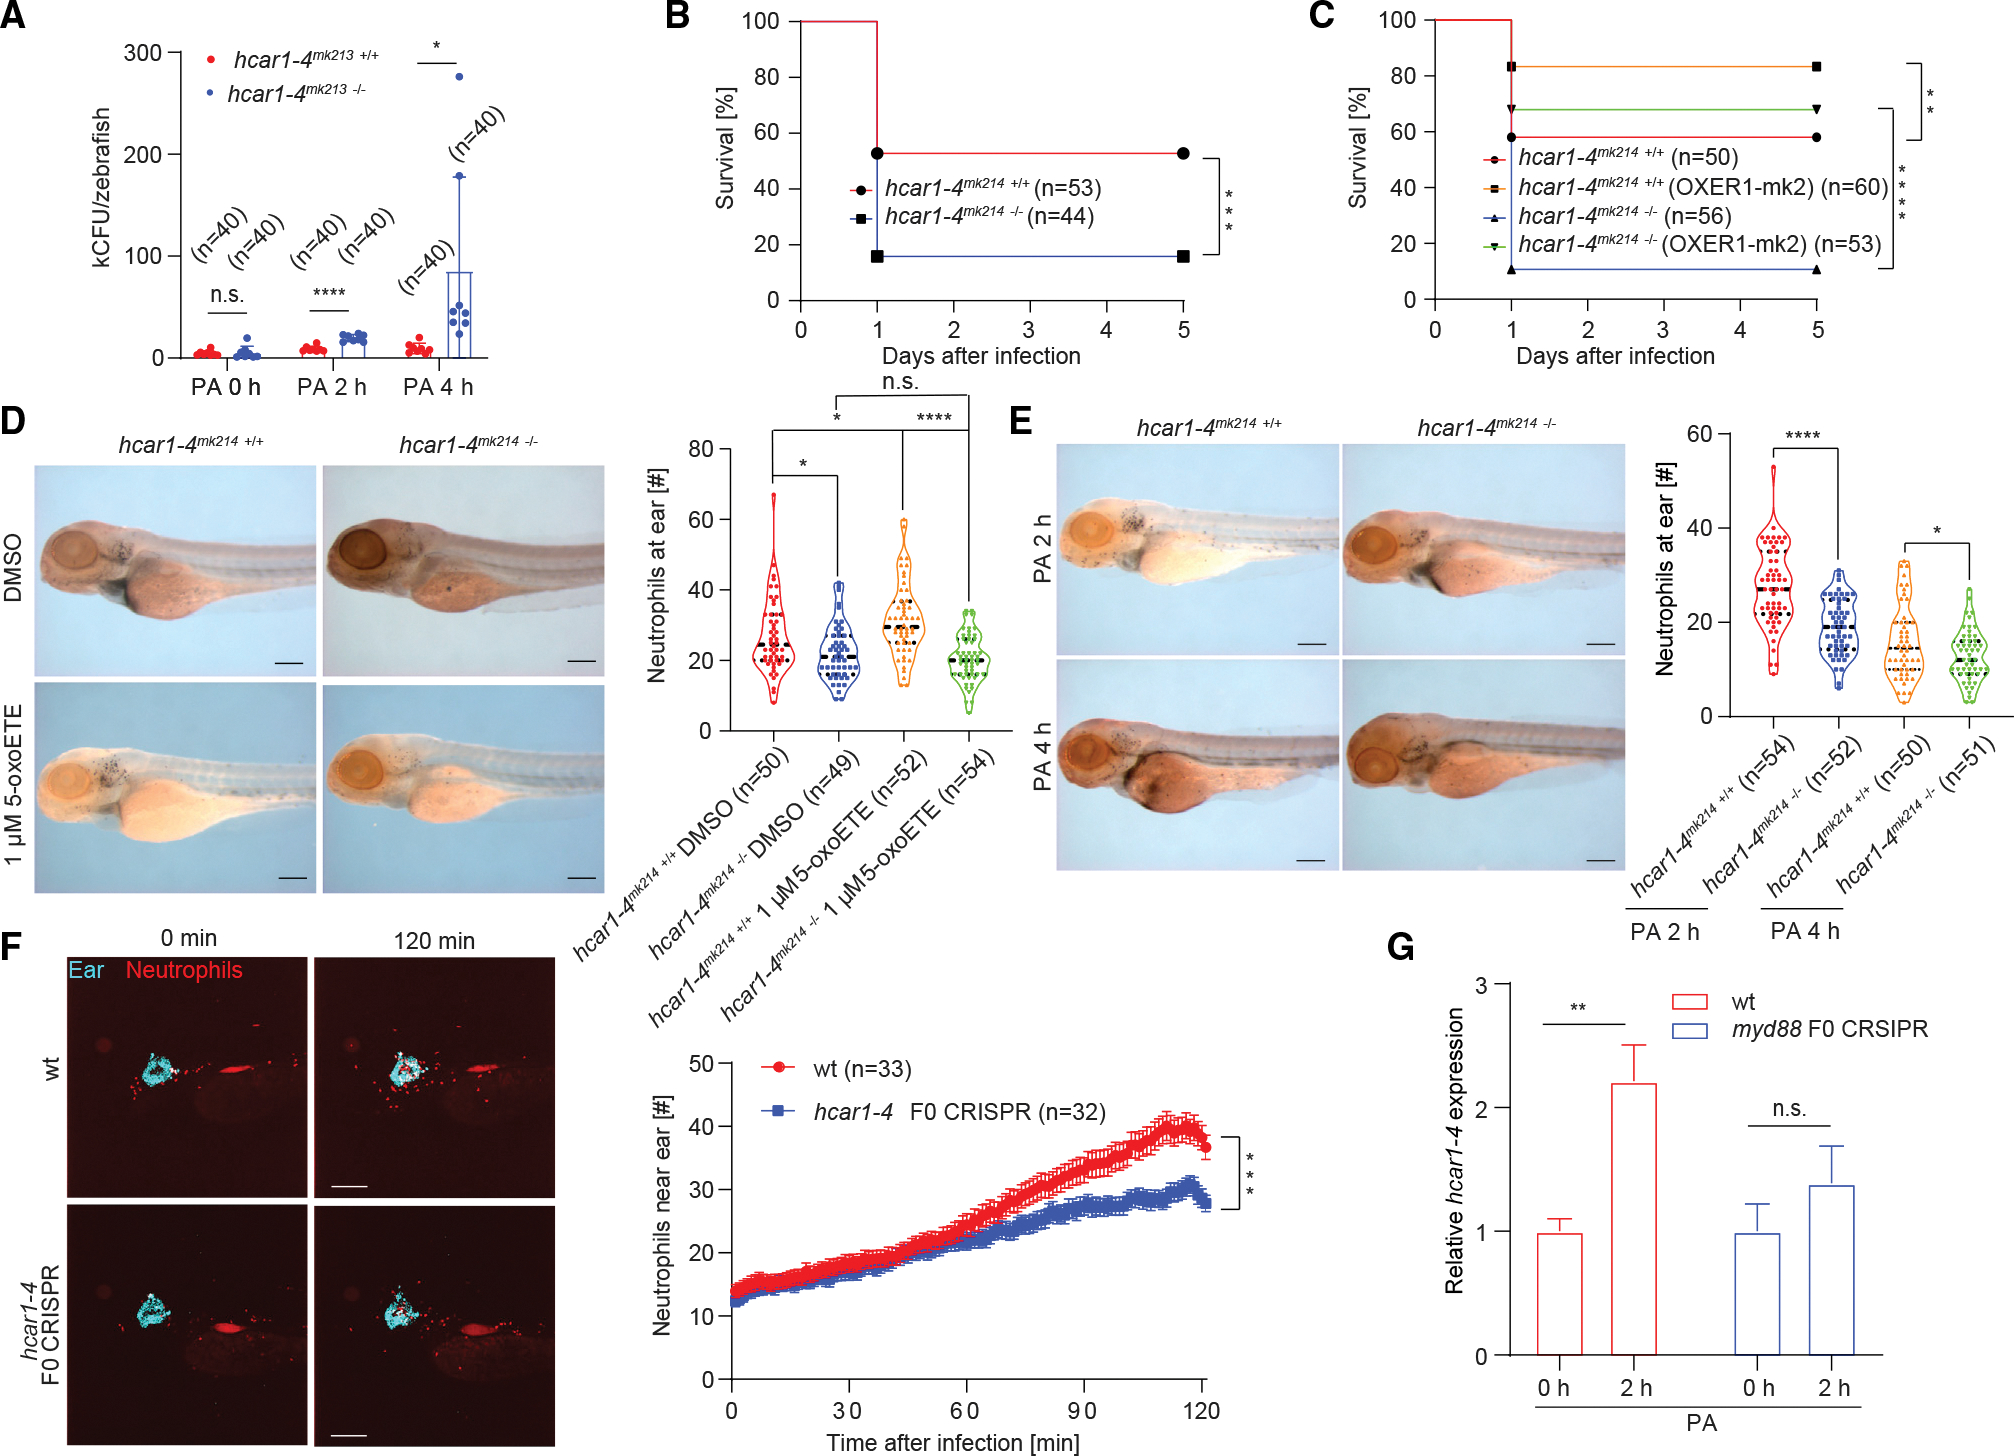
(A) Colony forming units (CFU) per infected larvae at indicated times after infection. *p < 0.05; ****p < 0.00001; Student’s t test (two tailed, two sample unequal variance test). Error bars, SD of eight independently infected zebrafish pools (five larvae per group) comprising a total of n = 40 larvae per pool.
(B and C) Meier-Kaplan survival plots of PA-infected hcar1–4mk214 +/+ (WT) and hcar1–4mk214 −/− larvae without (B) or with (C) ectopic expression of human OXER1 fused with mKate2 (OXER1-mk2). **p < 0.01; ***p < 0.001; ****p < 0.0001; log rank test. Parentheses, number of injected larvae per group.
(D) 5-oxoETE-dependent neutrophil recruitment to infected ears requires hcar1–4. Larvae were injected with PA mixed with pure 5-oxoETE (in DMSO) or DMSO alone as vehicle control. During infection and incubation, the larvae were kept under isotonic bathing conditions (Iso E3) to suppress osmotic tissue damage signals as previously described in Huang and Niethammer, 2018.24 Left panel, representative images of Sudan-black-stained neutrophils at the infected ears of WT and hcar1–4mk214 −/− larvae 2 h after ear injection. Scale bar, 200 μm. Right panel, quantification of neutrophil counts at the ears at the indicated times after infection. Violin plots lines denote first quartiles (top line), medians (middle line), third quartiles (bottom line). Violin plot points denote neutrophil counts in individual larvae. *p < 0.05; ****p < 0.0001; n.s., p > 0.05; Student’s t test (two tailed, two sample unequal variance test). N, total number of injected larvae per condition.
(E) Left panel: representative images of Sudan-black-staining of neutrophils at the infected ears of WT and hcar1–4mk214 −/− larvae. Scale bar, 200 μm. Right panel: quantification of neutrophil recruitment to the ears at the indicated times after infection. Violin plots lines denote first quartiles (top line), medians (middle line), and third quartiles (bottom line). Violin plot points denote neutrophil counts in individual larvae. *p < 0.05; ****p < 0.0001; Student’s t test (two tailed, two sample unequal variance test). Parentheses, total number of injected larvae.
(F) Live imaging of neutrophil recruitment to ear in WT and hcar1–4 F0 CRISPR larvae (TG(lyz:pm2-mk2) background). Left panel: representative time-lapse images at indicated times after infection. Cyan, fluorescent beads co-injected with PA into the ear. Red, mKate2-expressing neutrophils. Scale bar, 200 μm. Right panel: neutrophil number in a 390 μm × 390 μm × 100 μm box around the ear counted by 3D segmentation of confocal imaging stacks. Error bar, SEM of n infected WT (red) or F0 CRSIPR (blue) larvae. ***p < 0.001; Student’s t test (two tailed, two sample unequal variance test) applied to the final time point (t = 120 min).
(G) Relative mRNA expression levels of hcar1–4 at 2 h after PA ear infection as measured by qRT-PCR in 3 dpf zebrafish larvae (WT and myd88 F0 CRISPR). Actin was used as an internal control. Error bars, SD of three different pools of zebrafish larvae. **p < 0.01; n.s., p > 0.05; Student’s t test (two tailed, two sample unequal variance test).
See also Figures S2 and S3.
To monitor early leukocyte recruitment to infected ears in situ, we introduced hcar1–4 and hcar1–3 F0 CRISPR mutations into fluorescent leukocyte reporter lines29,30 (Figures 2F, S2K–S2P, S3A–S3C). Live imaging confirmed that leukocyte infiltration into the ear region of hcar1–4, but not hcar1–3, F0 CRISPR larvae became attenuated at ~1 h after infection (Figures 2F and S3A, Videos S1 and S2), while early macrophage recruitment was unaffected by mutation of either receptor (Figures S3B and S3C, Videos S3 and S4). Interestingly, after tail fin amputation, hcar1–4 mutants (Figures S3D and S3E) and morphants12 showed defective neutrophil recruitment during the first hour after injury, that is, earlier than observed for neutrophil recruitment to infected ears (Figure 2). Conceivably, this temporal offset might be caused by a limited availability of 5-oxoETE ligand or Hcar1–4 receptor during the first hour after infection. 5-oxoETE synthesis via 5-HEDH or non-enzymatic mechanisms is regulated by oxidative stress,31,32 and redox differences between zebrafish tail fin wounds and infection sites that could impinge on delayed 5-oxoETE synthesis have been previously noted by others.22 Likewise, it is possible that initially only a subpopulation of neutrophils (e.g., those in the CHT) expresses enough Hcar1–4 to immediately respond to 5-oxoETE, and that microbial pattern recognition through Toll-like receptors (TLRs) is required for a more uniform if delayed responsiveness to 5-oxoETE. In line with this idea, knockdown of the TLR-adaptor molecule Myd88 by F0 CRISPR blunted the infection-induced hcar1–4 expression (Figures 1C and 2G). To further explore hcar1–4’s relationship with microbial pattern recognition, we perturbed Toll- and NOD-like receptor signaling by CRISPR F0 of myd88 and pycard33,34 both in WT and hcar1–4mk214 −/− animals (Figures S4A–S4F): myd88, pycard, and hcar1–4 mutation all caused similar neutrophil recruitment defects (Figures 3A and 3B), which were, however, not further aggravated when myd88 or pycard were mutated together with hcar1–4. This suggests that hcar1–4, myd88, and pycard are part of a pathway, in which microbial pattern recognition stimulates hcar1–4 expression.
Figure 3. Oxoeicosanoid and not LTB4 signaling regulates early neutrophil recruitment along with microbial pattern recognition.
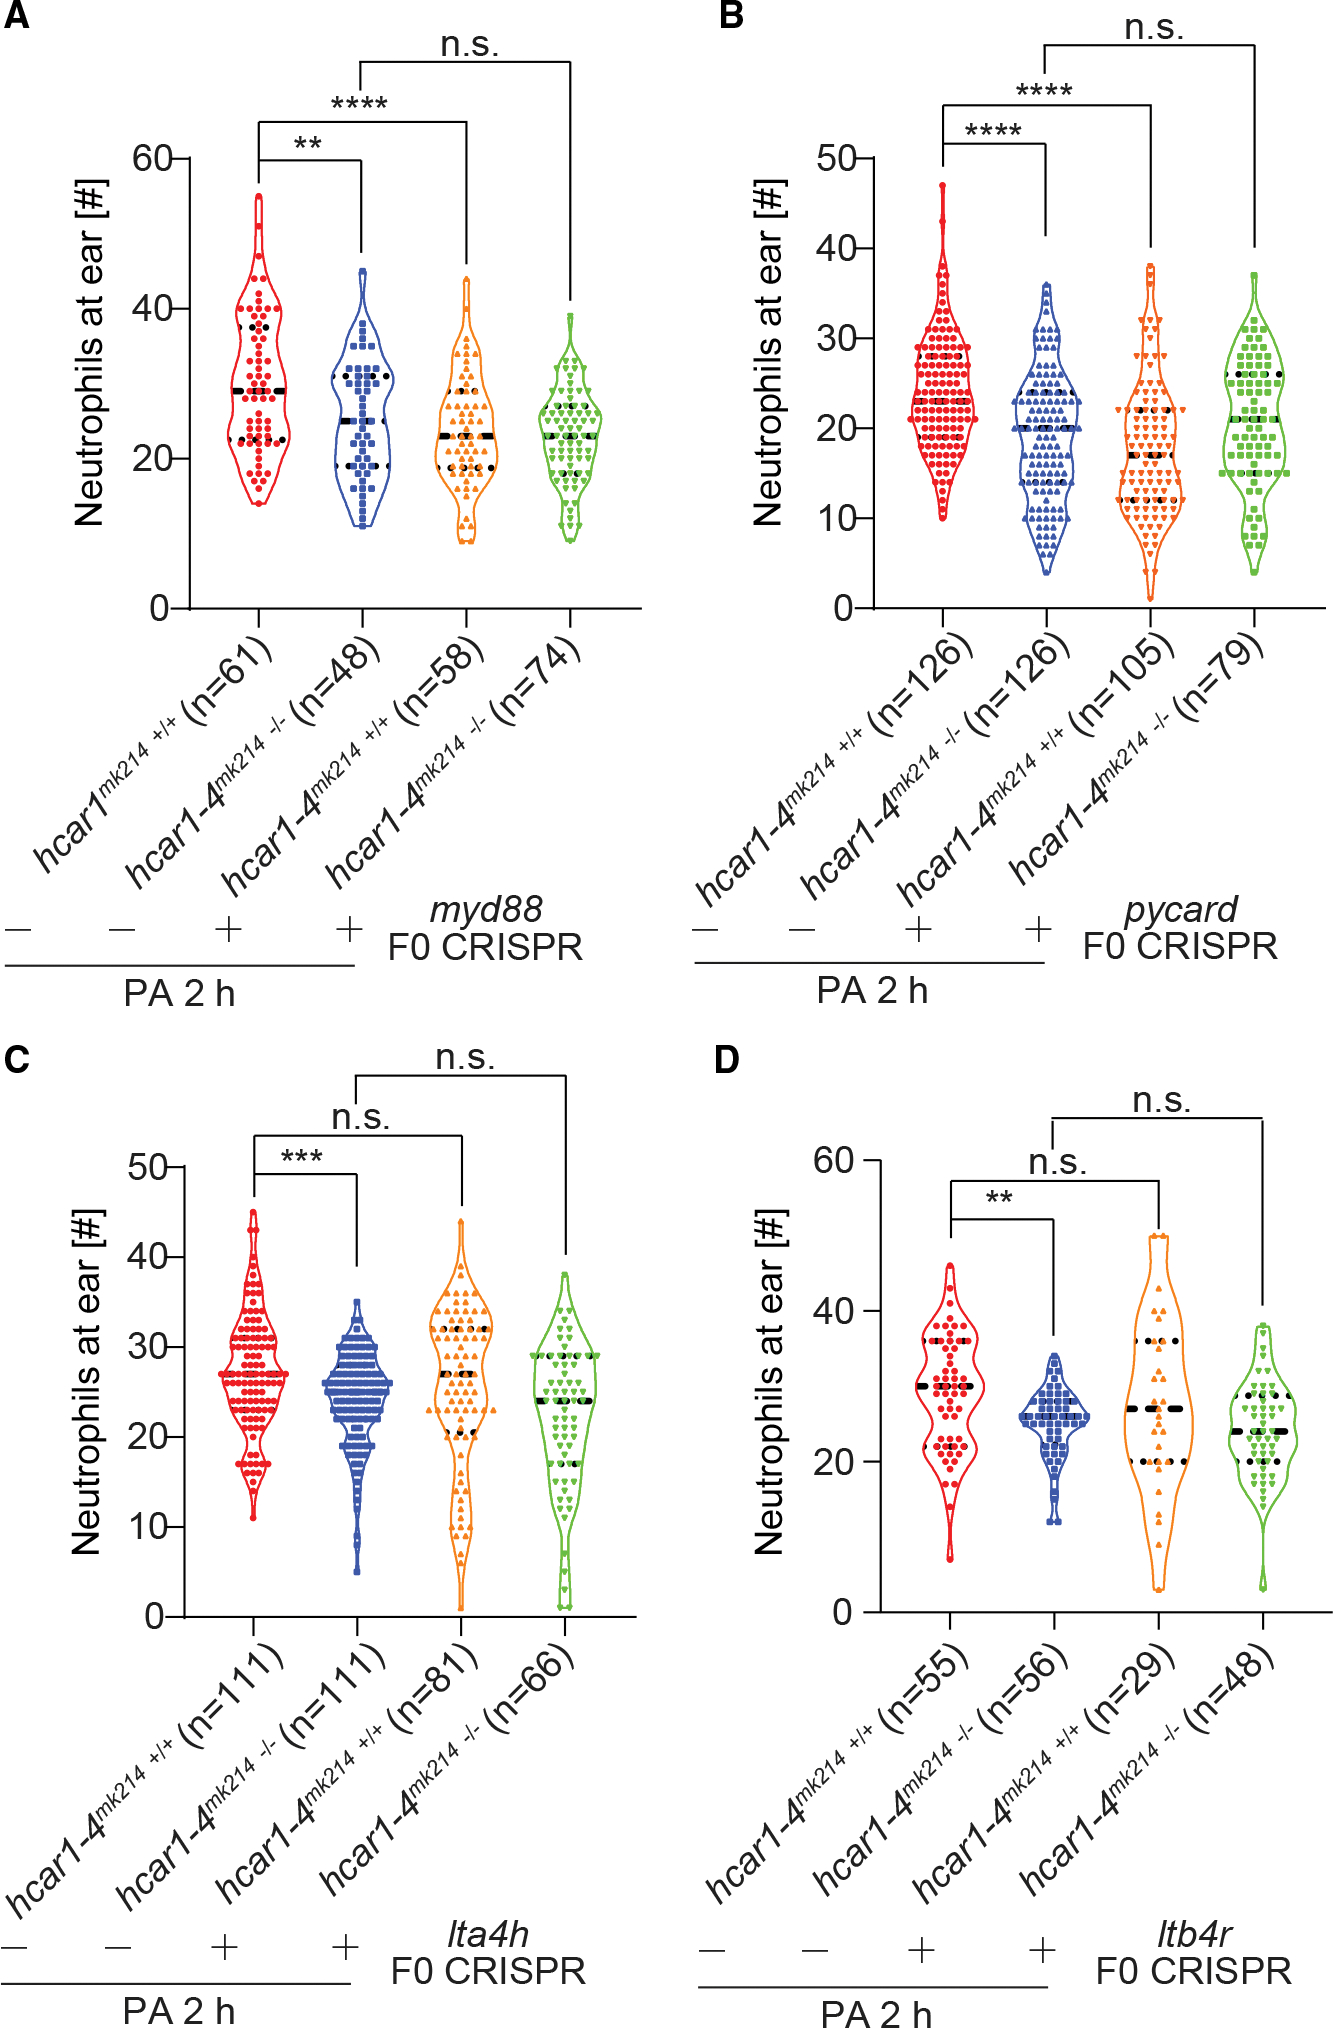
(A and B) Myd88 and pycard mutations (F0 CRISPR) inhibit early neutrophil recruitment to infected ears to a similar extent as hcar1–4mk214 −/− mutation does but without having an additive effect to the latter.
(C and D) Unlike the hcar1–4mk214 −/− mutation, lta4h and ltb4r F0 CRISPR mutations do not inhibit early neutrophil recruitment to infected ears. Violin plot points denote counts of Sudan-black-stained neutrophils in individual larvae. Violin plots lines denote first quartiles (top line), medians (middle line), and third quartiles (bottom line). **p < 0.01; ***p < 0.001; ****p < 0.0001; n.s., p > 0.05; Student’s t test (two tailed, two sample unequal variance test). Parentheses, total number of injected larvae.
See also Figure S4.
To compare the relative chemotactic role of 5-oxoETE-OXER1 during the early infection response to LTB4—one of the most studied chemotactic lipid pathways to date—we mutated lta4h and ltb4r using F0 CRISPR in WT and hcar1–4mk214 −/− animals (Figures S4G–S4L). Through its high-affinity receptor Ltb4r (BLT1), LTB4 acts as a chemotactic relay signal during neutrophil swarming in mouse and zebrafish.35–37 However, we did not observe a significant neutrophil recruitment defect of ltb4h or ltb4r mutants, alone or in combination with hcar1–4 mutation, within 2 h after ear infection (Figures 3C and 3D). Whereas BLT1 gene deletion in mouse attenuates neutrophil swarming to dermal ear wound sites as early as ~30 min after injury,35 our data and previous studies provide little support for such immediate effect in zebrafish.12,37,38 As of 2017, most reported clinical trials targeting the LTB4 pathway were unsuccessful,39 leaving its precise pathophysiological role in humans largely undefined.
DISCUSSION
Several possible explanations for the species-dependent differences in inflammatory LTB4 signaling (Figure 4) deserve further investigation. For one, in animals that lack OXER1, its function during early inflammation might have been replaced by other receptors, such as BLT1. An entanglement of NRNM genes, such as OXER1, in inflammatory gene circuits could explain at least some of the long-noted differences between human and mouse inflammatory programs.1,2 Although rodents are often a better proxy for human biology than fish, for example, when studying mammalian reproduction, our work suggests that the opposite case can also apply. This highlights a perhaps less obvious and little exploited strength of the zebrafish model: using zebrafish to target blind spots of mouse genetics can illuminate the physiological and pathophysiological functions of genetically otherwise inaccessible, inflammatory mechanisms as previously shown for human adenosine deaminase 2 (ADA2)40 and now for OXER1.
Figure 4. Hypothetical scheme of inflammatory mediator sequence after injury and infection.
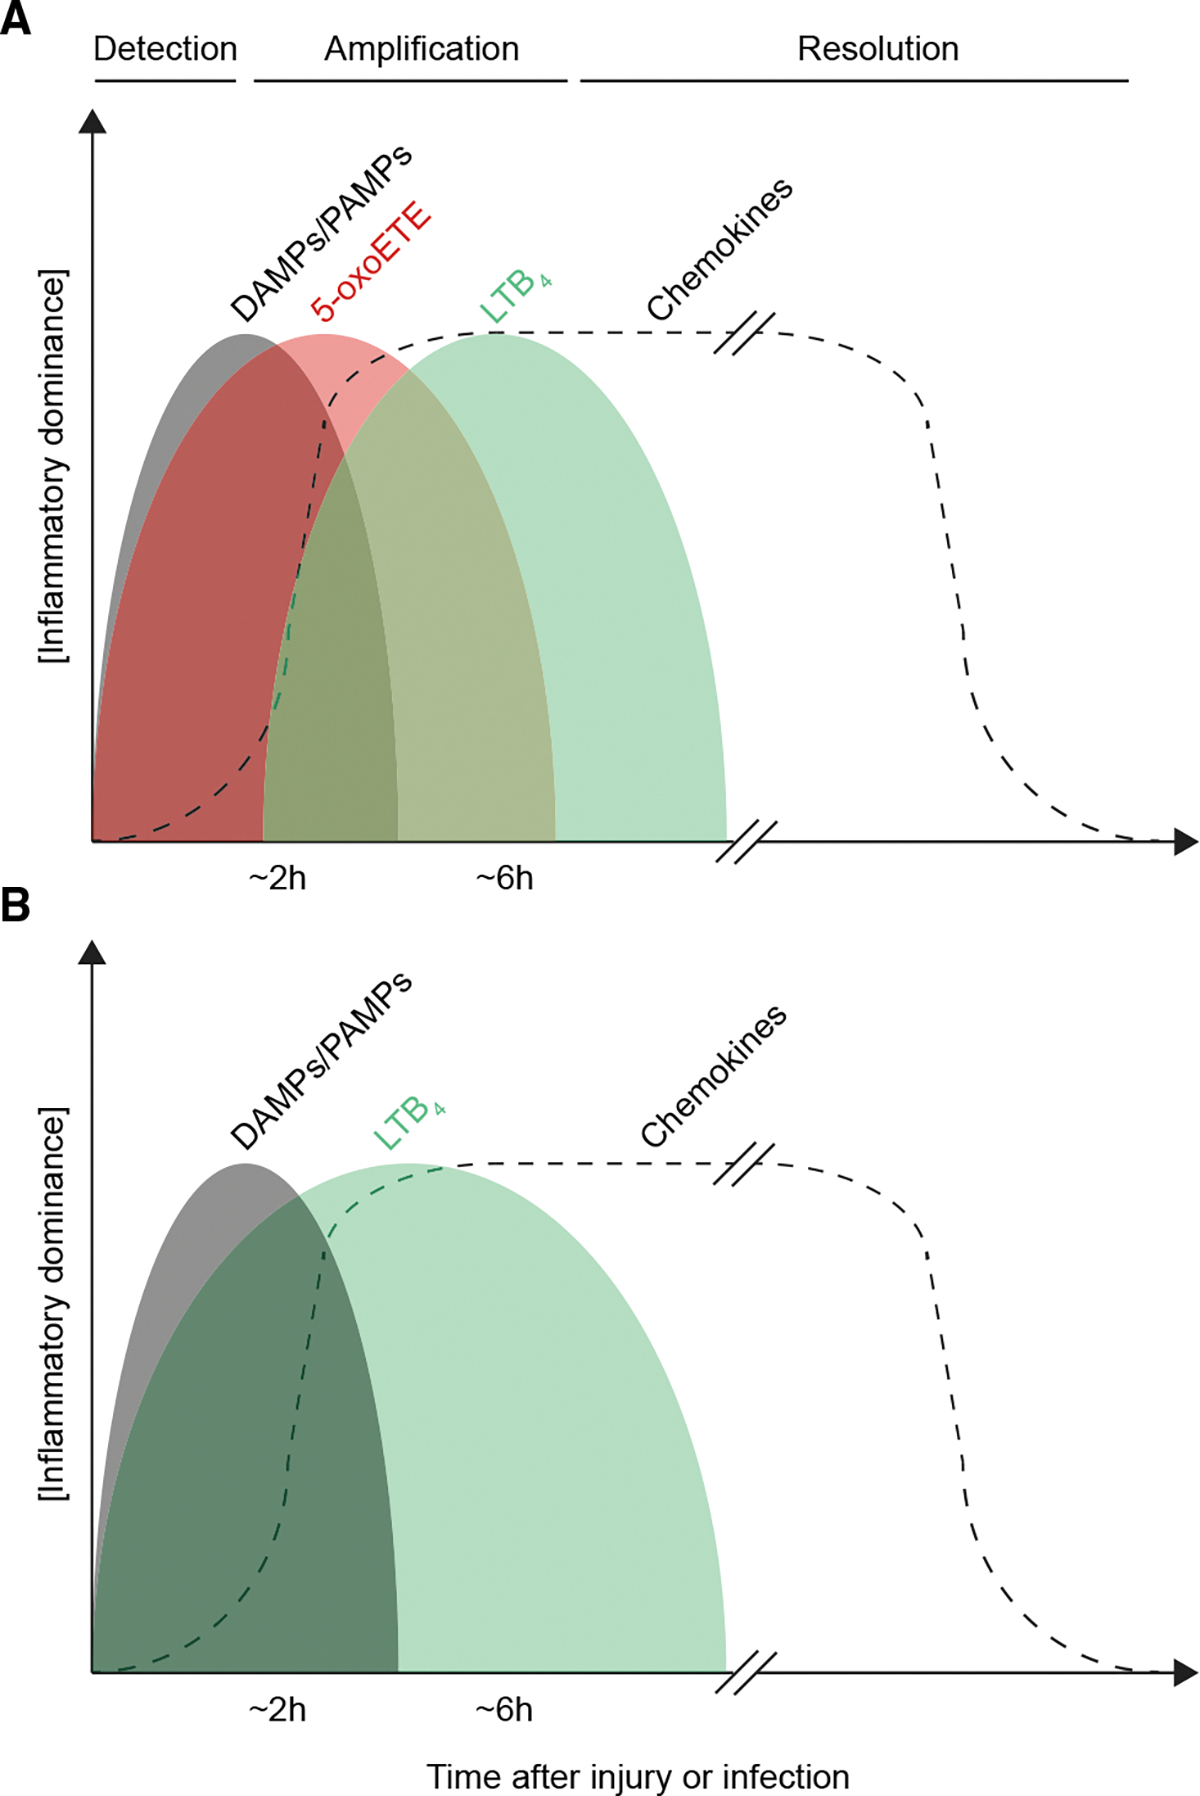
Hypothetical cartoon scheme of approximate regulatory timelines in (A) non-rodent and (B) rodent inflammation. DAMPs, damage associated molecular patterns. PAMPs, pathogen associated molecular patterns.
Limitations of the study
Hcar1–4 is broadly expressed in various tissues besides leukocytes. Our current work does not address potential tissue specific functions of the receptor; that is, it does not formally distinguish how myeloid and epithelial functions of Hcar1–4 contribute to the observed phenotypes. The F0 CRISPR approaches used here may underestimate the effects of a full (i.e., non-mosaic), homozygous gene mutation. The CCV infection experiment does not delineate the precise cellular mechanism (defect in chemotaxis, leukocyte survival, or degranulation, etc.) by which Hcar1–4 loss causes the observed phenotypes (survival defect, decreased Sudan black-staining). Our data do not formally exclude that structurally related lipids, such as 5-oxo-EPE (not measured here), are also ligands for Hcar1–4.
STAR★METHODS
RESOURCE AVAILABILITY
Lead contact
Further information and requests for resources and reagents should be directed to and will be fulfilled by the lead contact, Philipp Niethammer (NiethamP@mskcc.org).
Materials availability
All unique/stable reagents generated in this study are available from the lead contact with a completed Materials Transfer Agreement.
Data and code availability
RNA-sequencing data are available at the GEO data depository under number GSE201604. This accession number is also listed in the key resources table.
All original code has been deposited at Zenodo and is publicly available as of the date of publication. DOI (https://doi.org/10.5281/zenodo.7419586) is also listed in the key resources table. The sGCA script and MATLAB app are also available on GitHub (https://github.com/niethamp/sGCA-Ma-et-al.-2022-).
Any additional information required to reanalyze the data reported in this paper is available from the lead contact upon request.
KEY RESOURCES TABLE.
| REAGENT or RESOURCE | SOURCE | IDENTIFIER |
|---|---|---|
|
| ||
| Bacterial and virus strains | ||
|
| ||
| Wt PA14 | Joao Xavier (MSKCC) | N/A |
|
| ||
| Chemicals, peptides, and recombinant proteins | ||
|
| ||
| Blue-green (Cyan) fluorescent beads (Ex/Em=430/465) | Thermo Fisher | Cat#F13080 |
| Red fluorescent beads (Ex/Em=580/605) | Thermo Fisher | Cat#F8810 |
| Dextran, Fluorescein, 500,000 MW, Anionic, Lysine Fixable | Invitrogen | Cat#D7136 |
| Agarose LM | Gold Biotechnology | Cat#A-204-100 |
| 5-oxoETE | Cayman | Cat#34250 |
| Dimethyl sulfoxide (DMSO) | Sigma | Cat#D8418 |
| ethyl 3-aminobenzoate methanesulfonate (Tricaine) | Sigma | Cat#E10521 |
| Triton X-100 | Sigma | Cat#SLBW7103 |
| Phosphate buffered saline (PBS) | Sigma | Cat#79382 |
| FastDigest NotI restriction enzyme | Thermo Fisher | Cat#FD0593 |
| FastDigest BstXI restriction enzyme | Thermo Fisher | Cat#FD1024 |
| FastDigest BseLI restriction enzyme | Thermo Fisher | Cat#FD1204 |
| FastDigest MseI (Tru1I) restriction enzyme | Thermo Fisher | Cat#ER0981 |
| FastDigest BseNI restriction enzyme | Thermo Fisher | Cat#FD0884 |
| FastDigest HpaII restriction enzyme | Thermo Fisher | Cat#FD0514 |
| FastDigest Eco47I restriction enzyme | Thermo Fisher | Cat#FD0314 |
| FastDigest OliI restriction enzyme | Thermo Fisher | Cat#FD1634 |
| FastDigest PvuI restriction enzyme | Thermo Fisher | Cat#FD0624 |
| FastDigest Bsp1286I (SduI) restriction enzyme | Thermo Fisher | Cat#FD0654 |
| FastDigest SmlI (SmoI) restriction enzyme | Thermo Fisher | Cat#ER1981 |
| FastDigest SalI restriction enzyme | Thermo Fisher | Cat#FD0644 |
|
| ||
| Critical commercial assays | ||
|
| ||
| mMessage mMachine SP6 Kit | Thermo Fisher | Cat#AM1340 |
| Trizol reagent | Thermo Fisher | Cat#15596026 |
| RevertAid First Strand cDNA Synthesis Kit | Thermo Fisher | Cat#K1621 |
| RNeasy Plus Micro kit | QIAGEN | Cat#74034 |
| High-Capacity cDNA Reverse Transcript Kit | Thermo Fisher | Cat#4368814 |
| Maxima SYBR Green/Fluorescein qPCR Master Mix | Thermo Fisher | Cat#K0242 |
|
| ||
| Deposited data | ||
|
| ||
| RNA-seq | This paper | GSE201604 |
| Code | This paper | https://doi.org/10.5281/zenodo.7419586 |
|
| ||
| Experimental models: Organisms/strains | ||
|
| ||
| Zebrafish: wt casper | White et al., 200841 | https://doi.org/10.1016/j.stem.2007.11.002 |
| Zebrafish: TG(Iyz:pm2-mk2) | Stoddard et al., 201942 | https://doi.org/10.1038/s41598-018-36771-9 |
| Zebrafish: TG(mpeg1:eGFP) | Stoddard et al., 201942 | https://doi.org/10.1038/s41598-018-36771-9 |
| Zebrafish: hcar1–4mk213 +/+ | This paper | N/A |
| Zebrafish: hcar1–4mk213 −/− | This paper | N/A |
| Zebrafish: hcar1–4mk214 +/+ | This paper | N/A |
| Zebrafish: hcar1–4mk214 −/− | This paper | N/A |
|
| ||
| Oligonucleotides | ||
|
| ||
| See Table S3 for Oligonucleotides | This paper | N/A |
|
| ||
| Software and algorithms | ||
|
| ||
| ImageJ/FIJI (ImageJ 1.53t, v2.9.0.) | Johannes Schindelin | https://fiji.sc/ |
| MATLAB (9.12.0.1975300 (R2022a) Update 3) | Mathworks Inc., USA | http://mathworks.com |
| Bioinformatics Toolbox Version 4.16 (R2022a) | Mathworks Inc., USA | http://mathworks.com |
| Computer Vision Toolbox Version 10.2 (R2022a) | Mathworks Inc., USA | http://mathworks.com |
| Curve Fitting Toolbox Version 3.7 (R2022a) | Mathworks Inc., USA | http://mathworks.com |
| Deep Learning Toolbox Version 14.4 (R2022a) | Mathworks Inc., USA | http://mathworks.com |
| Fuzzy Logic Toolbox Version 2.9 (R2022a) | Mathworks Inc., USA | http://mathworks.com |
| Global Optimization Toolbox Version 4.7 (R2022a) | Mathworks Inc., USA | http://mathworks.com |
| Image Processing Toolbox Version 11.5 (R2022a) | Mathworks Inc., USA | http://mathworks.com |
| MATLAB Compiler Version 8.4 (R2022a) | Mathworks Inc., USA | http://mathworks.com |
| Mapping Toolbox Version 5.3 (R2022a) | Mathworks Inc., USA | http://mathworks.com |
| Optimization Toolbox Version 9.3 (R2022a) | Mathworks Inc., USA | http://mathworks.com |
| Parallel Computing Toolbox Version 7.6 (R2022a) | Mathworks Inc., USA | http://mathworks.com |
| Partial Differential Equation Toolbox Version 3.8 (R2022a) | Mathworks Inc., USA | http://mathworks.com |
| Sensor Fusion and Tracking Toolbox (R2022a) | Mathworks Inc., USA Version 2.3 | http://mathworks.com |
| Signal Processing Toolbox Version 9.0 (R2022a) | Mathworks Inc., USA | http://mathworks.com |
| Statistics and Machine Learning Toolbox Version 12.3 (R2022a) | Mathworks Inc., USA | http://mathworks.com |
| NIS imaging software (Nikon, v5.11.01) | Nikon Microscope Product | https://www.microscope.healthcare.nikon.com/products/software/nis-elements |
| Prism (GraphPad, v8.3.0) | GraphPad Software | https://www.graphpad.com/scientific-software/prism |
| Imaris (Bitplane, v9.6.0) | Molecular Cytology Core Facility at MSKCC |
https://imaris.oxinst.com/ |
EXPERIMENTAL MODEL AND SUBJECT DETAILS
General fish procedures
Adult wt and transgenic reporter casper41 zebrafish were maintained at the Memorial Sloan Kettering Cancer Center (MSKCC) Zebrafish Core Facility43 and subjected to experiments according to institutional animal healthcare guidelines with the approval of the Institutional Animal Care and Use Committee (IACUC) of MSKCC. For injection and wounding assays, 2.5–3 days post-fertilization (2.5–3 dpf) larvae were anesthetized in standard hypotonic E3 medium (5 mM NaCl, 0.17 mM KCl, 0.33 mM CaCl2, 0.33 mM MgSO4) containing 0.2 mg/mL ethyl 3-aminobenzoate methanesulfonate (Tricaine/Syncaine, Sigma, E10521). For the 2.5–3 dpf zebrafish larvae used in this study, sex cannot be determined and is unlikely to influence the biological processes under study.
METHOD DETAILS
Bacterial strains and growth conditions
The wild-type (wt) Pseudomonas aeruginosa (strain PA14) used here was originally provided by Dr. Joao Xavier (MSKCC, New York, NY).24 PA14 were grown in lysogeny broth (LB) medium. To prepare the final inoculum, the bacteria suspension was diluted or pelleted to achieve the desired bacterial density (OD600 = 7).
Bacterial infection through ear (local) or common cardinal vein/duct of cuvier (CCV/DC) (systemic) injection
PA ear injection was performed as follows24: Fluorescent beads, blue-green (Cyan) (Ex/Em = 430/465) (Thermo Fisher, F13080) or Red (Ex/Em = 580/605) (Thermo Fisher, F8810) FluoSphere were mixed 1:1 with bacterial suspensions prior to injection. 1 μM 5-oxoETE (Cayman, cat#34250) in dimethyl sulfoxide (DMSO, Sigma, D8418) was mixed with PA in isotonic E3 (standard E3 + 140 mM NaCl) and injected into the otic vesicle (i.e., ear) of larvae. CCV/DC injection was conducted with 2.3 nL PA14 (OD600 = 7),44 dextran (Invitrogen, D7136) which was dissolved in 1× phosphate buffered saline (PBS, Sigma, 79,382) at concentration of 1 mg/mL was used to monitor success of CCV/DC injection. We performed ear and CCV/DC injections with ~2 × 10⁴ CFU per injection.
Tail fin amputation
For wounding experiments, the tail fin tips of anesthetized 2.5–3 dpf larvae were removed with a surgical microblade (Fine Science Tools, 10,318) at the boundary of the notochord without injuring the notochord.45
Sudan-black staining
To visualize neutrophil recruitment, larvae were fixed at indicated times after wounding or ear infection using 4% formaldehyde in 1× PBS overnight at 4°C, and then stained with Sudan-black for 30 min. The stained zebrafish larvae were washed three times in 70% ethanol followed by rehydration with PBST for 5 min. Finally, the larvae were washed with depigmentation solution (10% KOH, 30% H2O2) and twice in PBST prior to imaging.46
Generation of hcar1–4 mutant lines and genotyping
Four independent gRNAs (hcar1–4-sgRNA-1, hcar1–4-sgRNA-2, hcar1–4-sgRNA-3, hcar1–4-sgRNA-4) of hcar1–4 (ENSDARG0000 0087084) were designed and ordered from IDT (Integrated DNA Technologies). The Cas9-gRNA (single hcar1–4-sgRNA-1 or four hcar1–4-sgRNA-1, hcar1–4-sgRNA-2, hcar1–4-sgRNA-3, hcar1–4-sgRNA-4) ribonucleoprotein complex solution was injected into the cytoplasm of one-cell-stage zebrafish embryos. After the injected F0 larvae had been grown to sexual maturity (2–3 months post-fertilization), individual F0 adults were crossed to wild-type adults to get F1 progeny. These F1 larvae were then grown to sexual maturity, and genomic DNA was isolated from their tailfins for genotyping. To this end, the tailfins were partially amputated and suspended in 250 μL of 50 mM NaOH, and then incubated at 95°C for 10 min. Then, samples were cooled on ice for 10 min, neutralized with 25 μL of 1M Tris-HCl (pH 8) and vortexed. The genotyping primers are listed in Table S3. PCR products from F1 hcar1–4-sgRNA-1 adult fish were incubated with FastDigest BstXI (Thermo Fisher Scientific; FD1024) enzyme at 37°C overnight, and the reaction mixture was separated by agarose gel electrophoresis. F1 heterozygous adults were identified by the presence of three DNA fragments (~422, 269 and 153 bp). The ~422 bp product represents a mutant allele for which the BstXI site has been destroyed by Cas9-induced mutation. The ~422 bp band was isolated from agarose and sequenced by Sanger sequencing. The F1 heterozygous adult zebrafish with the frameshiftmutation of interest (11 bp insertion, hcar1–4mk213, Figure S1) were crossed to homozygosity. PCR products from F1 hcar1–4-sgRNA-1, hcar1–4-sgRNA-2, hcar1–4-sgRNA-3 and hcar1–4-sgRNA-4 heterozygous adult zebrafish were separated by agarose gel electrophoresis. The F1 heterozygous adult zebrafish with the large truncation of interest (313 bp, hcar1–4mk214, Figure S1) were crossed to get F2 homozygous mutant hcar1–4mk214 progeny.
F0 CRISPR gene perturbation approach
Potential gRNA target sites were identified using the web program CHOPCHOP (http://chopchop.cbu.no/index.php). All gRNA target sequences are listed in STAR Methods. Three independent gRNAs for hcar1–4 (ENSDARG00000087084), myd88 (ENSDARG00000010169), pycard (ENSDARG00000040076), ltb4r (ENSDARG00000032631), and four independent gRNAs for hcar1–3 (ENSDARG00000062874), and lta4h (ENSDARG00000006029) were designed and ordered from IDT. These target-specific Alt-R™ crRNA (Crispr RNA) and common Alt-R tracrRNA (Trans-Activating Crispr RNA) were dissolved in nuclease-free duplex buffer (IDT; 11–01-03–01) to yield a 100 μM stock solution. To prepare the crRNA:tracrRNA duplex, equal volumes of 100 μM Alt-R crRNAs (1:1:1:1 or 1:1:1) and 100 μM Alt-R tracrRNA stock solutions were mixed with nuclease-free duplex buffer to a final concentration of 10 μM each. The mixture was subsequently heated to 95°C for 5 min, and then cooled down to room temperature. ALT-R S.p. Cas9 Nuclease (IDT, 1081058) was diluted to 1 mg/mL with Cas9 working buffer (20 mM HEPES, 150 mM KCl, pH 7.5). The Cas9-gRNAs ribonucleoprotein complex was assembled by combining the crRNA:tracrRNA duplex and Cas9 protein solutions as 1:1 (vol/vol). Prior to microinjection, the Cas9-gRNAs ribonucleoprotein complex solution was incubated at 37°C for 5 min and placed at room temperature. Approximately 2.3 nL of the Cas9-gRNAs ribonucleoprotein complex solution was injected into the cytoplasm of one-cell-stage zebrafish embryos. At 2.5–3 dpf, genomic DNA was isolated from 18 individual F0 larvae for genotyping. Briefly, 50 μL of 50 mM NaOH was added to each larvae and incubated at 95°C for 10 min, subsequently, the genomic DNA was placed on ice and 5 μL of 1 M Tris-HCl (pH 8.0) was added.47 Each specific target sequence of interest was PCR amplified from the genomic DNA samples with the primers listed in Table S3. Next, PCR products were incubated with the FastDigest restriction enzymes (BstXI for hcar1–4-sgRNA-1 product, BseLI for hcar1–4-sgRNA-5 product, MseI for hcar1–4-sgRNA-6 product; BseNI for hcar1–3-sgRNA-1 product, BseLI for hcar1–3-sgRNA-2 product, HpaII for hcar1–3-sgRNA-3 product, Eco47I for hcar1–3-sgRNA-4 product; BseNI for myd88-sgRNA-1, OliI for myd88-sgRNA-2, BseLI for myd88-sgRNA-3; PvuI for pycard-sgRNA-1, Bsp1286I for pycard-sgRNA-2, SmlI for pycard-sgRNA-3; BseLI for lta4h-sgRNA-1, BseLI for lta4h-sgRNA-2, SalI for lta4h-sgRNA-3, BstXI for lta4h-sgRNA-4; BseLI for ltb4r-sgRNA-1, BseLI for ltb4r-sgRNA-2, BstXI for ltb4r-sgRNA-3) for at least 2 h at 37°C. Then, samples were separated by agarose gel electrophoresis (Table S4).
Survival assays
Survival after ear infection, and survival after CCV/DC systemic infection were performed as follows. 2.5–3 dpf larvae were infected with PA in standard hypotonic E3 either in the ear or in the CCV/DC. Then, infected larvae were placed into the wells of a 48-well plate, and their viability was monitored for 5 days after injection. Dead larvae were scored by loss of transparency and heartbeat.
Colony forming units (CFU) assay
CFUs of infected, 2.5–3 dpf zebrafish larvae were measured as follows48: In brief, at 2 h or 4 h post-infection, a total of 40 larvae were distributed into eight groups (5 larvae per group) in 1.5 mL Eppendorf tubes. The infected larvae were washed three times with PBS to remove adherent bacteria. The larvae were homogenized in filter-sterilized PBS with 1% Triton X-100 (Sigma, SLBW7103) (40 μL per larvae). The suspension was diluted to 1:100, and 10 μL was plated onto LB agar plates, then incubated overnight at 37°C. We inferred the bacterial burden of the infected larvae by colony counting of LB plates.
Spinning disk confocal imaging
For live imaging, anesthetized TG(lyz:pm2-mk2)42 or TG(mpeg1:eGFP)42 2.5–3 dpf larvae were injected with PA mixed with fluorescent cyan or red beads to mark the ear region. The larvae were then immobilized by embedding them in ~200 μL of 1% low-melting agarose (Gold Biotechnology, A-204–100) dissolved in standard hypotonic E3 in glass bottom dishes (MatTek Corporation, P35G-1.5–20-C). After the agar had solidified, the mounted larvae were covered with 2–3 mL E3-Tricaine to prevent desiccation and maintain anesthesia during imaging.
Imaging was performed at 28°C in heated imaging chamber (TOKAI HTI, WPI inc.) on an inverted Nikon Eclipse Ti microscope equipped with a CFI Plan Apochromat Lambda D 10× Objective lens (NA 0.45), a motorized stage, a Yokogawa CSU-W1 Spinning Disk unit, a Photometrics Prime BSI Scientific CMOS camera (2×2 binning), and NIS imaging software (Nikon, 5.11.01). Fluorescence emission was excited using 405, 488 or 561 nm diode lasers (Nikon). Channel acquisition intensities/exposure times used in the study were as follows: 80%/100 ms (561 nm) or 50%/100 ms (488 nm) laser power settings were used to detect either neutrophils or macrophages. The injected red (Ex/Em: 580/605) or cyan (Ex/Em: 430/465) fluorescent polystyrene beads were excited by adjusting laser power to 30%/100 ms (561 nm) or 40%/100 ms (405 nm), respectively. The emission was collected using 455/50 (cyan), 525/36 (green) or 605/52 (red) bandpass filters.
Image processing and data analysis
The acquired confocal z-stacks were imported into Imaris (Bitplane, 9.6.0) for counting the leukocytes in the ear region over time. To this end, we constructed a 3D region of interest (390 μm × 390 μm × 100 μm) by manually marking the center of the ear (based on bead fluorescence) using the Imaris wand tool. The Imaris spot detection and wizard filter tools were used to remove non-specific signals for manual 3D-segmentation and quantification of leukocytes based on size (~13 μm diameter) or fluorescence signal intensity threshold filters that were manually adjusted for emission quality and quantified.
mRNA preparation and injection
For the zebrafish hcar1–4 or human OXER1 rescue experiments, pCS2+hcar1–4-mKate2 or pCS2+OXER1-mKate2 were linearized using FastDigest NotI (Thermo Fisher Scientific; FD0593), and in vitro transcribed using the mMessage mMachine SP6 kit (Thermo Fisher Scientific; AM1340). 2.3 nL of ~500 ng/μL mRNA was injected into the yolk of one-cell stage zebrafish embryos.
Cell sorting and quantitative RT-PCR
2.5–3 dpf larvae (n~400) were collected from TG(lyz:pm2-mKate2) or TG(mpeg1:eGFP) transgenic lines expressing red (mKate2) or green (eGFP) fluorescent protein in neutrophils or macrophages, respectively. Larvae were dissociated into a single cell suspension as follows49: Cell sorting and collection of eGFP or mKate2 positive and negative cells was carried out by FACS (Aria, BD Bioscience) based on 561 nm excitation and 670/30 nm emission wavelengths for mKate2 and 488 nm excitation and 525/50 nm emission for GFP.
mRNA was isolated using the RNeasy Plus Micro kit (QIAGEN; 74,034), cDNA was prepared using the High-Capacity cDNA Reverse Transcription kit (Thermo Fisher Scientific; cat#4368814), and quantitative RT-PCR was carried out using the Maxima SYBR Green/Fluorescein qPCR Master Mix (Thermo Fisher Scientific; K0242) on a Real-Time PCR Machine (Bio-Rad, Watford, Hertfordshire, UK) (Figure 1B). Data were normalized to β-actin using the 2−ΔΔCt method.50 Primer sequences are listed in Table S3.
Lipidomics analysis
2.5–3 dpf wt larvae (total ~1200, ~400 per replicate) were collected after PA ear injection at 2 h. Uninfected wt larvae (total ~1200, ~400 for each sample) were collected as control and sent to the UC San Diego Lipid Maps facility for full eicosanoid panel chromatography/mass spec analysis. Zebrafish larvae were homogenized in 1 mL 10% methanol in water using a Bead Mill 24 (Fisher Scientific, 15–340-163). A mix of 26 deuterated internal standards was added to 100 μL homogenate. Eicosanoids were extracted by solid phase extraction (SPE) using Phenomenex Strata-X polymeric reversed phase columns. Samples were brought to dryness and taken up in buffer A (water/acetonitrile/acetic acid 60/40/0.02, v/v/v). Samples were analyzed using a Waters Acquity UPLC interfaced with an AB Sciex 6500 QTrap instrument. Chromatographic separation was achieved by a step gradient starting with 100% buffer A to 100% buffer B (acetonitrile/isopropanol 50/50, v/v) over 5 min. Standard curves were obtained in parallel using identical conditions. Data analysis was performed with Analyst and Mulitquant software packages.25
Embryo collection, RNA extraction, and sequencing
For the qRT-PCR in Figure S1C, 2.5–3 dpf wt larvae (every time point ~120, 40 for each sample) were collected after PA ear injection at 0 h, 1 h, 2 h, 4 h, 8 h, 12 h and 24 h. mRNA was isolated using Trizol reagent (Thermo Fisher Scientific; cat#15596026) according to the manufacturer’s protocol. cDNA was prepared using the RevertAid First Strand cDNA Synthesis Kit (Thermo Fisher Scientific; K1621), and QPCR was carried out using the Maxima SYBR Green/Fluorescein qPCR Master Mix (Thermo Fisher Scientific; K0242). As for the mRNA-sequencing in Figures 1C, 2.5–3 dpf hcar1–4mk213 +/+ or hcar1–4mk213 −/− larvae were collected after PA ear injection at 2 h and 4 h. Noninjected hcar1–4mk213 +/+ or hcar1–4mk213 −/− larvae were used as a control. mRNA was extracted as described above. The following procedures were performed by the MSKCC Genomics and Bioinformatics core facilities as follows24: In brief, the RNA-seq libraries were sequenced on the Illumina HiSeq2500 platform with paired-end 50-bp single reads, resulting with an average of 20–30 million reads per sample. The sequence data (FASTQ files) were processed and mapped to the zebrafish genome GRCz11 (UCSC) using the rnaSTAR aligner that genomically mapped and resolved reads across splice junctions. The resulting SAM files were processed using the PICARD tools for conversion and compression of the output to the BAM file format. The mapped reads were then processed using DESeq, from R/BioConductor to analyze differential gene expression between samples. The mRNAseq data are available at https://www.ncbi.nlm.nih.gov/geo/query/acc.cgi?acc=GSE201604.
Ortholog analysis
Sequence orthologs (one2one or one2many or many2many) of zebrafish genes in human (homo sapiens), cat (felis catus), rat (rattus norvegicus), and mouse (mus musculus) were retrieved using BioMart and ENSEMBL release 107 (Jul 2022). A Venn diagram of these orthologs was generated with a webtool (https://bioinformatics.psb.ugent.be/webtools/Venn/) and displayed in Figure 1C. To remove likely false positives from the ENSMBL NRNM list (i.e., 206 zebrafish genes with ENSEMBL orthologs in human and cat but not mouse or rat), we used the DIOPT ortholog finder webtool (version 9.0, Sept 21, beta),20 which searches across the Alliance of Genome Resources (AGR) databases with AGR-selected algorithms. False-positive NRNM genes were defined as genes that were assigned by ENSEMBL as NRNM genes yet had “high”-ranking DIOPT rat or mouse orthologs (Weighted score >2 & Rank = High & Best Score = Yes & Best Score Reverse = Yes). Those (n = 53; Table S1, tab four & five tab) putative false positives were removed from the original ENSEMBL NRNM list, leaving a final list of 153 likely NRNM genes (Table S1, second tab). 49 from this “cleaned” NRNM list had “high” ranking human orthologs according to the above DIOPT criteria.
Simple gene correlation analysis (sGCA)
sGCA calculates the correlation distance (CD, one minus the sample correlation between points treated as sequences of values, as per MATLAB definition) of all actual mRNAseq expression phenotypes to “ideal” phenotypes (IP). That is, CD = 0 means that an expression profile perfectly correlates with the respective IP, CD = 1 means the opposite. Once a gene has been assigned to an IP, its fold-regulation is calculated by dividing the mean of 1-group-conditions by the mean of the 0-group-conditions (“condition” = columns of normalized mRNAseq count matrix where rows denote the genes). The respective Padj is calculated using a negative binomial model with Benjamini-Hochberg adjustment. The mean base is calculated as the mean of means of 1-group-conditions and 0-group-conditions. The heatmap in Figure 1C only includes genes with CD < 0.25, Padj < 0.05, fold-regulation >2, and mean base >20 are displayed. See Table S2 for the complete, annotated gene list with IP-association, respective CDs and statistics. The sGCA script and MATLAB app are available on GitHub (https://github.com/niethamp/sGCA-Ma-et-al.-2022-)
QUANTIFICATION AND STATISTICAL ANALYSIS
The error bars in neutrophil or macrophage tracking during 2-h PA ear infection indicate standard errors of means (SEM), other error bars indicate standard deviation (STDEV). For most mean value comparisons, p values were derived by student’s t-test (two tailed, two sample unequal variance test, heteroscedastic) using Prism (GraphPad) or Excel (Microsoft). For comparison of Kaplan-Meier survival curves, a log rank (Mantel-Cox) test in Prism was used. For statistical analysis, animal experiments from different experimental days were aggregated. Sample sizes were not predetermined by statistical methods. The experiments were not randomized, and the investigators were not blinded to allocation during experiments or outcome assessment.
Supplementary Material
Highlights.
5-oxoETE and its receptor OXER1 are induced by bacterial infection
OXER1 orthologs are present in fish and humans but absent in popular rodent models
OXER1’s innate immune functions are illuminated in the zebrafish model
ACKNOWLEDGMENTS
The research has been funded by the NIH grants R01GM099970, R21AI139986, and R35GM140883, and a BRIA award to P.N., as well as a Tow fellowship to K.L.H. Core facility services were in part funded by the NIH/NCI Cancer Center Support grant P30CA008748. We thank Michelina Stoddard for designing the zebrafish injection mold. We would like to thank Tim Mitchison, Tobias Hohl, Justin Perry, Danielle Bolton, and Miklos Lengyel for valuable comments on the manuscript.
Footnotes
DECLARATION OF INTERESTS
The authors declare no competing interests.
SUPPLEMENTAL INFORMATION
Supplemental information can be found online at https://doi.org/10.1016/j.celrep.2022.111974.
REFERENCES
- 1.Shay T, Jojic V, Zuk O, Rothamel K, Puyraimond-Zemmour D, Feng T, Wakamatsu E, Benoist C, Koller D, Regev A, et al. (2013). Conservation and divergence in the transcriptional programs of the human and mouse immune systems. Proc. Natl. Acad. Sci. USA 110, 2946–2951. 10.1073/pnas.1222738110. [DOI] [PMC free article] [PubMed] [Google Scholar]
- 2.Seok J, Warren HS, Cuenca AG, Mindrinos MN, Baker HV, Xu W, Richards DR, McDonald-Smith GP, Gao H, Hennessy L, et al. (2013). Genomic responses in mouse models poorly mimic human inflammatory diseases. Proc. Natl. Acad. Sci. USA 110, 3507–3512. 10.1073/pnas.1222878110. [DOI] [PMC free article] [PubMed] [Google Scholar]
- 3.Powell WS, and Rokach J (2020). Targeting the OXE receptor as a potential novel therapy for asthma. Biochem. Pharmacol. 179, 113930. 10.1016/j.bcp.2020.113930. [DOI] [PMC free article] [PubMed] [Google Scholar]
- 4.Powell WS, and Rokach J (2013). The eosinophil chemoattractant 5-oxo-ETE and the OXE receptor. Prog. Lipid Res. 52, 651–665. 10.1016/j.plipres.2013.09.001. [DOI] [PMC free article] [PubMed] [Google Scholar]
- 5.Farias SE, Basselin M, Chang L, Heidenreich KA, Rapoport SI, and Murphy RC (2008). Formation of eicosanoids, E2/D2 isoprostanes, and docosanoids following decapitation-induced ischemia, measured in high-energy-microwaved rat brain. J. Lipid Res. 49, 1990–2000. 10.1194/jlr.M800200-JLR200. [DOI] [PMC free article] [PubMed] [Google Scholar]
- 6.Kowal K, Gielicz A, and Sanak M (2017). The effect of allergen-induced bronchoconstriction on concentration of 5-oxo-ETE in exhaled breath condensate of house dust mite-allergic patients. Clin. Exp. Allergy 47, 1253–1262. 10.1111/cea.12990. [DOI] [PubMed] [Google Scholar]
- 7.Miller LA, Cossette C, Chourey S, Ye Q, Reddy CN, Rokach J, and Powell WS (2020). Inhibition of allergen-induced dermal eosinophilia by an oxoeicosanoid receptor antagonist in non-human primates. Br. J. Pharmacol. 177, 360–371. 10.1111/bph.14872. [DOI] [PMC free article] [PubMed] [Google Scholar]
- 8.Cossette C, Miller LA, Ye Q, Chourey S, Reddy CN, Rokach J, and Powell WS (2022). Targeting the OXE receptor with a selective antagonist inhibits allergen-induced pulmonary inflammation in non-human primates. Br. J. Pharmacol. 179, 322–336. 10.1111/bph.15721. [DOI] [PMC free article] [PubMed] [Google Scholar]
- 9.Gao J, Aksoy BA, Dogrusoz U, Dresdner G, Gross B, Sumer SO, Sun Y, Jacobsen A, Sinha R, Larsson E, et al. (2013). Integrative analysis of complex cancer genomics and clinical profiles using the cBioPortal. Sci. Signal. 6, pl1. 10.1126/scisignal.2004088. [DOI] [PMC free article] [PubMed] [Google Scholar]
- 10.Sundaram S, and Ghosh J (2006). Expression of 5-oxoETE receptor in prostate cancer cells: critical role in survival. Biochem. Biophys. Res. Commun. 339, 93–98. 10.1016/j.bbrc.2005.10.189. [DOI] [PubMed] [Google Scholar]
- 11.O’Flaherty JT, Rogers LC, Paumi CM, Hantgan RR, Thomas LR, Clay CE, High K, Chen YQ, Willingham MC, Smitherman PK, et al. (2005). 5-Oxo-ETE analogs and the proliferation of cancer cells. Biochim. Biophys. Acta 1736, 228–236. 10.1016/j.bbalip.2005.08.009. [DOI] [PubMed] [Google Scholar]
- 12.Enyedi B, Kala S, Nikolich-Zugich T, and Niethammer P (2013). Tissue damage detection by osmotic surveillance. Nat. Cell Biol. 15, 1123–1130. 10.1038/ncb2818. [DOI] [PMC free article] [PubMed] [Google Scholar]
- 13.Robertson TF, and Huttenlocher A (2022). Real-time imaging of inflammation and its resolution: it’s apparent because it’s transparent. Immunol. Rev. 306, 258–270. 10.1111/imr.13061. [DOI] [PMC free article] [PubMed] [Google Scholar]
- 14.Trede NS, Langenau DM, Traver D, Look AT, and Zon LI (2004). The use of zebrafish to understand immunity. Immunity 20, 367–379. 10.1016/s1074-7613(04)00084-6. [DOI] [PubMed] [Google Scholar]
- 15.Stamatiou P, Hamid Q, Taha R, Yu W, Issekutz TB, Rokach J, Khanapure SP, and Powell WS (1998). 5-oxo-ETE induces pulmonary eosinophilia in an integrin-dependent manner in Brown Norway rats. J. Clin. Invest. 102, 2165–2172. 10.1172/JCI1995. [DOI] [PMC free article] [PubMed] [Google Scholar]
- 16.Almishri W, Cossette C, Rokach J, Martin JG, Hamid Q, and Powell WS (2005). Effects of prostaglandin D2, 15-deoxy-Delta12, 14-prostaglandin J2, and selective DP1 and DP2 receptor agonists on pulmonary infiltration of eosinophils in Brown Norway rats. J. Pharmacol. Exp. Ther. 313, 64–69. 10.1124/jpet.104.079079. [DOI] [PubMed] [Google Scholar]
- 17.MacLeod AS, and Mansbridge JN (2016). The innate immune system in acute and chronic wounds. Adv. Wound Care 5, 65–78. 10.1089/wound.2014.0608. [DOI] [PMC free article] [PubMed] [Google Scholar]
- 18.Mercier F, Morin C, Cloutier M, Proteau S, Rokach J, Powell WS, and Rousseau E (2004). 5-Oxo-ETE regulates tone of Guinea pig airway smooth muscle via activation of Ca2+ pools and Rho-kinase pathway. Am. J. Physiol. Lung Cell Mol. Physiol. 287, L631–L640. 10.1152/ajplung.00005.2004. [DOI] [PubMed] [Google Scholar]
- 19.Maus KD, Stephenson DJ, Ali AN, MacKnight HP, Huang H-J, Serrats J, Kim M, Diegelmann RF, and Chalfant CE (2022). Ceramide kinase regulates acute wound healing by suppressing 5-oxo-ETE biosynthesis and signaling via its receptor OXER1. J. Lipid Res. 63, 100187. 10.1016/j.jlr.2022.100187. [DOI] [PMC free article] [PubMed] [Google Scholar]
- 20.Hu Y, Flockhart I, Vinayagam A, Bergwitz C, Berger B, Perrimon N, and Mohr SE (2011). An integrative approach to ortholog prediction for disease-focused and other functional studies. BMC Bioinformatics 12, 357. 10.1186/1471-2105-12-357. [DOI] [PMC free article] [PubMed] [Google Scholar]
- 21.Farnsworth DR, Saunders LM, and Miller AC (2020). A single-cell transcriptome atlas for zebrafish development. Dev. Biol. 459, 100–108. 10.1016/j.ydbio.2019.11.008. [DOI] [PMC free article] [PubMed] [Google Scholar]
- 22.Deng Q, Harvie EA, and Huttenlocher A (2012). Distinct signalling mechanisms mediate neutrophil attraction to bacterial infection and tissue injury. Cell Microbiol. 14, 517–528. 10.1111/j.1462-5822.2011.01738.x. [DOI] [PMC free article] [PubMed] [Google Scholar]
- 23.Deng Q, Sarris M, Bennin DA, Green JM, Herbomel P, and Huttenlocher A (2013). Localized bacterial infection induces systemic activation of neutrophils through Cxcr2 signaling in zebrafish. J. Leukoc. Biol. 93, 761–769. 10.1189/jlb.1012534. [DOI] [PMC free article] [PubMed] [Google Scholar]
- 24.Huang C, and Niethammer P (2018). Tissue damage signaling is a prerequisite for protective neutrophil recruitment to microbial infection in zebrafish. Immunity 48, 1006–1013.e6. 10.1016/j.immuni.2018.04.020. [DOI] [PMC free article] [PubMed] [Google Scholar]
- 25.Quehenberger O, Armando AM, Brown AH, Milne SB, Myers DS, Merrill AH, Bandyopadhyay S, Jones KN, Kelly S, Shaner RL, et al. (2010). Lipidomics reveals a remarkable diversity of lipids in human plasma. J. Lipid Res. 51, 3299–3305. 10.1194/jlr.M009449. [DOI] [PMC free article] [PubMed] [Google Scholar]
- 26.Powell WS, Gravel S, MacLeod RJ, Mills E, and Hashefi M (1993). Stimulation of human neutrophils by 5-oxo-6, 8, 11, 14-eicosatetraenoic acid by a mechanism independent of the leukotriene B4 receptor. J. Biol. Chem. 268, 9280–9286. 10.1016/S0021-9258(18)98347-X. [DOI] [PubMed] [Google Scholar]
- 27.Enyedi B, Jelcic M, and Niethammer P (2016). The cell nucleus serves as a mechanotransducer of tissue damage-induced inflammation. Cell 165, 1160–1170. 10.1016/j.cell.2016.04.016. [DOI] [PMC free article] [PubMed] [Google Scholar]
- 28.Benard EL, van der Sar AM, Ellett F, Lieschke GJ, Spaink HP, and Meijer AH (2012). Infection of zebrafish embryos with intracellular bacterial pathogens. J. Vis. Exp. 61, 3781. 10.3791/3781. [DOI] [PMC free article] [PubMed] [Google Scholar]
- 29.Hoshijima K, Jurynec MJ, Klatt Shaw D, Jacobi AM, Behlke MA, and Grunwald DJ (2019). Highly efficient CRISPR-Cas9-based methods for generating deletion mutations and F0 embryos that lack gene function in zebrafish. Dev. Cell 51, 645–657.e4. 10.1016/j.devcel.2019.10.004. [DOI] [PMC free article] [PubMed] [Google Scholar]
- 30.Wu RS, Lam II, Clay H, Duong DN, Deo RC, and Coughlin SR (2018). A rapid method for directed gene knockout for screening in G0 zebrafish. Dev. Cell 46, 112–125.e4. 10.1016/j.devcel.2018.06.003. [DOI] [PubMed] [Google Scholar]
- 31.Erlemann K-R, Cossette C, Gravel S, Lesimple A, Lee G-J, Saha G, Rokach J, and Powell WS (2007). Airway epithelial cells synthesize the lipid mediator 5-oxo-ETE in response to oxidative stress. Free Radic. Biol. Med. 42, 654–664. 10.1016/j.freeradbiomed.2006.12.006. [DOI] [PMC free article] [PubMed] [Google Scholar]
- 32.Erlemann K-R, Rokach J, and Powell WS (2004). Oxidative stress stimulates the synthesis of the eosinophil chemoattractant 5-oxo-6, 8, 11, 14-eicosatetraenoic acid by inflammatory cells. J. Biol. Chem. 279, 40376–40384. 10.1074/jbc.M401294200. [DOI] [PubMed] [Google Scholar]
- 33.Sun Y, Karmakar M, Roy S, Ramadan RT, Williams SR, Howell S, Shive CL, Han Y, Stopford CM, Rietsch A, et al. (2010). TLR4 and TLR5 on corneal macrophages regulate Pseudomonas aeruginosa keratitis by signaling through MyD88-dependent and -independent pathways. J. Immunol. 185, 4272–4283. 10.4049/jimmunol.1000874. [DOI] [PMC free article] [PubMed] [Google Scholar]
- 34.Alhazmi A (2018). NOD-like receptor(s) and host immune responses with Pseudomonas aeruginosa infection. Inflamm. Res. 67, 479–493. 10.1007/s00011-018-1132-0. [DOI] [PubMed] [Google Scholar]
- 35.Lämmermann T, Afonso PV, Angermann BR, Wang JM, Kastenmüller W, Parent CA, and Germain RN (2013). Neutrophil swarms require LTB4 and integrins at sites of cell death in vivo. Nature 498, 371–375. 10.1038/nature12175. [DOI] [PMC free article] [PubMed] [Google Scholar]
- 36.Poplimont H, Georgantzoglou A, Boulch M, Walker HA, Coombs C, Papaleonidopoulou F, and Sarris M (2020). Neutrophil swarming in damaged tissue is orchestrated by connexins and cooperative calcium alarm signals. Curr. Biol. 30, 2761–2776.e7. 10.1016/j.cub.2020.05.030. [DOI] [PMC free article] [PubMed] [Google Scholar]
- 37.Isles HM, Loynes CA, Alasmari S, Kon FC, Henry KM, Kadochnikova A, Hales J, Muir CF, Keightley M-C, Kadirkamanathan V, et al. (2021). Pioneer neutrophils release chromatin within in vivo swarms. Elife 10, e68755. 10.7554/eLife.68755. [DOI] [PMC free article] [PubMed] [Google Scholar]
- 38.de Oliveira S, Boudinot P, Calado Â, and Mulero V (2015). Duox1-derived H2O2 modulates Cxcl8 expression and neutrophil recruitment via JNK/c-JUN/AP-1 signaling and chromatin modifications. J. Immunol. 194, 1523–1533. 10.4049/jimmunol.1402386. [DOI] [PubMed] [Google Scholar]
- 39.Bhatt L, Roinestad K, Van T, and Springman EB (2017). Recent advances in clinical development of leukotriene B4 pathway drugs. Semin. Immunol. 33, 65–73. 10.1016/j.smim.2017.08.007. [DOI] [PubMed] [Google Scholar]
- 40.Zhou Q, Yang D, Ombrello AK, Zavialov AV, Toro C, Zavialov AV, Stone DL, Chae JJ, Rosenzweig SD, Bishop K, et al. (2014). Early-onset stroke and vasculopathy associated with mutations in ADA2. N. Engl. J. Med. 370, 911–920. 10.1056/NEJMoa1307361. [DOI] [PMC free article] [PubMed] [Google Scholar]
- 41.White RM, Sessa A, Burke C, Bowman T, LeBlanc J, Ceol C, Bourque C, Dovey M, Goessling W, Burns CE, et al. (2008). Transparent adult zebrafish as a tool for in vivo transplantation analysis. Cell Stem Cell 2, 183–189. 10.1016/j.stem.2007.11.002. [DOI] [PMC free article] [PubMed] [Google Scholar]
- 42.Stoddard M, Huang C, Enyedi B, and Niethammer P (2019). Live imaging of leukocyte recruitment in a zebrafish model of chemical liver injury. Sci. Rep. 9, 28. 10.1038/s41598-018-36771-9. [DOI] [PMC free article] [PubMed] [Google Scholar]
- 43.Cunliffe VT (2003). Zebrafish: a practical approach. Edited by NÜSSLEIN-VOLHARD C and DAHM R. Oxford university press. 2002. 322 pages. ISBN 0 19 963808 X. Price £40.00 (paperback). ISBN 0 19 963809 8. Price £80.00 (hardback). Genet. Res. 82, 79. 10.1017/S0016672303216384. [DOI] [Google Scholar]
- 44.Bolcome RE, Sullivan SE, Zeller R, Barker AP, Collier RJ, and Chan J (2008). Anthrax lethal toxin induces cell death-independent permeability in zebrafish vasculature. Proc. Natl. Acad. Sci. USA 105, 2439–2444. 10.1073/pnas.0712195105. [DOI] [PMC free article] [PubMed] [Google Scholar]
- 45.Miskolci V, Squirrell J, Rindy J, Vincent W, Sauer JD, Gibson A, Eliceiri KW, and Huttenlocher A (2019). Distinct inflammatory and wound healing responses to complex caudal fin injuries of larval zebrafish. Elife 8, e45976. 10.7554/eLife.45976. [DOI] [PMC free article] [PubMed] [Google Scholar]
- 46.Rosowski EE, Raffa N, Knox BP, Golenberg N, Keller NP, and Huttenlocher A (2018). Macrophages inhibit Aspergillus fumigatus germination and neutrophil-mediated fungal killing. PLoS Pathog. 14, e1007229. 10.1371/journal.ppat.1007229. [DOI] [PMC free article] [PubMed] [Google Scholar]
- 47.Katikaneni A, Jelcic M, Gerlach GF, Ma Y, Overholtzer M, and Niethammer P (2020). Lipid peroxidation regulates long-range wound detection through 5-lipoxygenase in zebrafish. Nat. Cell Biol. 22, 1049–1055. 10.1038/s41556-020-0564-2. [DOI] [PMC free article] [PubMed] [Google Scholar]
- 48.Astin JW, Keerthisinghe P, Du L, Sanderson LE, Crosier KE, Crosier PS, and Hall CJ (2017). Innate immune cells and bacterial infection in zebrafish. Methods Cell Biol. 138, 31–60. 10.1016/bs.mcb.2016.08.002. [DOI] [PubMed] [Google Scholar]
- 49.Bertrand JY, Kim AD, Violette EP, Stachura DL, Cisson JL, and Traver D (2007). Definitive hematopoiesis initiates through a committed erythromyeloid progenitor in the zebrafish embryo. Development 134, 4147–4156. 10.1242/dev.012385. [DOI] [PMC free article] [PubMed] [Google Scholar]
- 50.Livak KJ, and Schmittgen TD (2001). Analysis of relative gene expression data using real-time quantitative PCR and the 2(-Delta Delta C(T)) Method. Methods 25, 402–408. 10.1006/meth.2001.1262. [DOI] [PubMed] [Google Scholar]
Associated Data
This section collects any data citations, data availability statements, or supplementary materials included in this article.
Supplementary Materials
Data Availability Statement
RNA-sequencing data are available at the GEO data depository under number GSE201604. This accession number is also listed in the key resources table.
All original code has been deposited at Zenodo and is publicly available as of the date of publication. DOI (https://doi.org/10.5281/zenodo.7419586) is also listed in the key resources table. The sGCA script and MATLAB app are also available on GitHub (https://github.com/niethamp/sGCA-Ma-et-al.-2022-).
Any additional information required to reanalyze the data reported in this paper is available from the lead contact upon request.
KEY RESOURCES TABLE.
| REAGENT or RESOURCE | SOURCE | IDENTIFIER |
|---|---|---|
|
| ||
| Bacterial and virus strains | ||
|
| ||
| Wt PA14 | Joao Xavier (MSKCC) | N/A |
|
| ||
| Chemicals, peptides, and recombinant proteins | ||
|
| ||
| Blue-green (Cyan) fluorescent beads (Ex/Em=430/465) | Thermo Fisher | Cat#F13080 |
| Red fluorescent beads (Ex/Em=580/605) | Thermo Fisher | Cat#F8810 |
| Dextran, Fluorescein, 500,000 MW, Anionic, Lysine Fixable | Invitrogen | Cat#D7136 |
| Agarose LM | Gold Biotechnology | Cat#A-204-100 |
| 5-oxoETE | Cayman | Cat#34250 |
| Dimethyl sulfoxide (DMSO) | Sigma | Cat#D8418 |
| ethyl 3-aminobenzoate methanesulfonate (Tricaine) | Sigma | Cat#E10521 |
| Triton X-100 | Sigma | Cat#SLBW7103 |
| Phosphate buffered saline (PBS) | Sigma | Cat#79382 |
| FastDigest NotI restriction enzyme | Thermo Fisher | Cat#FD0593 |
| FastDigest BstXI restriction enzyme | Thermo Fisher | Cat#FD1024 |
| FastDigest BseLI restriction enzyme | Thermo Fisher | Cat#FD1204 |
| FastDigest MseI (Tru1I) restriction enzyme | Thermo Fisher | Cat#ER0981 |
| FastDigest BseNI restriction enzyme | Thermo Fisher | Cat#FD0884 |
| FastDigest HpaII restriction enzyme | Thermo Fisher | Cat#FD0514 |
| FastDigest Eco47I restriction enzyme | Thermo Fisher | Cat#FD0314 |
| FastDigest OliI restriction enzyme | Thermo Fisher | Cat#FD1634 |
| FastDigest PvuI restriction enzyme | Thermo Fisher | Cat#FD0624 |
| FastDigest Bsp1286I (SduI) restriction enzyme | Thermo Fisher | Cat#FD0654 |
| FastDigest SmlI (SmoI) restriction enzyme | Thermo Fisher | Cat#ER1981 |
| FastDigest SalI restriction enzyme | Thermo Fisher | Cat#FD0644 |
|
| ||
| Critical commercial assays | ||
|
| ||
| mMessage mMachine SP6 Kit | Thermo Fisher | Cat#AM1340 |
| Trizol reagent | Thermo Fisher | Cat#15596026 |
| RevertAid First Strand cDNA Synthesis Kit | Thermo Fisher | Cat#K1621 |
| RNeasy Plus Micro kit | QIAGEN | Cat#74034 |
| High-Capacity cDNA Reverse Transcript Kit | Thermo Fisher | Cat#4368814 |
| Maxima SYBR Green/Fluorescein qPCR Master Mix | Thermo Fisher | Cat#K0242 |
|
| ||
| Deposited data | ||
|
| ||
| RNA-seq | This paper | GSE201604 |
| Code | This paper | https://doi.org/10.5281/zenodo.7419586 |
|
| ||
| Experimental models: Organisms/strains | ||
|
| ||
| Zebrafish: wt casper | White et al., 200841 | https://doi.org/10.1016/j.stem.2007.11.002 |
| Zebrafish: TG(Iyz:pm2-mk2) | Stoddard et al., 201942 | https://doi.org/10.1038/s41598-018-36771-9 |
| Zebrafish: TG(mpeg1:eGFP) | Stoddard et al., 201942 | https://doi.org/10.1038/s41598-018-36771-9 |
| Zebrafish: hcar1–4mk213 +/+ | This paper | N/A |
| Zebrafish: hcar1–4mk213 −/− | This paper | N/A |
| Zebrafish: hcar1–4mk214 +/+ | This paper | N/A |
| Zebrafish: hcar1–4mk214 −/− | This paper | N/A |
|
| ||
| Oligonucleotides | ||
|
| ||
| See Table S3 for Oligonucleotides | This paper | N/A |
|
| ||
| Software and algorithms | ||
|
| ||
| ImageJ/FIJI (ImageJ 1.53t, v2.9.0.) | Johannes Schindelin | https://fiji.sc/ |
| MATLAB (9.12.0.1975300 (R2022a) Update 3) | Mathworks Inc., USA | http://mathworks.com |
| Bioinformatics Toolbox Version 4.16 (R2022a) | Mathworks Inc., USA | http://mathworks.com |
| Computer Vision Toolbox Version 10.2 (R2022a) | Mathworks Inc., USA | http://mathworks.com |
| Curve Fitting Toolbox Version 3.7 (R2022a) | Mathworks Inc., USA | http://mathworks.com |
| Deep Learning Toolbox Version 14.4 (R2022a) | Mathworks Inc., USA | http://mathworks.com |
| Fuzzy Logic Toolbox Version 2.9 (R2022a) | Mathworks Inc., USA | http://mathworks.com |
| Global Optimization Toolbox Version 4.7 (R2022a) | Mathworks Inc., USA | http://mathworks.com |
| Image Processing Toolbox Version 11.5 (R2022a) | Mathworks Inc., USA | http://mathworks.com |
| MATLAB Compiler Version 8.4 (R2022a) | Mathworks Inc., USA | http://mathworks.com |
| Mapping Toolbox Version 5.3 (R2022a) | Mathworks Inc., USA | http://mathworks.com |
| Optimization Toolbox Version 9.3 (R2022a) | Mathworks Inc., USA | http://mathworks.com |
| Parallel Computing Toolbox Version 7.6 (R2022a) | Mathworks Inc., USA | http://mathworks.com |
| Partial Differential Equation Toolbox Version 3.8 (R2022a) | Mathworks Inc., USA | http://mathworks.com |
| Sensor Fusion and Tracking Toolbox (R2022a) | Mathworks Inc., USA Version 2.3 | http://mathworks.com |
| Signal Processing Toolbox Version 9.0 (R2022a) | Mathworks Inc., USA | http://mathworks.com |
| Statistics and Machine Learning Toolbox Version 12.3 (R2022a) | Mathworks Inc., USA | http://mathworks.com |
| NIS imaging software (Nikon, v5.11.01) | Nikon Microscope Product | https://www.microscope.healthcare.nikon.com/products/software/nis-elements |
| Prism (GraphPad, v8.3.0) | GraphPad Software | https://www.graphpad.com/scientific-software/prism |
| Imaris (Bitplane, v9.6.0) | Molecular Cytology Core Facility at MSKCC |
https://imaris.oxinst.com/ |