

Abstract
Background
Cardiovascular risk factors co‐occur with one another, and little is known about the extent of their clustering and risk of Alzheimer disease (AD). We identify groups of cardiovascular risk factors in cognitively normal individuals and investigate between‐group differences in incident AD and death.
Methods and Results
Cognitively normal individuals were recruited from the National Alzheimer's Coordinator Center. A latent class analysis was conducted with hypertension, hypercholesterolemia, heart condition, stroke, smoking history, diabetes, and high body mass index. Between‐group differences in the incidence of AD, mortality, and mortality‐adjusted AD were investigated. This study included 12 412 cognitively normal individuals (average follow‐up, 65 months). Three groups were identified: (1) low probabilities of cardiovascular risk factors (reference; N=5398 [43%]), (2) hypertension and hypercholesterolemia (vascular‐dominant; N=5721 [46%]), and (3) hypertension, hypercholesterolemia, diabetes, and high body mass index (vascular‐metabolic; N=1293 [10%]). Both vascular groups were significantly older, had more men, were slightly less educated, and were slightly more cognitively impaired than the reference group (all P<0.05). However, only the vascular‐metabolic group had a significantly younger age of death compared with the reference group (84.3 versus 88.7 years, P<0.001). Only the vascular‐dominant group had a greater incidence of AD (odds ratio [OR], 1.30; P<0.001) compared with the reference group. Mortality was greater in the vascular‐dominant (OR, 3.26; P<0.001) and vascular‐metabolic groups (OR, 1.84; P=0.02). Mortality‐adjusted AD was greater in the vascular‐dominant (OR, 1.54; P=0.02) and vascular‐metabolic groups (OR, 1.46; P=0.04).
Conclusions
Three distinct cardiovascular risk factor groups were identified in cognitively normal elderly individuals. Only the vascular‐dominant group was associated with a greater incidence of AD. Selective mortality may contribute to the attenuated association between the vascular‐metabolic group and incident AD.
Keywords: Alzheimer disease, cardiovascular risk factors, epidemiology
Subject Categories: Risk Factors, Aging, Cardiovascular Disease
Nonstandard Abbreviations and Acronyms
- CVRF
cardiovascular risk factor
- LCA
latent class analysis
- NACC
National Alzheimer's Coordinating Center
Clinical Perspective.
What Is New?
Three distinct groups of cardiovascular risk factors (CVRFs) were identified in cognitively normal elderly individuals: (1) low probabilities of CVRFs, (2) vascular‐dominant group, and (3) vascular‐metabolic group.
Before accounting for mortality, only the vascular‐dominant group was associated with incident Alzheimer disease (AD); however, after accounting for mortality, both the vascular‐dominant and vascular‐metabolic groups were associated with an increased incidence of AD.
These findings support the multiple origins of CVRFs, and emphasize the importance of accounting for mortality when investigating the impact of CVRFs on AD.
What Are the Clinical Implications?
Although the negative impacts of individual and multiple CVRFs on dementia and mortality have been well studied, they are unable to provide insight on how CVRFs co‐occur with one another, and therefore are unable to guide clinical‐ and research‐based decisions involving risk stratification.
Deriving latent‐class groups of CVRFs addresses the methodological limitations encountered by previous studies and provides the unique opportunity to determine the real‐world impact of CVRFs on AD and mortality.
This model can be used in future studies to investigate between‐group differences in biological markers and treatment response, which may in turn identify group‐specific treatment strategies for AD risk mitigation.
Cardiovascular risk factors (CVRFs) are highly prevalent in the elderly population and have been associated with poor outcomes such as cognitive decline, functional decline, and progression to Alzheimer disease (AD). 1 , 2 However, the majority of evidence is based on longitudinal cohort studies investigating the impact of individual CVRFs only. 1 Because CVRFs are often comorbid with one another in the elderly population, studying the impact of individual CVRFs may not accurately reflect the real‐world population. Studies investigating the interaction between individual CVRFs have reported an increased risk of AD in those with hypertension and diabetes, 3 and hypertension and stroke. 4 , 5 Several studies have investigated the impact of multiple CVRFs as a marker of vascular burden, and have reported an increase in the risk of AD, 6 cognitive decline, 7 , 8 and AD‐related biomarkers, with an increase in the number of CVRFs. 9 , 10 Although those studies support the negative impacts of CVRF multimorbidity, they are unable to elucidate distinct groups of CVRFs. The identification of CVRF groups would provide the opportunity to study between‐group differences in the incidence of AD, which would inform the need to stratify patients for individualized treatment. Furthermore, the identification of CVRF groups would serve as a framework to design future studies aimed at investigating differences in AD‐related outcomes between groups.
Of relevance, CVRFs have also been associated with mortality, a competing event for AD. 11 Mortality is an important outcome of consideration in longitudinal studies with elderly individuals given their advanced age, presence of comorbidities, and long‐duration of follow‐up. However, the majority of studies investigating the association between CVRFs and AD have not adjusted for mortality risk. 12 This may in part explain the mixed findings reported between CVRFs and AD‐related outcomes. Accounting for mortality would limit bias and ensure accuracy when investigating differences in the incidence of AD between different CVRF groups.
Using data collected from the National Alzheimer's Coordinating Center (NACC) data set, we conducted a latent class analysis (LCA) with CVRFs in cognitively normal elderly individuals to identify distinct groups of CVRFs. We then investigated the risk of CVRF groups on (1) incident AD, (2) mortality, and (3) mortality‐adjusted AD.
METHODS
Study participant data are available through the NACC (naccdata.org). Detailed data analysis plan and syntax will be made available upon request to the corresponding author.
Study Sample
The NACC data set includes clinical data from participants across 39 past and present Alzheimer disease research centers in the United States. Participants were included in this study if they were cognitively normal at baseline and were followed until loss to follow‐up or death. All contributing Alzheimer disease research centers were required to obtain approvals from their respective institutional regulatory boards and informed consent from their participants before submitting data to the NACC.
Classification of AD
A diagnosis of AD was confirmed by a consensus team or physician using the results of a structured clinical history, neuropsychology testing, and validated assessments of symptoms and function. Dementia of AD type was diagnosed using the National Institute of Neurological and Communicative Disorders and Stroke and the Alzheimer's Disease and Related Disorders Association prior 2015, and National Institute on Aging and Alzheimer's Association after 2015. Participants were diagnosed with AD if it was the primary or contributing cause of cognitive impairment, which included participants who had probable or possible dementia of the AD type.
Latent Class Indicators and Analysis
CVRFs (Latent Class Indicators)
The presence/absence of a CVRF was based on the diagnosis from recent medical history or medication use. Seven CVRFs were investigated, which included 5 vascular CVRFs (hypertension, hypercholesterolemia, heart disease [atrial fibrillation, angina, heart attack, angiopathy, congestive heart failure, bypass, pacemaker/defibrillation, pacemaker, valve replacement], stroke [transient ischemic attack or stroke history], history of smoking), and 2 metabolic CVRFs (diabetes and high body mass index [≥30 kg/m2]). 13
Latent Class‐Derived CVRF Groups
An LCA is a structural equation modeling technique that uses a person‐centered approach to derive an unobserved latent variable based on observed categorical variables. The categorical latent variable represents classes that can then be used to investigate differences in distal outcomes between groups. 14
For the present study, an LCA with the 7 CVRF indicators collected at baseline was fit to 1 to 6 classes to determine an optimal class solution. Given the complex sampling design used to recruit participants, this LCA was conducted using a multilevel technique to account for the hierarchical data structure. The classes were formed using the MLR estimator, based on full information maximum likelihood estimation robust to nonnormal observed variables. The maximum number of iterations through which the algorithm was cycled was 100, and the maximum number of replications used to estimate the model was 400. Specifically, all individuals with at least 1 valid indicator were included in the formation of latent classes. The optimal model‐class solution was chosen based on quantitative parsimony criteria, where the goal was to select a model that minimized the Akaike information criterion, Bayesian Information Criterion, and sample‐size adjusted Bayesian Information Criterion. We also included the Lo‐Mendell‐Rubin adjusted likelihood ratio test and Vuong‐Lo‐Mendell‐Rubin adjusted likelihood ratio test in our assessment, because these 2 tests are used to compare the k class from the k−1 class solution. A significant P value for the Lo‐Mendell‐Rubin adjusted likelihood ratio test and Vuong‐Lo‐Mendell‐Rubin adjusted likelihood ratio test indicates superior fit of the k‐class when compared with the k−1 class model. The entropy (range, 0–1) of each class model was computed to provide a measurement of class separation. An entropy value closer to 1 represents greater separation of classes. A moderate‐to‐high threshold probability of 0.5 or greater was used to identify CVRF class membership. Because each class is described using the probability of occurrence of each CVRF rather than its presence or absence, the CVRFs within each latent group are not mutually exclusive of one another.
Statistical Analysis
CVRF Multimorbidity
Separate multivariate logistic regressions, adjusted for baseline age, sex, Mini‐Mental State Exam score, years of education, and apo E4 (apolipoprotein E4) allele presence were computed to assess the association between each of the 7 CVRFs. This analysis was conducted in R (version 4.0.2; R Foundation for Statistical Computing, Vienna, Austria) using the ISLR package.
Between‐Group Comparisons in Study Demographics
A manual 3‐step analytic approach was used to identify demographic differences between latent classes using the Bolck, Croon, and Hagenaars method. 15 , 16 This method computes the classification errors for each individual, whose inverse logits are then used as weights when investigating differences in outcomes between groups. Using this method, odds ratios (ORs) for categorical outcomes and mean differences for continuous outcomes were computed to quantify differences between groups. Using the extracted class membership in a classify–analyze approach would assume that there is negligible classification error in latent class assignment, which may consequently lead to biased results.
Between‐Group Comparisons in AD and Mortality
The risk of CVRF groups on (1) incident AD, (2) mortality, and (3) mortality‐adjusted AD were investigated using the Bolck, Croon, and Hagenaars method. Incident AD was based on a diagnosis at the final visit. Mortality‐adjusted incident AD was determined by investigating the incidence of AD at the final visit in those who remained alive throughout the study. Using the Bolck, Croon, and Hagenaars method, baseline age, years of education, Mini‐Mental State Exam score, sex, and apo E4 allele presence were included to ensure that computed ORs and mean differences were appropriately adjusted for relevant covariates. The LCA and comparisons between latent‐derived CVRF groups were completed using Mplus (version 8.7).
RESULTS
This study included 12 412 elderly individuals who were cognitively normal. The mean duration of follow‐up was 65 months. Baseline demographics, and medical and medication history are included in Table 1. After adjusting for baseline age, sex, Mini‐Mental State Exam score, years of education, and presence of the apo E4 allele, all CVRFs were significantly associated with one another, except smoking history, hypertension, and heart disease (Figure 1; Table S1).
Table 1.
Study Participant Demographics (N=12 412)
| Demographic | Value |
|---|---|
| Age, y | 70.9 (10.5) |
| Sex, men | 4358 (35%) |
| Education | 15.9 (2.9) |
| MMSE | 28.9 (1.4) |
| Cardiovascular risk factors | |
| Hypertension | 6745 (54%) |
| Hypercholesterolemia | 6136 (49%) |
| Smoking history | 5237 (42%) |
| High BMI, ≥30 kg/m2 | 2976 (26%) |
| Heart disease | 1784 (14%) |
| Diabetes | 1373 (11%) |
| Stroke/TIA | 291 (2%) |
| Medication history | |
| Antidepressant use | 2245 (18%) |
| Anxiolytic use | 1365 (11%) |
| Antipsychotic use | 70 (1%) |
| Other | |
| apo E4 allele | 3341 (27%) |
| Incident AD | 873 (7%) |
| Mortality | 1812 (15%) |
| Mortality‐adjusted incident AD | 470 (4%) |
Values are presented as mean (SD) or number (%). AD indicates Alzheimer disease; apo E4, apolipoprotein E4; BMI, body mass index; MMSE, Mini‐Mental State Exam; and TIA, transient ischemic attack.
Figure 1. Adjusted odds ratios of association between each cardiovascular risk factor.
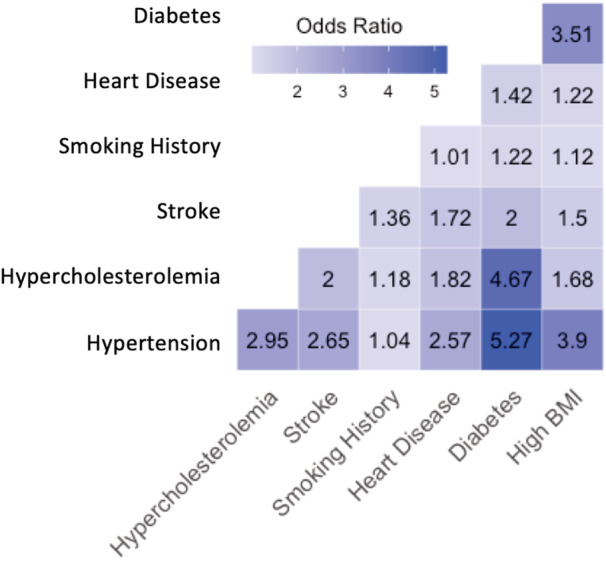
All: P<0.05, except between smoking history and hypertension, and smoking history and heart disease. BMI indicates body mass index.
Latent Class‐Derived CVRF Groups
Latent Class Analysis With Baseline CVRFs
Model fitness metrics for 1 to 6 classes for baseline CVRFs are provided in Table 2. The 3‐class model was selected because it had a lower Akaike information criterion and Bayesian Information Criterion compared with the 2‐class model. Models with 4 or more classes were not considered, because fewer than 10% of participants were included in 1 or more groups. 17 Though the Vuong‐Lo‐Mendell‐Rubin adjusted likelihood ratio test and Lo‐Mendell‐Rubin adjusted likelihood ratio test were not significant for the 3‐class model compared with the 2‐class model, the 3‐class model identified a group with low probabilities of CVRFs (reference group) and 2 groups that were deemed clinically important, a group with moderate‐to‐high probabilities of vascular‐dominant CVRFs and a group with moderate‐to‐high probabilities of vascular‐metabolic CVRFs. The proportion of individuals allocated to each class are provided in Table 3. Modal class posterior probabilities for the 3‐class CVRF model are plotted in Figure 2.
Table 2.
Model Fitness Characteristics for Baseline Cardiovascular Risk Factor Data (N=12 412)
| Characteristic | 1 class | 2 classes | 3 classes | 4 classes | 5 classes | 6 classes |
|---|---|---|---|---|---|---|
| VLMRT | … | <0.001 | 0.191 | 0.533 | 0.460 | 0.626 |
| LMRT | … | <0.001 | 0.193 | 0.535 | 0.461 | 0.636 |
| AIC | 85 928.591 | 82 923.199 | 82 685.362 | 82 624.443 | 82 602.016 | 82 601.102 |
| BIC | 85 980.576 | 83 034.595 | 82 856.169 | 82 854.662 | 82 891.646 | 82 950.144 |
| ssaBIC | 85 958.331 | 82 986.927 | 82 783.078 | 82 756.147 | 82 767.709 | 82 800.783 |
| Entropy | … | 0.524 | 0.692 | 0.505 | 0.517 | 0.554 |
AIC indicates Akaike information criterion; BIC, Bayesian Information Criterion; LMRT; Lo‐Mendell‐Rubin adjusted likelihood ratio test; ssaBIC, sample‐size adjusted Bayesian Information Criterion; and VLMRT, Vuong‐Lo‐Mendell‐Rubin adjusted likelihood ratio test.
Table 3.
Proportion of Individuals Within Each Class for Each Model
| Class | 1 class | 2 classes | 3 classes | 4 classes | 5 classes | 6 classes |
|---|---|---|---|---|---|---|
| 1 | 12 412 (100%) | 5204 (42%) | 5721 (46%) | 830 (7%) | 6698 (53%) | 6693 (54%) |
| 2 | 7208 (58%) | 5398 (43%) | 2021 (16%) | 2896 (23%) | 18 (0.1%) | |
| 3 | 1293 (11%) | 2818 (23%) | 824 (7%) | 644 (5%) | ||
| 4 | 6743 (54%) | 645 (5%) | 1722 (14%) | |||
| 5 | 1349 (11%) | 2907 (23%) |
Figure 2. Modal class posterior probabilities for the 3‐class model solution with baseline cardiovascular risk factors (CVRFs).
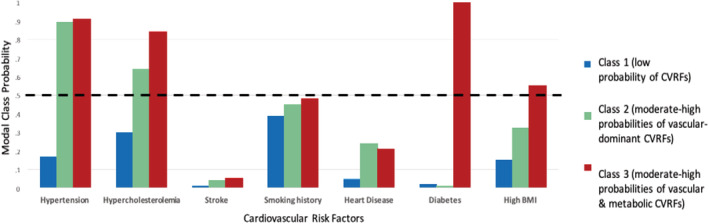
BMI indicates body mass index.
Description of Latent Class‐Derived CVRF Groups
Of the 3 latent groups identified, 1 included individuals with low probabilities of CVRFs (reference group, N=5398), because none of the CVRFs reached a loading threshold of 0.5. A second group included individuals with high probabilities of hypertension and hypercholesterolemia (vascular‐dominant group, N=5721). A third group included individuals with high probabilities of hypertension, hypercholesterolemia, and the metabolic CVRFs, diabetes, and high body mass index (vascular‐metabolic group, N=1293).
Demographic Comparisons Between Latent Class‐Derived CVRF Groups
Compared with the reference group, the vascular‐dominant and vascular‐metabolic groups were significantly older, had fewer years of education, lower Mini‐Mental State Exam scores, and had a greater proportion of men. Compared with the reference group, the vascular‐dominant group also demonstrated slightly lower probabilities of apo E4 allele presence, and the vascular‐metabolic group had a significantly younger age of death (Table 4). Given the differences in demographic characteristics between the CVRF groups, all baseline demographic variables were included as covariates when investigating risks on incident AD, mortality, and mortality‐adjusted AD. Because age of death was not collected at baseline, this variable was not entered as a covariate.
Table 4.
Demographic Differences Between Groups
| Reference, N=5398 | Vascular‐dominant, N=5721 | Vascular‐ metabolic, N=1293 | Unstandardized coefficients | ||
|---|---|---|---|---|---|
| Vascular‐dominant vs reference group | Vascular‐metabolic vs reference group | ||||
| Age, y | 66.6 (1.2) | 75.5 (0.7) | 72.2 (0.6) | β, 8.90; SE, 1.17; P<0.001 | β, 5.57; SE, 0.99; P<0.001 |
| Age of death, y | 88.7 (1.4) | 89.7 (1.1) | 84.3 (1.4) | β, 0.90; SE, 0.01; P=0.39 | β, −4.40; SE, 0.01; P<0.001 |
| Education | 16.4 (0.1) | 15.5 (0.2) | 15.3 (0.3) | β, −1.20; SE, 0.27; P<0.001 | β, −1.68; SE, 0.35; P<0.001 |
| MMSE | 29.2 (0.04) | 28.7 (0.1) | 28.5 (0.1) | β, −0.45; SE, 0.07; P<0.001 | β, −0.67; SE, 0.12; P<0.001 |
| Sex, men | 1565 (29%) | 2288 (40%) | 504 (39%) | OR, 0.60; 95% CI, 0.75–0.97; P<0.001 | OR, 0.63; 95% CI, 0.51–0.77; P<0.001 |
| apo E4 allele | 1727 (32%) | 1659 (29%) | 388 (30%) | OR, 0.85; 95% CI, 0.74–0.97; P=0.02 | OR, 0.90; 95% CI, 0.78–1.04; P=0.17 |
β indicates β coefficient; MMSE, Mini‐Mental State Exam; and OR, odds ratio.
Associations With Incident AD, Mortality, and Mortality‐Adjusted AD
Incident AD
The incidence of AD was greatest in the vascular‐dominant group, followed by the vascular‐metabolic group, and the reference group. However, statistical significance was achieved when comparing the vascular‐dominant group with the reference group only (Table 5).
Table 5.
Between‐Group Differences in Incident AD
| Difference | Reference, N=5398 | Vascular‐dominant, N=5721 | Vascular/metabolic, N=1293 | Unstandardized coefficients | |
|---|---|---|---|---|---|
| Vascular‐dominant vs reference group | Vascular‐metabolic vs reference group | ||||
| Incident AD | 269 (5%) | 514 (9%) | 91 (7%) | OR, 1.74; 95% CI, 1.28–2.36; P<0.001 | OR, 1.30; 95% CI, 0.94–1.80; P=0.11 |
Values are presented as number (%) unless otherwise indicated. AD indicates Alzheimer disease; and OR, odds ratio.
Mortality
Mortality was greatest in the vascular‐dominant group, followed by the vascular‐metabolic group and the reference group. Both the vascular‐dominant and vascular‐metabolic groups had a significantly greater odds of mortality compared with the reference group (Table 6).
Table 6.
Between‐Group Differences in Mortality
| Difference | Reference, N=5398 | Vascular‐dominant, N=5721 | Vascular‐ metabolic, N=1293 | Unstandardized coefficients | |
| Vascular‐dominant vs reference group | Vascular‐metabolic vs reference group | ||||
| Mortality | 130 (2%) | 457 (8%) | 52 (4%) | OR, 3.26; 95% CI, 2.40–4.43; P<0.001 | OR, 1.84; 95% CI, 1.13–3.00; P=0.02 |
Values are presented as number (%) unless otherwise indicated. OR indicates odds ratio.
Mortality‐Adjusted Incident AD
Compared with the reference group, the vascular‐dominant and vascular‐metabolic groups had a significantly greater incidence of AD while remaining alive throughout follow‐up (Table 7).
Table 7.
Between‐Group Differences in Those Who Died Without Progressing to AD and in Those Who Remained Alive and Progressed to AD
| Difference | Reference, N=5398 | Vascular‐dominant, N=5721 | Vascular‐ metabolic, N=1293 | Unstandardized coefficients | |
|---|---|---|---|---|---|
| Vascular‐dominant vs reference group | Vascular‐metabolic vs reference group | ||||
| Alive with AD | 151 (2.8%) | 246 (4.3%) | 53 (4.1%) | OR, 1.54; 95% CI, 1.09–2.12; P=0.02 | OR, 1.46; 95% CI, 1.01–2.11; P=0.04 |
Values are presented as number (%) unless otherwise indicated. AD indicates Alzheimer disease; and OR, odds ratio.
DISCUSSION
This study identified 3 distinct groups of CVRFs in cognitively normal elderly individuals, which included low probabilities of CVRFs (reference group), high probabilities of vascular‐dominant CVRFs, and high probabilities of vascular‐metabolic CVRFs. The vascular‐dominant group had a significantly greater incidence of AD compared with the reference group, whereas the vascular‐metabolic group did not. However, mortality was likely a competing risk that attenuated the association between the vascular‐metabolic group and incident AD as in those who remained alive throughout the study; both CVRF groups had an increased incidence of AD compared with the reference group.
The negative effects of individual and multiple CVRFs on dementia and mortality have been well documented in epidemiological studies. 1 , 4 , 11 Although those studies emphasize the importance of identifying, preventing, and treating CVRFs, they do not provide insight on how CVRFs co‐occur with one another, limiting their ability to guide clinical‐ and research‐based decisions involving risk stratification. Furthermore, we determined that most CVRFs were significantly associated with one another, strongly supporting that the presence of comorbid CVRFs would confound the investigation of individual CVRFs on incident AD and lead to inaccurate estimates. Therefore, to evaluate the real‐world impact of CVRFs on AD, CVRF multimordbidity must be considered. By using an LCA, we were able to avoid the methodological limitations encountered by previous studies and identify distinct groups of CVRFs that are reflective of the multiple origins of CVRFs.
The reference group included individuals who were comparatively healthier than either of the CVRF groups, because they had lower probabilities of CVRFs and had the lowest rates of mortality. Interestingly, the proportion of individuals allocated to the reference group was greater than the proportion of individuals who reported having no CVRFs in population‐based studies. 18 , 19 , 20 , 21 , 22 However, it is important to note that individuals in the reference group had low probabilities of CVRFs and were not completely void of CVRFs. In those who remained alive throughout the study, the incidence of AD was significantly greater in the vascular‐dominant and vascular‐metabolic groups compared with the reference group. Because the mortality‐adjusted incidence of AD in the 2 CVRF groups were similar to one another, this suggests that both latent groups had similar risks of progression to AD. Because the vascular‐dominant group had higher probabilities of 2 CVRFs, and the vascular‐metabolic group had higher probabilities of 4 CVRFs, these findings contradict studies that have reported a dose‐related increase in the risk of AD with an increase in the number of CVRFs. 6 This discrepancy may be attributable to the role of selective mortality, because the vascular‐metabolic group had a significantly younger age of death compared with the vascular‐dominant group and reference group. Therefore, individuals in the vascular‐metabolic group may have been more likely to die before progressing to AD, and the risk of progression to AD in those with metabolic risk factors, such as diabetes, may have been significantly underreported in previous studies. Differences in methodologies may have also contributed to the discrepancy between our findings and those reported in previous studies on the risk of AD. Specifically, previous studies have calculated a measurement of vascular burden by summing the number of CVRFs; however, this does not provide insight on the cause of the CVRFs and assumes that the risk of each CVRF on AD is the same. This contradicts biological studies reporting differential associations between individual CVRFs and AD‐related outcomes. 23 , 24 Understanding the causation differences between the vascular‐dominant and vascular‐metabolic groups would assist in identifying group‐specific treatments that can be used to reduce the risk of AD. For example, the presence of hypertension in the vascular‐dominant group may be attributable to vascular causes such as poor regulation of the renin‐angiotensin‐aldosterone system, 25 renal artery stenosis, 26 or coarctation of the major aorta. 27 In the vascular‐metabolic group, hypertension may be caused by underlying metabolic syndrome because of co‐occurrence with diabetes and obesity. 28 Therefore, targeting the underlying cause of each vascular group may reduce their respective risks of progression to AD.
Studies investigating the use of cardiovascular medications on cognitive function, risk of AD, and AD‐related biomarkers would provide insight into potential treatments that may improve AD risk within each CVRF group. Although clinical trials have reported mixed findings or low effect sizes with antihypertensive 29 and cholesterol‐lowering agents 30 on dementia risk, this may be attributable to short trial durations, the use of single tests to assess cognitive function, or heterogeneity within the study population. Although this prompts the need for high‐quality clinical trials that consider those limitations, retrospective studies provide valuable insight into the potential cognitive and biological benefits associated with cardiovascular medications. Angiotensin receptor blockers, a class of antihypertensive medications that have the ability to cross the blood–brain barrier, have been associated with reduced cognitive decline and amyloid‐β 31 , 32 and τ pathology. 32 Statins for hypercholesterolemia have been associated with a reduced risk of AD, 33 with potential benefits on amyloid‐β and τ pathology. 34 Investigating whether the benefits of those medications are specific to each CVRF group would inform the need to stratify individuals to guide treatment decisions and monitor treatment response. With regard to antidiabetic medications, metformin use has been associated with greater memory function in cognitively normal individuals, whereas dipeptidyl peptidase‐4 inhibitor use has been associated with slower rates of memory decline in individuals with AD. 35 Therefore, antidiabetic medications may offer cognitive benefits and reduce the risk of AD in the vascular‐metabolic group. Physical activity has also been shown to improve cognitive and AD‐related biomarker outcomes in those with CVRFs, and therefore may reduce the risk of AD. 36 , 37 , 38 However, the intensity, duration, and type of physical activity needed to obtain benefits within each CVRF group and lower vascular burden should be investigated further. The presence of hypoxia, 39 sleep apnea, 40 and physical inactivity 41 should also be investigated as potential latent indicators, because each have been associated with poor AD‐related outcomes. We were not able to investigate the role of these risk factors, because they were not available in the NACC data set.
Future studies investigating biological differences between the CVRF groups would provide insight into potential mechanisms of association with AD. Studies investigating differences in AD‐specific markers, such as amyloid‐β and τ, would confirm a link between each CVRF group and AD. Preclinical and clinical studies have reported associations between hypertension and hypercholesterolemia and increased amyloid‐β and τ pathology. 42 , 43 , 44 However, the association between metabolic risk factors and AD‐specific markers have not been conclusive, suggesting the role of other potential markers. 45 , 46 Neuropathological studies comparing differences in AD, cerebrovascular disease, and other neurodegenerative disease pathologies, such as TDP‐43 (TAR DNA‐binding protein 43), frontotemporal lobar degeneration, and Lewy body disease, would provide insight into other contributing pathologies associated with progression to AD within each CVRF group, and would provide dementia diagnosis confirmation. Postmortem studies in individuals with AD strongly support the role of mixed pathology, particularly vascular pathology, in those with cardiovascular disease. 47 Therefore, findings from neuropathological studies would strengthen our understanding about the biological association between each CVRF group and AD.
Study strengths included a large sample size of sufficient power to conduct an LCA with several CVRFs and the inclusion of relevant covariates. Using an LCA, we were able to use a person‐centered statistical approach that considered the distribution of our data, which was essential to investigating our study objectives. The NACC data set is a well‐characterized data set with diagnoses determined by experienced clinicians, and included a thorough collection of medical and medication history that allowed us to identify the presence or absence of multiple CVRFs. This data set also had a long duration of follow‐up that allowed us to investigate the effect of latent‐derived CVRF groups on the incidence of AD and mortality. Although the NACC used a complex sampling design by recruiting individuals from several Alzheimer disease research centers across North America, we were able to account for this by conducting our LCA within a multilevel design. This ensured that our results were not biased by the hierarchical data structure. We also used novel statistical methods to account for potential classification errors that are encountered by LCA models with an entropy below 0.90. 15 The consideration of mortality is also an important strength of this analysis given the advanced age of the study population and the long duration of follow‐up. Without accounting for mortality, the reported risk of incident AD may have been underestimated, because individuals may not have survived long enough to progress to AD.
The findings of this study should be interpreted in the context of several limitations. As participants were recruited from urban specialist memory clinics, this study sample may not be representative of the general population. Furthermore, this study included individuals who were highly educated and who were primarily White, which may not be representative of low‐ or middle‐income countries where it has been shown that low education is significantly associated with poor outcomes in those with cardiovascular disease. 11 , 48 Our study did not have an equal proportion of men to women. However, given the elderly study population, and the lower life expectancy of men compared with women, 49 the greater proportion of women in our study is expected. Nevertheless, we were able to account for sex, among other covariates, in our analyses. We were also unable to obtain information on the onset of each CVRF, and therefore cannot not infer conclusions based on the presence of midlife versus late‐life presence of CVRFs.
In summary, we identified 3 groups of CVRFs using an LCA, a data‐driven approach that overcomes the limitations of studies investigating individual CVRFs, or the sum of CVRFs. Using an LCA to cluster CVRFs identified meaningful groups that were further investigated for differences in incident AD and mortality. After accounting for mortality, the incidence of AD was significantly greater in the vascular‐dominant and vascular‐metabolic groups compared with the reference group. This classification model can be used in future studies to investigate between‐group differences in biological markers and treatment response, which may in turn identify group‐specific treatment strategies for AD risk mitigation.
Sources of Funding
M.R.: Canadian Institutes of Health Research Postdoctoral Fellowship Award. H.C.‐G.: None. W.S.: Canada Research Chairs Program, Canadian Institutes of Health Research (PJT‐159711), The Alzheimer's Association (AARG501466), Michael J. Fox Foundation (Target Advancement Program [Spring, 2019]), The Alzheimer's Association (US), Weston Brain Institute, and Alzheimer's Research UK (2019 Biomarkers Across Neurodegenerative Diseases). N.H.: Alzheimer's Drug Discovery Foundation (grant number 2016354), the Alzheimer Society of Canada, Canadian Institutes of Health Research, National Institute on Aging (R01AG046543), Brain Canada, Alzheimer's Association. K.L.: National Institute of Aging, Alzheimer's Drug Discovery Foundation (grant number 2016354), Alzheimer's Association (PTCG‐20‐700751), Canadian Institutes of Health Research, Weston Brain Institute (CT190002), National Institute on Aging (R01AG046543). S.E.B.: Canadian Institutes of Health Research (number 125740 and number 13129), Heart & Stroke Foundation Canadian Partnership for Stroke Recovery. The funders were not involved at any stage of the study.
Disclosures
None.
Supporting information
Table S1
Acknowledgments
The NACC database is funded by National Institute on Aging/National Institutes of Health grant U01 AG016976. NACC data are contributed by the National Institute on Aging–funded Alzheimer disease research centers: P30 AG019610 (PI E. Reiman, MD), P30 AG013846 (PI N. Kowall, MD), P50 AG008702 (PI S. Small, MD), P50 AG025688 (PI A. Levey, MD, PhD), P50 AG047266 (PI T. Golde, MD, PhD), P30 AG010133 (PI A. Saykin, PsyD), P50 AG005146 (PI M. Albert, PhD), P50 AG005134 (PI B. Hyman, MD, PhD), P50 AG016574 (PI R. Petersen, MD, PhD), P50 AG005138 (PI M. Sano, PhD), P30 AG008051 (PI T. Wisniewski, MD), P30 AG013854 (PI R. Vassar, PhD), P30 AG008017 (PI J. Kaye, MD), P30 AG010161 (PI D. Bennett, MD), P50 AG047366 (PI V. Henderson, MD, MS), P30 AG010129 (PI C. DeCarli, MD), P50 AG016573 (PI F. LaFerla, PhD), P50 AG005131 (PI J. Brewer, MD, PhD), P50 AG023501 (PI B. Miller, MD), P30 AG035982 (PI R. Swerdlow, MD), P30 AG028383 (PI L. Van Eldik, PhD), P30 AG053760 (PI H. Paulson, MD, PhD), P30 AG010124 (PI J. Trojanowski, MD, PhD), P50 AG005133 (PI O. Lopez, MD), P50 AG005142 (PI H. Chui, MD), P30 AG012300 (PI R. Rosenberg, MD), P30 AG049638 (PI S. Craft, PhD), P50 AG005136 (PI T. Grabowski, MD), P50 AG033514 (PI S. Asthana, MD, FRCP), P50 AG005681 (PI J. Morris, MD), P50 AG047270 (PI S. Strittmatter, MD, PhD).
Presented in part at the Canadian Consortium on Neurodegeneration in Aging (CCNA) Partners Forum and Science Days 2021, held virtually, October 12–15, 2021, and published in abstract form [Can Geriatr J. 2022;25:110–126].
For Sources of Funding and Disclosures, see page 8.
References
- 1. Baumgart M, Snyder HM, Carrillo MC, Fazio S, Kim H, Johns H. Summary of the evidence on modifiable risk factors for cognitive decline and dementia: a population‐based perspective. Alzheimer's Dement. 2015;11:718–726. doi: 10.1016/j.jalz.2015.05.016 [DOI] [PubMed] [Google Scholar]
- 2. Leritz EC, McGlinchey RE, Kellison I, Rudolph JL, Milberg WP. Cardiovascular disease risk factors and cognition in the elderly. Curr Cardiovasc Risk Rep. 2011;5:407–412. doi: 10.1007/s12170-011-0189-x [DOI] [PMC free article] [PubMed] [Google Scholar]
- 3. Luchsinger J, Reitz C, Honig LS, Tang MX, Shea S, Mayeux R. Aggregation of vascular risk factors and risk of incident Alzheimer's disease. Neurology. 2005;65:545–551. doi: 10.1212/01.wnl.0000172914.08967.dc [DOI] [PMC free article] [PubMed] [Google Scholar]
- 4. Purnell C, Gao S, Callahan CM, Hendrie HC. Cardiovascular risk factors and incident Alzheimer disease: a systematic review of the literature. Alzheimer Dis Assoc Disord. 2009;23:1–10. doi: 10.1097/WAD.0b013e318187541c [DOI] [PMC free article] [PubMed] [Google Scholar]
- 5. Honig LS, Tang MX, Albert S, Costa R, Luchsinger J, Manly J, Stern Y, Mayeux R. Stroke and the risk of Alzheimer disease. Archiv Neurol. 2003;60:1707–1712. doi: 10.1001/archneur.60.12.1707 [DOI] [PubMed] [Google Scholar]
- 6. Peters R, Booth A, Rockwood K, Peters J, D'Este C, Anstey KJ. Combining modifiable risk factors and risk of dementia: a systematic review and meta‐analysis. BMJ Open. 2019;9:e022846. [DOI] [PMC free article] [PubMed] [Google Scholar]
- 7. Yaffe K, Bahorik AL, Hoang TD, Forrester S, Jacobs DR Jr, Lewis CE, Lloyd‐Jones DM, Sidney S, Reis JP. Cardiovascular risk factors and accelerated cognitive decline in midlife: the CARDIA study. Neurology. 2020;95:e839–e846. doi: 10.1212/WNL.0000000000010078 [DOI] [PMC free article] [PubMed] [Google Scholar]
- 8. Olaya B, Moneta MV, Bobak M, Haro JM, Demakakos P. Cardiovascular risk factors and memory decline in middle‐aged and older adults: the English longitudinal study of ageing. BMC Geriatr. 2019;19:337. doi: 10.1186/s12877-019-1350-5 [DOI] [PMC free article] [PubMed] [Google Scholar]
- 9. Tchistiakova E, MacIntosh BJ. Summative effects of vascular risk factors on cortical thickness in mild cognitive impairment. Neurobiol Aging. 2016;45:98–106. doi: 10.1016/j.neurobiolaging.2016.05.011 [DOI] [PubMed] [Google Scholar]
- 10. Rabin JS, Yang H‐S, Schultz AP, Hanseeuw BJ, Hedden T, Viswanathan A, Gatchel JR, Marshall GA, Kilpatrick E, Klein H, et al. Vascular risk and β‐amyloid are synergistically associated with cortical tau. Ann Neurol. 2019;85:272–279. doi: 10.1002/ana.25399 [DOI] [PMC free article] [PubMed] [Google Scholar]
- 11. Dagenais GR, Leong DP, Rangarajan S, Lanas F, Lopez‐Jaramillo P, Gupta R, Diaz R, Avezum A, Oliveira GBF, Wielgosz A, et al. Variations in common diseases, hospital admissions, and deaths in middle‐aged adults in 21 countries from five continents (PURE): a prospective cohort study. Lancet. 2020;395:785–794. doi: 10.1016/S0140-6736(19)32007-0 [DOI] [PubMed] [Google Scholar]
- 12. de Bruijn RFAG, Ikram MA. Cardiovascular risk factors and future risk of Alzheimer's disease. BMC Med. 2014;12:130. doi: 10.1186/s12916-014-0130-5 [DOI] [PMC free article] [PubMed] [Google Scholar]
- 13. Clinical guidelines on the identification, evaluation, and treatment of overweight and obesity in adults–the evidence report. National Institutes of Health. Obesity Res. 1998;6:51S–209S. [PubMed] [Google Scholar]
- 14. Vermunt JK, Magidson J. Latent Class Analysis. Thousand Oaks, California; Sage Publications, Inc; 2004. [Google Scholar]
- 15. Vermunt JK. Latent class modeling with covariates: two improved three‐step approaches. Polit Anal. 2010;18:450–469. doi: 10.1093/pan/mpq025 [DOI] [Google Scholar]
- 16. Bolck A, Croon M, Hagenaars J. Estimating latent structure models with categorical variables: one‐step versus three‐step estimators. Polit Anal. 2004;12:3–27. doi: 10.1093/pan/mph001 [DOI] [Google Scholar]
- 17. Nasserinejad K, van Rosmalen J, de W K, Lesaffre E. Comparison of criteria for choosing the number of classes in Bayesian finite mixture models. PLoS One. 2017;12:e0168838. doi: 10.1371/journal.pone.0168838 [DOI] [PMC free article] [PubMed] [Google Scholar]
- 18. Kalmijn S, Foley D, White L, Burchfiel CM, Curb JD, Petrovitch H, Ross GW, Havlik RJ, Launer LJ. Metabolic cardiovascular syndrome and risk of dementia in Japanese‐American elderly men. Arterioscler Thromb Vasc Biol. 2000;20:2255–2260. doi: 10.1161/01.ATV.20.10.2255 [DOI] [PubMed] [Google Scholar]
- 19. Whitmer RA, Sidney S, Selby J, Johnston SC, Yaffe K. Midlife cardiovascular risk factors and risk of dementia in late life. Neurology. 2005;64:277–281. doi: 10.1212/01.WNL.0000149519.47454.F2 [DOI] [PubMed] [Google Scholar]
- 20. Kivipelto M, Ngandu T, Fratiglioni L, Viitanen M, Kåreholt I, Winblad B, Helkala EL, Tuomilehto J, Soininen H, Nissinen A. Obesity and vascular risk factors at midlife and the risk of dementia and Alzheimer disease. Archiv Neurol. 2005;62:1556–1560. doi: 10.1001/archneur.62.10.1556 [DOI] [PubMed] [Google Scholar]
- 21. Qiu C, Xu W, Winblad B, Fratiglioni L. Vascular risk profiles for dementia and Alzheimer's disease in very old people: a population‐based longitudinal study. J Alzheimer's Dis. 2010;20:293–300. doi: 10.3233/JAD-2010-1361 [DOI] [PubMed] [Google Scholar]
- 22. Rönnemaa E, Zethelius B, Lannfelt L, Kilander L. Vascular risk factors and dementia: 40‐year follow‐up of a population‐based cohort. Dement Geriatr Cogn Disord. 2011;31:460–466. [DOI] [PubMed] [Google Scholar]
- 23. Cheng YW, Chiu MJ, Chen YF, Cheng TW, Lai Y‐M, Chen T‐F. The contribution of vascular risk factors in neurodegenerative disorders: from mild cognitive impairment to Alzheimer's disease. Alzheimer's Res Ther. 2020;12:91. doi: 10.1186/s13195-020-00658-7 [DOI] [PMC free article] [PubMed] [Google Scholar]
- 24. Toledo JB, Toledo E, Weiner MW, Jack CR, Jagust W, Lee VMY, Shaw LM, Trojanowski JQ. Alzheimer's disease neuroimaging initiative. Cardiovascular risk factors, cortisol, and amyloid‐β deposition in Alzheimer's disease neuroimaging initiative. Alzheimer's Dement. 2012;8:483–489. doi: 10.1016/j.jalz.2011.08.008 [DOI] [PMC free article] [PubMed] [Google Scholar]
- 25. te Riet L, van Esch JHM, Roks AJM, van den Meiracker AH, Danser AHJ. Hypertension. Circulation Res. 2015;116:960–975. doi: 10.1161/CIRCRESAHA.116.303587 [DOI] [PubMed] [Google Scholar]
- 26. Herrmann SM, Textor SC. Renovascular hypertension. Endocrinol Metab Clin NA. 2019;48:765–778. doi: 10.1016/j.ecl.2019.08.007 [DOI] [PMC free article] [PubMed] [Google Scholar]
- 27. Kenny D, Polson JW, Martin RP, Paton JF, Wolf AR. Hypertension and coarctation of the aorta: an inevitable consequence of developmental pathophysiology. Hyperten Res. 2011;34:543–547. [DOI] [PubMed] [Google Scholar]
- 28. Grundy SM. Inflammation, hypertension, and the metabolic syndrome. J Am Med Assoc. 2003;290:3000–3002. doi: 10.1001/jama.290.22.3000 [DOI] [PubMed] [Google Scholar]
- 29. Staessen JA, Thijs L, Richart T, Odili AN, Birkenhäger WH. Placebo‐controlled trials of blood pressure‐lowering therapies for primary prevention of dementia. Hypertension. 2011;57:e6–e7. doi: 10.1161/HYPERTENSIONAHA.110.165142 [DOI] [PubMed] [Google Scholar]
- 30. Sano M, Bell KL, Galasko D, Galvin JE, Thomas RG, van Dyck CH, Aisen PS. A randomized, double‐blind, placebo‐controlled trial of simvastatin to treat Alzheimer disease. Neurology. 2011;77:556–563. doi: 10.1212/WNL.0b013e318228bf11 [DOI] [PMC free article] [PubMed] [Google Scholar]
- 31. Ouk M, Wu CY, Rabin JS, Jackson A, Edwards JD, Ramirez J, Masellis M, Swartz RH, Herrmann N, Lanctôt KL, et al. The use of angiotensin‐converting enzyme inhibitors vs. angiotensin receptor blockers and cognitive decline in Alzheimer's disease: the importance of blood‐brain barrier penetration and APOE ε4 carrier status. Alzheimer's Res Ther. 2021;13:13. doi: 10.1186/s13195-021-00778-8 [DOI] [PMC free article] [PubMed] [Google Scholar]
- 32. Ouk M, Wu CY, Rabin JS, Edwards JD, Ramirez J, Masellis M, Swartz RH, Herrmann N, Lanctôt KL, Black SE, et al. Associations between brain amyloid accumulation and the use of angiotensin‐converting enzyme inhibitors versus angiotensin receptor blockers. Neurobiol Aging. 2021;100:22–31. doi: 10.1016/j.neurobiolaging.2020.12.011 [DOI] [PubMed] [Google Scholar]
- 33. Schultz BG, Patten DK, Berlau DJ. The role of statins in both cognitive impairment and protection against dementia: a tale of two mechanisms. Transl Neurodegener. 2018;7:7. doi: 10.1186/s40035-018-0110-3 [DOI] [PMC free article] [PubMed] [Google Scholar]
- 34. Li HH, Lin CL, Huang CN. Neuroprotective effects of statins against amyloid β‐induced neurotoxicity. Neural Regeneration Res. 2018;13:198. doi: 10.4103/1673-5374.226379 [DOI] [PMC free article] [PubMed] [Google Scholar]
- 35. Wu C, Ouk M, Wong YY, Anita NZ, Edwards JD, Yang P, Shah BR, Herrmann N, Lanctôt KL, Kapral MK, et al. Relationships between memory decline and the use of metformin or DPP4 inhibitors in people with type 2 diabetes with normal cognition or Alzheimer's disease, and the role APOE carrier status. Alzheimer's Dement. 2020;16:1663–1673. doi: 10.1002/alz.12161 [DOI] [PMC free article] [PubMed] [Google Scholar]
- 36. Rabin JS, Klein H, Kirn DR, Schultz AP, Yang HS, Hampton O, Jiang S, Buckley RF, Viswanathan A, Hedden T, et al. Associations of physical activity and β‐amyloid with longitudinal cognition and neurodegeneration in clinically Normal older adults. JAMA Neurol. 2019;76:1203–1210. doi: 10.1001/jamaneurol.2019.1879 [DOI] [PMC free article] [PubMed] [Google Scholar]
- 37. Soares‐Miranda L, Siscovick DS, Psaty BM, Longstreth W Jr, Mozaffarian D. Physical activity and risk of coronary heart disease and stroke in older adults: the cardiovascular health study. Circulation. 2016;133:147–155. doi: 10.1161/CIRCULATIONAHA.115.018323 [DOI] [PMC free article] [PubMed] [Google Scholar]
- 38. Hu G, Jousilahti P, Barengo NC, Qiao Q, Lakka TA, Tuomilehto J. Physical activity, cardiovascular risk factors, and mortality among Finnish adults with diabetes. Diabetes Care. 2005;28:799–805. doi: 10.2337/diacare.28.4.799 [DOI] [PubMed] [Google Scholar]
- 39. Sun X, He G, Qing H, Zhou W, Dobie F, Cai F, Staufenbiel M, Huang LE, Song W. Hypoxia facilitates Alzheimer's disease pathogenesis by up‐regulating BACE1 gene expression. Proc Natl Acad Sci USA. 2006;103:18727–18732. doi: 10.1073/pnas.0606298103 [DOI] [PMC free article] [PubMed] [Google Scholar]
- 40. Bubu OM, Andrade AG, Umasabor‐Bubu OQ, Hogan MM, Turner AD, de Leon MJ, Ogedegbe G, Ayappa I, Jean‐Louis GG, Jackson ML, et al. Obstructive sleep apnea, cognition and Alzheimer's disease: a systematic review integrating three decades of multidisciplinary research. Sleep Med Rev. 2020;50:101250. doi: 10.1016/j.smrv.2019.101250 [DOI] [PMC free article] [PubMed] [Google Scholar]
- 41. Hansson O, Svensson M, Gustavsson AM, Andersson E, Yang Y, Nägga K, Hållmarker U, James S, Deierborg T. Midlife physical activity is associated with lower incidence of vascular dementia but not Alzheimer's disease. Alzheimer's Res Ther. 2019;11:87. doi: 10.1186/s13195-019-0538-4 [DOI] [PMC free article] [PubMed] [Google Scholar]
- 42. Park SH, Kim JH, Choi KH, Jang YJ, Bae SS, Choi BT, Shin HK. Hypercholesterolemia accelerates amyloid β‐induced cognitive deficits. Int J Mol Med. 2013;31:577–582. [DOI] [PubMed] [Google Scholar]
- 43. Carnevale D, Mascio G, D'Andrea I, Fardella V, Bell RD, Branchi I, Pallante F, Zlokovic B, Yan SS, Lembo G. Hypertension induces brain β‐amyloid accumulation, cognitive impairment and memory deterioration through activation of rage in brain vasculature. Hypertension. 2012;60:188–197. doi: 10.1161/HYPERTENSIONAHA.112.195511 [DOI] [PMC free article] [PubMed] [Google Scholar]
- 44. Refolo LM, Pappolla MA, Malester B, LaFrancois J, Bryant‐Thomas T, Wang R, Tint GS, Sambamurti K, Duff K. Hypercholesterolemia accelerates the Alzheimer's amyloid pathology in a transgenic mouse model. Neurobiol Dis. 2000;7:321–331. [DOI] [PubMed] [Google Scholar]
- 45. Matioli MNPDS, Suemoto CK, Rodriguez RD, Farias DS, da Silva MM, Leite REP, Ferretti‐Rebustini REL, Farfel JM, Pasqualucci CA, Filho WJ, et al. Diabetes is not associated with Alzheimer's disease neuropathology. J Alzheimer's Dis. 2017;60:1035–1043. doi: 10.3233/JAD-170179 [DOI] [PMC free article] [PubMed] [Google Scholar]
- 46. Abner EL, Nelson PT, Kryscio RJ, Schmitt FA, Fardo DW, Woltjer RL, Cairns NJ, Yu L, Dodge HH, Xiong C, et al. Diabetes is associated with cerebrovascular but not Alzheimer neuropathology. Alzheimer's Dement. 2016;12:882–889. doi: 10.1016/j.jalz.2015.12.006 [DOI] [PMC free article] [PubMed] [Google Scholar]
- 47. Kapasi A, Schneider JA. Vascular contributions to cognitive impairment, clinical Alzheimer's disease, and dementia in older persons. Biochim Biophys Acta (BBA) ‐ Mol Basis Dis. 2016;1862:878–886. doi: 10.1016/j.bbadis.2015.12.023 [DOI] [PMC free article] [PubMed] [Google Scholar]
- 48. Schultz WM, Kelli HM, Lisko JC, Varghese T, Shen J, Sandesara P, Quyyumi AA, Taylor HA, Gulati M, Harold JG, et al. Socioeconomic status and cardiovascular outcomes: challenges and interventions. Circulation. 2018;137:2166–2178. doi: 10.1161/CIRCULATIONAHA.117.029652 [DOI] [PMC free article] [PubMed] [Google Scholar]
- 49. Crimmins EM, Shim H, Zhang YS, Kim JK. Differences between men and women in mortality and the health dimensions of the morbidity process. Clin Chem. 2019;65:135–145. doi: 10.1373/clinchem.2018.288332 [DOI] [PMC free article] [PubMed] [Google Scholar]
Associated Data
This section collects any data citations, data availability statements, or supplementary materials included in this article.
Supplementary Materials
Table S1