Abstract
Lung group 2 innate lymphoid cells (ILC2) determine the nature of the immune response to airway allergens. Some microbial products, including those stimulating interferons, block ILC2 activation, but whether this occurs following natural infections or causes durable ILC2 inhibition is unclear. We tested this using a model of physiological microbial exposures through cohousing laboratory and pet store mice. Laboratory mice cohoused for two weeks displayed an impaired ILC2 response and reduced lung eosinophilia toward intranasal allergens, while these responses were restored in mice cohoused at least two months. ILC2 inhibition at two weeks correlated with increased interferon receptor signaling, which waned by two months of cohousing. Re-induction of interferons in two-month cohoused mice blocked ILC2 activation. These findings suggest ILC2 respond dynamically to environmental cues and that microbial exposures do not dictate long-term desensitization of innate type-2 responses to allergens.
Introduction
The incidence of allergic and atopic conditions has increased over the last century and this rise is attributed in part to changes in microbial exposures1, 2. The most common allergic responses are mediated by type-2 immunity, characterized by cytokines interleukin-4 (IL-4), IL-5, and IL-13, and recruitment of eosinophils, mast cells, and other immune cells into the lungs3. Historically, CD4+ type-2 T helper cells (Th2) were thought to be the main producers of IL-5 and IL-13 and thus studied as the cellular mediators of allergic conditions. However, since the discovery and characterization of tissue resident innate lymphoid cells (ILCs) in the past decade, the large contribution of group 2 ILCs (ILC2s) in allergic responses has been appreciated4. Specifically, lung-resident ILC2s rapidly respond to inflammatory signals such as IL-33, which is released by lung cells in response to protease-containing allergens 5. In addition to producing effector cytokines that drive mucus production and eosinophil recruitment, lung ILC2s directly interact with antigen-specific CD4+ T cells6, 7, 8. In mouse models, preventing ILC2 activation leads to a substantial defect in type-2 responses to allergens 6, 7, 8. ILC2 are implicated in pathogenesis of allergic rhinitis, chronic rhinosinusitis, and allergic asthma and are considered a potential target for development of treatments for these conditions9, 10.
The hygiene hypothesis and the related “old friends” hypothesis posit improved sanitation and hygiene reduce exposure to pathogens and commensals leading to inappropriate responses to allergens11. Retrospective and prospective studies of children have found a compelling impact of exposures to microbes on allergic sensitization; having older siblings, early-age daycare, and growing up on a farm are thought to be proxies for increased microbial exposures and are associated with lower allergic sensitization risk12, 13, 14, 15. Additional studies have more directly made connections between microbes and allergies; high endotoxin levels in household dust, increased intestinal microbial diversity, and lack of antibiotic use in infancy are all associated with lower risk of atopy16, 17, 18, 19. Animal models have been employed to tease apart potential mechanisms for these phenomena. Microbial products or synthetic analogs such as unmethylated CpG DNA, household dust containing endotoxin, bacterial lysate OM-85, and double stranded RNA analog poly(I:C) all decrease type-2 immune responses to allergens 20, 21, 22, 23, 24, 25. Intranasal administration of Heligmosomoides polygyrus-derived protein HpARI interferes with ILC2-activating cytokine IL-33 and prevents sensitization to airway allergens26, 27. Deliberate infection with a gammaherpesvirus was also found to be protective in an allergic asthma model28. Type I and II interferons (IFN-I and IFN-II) induced by acute viral infection or microbial products reduced IL-5 and IL-13 production by ILC224, 29, 30, 31. These studies largely focus on acute effects of individual pathogens or treatment with microbial products; short- and long-term effects of diverse, physiologically acquired infections on the immune response to inhaled allergens have not been assessed.
Improved animal models that test the impact of microbial experience on the immune response to allergens would be useful for clinicians andbasic researchers. Our group and others have developed novel models to determine how exposure to distinct commensal microbes and/or pathogens affects immune responses in mice32, 33, 34, 35. As we have previously published, inbred laboratory mice cohoused with a pet store mouse continuously for two months acquire natural infections, resulting in an immune-experienced phenotype32. The gene expression signature of peripheral blood mononuclear cells (PBMC) of cohoused mice more closely resembles that of human PBMC, while the transcriptome of PBMC from SPF mice more closely resembles neonatal cord blood32. Physiological transmission of microbes is not expected to be instantaneous but immune responses (including T cell activation and antibody responses to pathogens) are evident by approximately 2 weeks of cohousing. We sought to utilize this “dirty mouse” model to test whether physiological microbial exposures could alter lung ILC2 responses to airway allergens both early and later in cohousing.
Here we show cohousing laboratory mice with pet store mice, allowing physiological transfer of murine pathogens and commensal microbes, leads to suppression of innate type-2 responses to airway allergens when allergen exposure occurs within two weeks of cohousing. This inhibition correlates with a peak in systemic pro-inflammatory cytokines and IFN-I sensing in the lungs. In contrast, innate responses to allergens are not suppressed in mice cohoused for at least two months, but reinduction of IFNs using poly(I:C) is sufficient to once again impair type-2 responses. Together, these data indicate lung ILC2 are highly sensitive to recent inhibitory signals induced by infection, but that microbial experience does not lead to sustained reprogramming of the ILC2 response against inhaled allergens, suggesting the immune system can “reset” for type-2 responses to allergens following acute control of microbial infections, with implications for developing treatments for allergic diseases.
Results
Cohousing SPF mice with pet store mice induces lung immune changes.
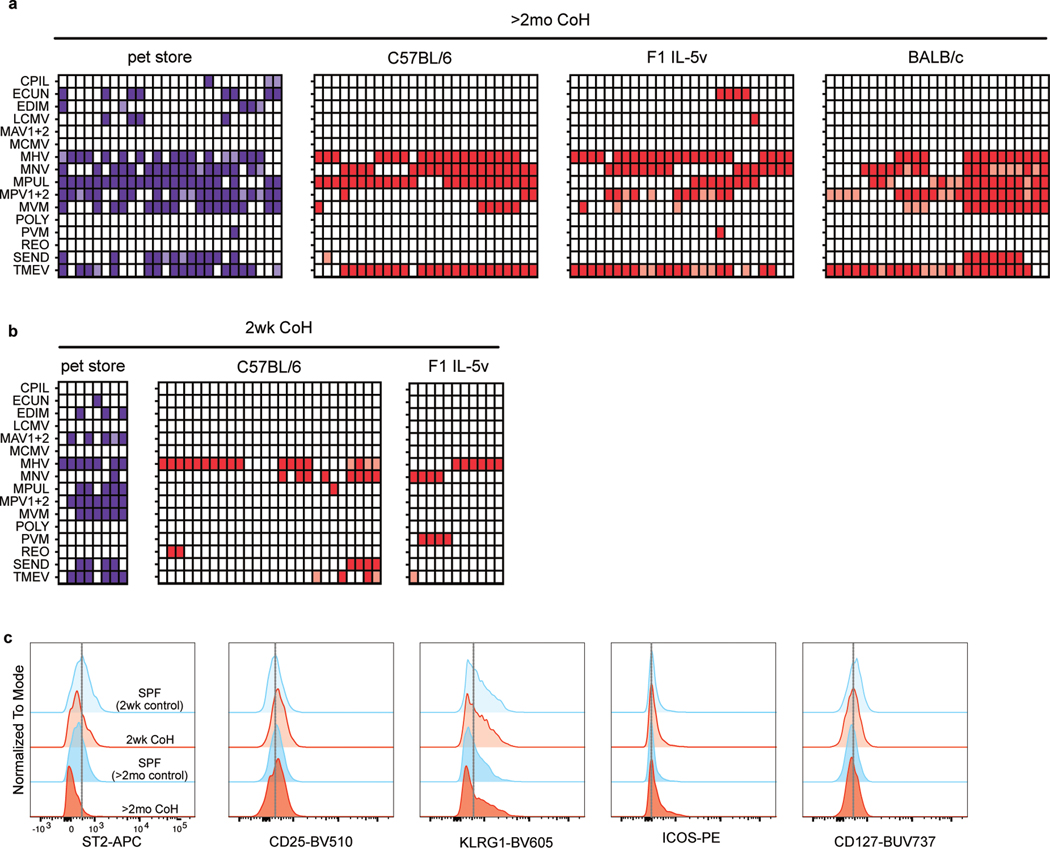
As previously described32, cohousing laboratory mice with mice from pet stores for at least two months led to seroconversion against common murine pathogens, indicative of an immune response to pathogens transmitted from the pet store mice (Extended Data Fig. 1a). In comparison, the degree of seroconversion in mice cohoused for two weeks was generally lower, suggesting ongoing infections during the first few weeks of cohousing that have not yet resulted in antibody levels detectable by serology (Extended Data Fig. 1b).
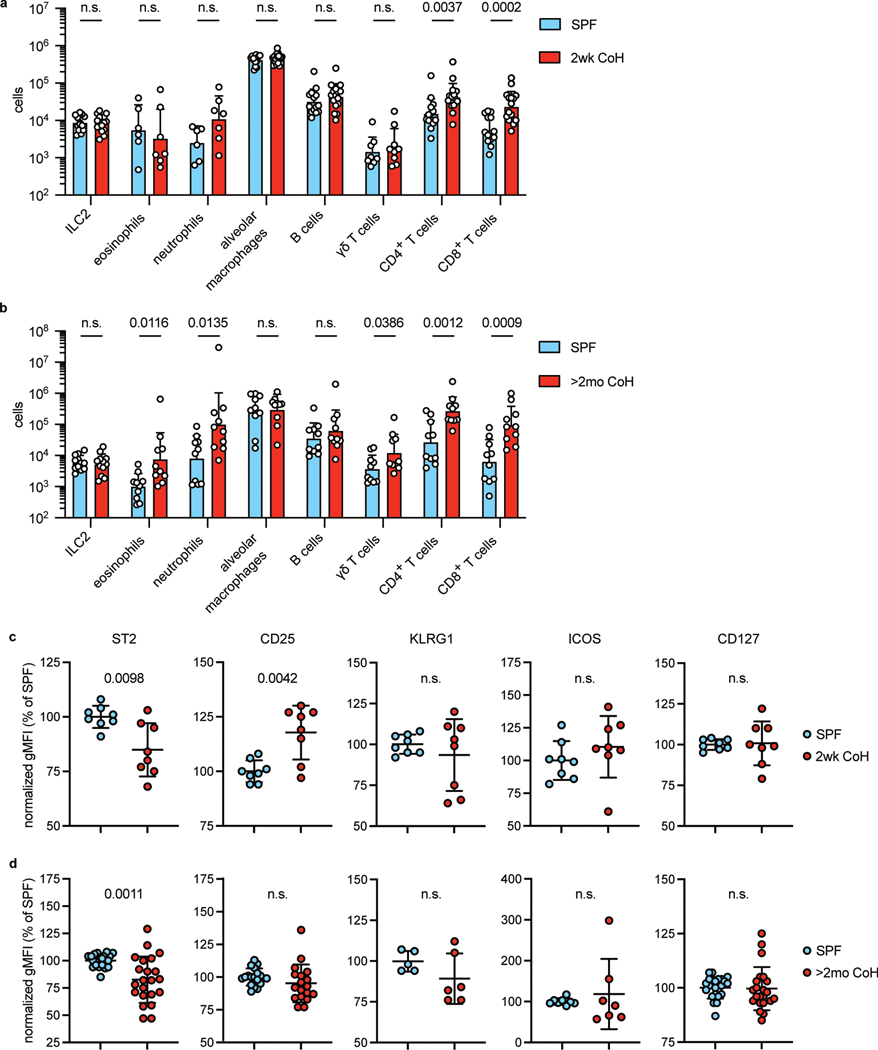
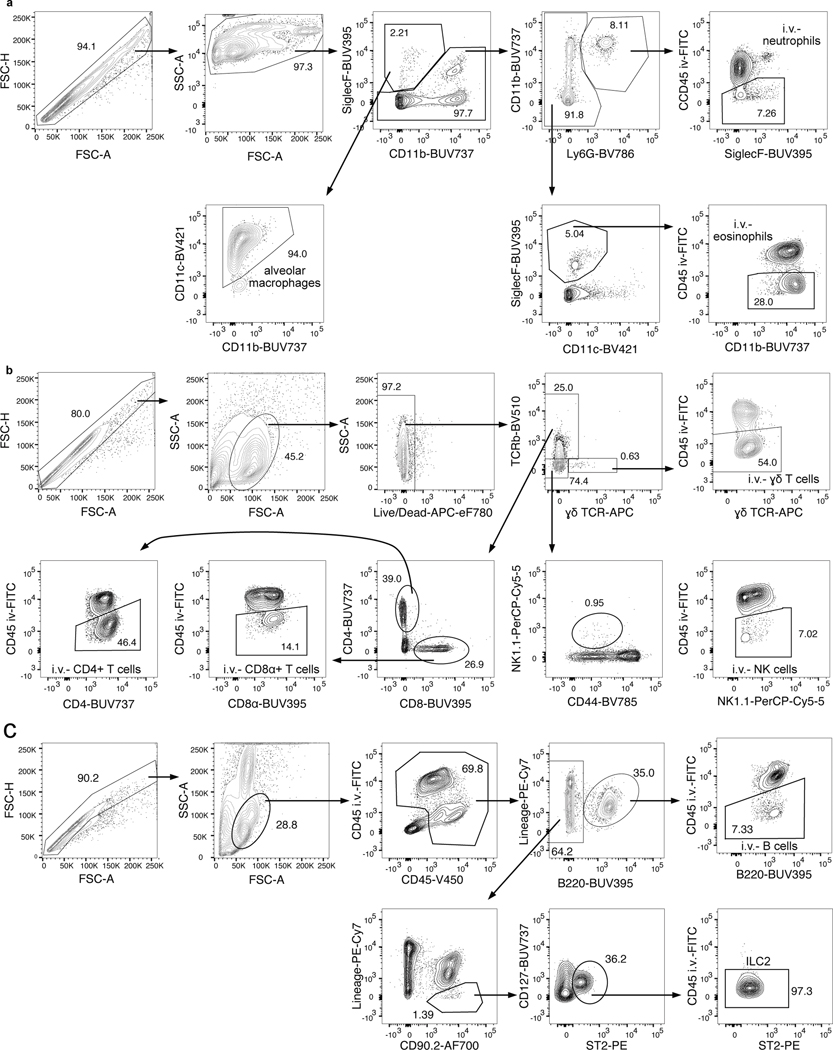
How the duration of cohousing affects lung immune cell populations, including ILC2, was unknown. We therefore examined the cellular composition of the lungs in SPF, two-week, and two-month cohoused mice. Cells were determined to be in the lungs and not in circulation by injecting a fluorescently conjugated antibody against CD45 minutes before euthanizing the animal and then identifying the cells in the intravenous CD45-negative (i.v.−) fraction (Extended Data Fig. 2). Alveolar macrophages had an i.v.-intermediate phenotype and were quantified without considering i.v. status. CD4+ and CD8+ T cell numbers increased in cohoused animals at both two weeks and two months of cohousing, and neutrophils and γδ T cells were significantly increased at two months (Fig. 1a–b). Notably, the size of the ILC2 population was unchanged by cohousing at either timepoint. Lung ILC2 were then characterized in more detail. Surface expression of ST2, the receptor for IL-33, was slightly reduced on lung ILC2 at both timepoints of cohousing, albeit with variability among experiments (Fig. 1c–d, Extended Data Fig. 1c). CD25, the high-affinity IL-2 receptor chain, was increased only on two-week cohoused lung ILC2. ILC2 had a similar surface expression of KLRG1, ICOS, and CD127 in all groups (Fig.1c–d, Extended Data Fig. 1c). Thus, the milieu of lung immune cells is influenced long-term by cohousing, ILC2 phenotype is slightly altered by physiological microbial exposure, but overall numbers of ILC2 are not impacted.
Fig. 1. Mouse lung immune cell populations are altered by cohousing.
a, Lung immune cell populations of age matched SPF and two-week cohoused (2wk CoH) B6 mice were identified and quantified by flow cytometry. All enumerated cells were i.v. CD45− except alveolar macrophages. Pooled from 7 experiments (n = 6–16/group). b, Lung immune cells quantified from age matched SPF and B6 mice cohoused for at least two months (>2mo CoH). Pooled from 3 experiments (n = 8–12/group). a, b Bar graphs show mean +SD of log transformed values. Each symbol represents a mouse. P values were determined with a Student’s t-test (two-tailed). Eosinophils in SPF vs. >2mo CoH had unequal variance and t-test was conducted with Welch’s correction; n.s. p ≥ 0.05. c-d. Geometric mean fluorescence intensity (gMFI) of surface proteins on lung ILC2 in age-matched SPF and CoH mice. gMFI normalized to SPF groups in each experiment. c, Two-week cohoused and age-matched SPF mice. Pooled from 3 experiments (n = 8/group). Data are presented as mean values +SD. d, Two-month and age-matched SPF mice. Pooled from 5 experiments (CD25, n = 18/group), 6 experiments (ST2 and CD127, n = 22/group), and two experiments (ICOS, n = 7–8/group), KLRG1, n = 5–6.group). P values were determined with a Student’s t-test (two-tailed). In comparisons with unequal variance a t-test was conducted with Welch’s correction; n.s. p ≥ 0.05. Source Data contains exact P-values and group sizes.
Short-term cohousing impairs ILC2 responses to intranasal allergens.
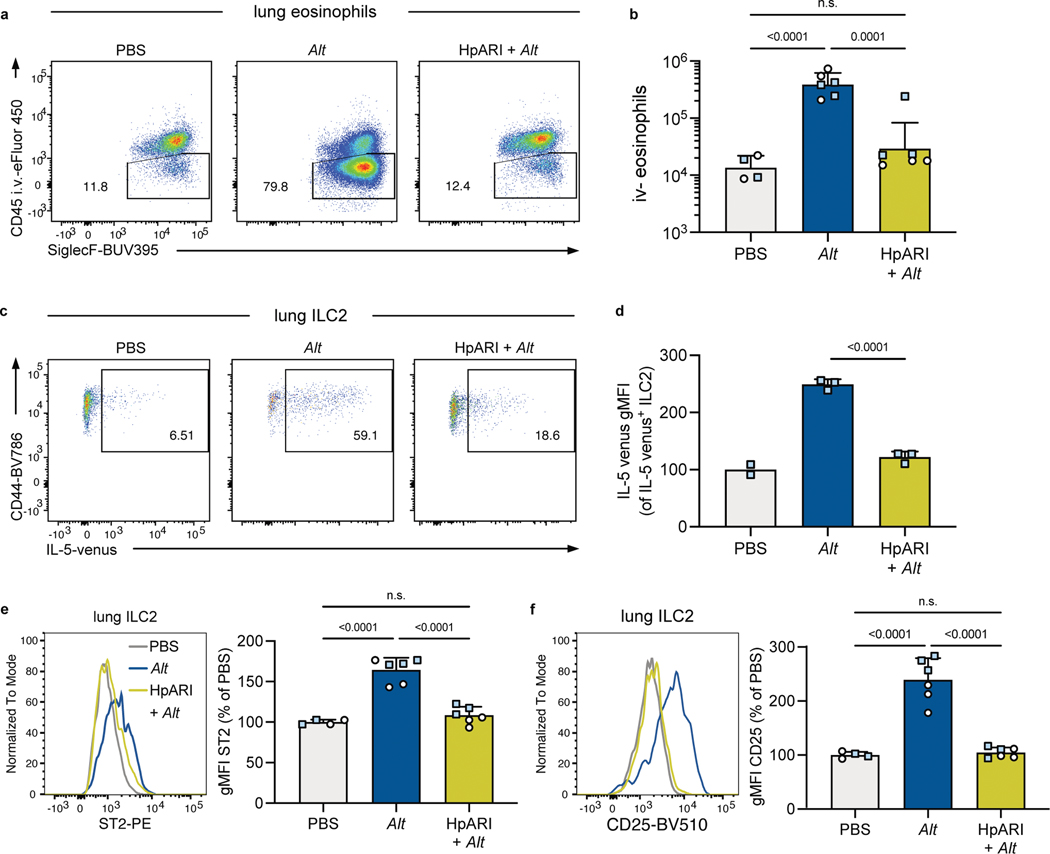
For initial studies, we used intranasal exposure with A. alternata extract (Alt), which provokes ILC2 activation and eosinophil infiltration in the lungs by 24 hours36. Both C57BL/6 (B6) and (C57BL/6 x BALB/c)F1 IL-5wt/venus (IL-5v F1) animals were used, the latter to serve as a reporter for IL-5 production. As expected, there were few i.v.− eosinophils in lungs of SPF mice given intranasal PBS, but after Alt treatment this population increased significantly by both percent i.v.− and total number (Extended Data Fig. 3a, b). Previous studies indicate the type-2 response to allergens can be inhibited by exposure to microbial products24. One example is H. polygyrus protein HpARI, known to bind and block IL-3327. Indeed, intranasal administration of HpARI concurrent with Alt exposure led to significantly reduced lung eosinophilia (Extended Data Fig. 3a, b). Likewise, HpARI inhibited production of IL-5 by lung ILC2 in response to Alt treatment, both by reduced frequency and expression intensity of the IL-5 reporter and reduced surface expression of ST2 (Extended Data Fig. 3c–d) and CD25 (Extended Data Fig. 3e–f). These results demonstrate ILC2 responses to Alt can be inhibited by microbial products in B6 and IL-5v F1 reporter mice and be read out with flow cytometry.
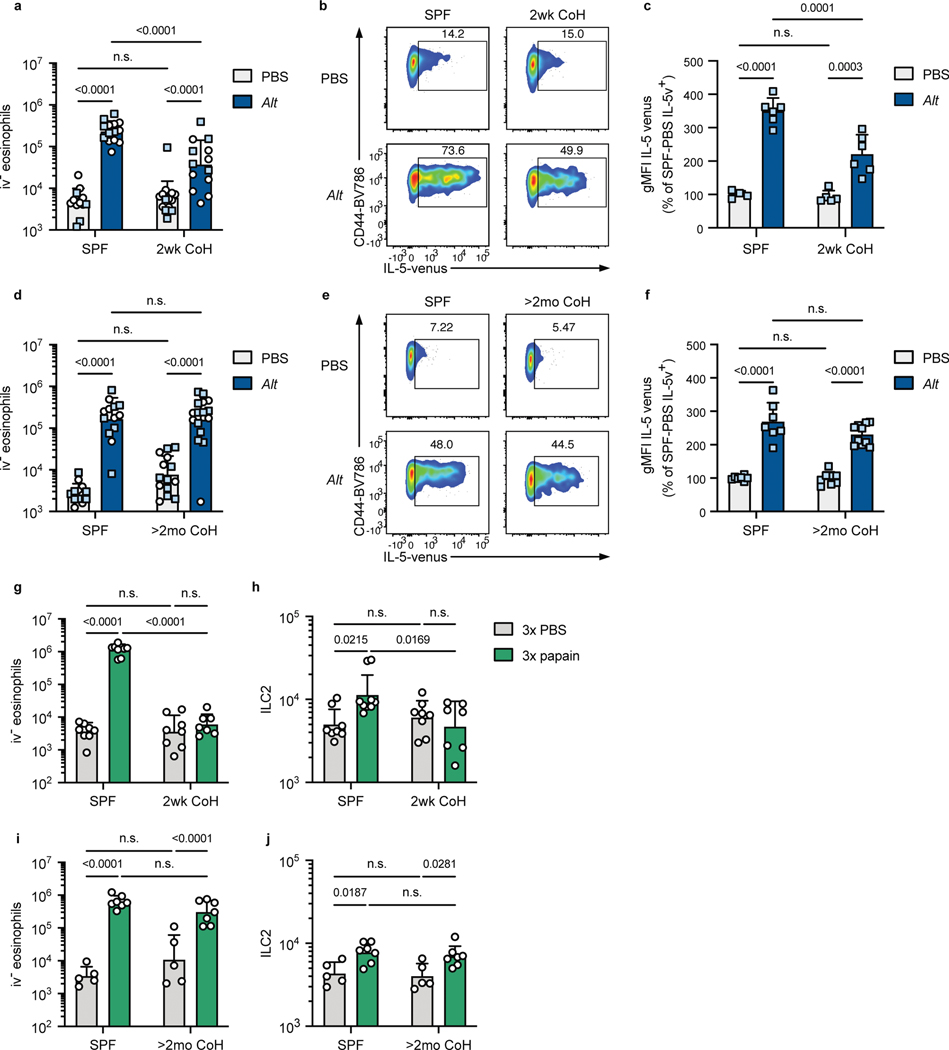
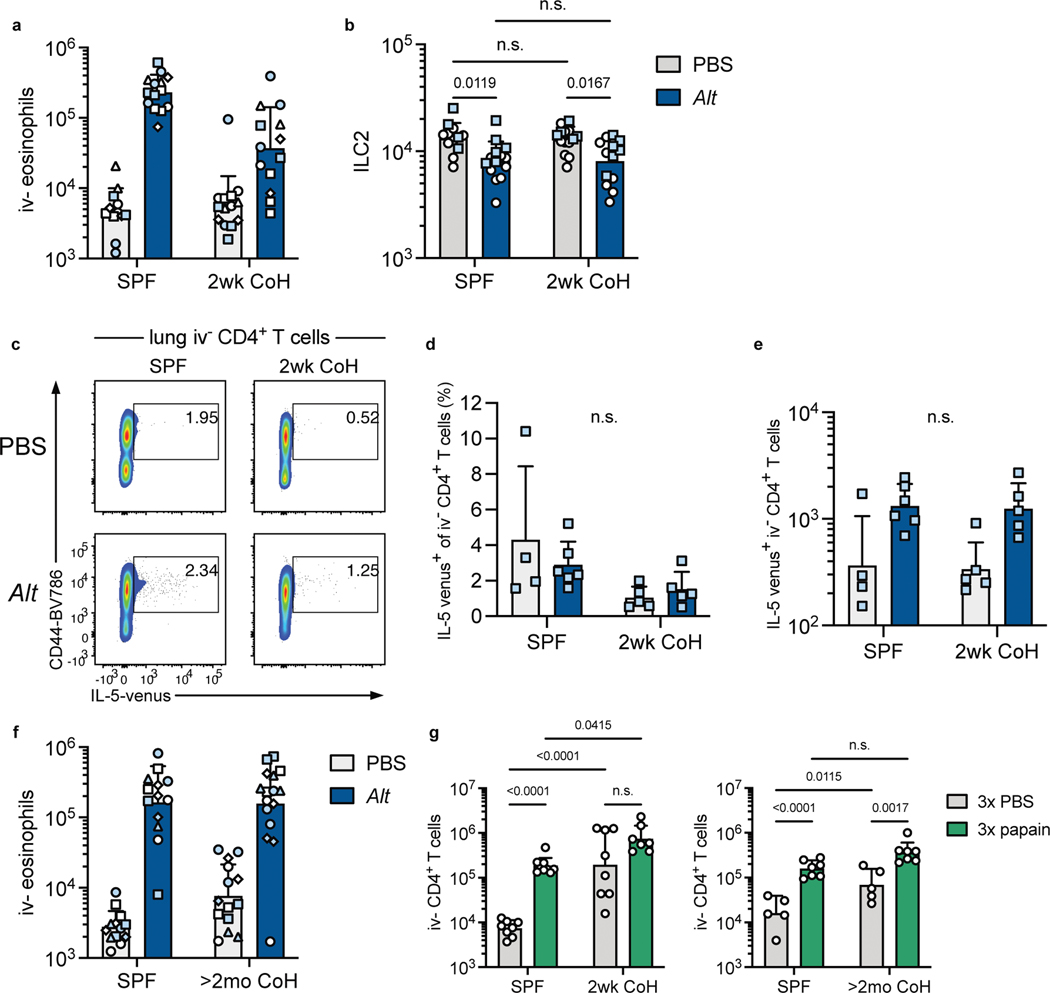
To answer whether physiological microbial exposure would impact the ILC2 response to Alt, SPF B6 and SPF IL-5v F1 animals were cohoused with pet store mice. Two weeks of cohousing led to a significant reduction in i.v.− eosinophils 24 hours after a single intranasal exposure to Alt; while eosinophil numbers increased >40-fold in SPF mice, this was limited to only a ~7-fold increase in two-week cohoused mice (Fig. 2a). This impaired response was observed over multiple experiments from independent cohousing cohorts with pet store mice purchased from multiple pet stores (Extended Data Fig. 4a). The frequency and fluorescence intensity of IL-5v+ lung ILC2 was also reduced in two-week cohoused mice exposed to Alt (Fig. 2b–c). The number of ILC2 decreased slightly 24 hours after Alt treatment in both groups (Extended Data Fig. 4b), perhaps due to the reported phenomenon of increased difficulty in extracting activated lymphocytes from tissues. We considered whether cohousing affected IL-5 producing CD4+ T cells in the lung, but the population of parenchymal CD4+ T cells was similarly small in two-week cohoused and SPF animals and no significant change in the number of IL-5v-expressing CD4+ T cells was induced by cohousing or Alt treatment (Extended Data Fig. 4c–e). These results demonstrate physiological transmission of natural murine microbes from pet store mice limits ILC2 responses against an airway allergen and reduces lung eosinophilia.
Fig. 2. Mice cohoused for two weeks with pet store mice have inhibited eosinophil and ILC2 responses to intranasal A. alternata and papain treatment.
a-f, Mice were treated once with intranasal phosphate buffered saline (PBS) or A. alternata extract in PBS (Alt) and analyzed 24 hours later. Mice were B6 (white circles) or B6xBALB/c IL-5WT/venus (IL-5v F1, light blue squares). Mice were cohoused with pet store mice for approximately two weeks (2wk CoH, a-c) or at least two months (>2mo CoH, d-f), or were age-matched specific pathogen free (SPF) mice. a, d, Number of eosinophils in the lungs and airways (CD45 i.v.−) 24 hours after intranasal treatment. b-c and e-f, IL-5 venus expression within lung ILC2 of IL-5v F1 SPF and 2wk CoH mice 24 hours after PBS or Alt treatment. b, e, Representative flow plots of IL-5 expression in lung ILC2. Numbers in plots represent percent of cells in the gate. c, f, IL-5 venus gMFI of IL-5 venus+ lung ILC2. g-j, Mice were treated with intranasal PBS or papain every other day three times and analyzed 24 hours after the last treatment. g, i, Number of lung CD45 i.v.− eosinophils in 2wk (g) or >2mo (i) CoH B6 mice or age-matched SPF controls. h, i, Number of lung ILC2 in two-week (h) or >2mo (j) CoH mice. a, d, g-j bar graphs show mean +SD of log-transformed values. c, f bar graphs show mean +SD, values from multiple experiments normalized to SPF PBS-treated mice set to 100. a pooled from four B6 experiments and two IL-5v F1 experiments (n = 12–14/group). b pooled from two IL-5v F1 experiments (n = 4–6/group). d pooled from three B6 experiments and four IL-5v F1 experiments (n = 13–16/group). f pooled from four IL-5v F1 experiments (n = 7–10/group). g, i, pooled from four experiments (n = 7–9/group). h, j, pooled from two experiments (n = 5–7/group). Each symbol represents a mouse. P values were determined with a 2-way ANOVA with Tukey’s multiple comparisons test; n.s. p ≥ 0.05. Source Data contains exact P-values and group sizes.
To determine the extent to which physiological microbial exposure led to a sustained change in the lung response to allergens, we next assessed mice cohoused long-term, for at least two months. In contrast to two-week cohoused mice, the response to Alt in two-month cohoused animals was indistinguishable from SPF animals, inducing similar numbers of i.v.− eosinophils (Fig. 2d, Extended Data Fig. 4f) and similar production of IL-5v by lung ILC2 at 24 hours after Alt treatment (Fig. 2e–f).
To test whether our findings were unique to responses against Alt, we treated mice intranasally every other day three times with papain, a cysteine protease derived from papaya, which is an occupational allergen in humans and promotes an ILC2-mediated type-2 immune response in mice37, 38. As with Alt, papain treatment induced prominent lung eosinophilia in SPF mice, but two-week cohoused mice were almost completely protected from this reaction (Fig. 2g). Lung ILC2 numbers also increased in papain-treated SPF mice but were unchanged by allergen treatment in two-week cohoused mice (Fig. 2h). Two-month cohoused mice treated with papain, on the other hand, exhibited lung eosinophilia and ILC2 expansion equal to SPF controls (Fig. 2i–j). I.v.− CD4+ T cells increased in number in SPF and two-month cohoused mice after three papain treatments but was not significantly increased after papain treatment in two-week cohoused mice (Extended Data Fig. 4g), correlating with the observed changes in eosinophils and ILC2. These results with papain confirm transient suppression of ILC2 by cohousing using an independent intranasal allergen model with repeated exposure. Together, these data suggest acute physiological microbial exposure does indeed provoke an impaired type-2 response to inhaled allergens, but this blunted response is not sustained long-term.
Delayed initial response to Alt in two-month cohoused mice.
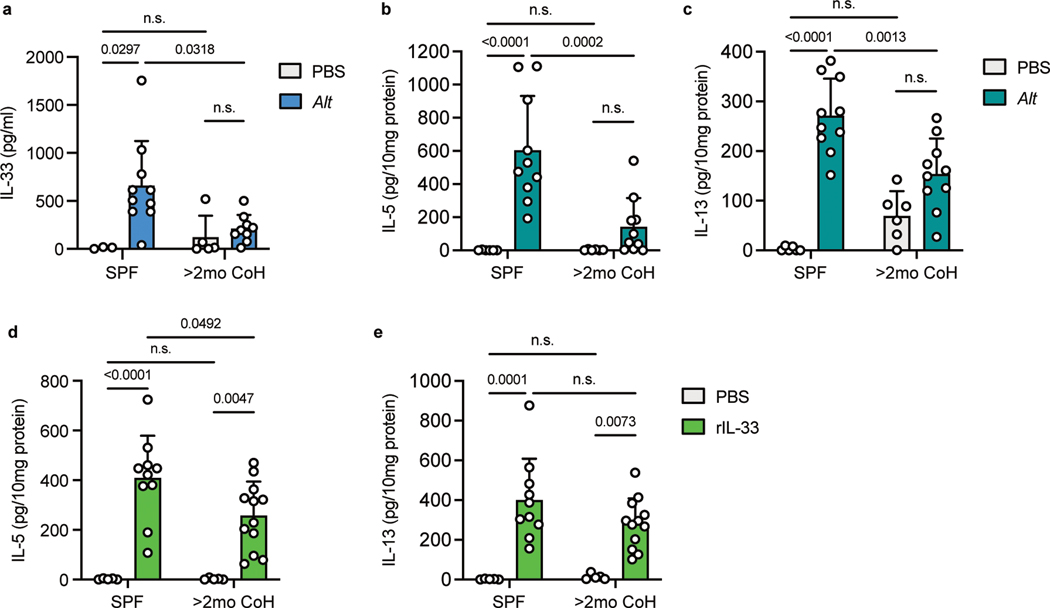
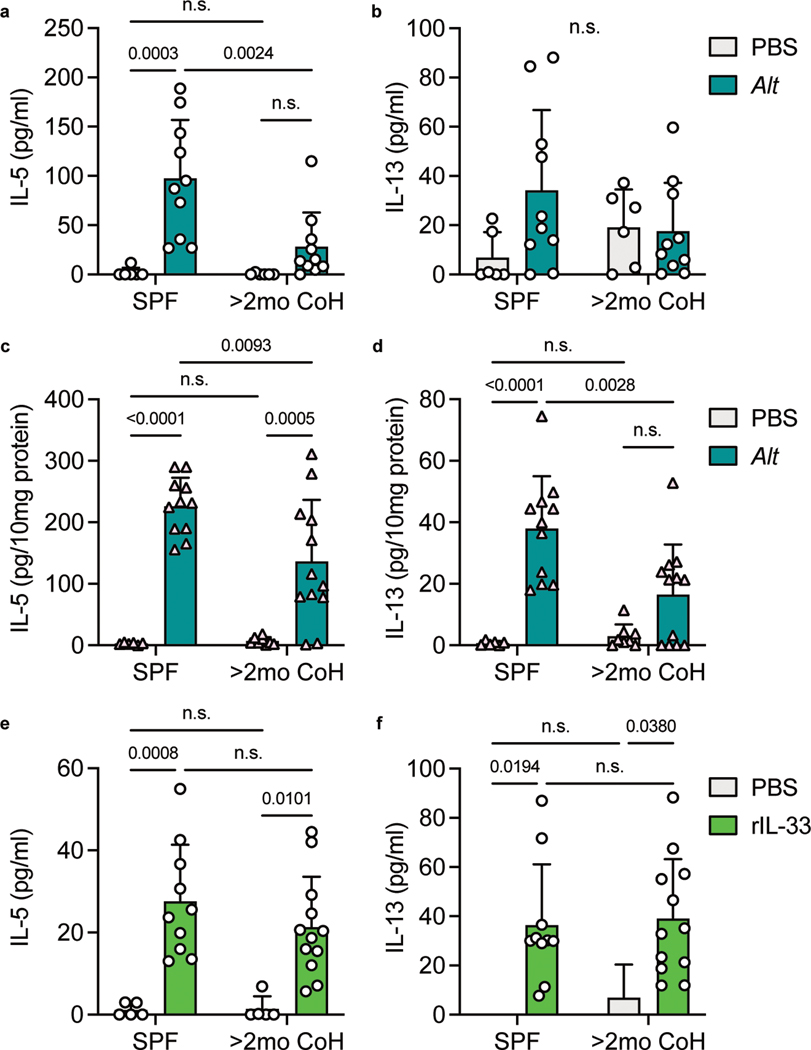
Although we observed similar eosinophil recruitment and IL-5 production 24 hours following Alt treatment in SPF and two-month cohoused mice, it was unclear whether these responses showed identical kinetics. One of the first steps in the type-2 response to acute airway allergen is the release of the alarmin IL-33, derived from the nucleus of lung cells36, 39. We collected bronchoalveolar lavage fluid (BALF) from lungs of SPF and two-month cohoused mice one hour after Alt treatment and measured IL-33 by ELISA. IL-33 was significantly lower in Alt treated long-term cohoused mice than SPF mice (Fig. 3a). To determine whether decreased IL-33 would have an impact in type-2 cytokine levels immediately after allergen treatment, BALF and lung samples were collected 4.5 hours after Alt exposure. Reflecting the lower IL-33, cohoused mice also had reduced IL-5 and IL-13 in the lungs and BALF (although IL-13 in the BALF did not reach statistical significance) (Fig. 3b–c and Extended Data Fig. 5a–b). We also measured IL-5 and IL-13 in the lungs of SPF and two-month cohoused BALB/c mice and observed a similarly reduced cytokine response at this acute 4.5 hour timepoint (Extended Data Fig. 5c–d). This, along with consistent responses in previous experiments between B6 mice and IL-5v F1 reporter mice, demonstrates the observed phenomena in cohoused mice are not specific to one inbred strain of laboratory mice. To test whether lower initial amounts of IL-5 and IL-13 were due to reduced initial IL-33 or if two-month cohoused mouse ILC2 had reduced sensitivity to IL-33, mice were treated intranasally with recombinant IL-33 and IL-5 and IL-13 were measured 4.5 hours later. We found IL-5 was slightly reduced in two-month cohoused mouse lungs, but lung IL-13 and BALF IL-5 and IL-13 were unchanged (Fig. 3d–e, Extended Data Fig. 5e–f). These results suggest lower IL-5 production 4.5 hours after Alt treatment in two-month cohoused mouse lungs is in large part due to reduced IL-33 but may also reflect reduced sensitivity to IL-33 by ILC2. Together, these findings suggest there are some sustained changes in initial responses toward Alt in two-month cohoused mice. Nevertheless, these alterations do not prevent lung ILC2 activation and efficient eosinophil infiltration 24 hours after Alt exposure in two-month cohoused mice (Fig. 2), suggesting the type-2 response to allergens is delayed but not completely inhibited by long-term cohousing with pet store mice.
Fig. 3. Acute IL-33, IL-5 and IL-13 responses after A. alternata exposure are reduced in two-month cohoused mice.
a, IL-33 in the bronchoalveolar lavage fluid (BALF) of SPF and >2mo CoH B6 mice one hour after Alt exposure, detected by ELISA. Pooled from three experiments (n = 3–10/group). b-e, Alt (b-c), recombinant IL-33 (rIL-33, d-e) or control phosphate buffered saline (PBS) were given intranasally to B6 mice and lungs and BAL were collected 4.5 hours later. IL-5 and IL-13 in the lung homogenates were detected by ELISA and normalized to the amount of total protein in the samples. b-c pooled from three experiments (n = 6–10/group). d-e pooled from three experiments (n = 5–12/group). Bar graphs show mean +SD. Each symbol represents a mouse. P values were determined with 2-way ANOVA with Tukey’s multiple comparisons test; n.s. p ≥ 0.05. Source Data contains exact P-values and group sizes.
Long-term cohousing does not impair response to repeated Alt exposure.
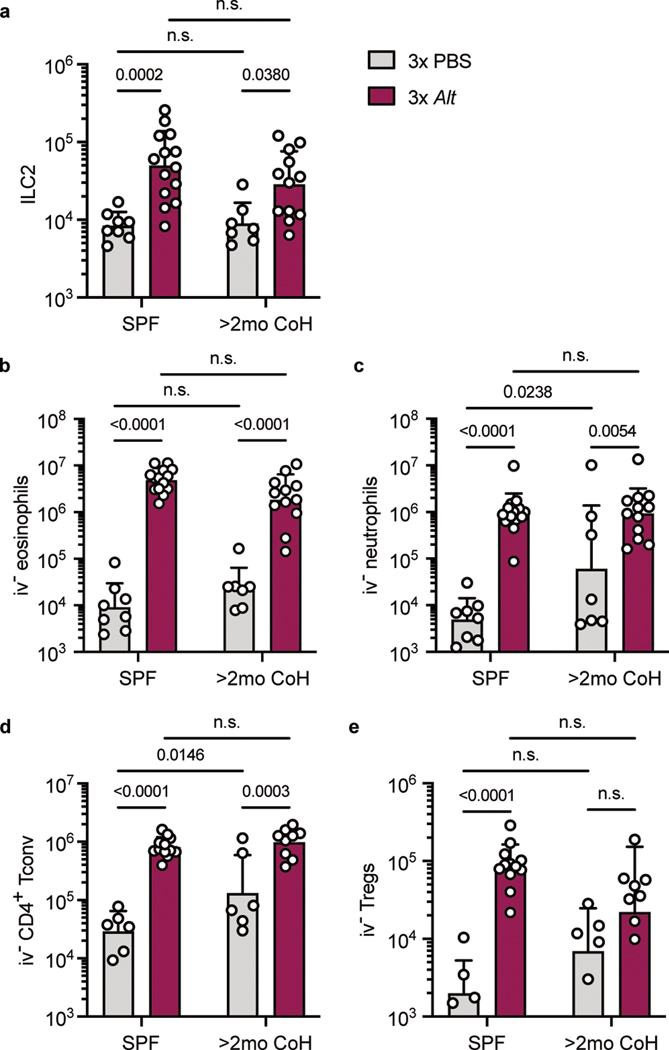
It was possible the altered initial response toward Alt in two-month cohoused mice would impact the effects of repeated Alt exposure. To test this, we adapted a model of repeated airway Alt treatment in SPF and two-month cohoused animals, treating mice intranasally with the allergen every other day three times and analyzed 24 hours later order to focus on the innate immune response. After repeated exposure to Alt, there was an expansion of ILC2 in the lungs of both SPF and two-month cohoused mice (Fig. 4a), and a subsequent recruitment and/or expansion of i.v.− eosinophils, neutrophils, and conventional (Foxp3−) and regulatory (Foxp3+) CD4+ T cells in both groups of mice (Fig. 4b–e). While most of these cell populations were slightly elevated in PBS-treated two-month cohoused mice compared to PBS-treated SPF mice, reflecting the impact of cohousing at steady-state (Fig. 1b), Alt treatment led to cell populations of approximately equal size in SPF and two-month cohoused lungs. The magnitude of the recruited or expanded populations may therefore be slightly decreased in two-month cohoused mice (since the number of cells was higher in these mice before treatment); however, a type-2 response clearly was not substantially inhibited in two-month cohoused mice after repeated allergen exposure.
Fig. 4. Comparable immune infiltration in SPF and two-month cohoused mice after repeated A. alternata exposure.
SPF and >2mo CoH B6 mice were treated on days 0, 2, and 4 with intranasal PBS or Alt and on day 5 lungs were harvested for flow cytometric analysis. All enumerated cells were i.v. CD45−. a, ILC2, b, eosinophils, c, neutrophils, d, CD4+ conventional T cells (Foxp3−), and e, Tregs (Foxp3+ CD4+ T cells). a-c pooled from three experiments, d-e pooled from three experiments (n = 4–14/group). Bar graphs show mean +SD of log transformed values. Each symbol represents a mouse. P values were determined with two-way ANOVA with Tukey’s multiple comparisons test; n.s. p ≥ 0.05. Source Data contains exact P-values and group sizes.
Cohousing rapidly and stably alters the fecal bacterial composition.
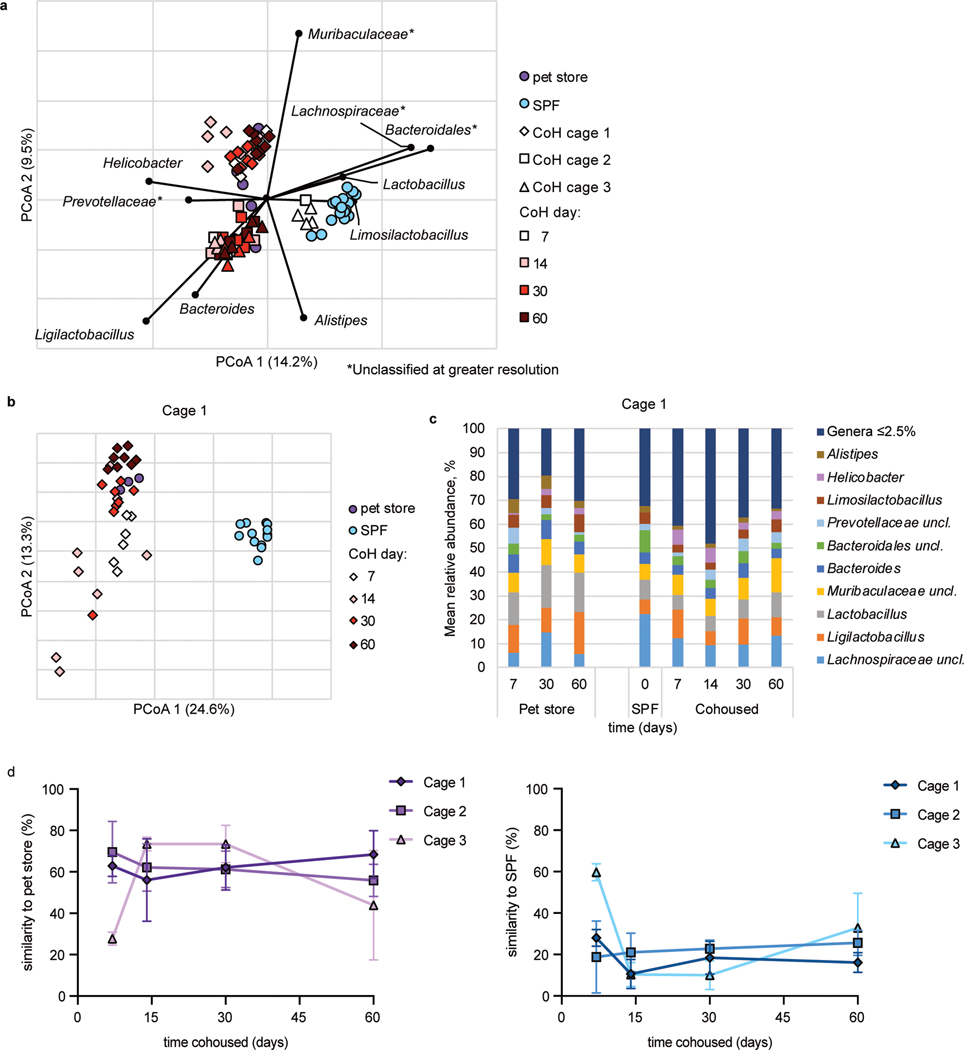
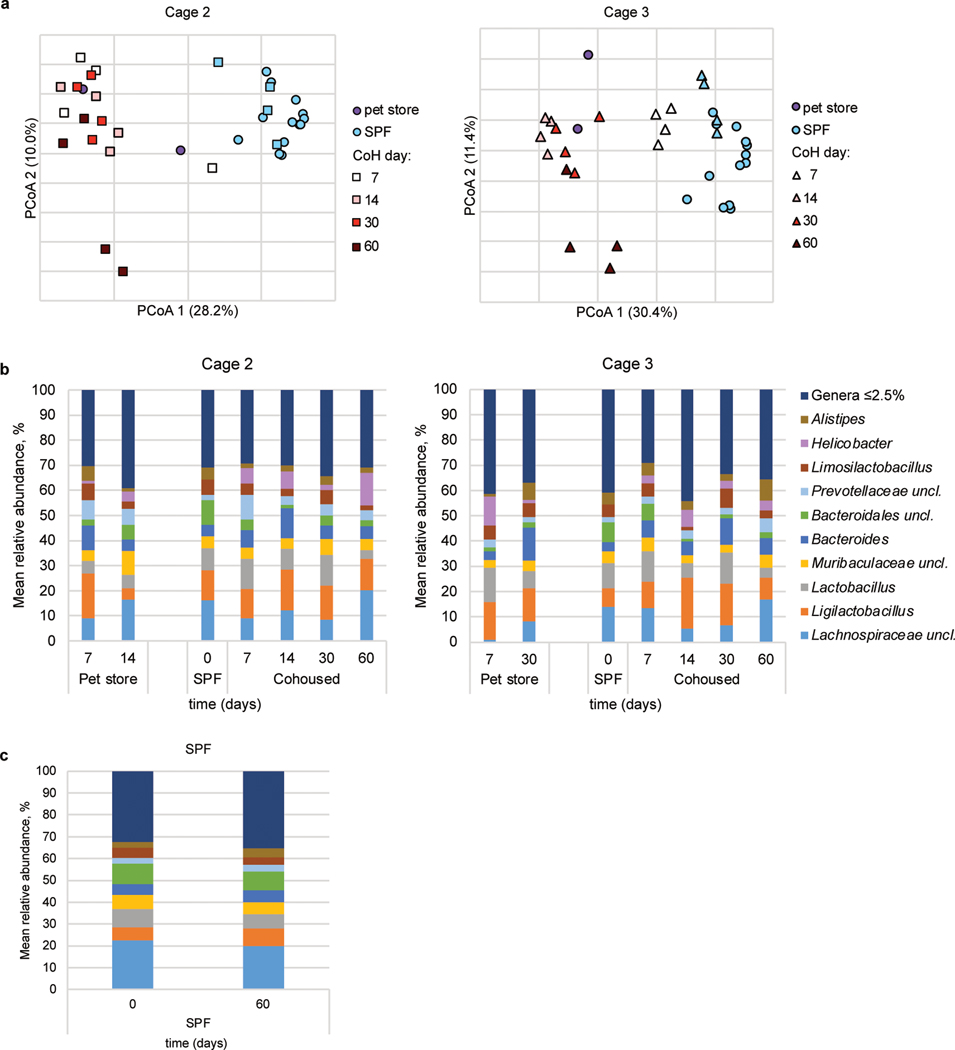
Our data indicated ILC2 responses to airway allergens is transiently inhibited by microbes introduced through cohousing (Fig. 2). One possible explanation for these findings would be changes in the commensal microbiome, with perhaps a transient change occurring two weeks after cohousing which again shifts (or reverts to the SPF microbiome) by two months of cohousing. A gut-lung axis has been described, such that bacteria in the intestines can impact immune cell function in the lungs40, 41. Furthermore, introducing microbiota from wild mice into inbred laboratory mice led to varied changes in immune reactivity34, 35, 42. Hence, fecal samples were collected from three cages throughout two months of cohousing to document changes in the microbiome using 16S rRNA amplicon sequencing. In two out of three cages analyzed using principal coordinate analysis, the microbiota of cohoused mice clustered with pet store mice and away from SPF controls by seven days (the earliest timepoint collected after cohousing), and the third cage clustered by fourteen days (Fig. 5a, b, Extended Data Fig. 6a). After cohousing, bacteria such as Lachnospiraceae and Bacteroidales became less abundant and Ligilactobacillus expanded (Fig. 5a, c, Extended Data Fig. 6a). Helicobacter was undetectable in SPF mice but was found in pet store mice and appeared after cohousing and was detectable at all timepoints (Fig. 5c, Extended Data Fig. 6b–c). SourceTracker analysis43 to assess engraftment of the pet store microbiota revealed the fecal microbiome of cohoused mice was more similar to that of pet store than SPF mice by fourteen days of cohousing in all cages and remained more similar to pet store mice (approximately 60% similarity) than SPF (approximately 25%) through sixty days of cohousing (Fig. 5d). Samples collected from SPF mice at day sixty were 80% similar to SPF samples collected at day zero when analyzed with SourceTracker. Thus, cohousing laboratory mice with mice from pet stores quickly alters the bacterial fecal microbiome and does not revert to an SPF-like community. It is possible a single group of bacteria not identifiable with this approach contributes to the effect on ILC2; however, the absence of a clear difference in the gut microbiome in two-week and two-month cohoused mice led us to investigate other potential mechanisms for suppression of the ILC2 response to allergens in short-term cohoused mice.
Fig. 5. Cohousing with pet store mice induces changes to fecal microbiota.
a, Principal coordinates analysis (PCoA) of Bray-Curtis distances (r2 = 0.43) of mouse fecal samples from three cohoused cages and SPF controls. The nine most abundant genera were correlated with axes position, where positioning near samples groups indicates a greater relative abundance of that genus. * indicates the bacterial group was unclassified at greater resolution. B6 mouse fecal samples were collected at the indicated time points after cohousing with pet store mice, SPF control samples were collected on days 0 and 60 of cohousing, and pet store mouse samples were collected at days 7, 14, 30, and 60. Not all mice had samples collected at all timepoints. b, PCoA from Cage 1. PCoA for cages 2 and 3 can be found in Extended Data Figure 6. c, Distributions of abundant genera in Cage 1 mouse fecal samples. Less abundant genera accounted for less than 2.5% of the community among all samples. Analysis for cages 2 and 3 can be found in Extended Data Figure 6. d, SourceTracker analysis of cohoused cages 1, 2, and 3 comparing the similarity of 16S rRNA amplicon sequencing of cohoused mice at the indicated timepoints to pet store and SPF sequencing. Symbols represent mean ±SD. c, Distributions of abundant genera in mouse fecal samples from Cages 2 and 3. Less abundant genera accounted for less than 2.5% of the community among all samples.
Interferon receptor signaling is transiently induced by cohousing.
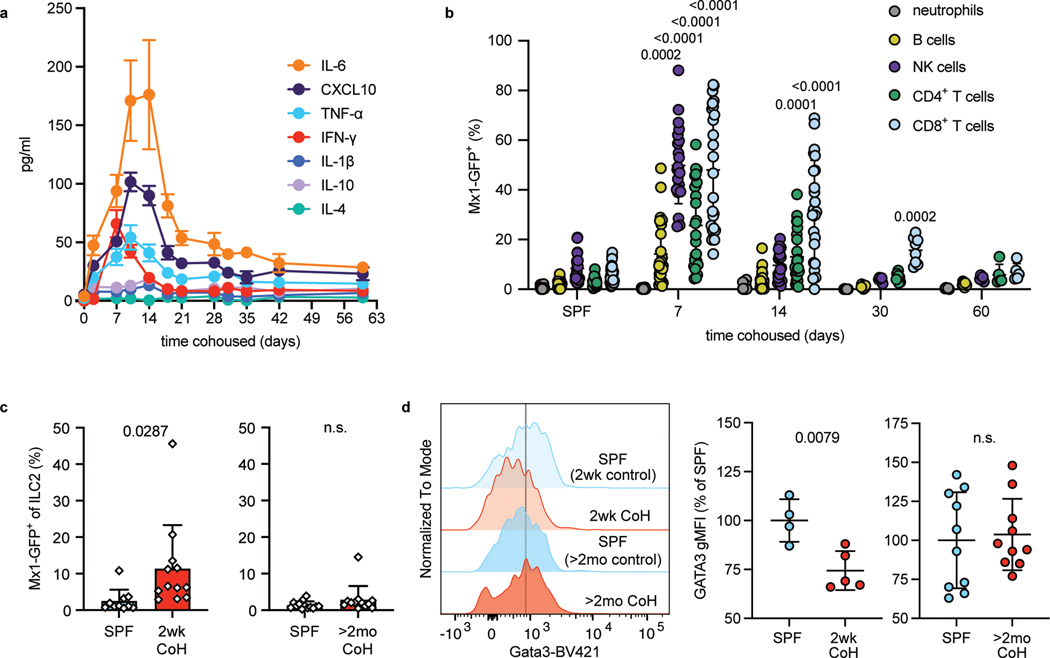
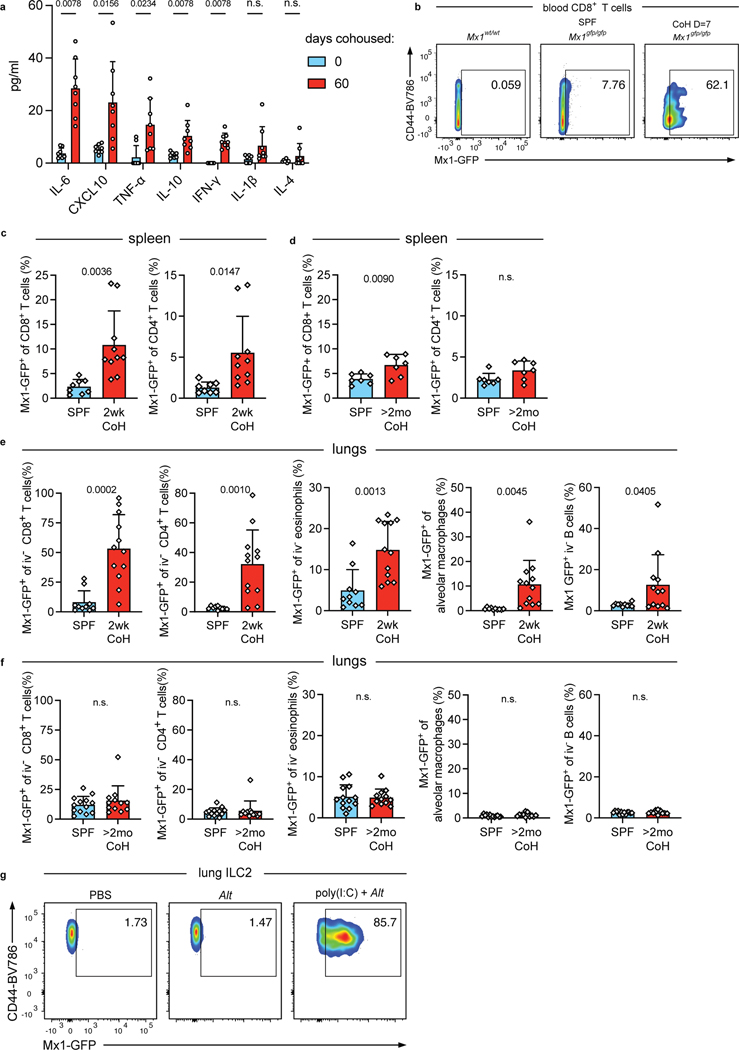
To identify differences between two weeks and two months of cohousing, we next assayed serum cytokine and chemokine levels over time to assess changes in systemic inflammation during cohousing. Most factors (including TNF-α, CXCL10, and IL-6) peaked 10–14 days after cohousing. By two months of cohousing, these factors decreased but plateaued at levels that were still elevated relative to SPF mice (Fig. 6a, Extended Data Fig. 7a). These findings align with published results showing the frequency of CD44high blood CD8+ T cells (indicative of antigen experience) also peak at approximately two weeks post cohousing32. IFN-I and IFN-II can acutely inhibit ILC2 responses24, 29, 30, 31 and CXCL10, well-characterized as being induced by IFN44, is elevated in the serum at two weeks of cohousing. These data suggest differences in IFN stimulation may correspond with the suppression of ILC2 responses early but not late after cohousing. To explore this possibility, we cohoused Mx1gfp C57BL/6 mice which express green fluorescent protein (GFP) in place of the IFN-stimulated response element-dependent gene Mx1; evidence of current or recent IFNR signaling in cells can be detected through GFP expression45. Mx1 in C57BL/6 mice is not functional and therefore cohoused Mx1gfp mice do not have impaired anti-viral responses against pathogens transmitted from pet store mice46. We first measured Mx1-GFP in immune cells in the blood of cohoused mice over time (Fig. 6b and Extended Data Fig. 7b). Immune cell populations exhibited different maximal GFP expression and had slightly different kinetics, with neutrophils being insensitive and NK cells being particularly responsive, and CD8+ T cells showing elevated GFP for the longest time. Despite the variability, evidence of IFNR signaling in cells in the blood was highest seven days after cohousing, and by sixty days of cohousing Mx1-GFP expression was no different from SPF mice (Fig. 6b). Mx1-GFP expression was also found in CD8+ and CD4+ T cells in the spleens of two-week cohoused Mx1gfp mice (Extended Data Fig. 7c), and Mx1-GFP was still slightly elevated in splenic CD8+ T cells of two-month cohoused mice but not splenic CD4+ T cells (Fig. S7d). Along with elevated serum cytokines in two-week cohoused mice (Fig. 6a) these data from Mx1gfp mice point to higher levels of systemic inflammation, and specifically IFNR signaling, in two-week cohoused versus two-month cohoused mice.
Fig. 6. Cohousing with pet store mice induces transient systemic and lung inflammation.
a, Concentration of serum cytokines and chemokines in B6 mice collected at the indicated timepoints after cohousing with a pet store mouse (n = 8). Symbols represent mean ±SD. b, Percent Mx1-GFP+ cells of the indicated cell populations in the blood of SPF or cohoused B6 Mx1gfp mice at the indicated timepoints. Bar graphs show mean +SD. P values represent the indicated group compared to the same cell population in SPF mice and were determined with a mixed-effects analysis with multiple comparisons. (n = 5–28/group). c, Percent Mx1-GFP+ in lung ILC2 two weeks or two months after cohousing and age-matched controls. 2wk CoH pooled from four experiments (n = 10–12/group).; >2mo CoH pooled from three experiments (n = 12–13/group). Bar graphs show mean +SD. Each symbol represents a mouse. P values were determined with a Student’s t-test (two-tailed) with Welch’s correction; n.s. p ≥ 0.05. d, Representative histograms and summary data of intracellular Gata3 expression in lung ILC2 from age-matched SPF and CoH mice. gMFI normalized to SPF groups in each experiment. 2wk CoH pooled from 2 experiments (n = 4–5/group), >2mo CoH pooled from 3 experiments (n = 10/group). Bar graphs show mean +SD. Each symbol represents a mouse. P values were determined with a Student’s t-test (two-tailed); n.s. p ≥ 0.05. Source Data contains exact P-values and group sizes.
We next looked for evidence of IFNR signaling in immune cells in the lungs of cohoused mice. The percent of Mx1-GFP+ lung ILC2 was significantly increased in two-week cohoused mice but by two months of cohousing, the percent positive was down to the baseline levels seen in SPF ILC2 (Fig. 6c). Lung CD4+ and CD8+ T cells, eosinophils, alveolar macrophages, and B cells also had increases in Mx1-GFP expression at two weeks of cohousing compared to SPF but again were back to SPF levels by two months (Extended Data Fig. 7e–f). These results support the possibility that increased IFNR signaling at two weeks of cohousing contributes to suppression of lung ILC2 responses to Alt, either directly in ILC2 or through other cells in the lungs acting upon ILC2. Previous work showed IFN-b and IFN-g signaling can reduce the expression of transcription factor Gata3 in lung ILC224. Gata3 was indeed decreased in ILC2 from two-week cohoused mice but not from two-month cohoused mice (Fig. 6d). A reduction in expression of a key transcription factor controlling the ILC2 cell program provides a plausible explanation for the reduction in IL-5 production in response to airway allergens (Fig. 2). Testing the necessity of IFNs for suppression of ILC2 at two weeks of cohousing was not feasible due to impaired anti-viral responses and increased mortality in cohoused interferon alpha receptor and interferon lambda receptor deficient mice47.
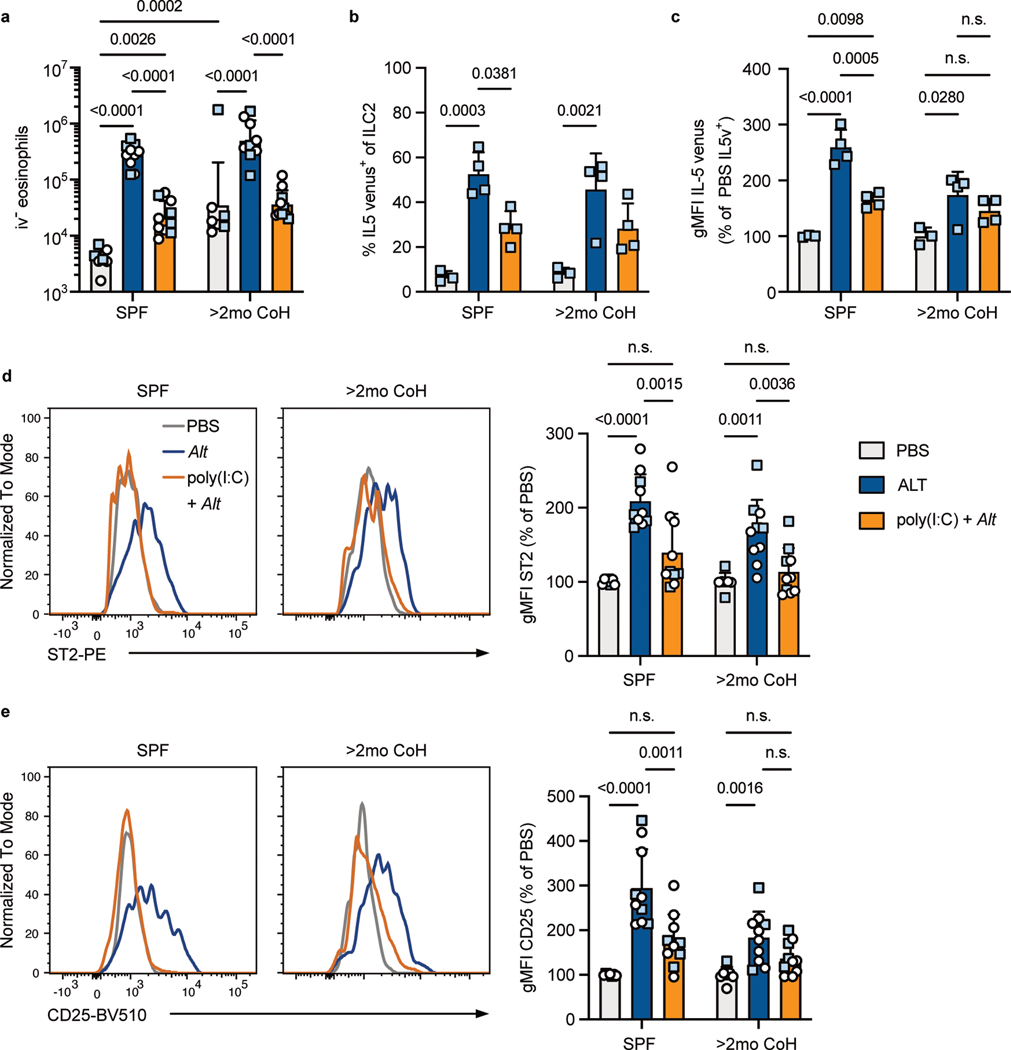
Our findings raised the question of whether long-term cohoused mice had developed insensitivity to IFNs and other inflammatory factors or whether, like SPF mice, the innate immune response to allergens could be inhibited by acute exposure to inflammatory cues. We treated SPF and two-month cohoused mice intranasally with poly(I:C) one day before treating with Alt and examined the response 24 hours later to determine whether re-introducing IFN production in the lungs could suppress Alt responses in mice with a history of microbial exposures. First, we measured Mx1-GFP in lung ILC2 of SPF Mx1gfp mice to ensure intranasal poly(I:C) treatment induced IFNR signaling in ILC2 (Extended Data Fig. 7g). As expected, poly(I:C) pretreatment suppressed lung eosinophil recruitment in SPF mice in response to Alt24, and we found poly(I:C) pretreatment similarly suppressed lung eosinophilia in two-month cohoused mice (Fig. 7a). IL-5v production from ILC2 in response to Alt was also suppressed with poly(I:C) administration in both SPF and two-month cohoused mice (Fig. 7b–c). Intranasal poly(I:C) pretreatment also caused reduced expression of ST2 and CD25 on lung ILC2 in both SPF and two-month cohoused mice, reflecting reduced activation (Fig. 7d–e). These results with poly(I:C) demonstrate the type-2 immune response to allergens is sensitive to blockade through the acute production of inflammatory factors and supports the conclusion that increased inflammatory signals at two weeks of cohousing with pet store mice leads to the suppression of ILC2 response to allergens.
Fig. 7. Poly(I:C) suppresses ILC2 and eosinophil responses to A. alternata in SPF and two-month cohoused mice.
SPF or >2mo CoH B6 (white circles) or IL-5v F1 (light blue squares) mice were treated with intranasal poly(I:C) or left untreated 24 hours before intranasal PBS or Alt and analyzed by flow cytometry 24 hours later. a, Number of lung i.v. CD45− eosinophils. Bar graph shows mean +SD of log transformed values. b, Percent of lung ILC2 expressing IL-5 venus. c, gMFI of IL-5 venus, gated on IL-5 venus+ lung ILC2. d, Representative histograms and summary data of ST2 expression on lung ILC2. e, Representative histograms and summary data of CD25 expression on lung ILC2. a, d-e, Pooled from two B6 and two IL-5v F1 experiments (n = 7–10/group). b-c, Pooled from two IL-5v F1 experiments (n = 3–4/group). b, c, d, e, bar graphs show mean +SD. c, d, e gMFI values from multiple experiments are normalized to PBS-treated group in each housing condition. Each symbol represents a mouse. a,-b, P values were determined with two-way ANOVA with Tukey’s multiple comparisons test. Only statistically significant comparisons are indicated. c-e, P values were determined with one-way ANOVA with multiple comparisons; no symbol p ≥ 0.05. Source Data contains exact P-values and group sizes.
Discussion
In addition to genetic factors, an individual’s history of microbial exposures is an important component influencing the susceptibility to allergic diseases. In epidemiological studies, human subjects may have had months, years, or decades of microbial exposures, depending on the age of participants. The identities, timing, and frequency of the full range of bacteria, viruses, and fungi an individual has been exposed to in their lifetime cannot be determined, but these exposures are believed to be an important component in determining one’s susceptibility to developing allergic conditions. The cohoused mouse model employed here provides the benefits of animal models – genetic homogeneity, genetic tools such as fluorescent gene reporters, short experimental timeframes, and the ability to characterize responses within tissues – but also allows us to study the impact physiological microbial exposures (both pathogens and commensal microorganisms) has on immune responses, which cannot be addressed with SPF animals or more reductionist approaches48, 49. One potential concern about using cohoused mice is that heterogeneity in the timing and range of microbial transfer might lead to high variability in immune phenotype or immune responses. In recently published work, the contributions of individual pathogens on the immune phenotype of cohoused mice were tested, and no single microbe or combination of infections could explain the observed variability in immune activation50.
We specifically focused on the effects of diverse microbial experience on responses to airway allergens and found short-term cohousing (two weeks) did indeed lead to a reduced type-2 responses to the allergens A. alternata and papain. However, the ability to mount a type-2 response against single or repeated exposures to the allergen was restored after long-term cohousing (at least two months) despite initial reduction in IL-33 release. A central finding here is that prior microbial experience does not permanently reduce flexibility in immune reactivity; while short-term cohousing resulted in inhibition of a type-2 response, this was restored in long-term cohoused mice. These findings imply the immune system can “reset,” in this case restoring the ability to mount a type-2 immune response to airway allergens. This occurs despite sustained changes in immune cell composition of the lungs, a stably altered microbiota, and elevated inflammatory factors in the serum. Furthermore, despite diverse microbial experience in two-month cohoused mice, they were still responsive to blockade of this type-2 response by acute exposure to a new inflammatory cue, poly(I:C).
These results support underlying concepts of the hygiene hypothesis, but argue, at least for lung ILC2, it is recent microbial exposures rather than the cumulative infectious history which dictates responsiveness to allergens. This conclusion has logical appeal, since it would behoove the immune system to remain flexible for appropriate responses independent of previous microbial exposures – for instance, being able to mount a type-2 immune response against helminthic infections despite a history of numerous type-1 responses against intracellular pathogens. Physiological, unsynchronized transmission of microbes (including several viruses) causes transient blockade of type-2 responses to allergens, but this effect is largely lost once acute infections and high levels of inflammation have resolved. This immunological “resetting” contrasts with responses to other immune challenges, such as infection by Listeria monocytogenes, Plasmodium berghei, sepsis, and influenza vaccination, all of which are stably altered in two-month cohoused mice32, 50, 51. Hence, several aspects of the immune response changed long-term following diverse microbial experience, but the ability to mount an innate type-2 response to inhaled allergens is evidently not one of these.
Whether ILC2 would be more, less, or equally responsive to airway allergen in cohoused versus SPF mice was not obvious prior to our studies, as previous publications could support opposing hypotheses. For example, cohoused mice showed evidence of strong type-1 immunity, yet also displayed evidence of type-2 responses (including elevated IL-5, IL-13 and IgE levels in the serum) consistent with a history of, or ongoing, parasitic infections32, 51. Some parasitic infections impede subsequent allergic responses52, 53. Conversely, this type-2 signature may have been an indicator of immune cells poised to robustly respond to additional type-2 stimuli such as airway allergens. In humans, certain severe respiratory infections in infants and children, such as respiratory syncytial virus and rhinovirus, are associated with increased likelihood of wheeze and allergic asthma, potentially through vulnerability of unresolved lung tissue damage54. We did observe evidence of prior lung infections, with increases of multiple immune cell populations in the lungs, particularly neutrophils and T cells; however, this did not result in increased sensitivity to allergens. In fact, two-month cohoused mice had reduced IL-33 in BALF after Alt treatment.
It is worth reiterating that the response of long-term cohoused mice to lung allergens is not identical to that of SPF mice, since the initial type-2 response is impaired (Fig. 3), despite reaching the same degree of eosinophil infiltration by 24 hours and later (Figures 2, 4, 7). Whether this “hesitation” in the type-2 response of long-term cohoused mice relates to the sustained changes in commensal microbes (Fig. 5) or a durable effect of earlier inflammatory responses (Fig. 6) is unclear, but of interest for further investigation.
Our indicate strong IFNR signals correlate with impaired innate type-2 response to allergens in cohoused mice, and IFNR signaling is known to reduce GATA3 expression and cytokine production in ILC224, 30, 31, providing a plausible mechanism for the reduced ILC2 function. We cannot exclude the role of other inflammatory cues, which also peak during short-term cohousing (Fig. 6a), however. We could not directly test whether IFNs are required for impaired responses in two-week cohoused mice, since IFNR-deficient mice do not survive cohousing with pet store mice47. Acute infection by mouse pathogens is a logical explanation for the burst of IFNs (and other inflammatory cytokines) seen early after cohousing, although it is certainly possible that adoption of the pet store mouse microbiome (which would include organisms that are not detectable in our 165rRNA sequencing analysis) may also contribute to this response. We attempted to cohouse dams and neonatal mice with pet store mice to understand the effects of microbial exposures at birth on type-2 responses. However, high mortality of pups in our pilot experiments discouraged us from this line of inquiry.
In conclusion, testing airway allergic responses in a mouse model of microbial exposure due to physiological transmission of murine pathogens and commensals reveals infectious history does not have a robust and lasting effect on reducing allergic airway responses mediated by ILC2, unlike acute exposure to microbial products. Despite long-lasting impacts microbial exposure through cohousing has on the immune response systemically and in the lungs, it may be acute triggers of inflammation such as IFNs that are the relevant inhibitors of allergic immune responses. These findings have direct implications for how susceptibility to type-2 immune responses against allergens can be effectively managed.
Methods
Mice
Female C57BL/6 (B6) and BALB/cJ mice were purchased from Charles River (via National Cancer Institute). il5venus/venus BALB/c mice were kindly provided by Dr. Kiyoshi Takatsu, Toyama University55. These mice were bred in-house with B6 mice for one generation to produce (B6 x BALB/c)F1 mice heterozygous for the cytokine reporter (called IL-5v F1). Mx1gfp mice45 were purchased from Jackson Labs and kindly provided by Dr. Kristin Hogquist, University of Minnesota. In Figure panels 1a, c–d, data from Mx1gfp C57BL/6 mice were pooled with non-transgenic C57BL/6. Pet store mice were purchased from Twin Cities area pet stores and cohoused with SPF mice as described32. Mice for these studies were purchased from four different local pet stores over four years, comprised of approximately 40 cohorts and approximately 90 cages. One pet store mouse was cohoused within one week of purchase with up to four laboratory mice, aged 6 to 10 weeks, in a standard mouse cage, or up to eight laboratory mice in a large rat cage. One pet store mouse was introduced per cage and remained in the cage for the duration of the experiment. Only female mice were used; males cannot be cohoused as this creates animal welfare concerns due to fighting, aggression, and social defeat. Infectious agent screening was done as described32. Mice were cohoused when at least 6 weeks of age and used for experiments between 13 and 17 days (2wk CoH) or 56 and 120 days (>2mo CoH) post-cohousing. Upon euthanasia, a small number of cohoused mice had overt lung pathology, which did not correlate with the appearance or behavior of the live mice. Pathology consisted of pale white or gray tissue, mottled in appearance and of a tougher consistency than healthy lungs, making up at least an estimated 25–100% of the outer surface of the lungs. This lung appearance was associated with increased lung neutrophils. We did not find this pathology significantly impacted the results of the studies and data were left in the analysis. Mice were euthanized with an overdose of isoflurane. Cohoused animals were maintained in A-BSL3 under specific pathogen–free conditions at the University of Minnesota. Both SPF and BSL-3 housing maintained humidity between 30 and 70% and temperature between 20 and 23°C. SPF room was on a 14 hour light/10 hour dark cycle and BSL-3 room was on a 12 hour light/12 hour dark cycle. Animal chow in both rooms (Teklad 2918) and was provided ad libitum and changed at least weekly. All experimental procedures were approved by the Institutional Animal Care and Use Committee at the University of Minnesota.
Airway administration of A. alternata, papain, HpARI, rIL-33, and poly(I:C)
Alternaria alternata extract (Alt, Greer Laboratories, Lenoir, NC, 100 μg in 40 μl PBS for B6 and F1 mice, 50 μg in 50 μl PBS for BALB/c mice), papain (Sigma-Aldrich, 20 μg in 40 μl PBS), recombinant IL-33 (R&D Systems, Minneapolis, MN, 200 ng in 40 μl), or PBS were administered intranasally (i.n.) once or three times (days 0, 2, and 4) to mice anesthetized with isoflurane. In some experiments, recombinant HpARI27 (10μg) was mixed with Alt. In some experiments mice were pre-treated with i.n. poly(I:C) (Invivogen, San Diego, CA, 50μg in 40 μl PBS) 24 hours before Alt treatment.
Flow cytometry
Lymphocytes were isolated from lungs as previously described56; however instead of Percoll, after GentleMax tissue dissociation red blood cells were lysed by incubating for 10 minutes in 10 ml ACK buffer and washed in 20 ml RPMI with 3% FBS. In experiments quantifying Tregs, Treg-Protector (BioLegend, 50 μg in 100μl) was injected i.v. 15–30 minutes prior to mouse sacrifice as described57. Direct ex vivo staining was performed as described previously58 with fluorochrome-conjugated antibodies (purchased from BD Biosciences, BioLegend, eBioscience, Cell Signaling Technology, Tonbo or Thermo Fisher Scientific). For discrimination of vascular-associated lymphocytes, in vivo i.v. injection of FITC, vF450, or BUV605 conjugated CD45 antibody was performed as described59. Viable cells were identified using Live/Dead (Tonbo Biosciences). For detection of intracellular factors surface stained cells were permeabilized, fixed and stained by using eBioscience Foxp3 staining kit according to manufacturer instructions. Flow cytometric collection was performed using BD FACSDiva Software v8.0.1 on a LSR Fortessa (BD Biosciences) and analyzed using FlowJo software v8.0.1 (Treestar).
Lung and BALF cytokine measurements
After euthanasia, the trachea was cannulated and lungs were lavaged with HBSS (2 × 0.5 ml). Lungs were then collected. BALF and lungs were stored at −80°C for cytokine assays. Lungs were homogenized with a glass dounce in 1.0 ml PBS with Halt protease and phosphatase inhibitor (Thermo Scientific). The homogenates were centrifuged at 10,000 g at 4°C for 15 min, and protein concentrations in the supernatant were quantified with BCA Protein Assay kit (Thermo Scientific). Levels of IL-5, IL-13, and IL-33 in lung homogenate and BAL supernatants were measured by Quantikine ELISA kits (R&D systems) per manufacturer instructions. Data were collected using Microplate Manager Software v6.3 (Bio-Rad Laboratories).
Fecal sample DNA extraction and sequencing
DNA was extracted from individual mouse fecal pellets using DNeasy PowerSoil Pro kit (QIAGEN, Hilden Germany) on the automated QIAcube platform using the inhibitor removal technology protocol. The V4 region of the 16S rRNA gene was amplified and sequenced using the 515F/806R primer set60. Dual-indexed paired-end sequencing was done on the Illumina MiSeq platform at a read length of 301 nucleotides (nt), as described previously61. Amplification and sequencing were done by the University of Minnesota Genomics Center with negative controls (sterile water) included in the run which did not produce amplicons. Raw sequence reads are deposited in the National Center for Biotechnology’s Sequence Read Archive under BioProject accession number SRP371485.
Amplicon data processing and analysis
Sequence data were processed and analyzed using mothur software (ver. 1.41.1)62. Sequences were trimmed to 170 nt, paired-end joined using fastq-join63, and trimmed for quality using an average quality score of 35 over a 50 nt window, homopolymers ≤6 nt, no ambiguous bases, and ≤2 nt differences from primer sequences. High quality sequences were aligned against the SILVA database (ver. 138.1)64, and sequences falling outside the primer regions were removed. Chimeras were identified and removed using UCHIME ver. 4.2.4065. Operational taxonomic units (OTUs) were binned at 99% similarity using the furthest-neighbor algorithm, and taxonomic assignments were made using the version 18 release from the Ribosomal Database Project66. Difference databases were used for alignment and taxonomic classifications due to considerations described previously67. Diversity indices and statistical analyses were done using mothur. For statistical comparisons, samples were rarefied to 35,500 reads per sample, which yielded a mean Good’s coverage estimate of 98.7 ± 0.8% among all samples. Beta diversity was calculated using Bray-Curtis dissimilarities and visualized by ordination using principal coordinate analysis (PCoA)68. Genera with abundances with significant Spearman correlations related to axis position were identified and overlaid on the PCoA plot using the corr.axes command in mothur. Engraftment of microbiota from cohousing was determined using SourceTracker243. Analyses were performed separately by cage, with the pet store mouse used for cohousing in that cage as well as all baseline samples (from SPF controls as well as samples of the cohoused mice collected before introduction of pet store mouse) designated as separate sources.
Serum cytokine measurements
SPF mice were bled prior to cohousing with pet store mice, as well as on various days during sixty days of cohousing. Serum cytokines and chemokines were quantitated according to manufacturer instructions using a ProcartaPlex custom 7-plex panel (CXCL10, IL-1β, IL-4, IL-6, IL-10, IFN-γ, and TNF-α; Invitrogen) using a Luminex 200 with Bio-plex Manager Software v6.0 (Bio-Rad Laboratories). Samples below the limit of detection were assigned a concentration of 0 pg/ml.
Blinding and data exclusion
Blinding was not conducted as one researcher was responsible for the entirety of each experiment. Mice that were observed not to inhale the intranasal treatment were excluded as they did not receive the intended dose. Samples where intravenous fluorescent labeling of cells was poor due to technical error, or samples where a flow cytometry antibody was inadvertently left out of the antibody cocktail were omitted from analysis as cell populations could not be properly gated.
Statistics
GraphPad Prism was used to determine statistical significance. Student unpaired
two-tailed t-test, Student paired t-test, one-way ANOVA, two-way ANOVA with Tukey’s multiple comparisons test, or mixed-effects analysis with multiple comparisons was used where appropriate as indicated in the Figure legends. Data distribution was assumed to be normal but was not formally tested. Statistical tests for equal variance were conducted, and unequal variance tests are noted in the figure legends. For two-way ANOVA tests, only relevant comparisons were shown (e.g. we did not report SPF PBS vs. >2mo CoH Alt). In Figure 5e and Figure 6 when many groups were compared only comparisons reaching statistical significance were reported in order to improve clarity. A P value ≥ 0.05 was considered not statistically significant.
Data Availability
Raw sequence reads from 16S rRNA amplicon sequencing are deposited in the National Center for Biotechnology’s Sequence Read Archive under BioProject accession number SRP371485. Source data are provided with this paper. SILVA rRNA database can be found at https://www.arb-silva.de/ (PMID: 1794732). UCHIME database can be found at https://drive5.com/uchime/uchime_download.html (PMID: 21700674). Ribosomal Database Project can be found at http://rdp.cme.msu.edu/ (PMID: 19004872).
Code Availability
Code for 16S rRNA sequencing-based microbiome analysis is available in PMID: 3022789269.
Extended Data
Extended Data Fig. 1. Serology screening for SPF pathogens in cohoused mice.
Blood samples were collected and tested for antibodies against common murine pathogens. Each column represents an animal. Each row indicates a pathogen. Filled boxes indicate positive results, lighter shaded boxes indicate equivocal (weak positive) results. White boxes indicate negative results. a, Serology results from representative pet store (n = 8), cohoused B6 (n = 26) and F1 IL-5v (n = 11) mice cohoused for approximately two weeks at the time of blood collection. b, Serology results from representative pet store and cohoused B6, F1 IL-5v, and BALB/c mice cohoused for at least two months at the time of blood collection (n = 26/group). CPIL = Clostridium piliforme, ECUN = Encephalitozoon cuniculi, EDIM = rotavirus, LCMV = lymphocytic choriomeningitis virus, MAV1+2 = mouse adenovirus 1 and 2, MCMV = murine cytomegalovirus, MHV = mouse hepatitis virus, MNV = murine norovirus, MPUL = Mycoplasma pulmonis, MPV1+2 = mouse parvovirus type 1 and type 2, MVM = minute virus of mice, POLY = polyoma virus, PVM = pneumonia virus of mice, REO = reovirus, SEND = murine respirovirus (Sendai virus), TCMV = GDVII Theiler’s murine encephalomyelitis virus. c. Representative flow cytometry histograms of protein expression of lung ILC2 in age-matched SPF (blue) and CoH (red) mice at 2wk and >2mo. Vertical gray lines are added to aid in comparison of expression among groups.
Extended Data Fig. 2. Example flow cytometry gating.
Representative flow plots to illustrate gating strategy of immune cells in the lungs. a, Neutrophil, eosinophil, and alveolar macrophage gating. b, γδ T cell, CD4+ T cell, CD8+ T cell, and NK cell gating. c, ILC2 and B cell gating.
Extended Data Fig. 3. alternata response is susceptible to inhibition by microbial factors.
A. a, Eosinophils (CD45+ SiglecF+ CD11b+ CD11c− cells) were identified by being in the lung parenchyma or airways by being unlabeled by a fluorescently tagged anti-CD45 antibody injected intravenously three minutes before euthanasia. Shown are B6 mice treated 24 hours prior with intranasal PBS or A. alternata (Alt) or HpARI and Alt. Numbers in plots represent percent of cells in the gate. b, Number of eosinophils in the lungs and airways (i.v. CD45−) 24 hours after indicated intranasal treatment. Mice were B6 (white circles) or B6xBALB/c IL-5WT/venus (IL-5v F1, light blue squares). Bar graph shows mean +SD of log transformed values. c, Representative flow plots of IL-5 venus expression in IL-5v F1 lung ILC2. d, IL-5 venus gMFI of IL-5 venus+ lung ILC2. e-f, ST2 (e) and CD25 (f) of B6 and IL-5v F1 mice. gMFIs from multiple experiments normalized to PBS-treated group set to 100. b and e-f, Pooled from one B6 and one IL-5v F1 experiment (n = 5–9/group). d, Data from one experiment in IL-5v F1 mice (n = 2–3/group). Bar graphs show mean +SD. Each symbol represents a mouse. P values were determined with one-way ANOVA with Tukey’s multiple comparisons test; n.s. p ≥ 0.05. Source Data contains exact P-values and group sizes.
Extended Data Fig. 4. ILC2 numbers and CD4+ T cell data from two-week cohoused mice.
Flow analysis 24 hours after intranasal PBS or Alt treatment. Mice were B6 (white) or IL-5v F1 (light blue) and were cohoused with pet store mice for approximately two weeks (2wk) or were age-matched SPF controls. a, f, Data in Figures 2a and 2d are presented again, with samples from each experiment indicated with a different symbol/color combination so that experiment-to-experiment variation can be visualized. b, Number of lung ILC2. c-d, IL-5 venus expression within lung (i.v. CD45−) CD4+ T cells of IL-5v F1 SPF and 2wk CoH mice 24 hours after PBS or Alt treatment. c, Representative flow plots of IL-5 venus expression in lung CD4+ T cells. d, Percent IL-5 venus+ and e, normalized IL-5 venus gMFI of IL-5 venus+ lung CD4+ T cells. b, Pooled from four B6 experiments and two IL-5v F1 experiments (n = 12–14/group). c-e, Pooled from two IL-5v F1 experiments (n = 4–6/group). Numbers in plots represent percent of cells in the gate. Bar graphs show mean +SD. g, Mice were treated with intranasal PBS or papain every other day three times and analyzed 24 hours after the last treatment and are from the same experiments described in Fig. 2g–j. Number of lung i.v.− CD4+ T cells in 2wk or >2mo CoH B6 mice or age-matched SPF controls. Bar graphs show mean +SD of log-transformed values. Each symbol represents a mouse. P values were determined with a 2-way ANOVA with Tukey’s multiple comparisons test; n.s. p ≥ 0.05. Source Data contains exact P-values and group sizes.
Extended Data Fig. 5. BALF and lung cytokine measurements.
a-b, e-f, B6 mice (white circles) or c-d, BALB/c mice (pink diamonds) were cohoused with pet store mice for at least two months (>2mo CoH) or were age-matched SPF controls. Alt (a-d), recombinant IL-33 (rIL-33, e-f) or control PBS were given intranasally to mice and lungs and bronchoalveolar lavage fluid (BALF) were collected 4.5 hours later. IL-5 and IL-13 in the lung homogenates (c-d) and BALF (a-b, e-f) were detected by ELISA and lung concentrations were normalized to the amount of total protein in the samples. a-b pooled from three experiments (n = 6–10/group). c-d pooled from four experiments (n = 6–12/group). e-f pooled from three experiments (n = 5–12/group). Bar graphs show mean +SD. Each symbol represents a mouse. P values were determined with a 2-way ANOVA with Tukey’s multiple comparisons test; ns p ≥ 0.05. Source Data contains exact P-values and group sizes.
Extended Data Fig. 6. Fecal microbiota analysis.
a, Principal coordinates analysis (PCoA) of Bray-Curtis distances of mouse fecal samples from cohoused Cages 2 and 3 (Cage 1 PCoA in Figure 5b). SPF samples represented by circles are control SPF mice used in analysis of all cages and SPF samples represented by the symbols used for cohoused mice in each graph are from those same mice before cohousing. b, Distributions of abundant genera in mouse fecal samples from Cages 2 and 3. Less abundant genera accounted for less than 2.5% of the community among all samples. c, Distributions of abundant genera in mouse fecal samples from SPF control mice collected on day 0 of cohousing and 60 days later. Less abundant genera accounted for less than 2.5% of the community among all samples.
Extended Data Fig. 7. Serum cytokines and Mx1-GFP expression in cohoused mice.
a, Serum cytokine and chemokine levels of B6 mice days 0 and 60 after cohousing with a pet store mouse, (n = 8). These are from the same data in Figure 5d. Bar graphs show mean +SD. P values were determined with a two-tailed Wilcoxon matched-pairs signed rank test; n.s. p ≥ 0.05. b, Representative flow plots of Mx1-GFP expression in blood CD8+ T cells from wild-type B6 and Mx1gfp mice either housed in SPF conditions or after seven days of cohousing. Numbers in plots represent percent of cells in the gate. c-d, Percent Mx1-GFP+ of the indicated cell populations in the spleens of (c) 2wk or (d) >2mo CoH mice or age-matched controls. . e-f, Percent Mx1-GFP+ of the indicated cell populations in the lungs of (e) 2wk or (f) >2mo CoH mice or age-matched controls. c-f, Bar graphs show mean +SD. Each symbol represents a mouse. P values were determined with a Student’s t-test (two-tailed). When groups had unequal variance the t-test was conducted with Welch’s correction; n.s. p ≥ 0.05. g, Representative flow plots of Mx1-GFP expression in lung ILC2 from wild-type Mx1gfp mice 24 hours after intranasal treatment with PBS or Alt, with the indicated group treated with intranasal poly(I:C) 24 hours before Alt treatment. Numbers in plots represent percent of cells in the gate. Source Data contains exact P-values and group sizes.
Supplementary Material
Acknowledgements
We thank UMN Flow Cytometry Resource Facility, CFI Dirty Mouse Colony, UMN BSL-3 Program, Minnesota Supercomputing Institute, Cytokine Reference Laboratory, and UMN Research Animal Resources for support. We thank Jamequist and Kita lab members for thoughtful discussion. This work was supported by the NIH (R01HL117823 to H.K.; T32HL007741 to K.E.B., R35GM140881 to T.S.G.), Minnesota Partnership for Biotechnology and Medical Genomics (#16.48 to S.C.J. and H.K.) and University of Minnesota Medical School (AIRP-CP-21 to S.C.J.)
Footnotes
Competing interests
The authors declare no competing interests.
References
- 1.Croisant S. Epidemiology of asthma: prevalence and burden of disease. Adv Exp Med Biol 795, 17–29 (2014). [DOI] [PubMed] [Google Scholar]
- 2.Kim BJ, Lee SY, Kim HB, Lee E. & Hong SJ Environmental changes, microbiota, and allergic diseases. Allergy Asthma Immunol Res 6, 389–400 (2014). [DOI] [PMC free article] [PubMed] [Google Scholar]
- 3.Holgate ST Innate and adaptive immune responses in asthma. Nat Med 18, 673–683 (2012). [DOI] [PubMed] [Google Scholar]
- 4.Kubo M. Innate and adaptive type 2 immunity in lung allergic inflammation. Immunol Rev 278, 162–172 (2017). [DOI] [PubMed] [Google Scholar]
- 5.Vivier E. et al. Innate Lymphoid Cells: 10 Years On. Cell 174, 1054–1066 (2018). [DOI] [PubMed] [Google Scholar]
- 6.Halim TY et al. Group 2 innate lymphoid cells are critical for the initiation of adaptive T helper 2 cell-mediated allergic lung inflammation. Immunity 40, 425–435 (2014). [DOI] [PMC free article] [PubMed] [Google Scholar]
- 7.Halim TY et al. Group 2 innate lymphoid cells license dendritic cells to potentiate memory TH2 cell responses. Nat Immunol 17, 57–64 (2016). [DOI] [PMC free article] [PubMed] [Google Scholar]
- 8.Halim TYF et al. Tissue-Restricted Adaptive Type 2 Immunity Is Orchestrated by Expression of the Costimulatory Molecule OX40L on Group 2 Innate Lymphoid Cells. Immunity 48, 1195–1207.e1196 (2018). [DOI] [PMC free article] [PubMed] [Google Scholar]
- 9.Kato A. Group 2 Innate Lymphoid Cells in Airway Diseases. Chest 156, 141–149 (2019). [DOI] [PMC free article] [PubMed] [Google Scholar]
- 10.Scadding GK & Scadding GW Innate and Adaptive Immunity: ILC2 and Th2 Cells in Upper and Lower Airway Allergic Diseases. J Allergy Clin Immunol Pract 9, 1851–1857 (2021). [DOI] [PubMed] [Google Scholar]
- 11.Pivniouk V, Gimenes Junior JA, Honeker LK & Vercelli D. The role of innate immunity in asthma development and protection: Lessons from the environment. Clin Exp Allergy 50, 282–290 (2020). [DOI] [PubMed] [Google Scholar]
- 12.Kaplan BA, Mascie-Taylor CG & Boldsen J. Birth order and health status in a British national sample. J Biosoc Sci 24, 25–33 (1992). [DOI] [PubMed] [Google Scholar]
- 13.Ball TM et al. Siblings, day-care attendance, and the risk of asthma and wheezing during childhood. N Engl J Med 343, 538–543 (2000). [DOI] [PubMed] [Google Scholar]
- 14.Kramer U, Heinrich J, Wjst M. & Wichmann HE Age of entry to day nursery and allergy in later childhood. Lancet 353, 450–454 (1999). [DOI] [PubMed] [Google Scholar]
- 15.Riedler J, Eder W, Oberfeld G. & Schreuer M. Austrian children living on a farm have less hay fever, asthma and allergic sensitization. Clin Exp Allergy 30, 194–200 (2000). [DOI] [PubMed] [Google Scholar]
- 16.Sjögren YM, Jenmalm MC, Böttcher MF, Björkstén B. & Sverremark-Ekström E. Altered early infant gut microbiota in children developing allergy up to 5 years of age. Clin Exp Allergy 39, 518–526 (2009). [DOI] [PubMed] [Google Scholar]
- 17.Bisgaard H. et al. Reduced diversity of the intestinal microbiota during infancy is associated with increased risk of allergic disease at school age. J Allergy Clin Immunol 128, 646–652.e641–645 (2011). [DOI] [PubMed] [Google Scholar]
- 18.Stein MM et al. Innate Immunity and Asthma Risk in Amish and Hutterite Farm Children. N Engl J Med 375, 411–421 (2016). [DOI] [PMC free article] [PubMed] [Google Scholar]
- 19.Marra F. et al. Antibiotic use in children is associated with increased risk of asthma. Pediatrics 123, 1003–1010 (2009). [DOI] [PubMed] [Google Scholar]
- 20.Kline JN et al. Modulation of airway inflammation by CpG oligodeoxynucleotides in a murine model of asthma. J Immunol 160, 2555–2559 (1998). [PubMed] [Google Scholar]
- 21.Sur S. et al. Long term prevention of allergic lung inflammation in a mouse model of asthma by CpG oligodeoxynucleotides. J Immunol 162, 6284–6293 (1999). [PubMed] [Google Scholar]
- 22.Sabatel C. et al. Exposure to Bacterial CpG DNA Protects from Airway Allergic Inflammation by Expanding Regulatory Lung Interstitial Macrophages. Immunity 46, 457–473 (2017). [DOI] [PubMed] [Google Scholar]
- 23.Schuijs MJ et al. Farm dust and endotoxin protect against allergy through A20 induction in lung epithelial cells. Science 349, 1106–1110 (2015). [DOI] [PubMed] [Google Scholar]
- 24.Tei R. et al. TLR3-driven IFN-β antagonizes STAT5-activating cytokines and suppresses innate type 2 response in the lung. J Allergy Clin Immunol (2021). [DOI] [PMC free article] [PubMed] [Google Scholar]
- 25.Pivniouk V. et al. Airway administration of OM-85, a bacterial lysate, blocks experimental asthma by targeting dendritic cells and the epithelium/IL-33/ILC2 axis. J Allergy Clin Immunol (2021). [DOI] [PMC free article] [PubMed] [Google Scholar]
- 26.McSorley HJ, Blair NF, Smith KA, McKenzie AN & Maizels RM Blockade of IL-33 release and suppression of type 2 innate lymphoid cell responses by helminth secreted products in airway allergy. Mucosal Immunol 7, 1068–1078 (2014). [DOI] [PMC free article] [PubMed] [Google Scholar]
- 27.Osbourn M. et al. HpARI Protein Secreted by a Helminth Parasite Suppresses Interleukin-33. Immunity 47, 739–751.e735 (2017). [DOI] [PMC free article] [PubMed] [Google Scholar]
- 28.Machiels B. et al. A gammaherpesvirus provides protection against allergic asthma by inducing the replacement of resident alveolar macrophages with regulatory monocytes. Nat Immunol 18, 1310–1320 (2017). [DOI] [PubMed] [Google Scholar]
- 29.Molofsky AB et al. Interleukin-33 and Interferon-γ Counter-Regulate Group 2 Innate Lymphoid Cell Activation during Immune Perturbation. Immunity 43, 161–174 (2015). [DOI] [PMC free article] [PubMed] [Google Scholar]
- 30.Moro K. et al. Interferon and IL-27 antagonize the function of group 2 innate lymphoid cells and type 2 innate immune responses. Nat Immunol 17, 76–86 (2016). [DOI] [PubMed] [Google Scholar]
- 31.Duerr CU et al. Type I interferon restricts type 2 immunopathology through the regulation of group 2 innate lymphoid cells. Nat Immunol 17, 65–75 (2016). [DOI] [PMC free article] [PubMed] [Google Scholar]
- 32.Beura LK et al. Normalizing the environment recapitulates adult human immune traits in laboratory mice. Nature 532, 512–516 (2016). [DOI] [PMC free article] [PubMed] [Google Scholar]
- 33.Reese TA et al. Sequential Infection with Common Pathogens Promotes Human-like Immune Gene Expression and Altered Vaccine Response. Cell Host Microbe 19, 713–719 (2016). [DOI] [PMC free article] [PubMed] [Google Scholar]
- 34.Rosshart SP et al. Laboratory mice born to wild mice have natural microbiota and model human immune responses. Science 365 (2019). [DOI] [PMC free article] [PubMed] [Google Scholar]
- 35.Rosshart SP et al. Wild Mouse Gut Microbiota Promotes Host Fitness and Improves Disease Resistance. Cell 171, 1015–1028.e1013 (2017). [DOI] [PMC free article] [PubMed] [Google Scholar]
- 36.Bartemes KR et al. IL-33-responsive lineage- CD25+ CD44(hi) lymphoid cells mediate innate type 2 immunity and allergic inflammation in the lungs. J Immunol 188, 1503–1513 (2012). [DOI] [PMC free article] [PubMed] [Google Scholar]
- 37.Milne J. & Brand S. Occupational asthma after inhalation of dust of the proteolytic enzyme, papain. Br J Ind Med 32, 302–307 (1975). [DOI] [PMC free article] [PubMed] [Google Scholar]
- 38.Halim TY, Krauss RH, Sun AC & Takei F. Lung natural helper cells are a critical source of Th2 cell-type cytokines in protease allergen-induced airway inflammation. Immunity 36, 451–463 (2012). [DOI] [PubMed] [Google Scholar]
- 39.Oboki K. et al. IL-33 is a crucial amplifier of innate rather than acquired immunity. Proc Natl Acad Sci U S A 107, 18581–18586 (2010). [DOI] [PMC free article] [PubMed] [Google Scholar]
- 40.Melo-González F. et al. Distal Consequences of Mucosal Infections in Intestinal and Lung Inflammation. Front Immunol 13, 877533 (2022). [DOI] [PMC free article] [PubMed] [Google Scholar]
- 41.Abt MC et al. Commensal bacteria calibrate the activation threshold of innate antiviral immunity. Immunity 37, 158–170 (2012). [DOI] [PMC free article] [PubMed] [Google Scholar]
- 42.Hild B. et al. Neonatal exposure to a wild-derived microbiome protects mice against diet-induced obesity. Nat Metab 3, 1042–1057 (2021). [DOI] [PMC free article] [PubMed] [Google Scholar]
- 43.Knights D. et al. Bayesian community-wide culture-independent microbial source tracking. Nat Methods 8, 761–763 (2011). [DOI] [PMC free article] [PubMed] [Google Scholar]
- 44.Jiang Z. et al. Poly(I-C)-induced Toll-like receptor 3 (TLR3)-mediated activation of NFkappa B and MAP kinase is through an interleukin-1 receptor-associated kinase (IRAK)-independent pathway employing the signaling components TLR3-TRAF6-TAK1-TAB2-PKR. J Biol Chem 278, 16713–16719 (2003). [DOI] [PubMed] [Google Scholar]
- 45.Uccellini MB & García-Sastre A. ISRE-Reporter Mouse Reveals High Basal and Induced Type I IFN Responses in Inflammatory Monocytes. Cell Rep 25, 2784–2796.e2783 (2018). [DOI] [PMC free article] [PubMed] [Google Scholar]
- 46.Staeheli P, Grob R, Meier E, Sutcliffe JG & Haller O. Influenza virus-susceptible mice carry Mx genes with a large deletion or a nonsense mutation. Mol Cell Biol 8, 4518–4523 (1988). [DOI] [PMC free article] [PubMed] [Google Scholar]
- 47.Fay EJ et al. Natural rodent model of viral transmission reveals biological features of virus population dynamics. J Exp Med 219 (2022). [DOI] [PMC free article] [PubMed] [Google Scholar]
- 48.Hamilton SE et al. New Insights into the Immune System Using Dirty Mice. J Immunol 205, 3–11 (2020). [DOI] [PMC free article] [PubMed] [Google Scholar]
- 49.Masopust D, Sivula CP & Jameson SC Of Mice, Dirty Mice, and Men: Using Mice To Understand Human Immunology. J Immunol 199, 383–388 (2017). [DOI] [PMC free article] [PubMed] [Google Scholar]
- 50.Fiege JK et al. Mice with diverse microbial exposure histories as a model for preclinical vaccine testing. Cell Host Microbe (2021). [DOI] [PMC free article] [PubMed] [Google Scholar]
- 51.Huggins MA et al. Microbial Exposure Enhances Immunity to Pathogens Recognized by TLR2 but Increases Susceptibility to Cytokine Storm through TLR4 Sensitization. Cell Rep 28, 1729–1743.e1725 (2019). [DOI] [PMC free article] [PubMed] [Google Scholar]
- 52.Hartmann S. et al. Gastrointestinal nematode infection interferes with experimental allergic airway inflammation but not atopic dermatitis. Clin Exp Allergy 39, 1585–1596 (2009). [DOI] [PubMed] [Google Scholar]
- 53.Maizels RM Regulation of immunity and allergy by helminth parasites. Allergy 75, 524–534 (2020). [DOI] [PubMed] [Google Scholar]
- 54.Wark PAB, Ramsahai JM, Pathinayake P, Malik B. & Bartlett NW Respiratory Viruses and Asthma. Semin Respir Crit Care Med 39, 45–55 (2018). [DOI] [PMC free article] [PubMed] [Google Scholar]
Methods Only References
- 55.Ikutani M. et al. Identification of innate IL-5-producing cells and their role in lung eosinophil regulation and antitumor immunity. J Immunol 188, 703–713 (2012). [DOI] [PubMed] [Google Scholar]
- 56.Steinert EM et al. Quantifying Memory CD8 T Cells Reveals Regionalization of Immunosurveillance. Cell 161, 737–749 (2015). [DOI] [PMC free article] [PubMed] [Google Scholar]
- 57.Borges da Silva H. et al. The purinergic receptor P2RX7 directs metabolic fitness of long-lived memory CD8. Nature 559, 264–268 (2018). [DOI] [PMC free article] [PubMed] [Google Scholar]
- 58.Skon CN et al. Transcriptional downregulation of S1pr1 is required for the establishment of resident memory CD8+ T cells. Nat Immunol 14, 1285–1293 (2013). [DOI] [PMC free article] [PubMed] [Google Scholar]
- 59.Anderson KG et al. Intravascular staining for discrimination of vascular and tissue leukocytes. Nat Protoc 9, 209–222 (2014). [DOI] [PMC free article] [PubMed] [Google Scholar]
- 60.Caporaso JG et al. Ultra-high-throughput microbial community analysis on the Illumina HiSeq and MiSeq platforms. ISME J 6, 1621–1624 (2012). [DOI] [PMC free article] [PubMed] [Google Scholar]
- 61.Gohl DM et al. Systematic improvement of amplicon marker gene methods for increased accuracy in microbiome studies. Nat Biotechnol 34, 942–949 (2016). [DOI] [PubMed] [Google Scholar]
- 62.Schloss PD Reintroducing mothur: 10 Years Later. Appl Environ Microbiol 86 (2020). [DOI] [PMC free article] [PubMed] [Google Scholar]
- 63.Aronesty E. Comparison of sequencing utility programs. The Open Bioinformatics Journal; 2013. pp. 1–8. [Google Scholar]
- 64.Pruesse E. et al. SILVA: a comprehensive online resource for quality checked and aligned ribosomal RNA sequence data compatible with ARB. Nucleic Acids Res 35, 7188–7196 (2007). [DOI] [PMC free article] [PubMed] [Google Scholar]
- 65.Edgar RC, Haas BJ, Clemente JC, Quince C. & Knight R. UCHIME improves sensitivity and speed of chimera detection. Bioinformatics 27, 2194–2200 (2011). [DOI] [PMC free article] [PubMed] [Google Scholar]
- 66.Cole JR et al. The Ribosomal Database Project: improved alignments and new tools for rRNA analysis. Nucleic Acids Res 37, D141–145 (2009). [DOI] [PMC free article] [PubMed] [Google Scholar]
- 67.Schloss PD The effects of alignment quality, distance calculation method, sequence filtering, and region on the analysis of 16S rRNA gene-based studies. PLoS Comput Biol 6, e1000844 (2010). [DOI] [PMC free article] [PubMed] [Google Scholar]
- 68.Anderson MJ & Willis TJ Canonical Analysis of Principal Coordinates: A Useful Method of Constrained Ordination for Ecology. Ecology (Durham) 84, 511–525 (2003). [Google Scholar]
- 69.Staley C. et al. Predicting recurrence of Clostridium difficile infection following encapsulated fecal microbiota transplantation. Microbiome 6, 166 (2018). [DOI] [PMC free article] [PubMed] [Google Scholar]
Associated Data
This section collects any data citations, data availability statements, or supplementary materials included in this article.
Supplementary Materials
Data Availability Statement
Raw sequence reads from 16S rRNA amplicon sequencing are deposited in the National Center for Biotechnology’s Sequence Read Archive under BioProject accession number SRP371485. Source data are provided with this paper. SILVA rRNA database can be found at https://www.arb-silva.de/ (PMID: 1794732). UCHIME database can be found at https://drive5.com/uchime/uchime_download.html (PMID: 21700674). Ribosomal Database Project can be found at http://rdp.cme.msu.edu/ (PMID: 19004872).


