Abstract
Pre-existent cardiovascular disease is a risk factor for weak anti-viral immunity, but underlying mechanisms remain undefined. Here, we report that patients with coronary artery disease (CAD) have macrophages (Mϕ) that actively suppress the induction of helper T cells reactive to two viral antigens: the SARS-CoV2 Spike protein and the Epstein–Barr virus (EBV) glycoprotein 350. CAD Mϕ overexpressed the methyltransferase METTL3, promoting the accumulation of N⁶-methyladenosine (m6A) in Poliovirus receptor (CD155) mRNA. m6A modifications of positions 1635 and 3103 in the 3’UTR of CD155 mRNA stabilized the transcript and enhanced CD155 surface expression. As a result, the patients’ Mϕ abundantly expressed the immunoinhibitory ligand CD155 and delivered negative signals to CD4+ T cells expressing CD96 and/or TIGIT receptors. Compromised antigen-presenting function of METTL3hi CD155hi Mϕ diminished anti-viral T cell responses in vitro and in vivo. LDL and its oxidized form induced the immunosuppressive Mϕ phenotype. Undifferentiated CAD monocytes had hypermethylated CD155 mRNA, implicating post-transcriptional RNA modifications in the bone-marrow in shaping anti-viral immunity in CAD.
Pre-existing cardiovascular diseases, such as hypertension, coronary artery disease (CAD), cardiac arrhythmias and congestive heart failure, are strong risk factors for severe viral disease, complicated by high morbidity and mortality rates1,2. Also, individuals with cardiovascular co-morbidities fail to respond adequately against vaccines3. Poor anti-viral immunity in CAD patients has been exemplified during the recent SARS-CoV2 pandemic, where a history of CAD was associated with severe symptoms1. CAD patients generate weak immune responses against varicella zoster virus4 and chronic Epstein Barr virus infection has been associated with cardiovascular disease5,6. While the relationship between viral immunity and progression of atherosclerotic disease remains insufficiently understood, the recent pandemic has made clear that a better understanding of protective immunity is needed to inform therapeutic management of virally infected patients with pre-existent cardiovascular disease.
Protection against and clearance of viral pathogens depends on the induction of adaptive immunity, in particular, priming and expansion of CD4+ T cells that help antibody-producing B cells and virus-specific CD8+ killer T cells7. SARS-CoV-2 specific CD4+ T cells are detected in the peripheral blood of all COVID-19 convalescent patients8. Patients who have recovered from COVID-19 infection carry CD4+ T cells with specificity for the viral spike and nucleocapsid antigens9. A subset of individuals testing negative for SARS-CoV-2 possess such CD4+ T cells, probably induced by the endemic human coronaviruses that cause upper and lower respiratory tract infections in children and adults. Similarly, CD4+ T cells are critical in protecting the host against deleterious effects of EBV infection10.
Patients with coronary artery disease (CAD) have abnormalities in their innate and adaptive immune system. Transcriptomic and cytometric single cell analysis of atherosclerotic plaque lesions has identified T cells and macrophages (Mϕ) as the dominant tissue-residing cell types (10% Mϕ, 65% T cells, the majority being CD4+ T cells11). The precise contribution of CD4+ T cells in inducing and sustaining atherosclerosis is not well defined, but CAD patients have expanded clonotypes of IFN-γ high-producing CD4+CD28− T cells12. These CD4+ T cells are cytotoxic towards endothelial cells, jeopardizing vascular integrity13. Besides their role as tissue-destructive effector cells and their contribution in lipid uptake, Mϕ serve as antigen-presenting cells, a pinnacle position in the induction of adaptive immunity. Mϕ from CAD patients suppress antiviral T cell immunity due to aberrant expression of the co-inhibitory ligand PD-L114. Whether this defect has relevance in COVID-19 infection and in persistent EBV infection is unknown.
Like other professional antigen-presenting cells, Mϕ express an array of co-stimulatory and co-inhibitory ligands that influence communication with interacting T cells. Mϕ critically regulate the balance of T cell activation, tolerance, and immunopathology by delivering activating and suppressive signals, with PD-L1 and the poliovirus receptor (PVR, CD155) instructing T cells to abort their activation program. CD155, a transmembrane glycoprotein from the nectin-like family of proteins is typically expressed on monocytes, Mϕ and myeloid dendritic cells15 and binds to three receptors on the surface of T cells and NK cells to transmit a stop signal: TIGIT (T cell immunoreceptor with Ig and ITIM domains), CD96 and CD22616. Tumor cells abundantly express CD155 promoting immune-evasive strategies, supporting a role for CD155 in anti-tumor immunotherapy17.
The intensity of T cells activation ultimately depends on the stimulatory/inhibitory ligand balance on APC, subject to transcriptional or posttranscriptional regulation. mRNA modifications are recognized as major posttranscriptional processes determining gene expression18. As the most prevalent reversible modification on mRNA, N6–methyladenosine (m6A) regulates transcript stability, alternative splicing and translation18,19. Controlled by a group of regulatory proteins subdivided into “writer”, “reader” and “eraser” proteins, m6A is relevant for multiple cell types20. M6A is generated when the METTL3/METTL14 /WTAP complex adds a methyl group at position N6 of adenosine21. In mice, METTL3 deficiency leads to embryonic lethality22. The METTL3-mediated m6A modification controls tumor proliferation and invasion23. In the cardiovascular system, METTL3 has relevance in cardiomyocyte remodeling and hypertrophy24. METTL3 promotes macrophage polarization towards the pro-inflammatory M1 subtype by methylation of STAT1 mRNA25 and supports dendritic cell maturation26.
Here, we define molecular mechanisms underlying the deficit of cardiovascular disease patients to generate protective anti-viral immunity. CAD patients failed to induce CD4+ T cell responses against SARS-CoV2 and EBV antigens, a condition sine qua non for effective and sterilizing host protection. COVID19 vaccination could not repair the inability of CAD patients in expanding anti-SARS-CoV-2 reactive T cells. The immune defect derived from inadequate viral antigen presentation by Mϕ, caused by inappropriate expression of the inhibitory ligand CD155. CD155hi antigen-presenting cells dampened induction of adaptive immunity by ligating the inhibitory receptors TIGIT and CD96 on memory CD4+ T cells. Excess CD155 expression was a function of prolonged mRNA stability, downstream of the highly active methyltransferase METTL3 and enrichment of m6A-modified CD155 mRNA. siRNA-mediated suppression of CD155 and METTL3 as well as CD155-blocking antibodies were effective in deregulating CD155 mRNA hypermethylation. METTL3hi expression occurred early in the life cycle of monocytes /macrophages. The data define antigen-presenting Mϕ as critical effectors in anti-viral immunity, mechanistically link host protection to RNA epigenetics, and specify m6A editing as a rate-limiting step in the induction of protective immunity. Targeting m6A regulators to control the CD155 immune checkpoint holds promise for improved management of viral infection in high-risk individuals.
Results
Patients with CAD fail to generate anti-viral T cell responses
We developed an ex vivo assay system to probe the ability of CAD patients and healthy, age-matched controls to induce SARS-CoV2 specific and EBV specific T cells. Peripheral blood mononuclear cells (PBMC) from patients and control individuals were pulsed with a mixture of the two major SARS-CoV2 antigens, SARS-CoV2 spike (S) and nucleocapsid (N) proteins. In parallel, PBMC were stimulated with EBV Glycoprotein gp350, the most abundant glycoprotein expressed on the EBV envelope and the major target for neutralizing antibodies. We assessed the robustness of anti-viral T cell responses by monitoring the accumulation of secreted IFN-γ (Fig.1a). SARS-CoV2-induced IFN-γ concentrations averaged at 98 pg/ml in cultures from healthy individuals, but CAD patients produced only 43 pg/ml (Fig.1b, Extended Data Fig.1b). Also, antigen-reactive T cells defined by the co-expression of CD69 and CD40L36 were quantified by flow cytometry (Extended Data Fig.1a). On day 5 post antigen stimulation, 0.77% of healthy T cells had the CD3+ CD69+ CD40L+ phenotype, while this population was only half the size in CAD patients (Fig.1c). Comparison of CD69+ CD40L+ frequencies within the CD4+ and CD8+ subpopulations assigned the blunted response of CAD patients to the CD4+ subset (Extended Data Fig.1c). In freshly harvested cell populations, CAD patients and healthy controls had a similar distribution of CD4+ and CD8+ T cell subtypes (Extended Data Fig.1d). T cells responding to SARS-CoV2 antigens had a memory phenotype, compatible priming during infection with related corona viruses (Extended Data Fig.1e–1f). Frequencies of Spike antigen-reactive T cells were twice as high as Nucleocapsid-reactive T cells, and only Spike protein stimulation induced significantly higher responses in controls than in CAD patients (Extended Data Fig.1g–1h).
Fig. 1. Blunted anti-viral T cell responses in patients with coronary artery disease (CAD).
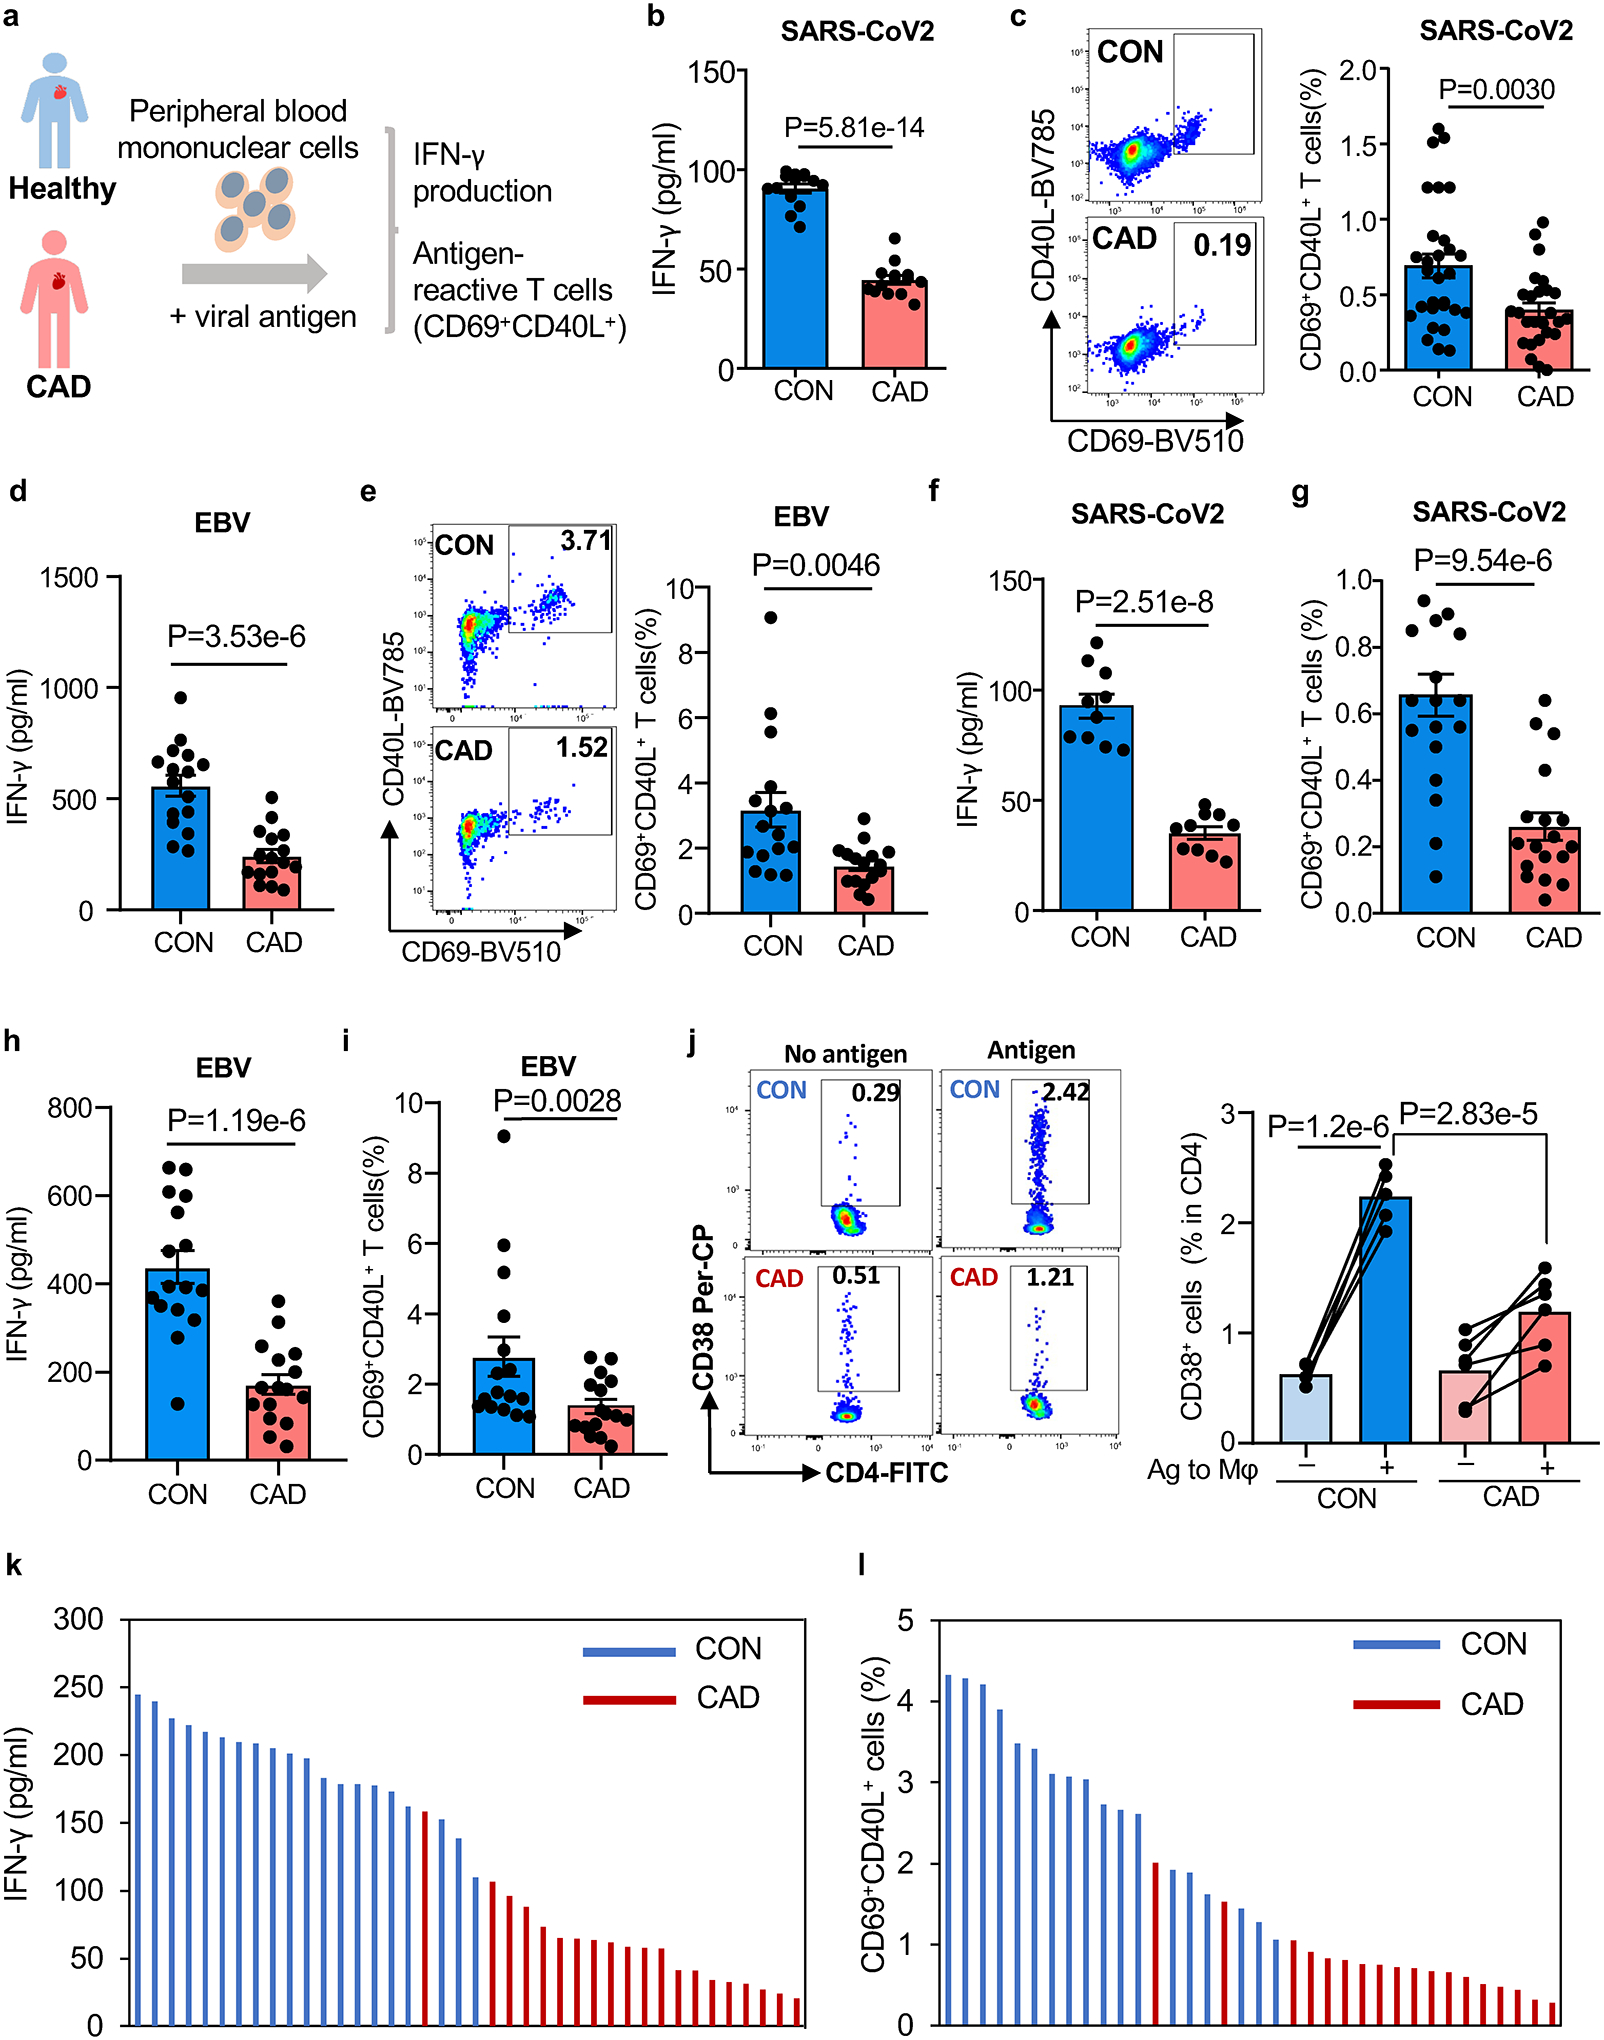
a. Experimental design. Peripheral blood mononuclear cells (PBMC) were stimulated with viral protein antigens (1μg/ml) for 5 days.
b-c. PBMC were stimulated with SARS-CoV2 spike and nucleocapsid antigens for 5 days. IFN-γ was quantified in supernatants (b, n=15). Frequencies of CD4+ CD69+ CD40L+ T cells were measured in 29 controls and 26 patients. Representative dot plots and summary data are shown (c).
d-e. PBMC were stimulated with EBV glycoprotein 350 for 5 days. IFN-γ concentrations (d) and frequencies of CD4+ CD69+ CD40L+ T cells (e). Representative dot blots and summary data are presented (n=16 patients and 16 controls).
f-g. T cells were primed with viral antigens for 5 days and restimulated with autologous antigen-loaded monocyte-derived macrophages (Mϕ). IFN-γ release (f, n=10 patients and controls) and frequencies of CD69+ CD40L+ T cells (g, n=18 patients and 19 controls) in response to SARS-CoV2 antigen-loaded Mϕ.
h-i. Antigen-induced IFN-γ release and frequencies of CD69+ CD40L+ T cells in response to Mϕ loaded with EBV antigen (n=16 patients and 16 controls).
j. Frequencies of CD4+ CD38+ human T cells in the spleen of immuno-deficient mice that were reconstituted with patient-derived or control PBMC and immunized with SARS-CoV2 spike protein (n=6 patients and 5 controls)
k-l. T cell responses to SARS-CoV2 spike protein in patients and controls that had completed vaccination with mRNA-based COVID19 vaccine. IFN-γ secretion and frequencies of antigen-reactive CD69+ CD40L+ T cells. Individual data points are displayed.
Data in Fig.1b–j are shown as mean ± SEM. Paired or unpaired one-way ANOVA were used to analyze the difference. P-values shown in each panel.
To test whether this impaired antigen response was specific for SARS-CoV2 protein or had relevance for other viral antigens, we examined T cell responses to the Epstein – Barr virus (EBV) glycoprotein gp350. The EBV glycoprotein outperformed the SARS-CoV2 antigen and induced an average of 559.2 pg/ml of IFN-γ in healthy responders (Fig.1d). Again, the cells from CAD patients failed to reach comparable IFN-γ production, but only yielded about 240 pg/ml (Fig.1d). After 5 days of EBV antigen stimulation, healthy individuals recruited 3.27% of CD69+CD40L+T cells, almost 2-fold higher frequencies than the 1.77% in CAD patients (Fig.1e).
We tested whether improved antigen presentation could overcome defective T cell responsiveness by preloading fully differentiated Mϕ with S antigen. Pre-loaded Mϕ provoked robust IFN-γ production in healthy T cells but elicited a blunted reaction in patient-derived T cells (Fig.1f). Healthy individuals generated an excellent recall response, while CAD T cells failed to expand (Fig.1g). Healthy Mϕ pre-loaded with EBV antigen induced strong IFN-γ release, unmatched by the patients (Fig.1h). Patients recalled EBV-specific T cells at about 50% of the frequencies encountered in healthy controls (Fig.1i).
To establish relevance of these observations for in vivo anti-viral immunity, we investigated anti-SARS-CoV2 T cell responses in immunodeficient NSG mice. NSG were reconstituted with T cells and macrophages from either healthy individuals or CAD patients (Extended Data Fig.2a) and immunized with viral protein. Adoptive transfer of antigen-loaded Mϕ prompted expansion of a population of CD4+ CD38+ T cells in the spleen (Fig.1j) (Extended Data Fig.2b–2c). Direct comparison of CD4+CD38+ T cell frequencies induced by antigen-loaded and vehicle-loaded Mϕ established specificity of the response. Mice reconstituted with healthy T cells and injected with antigen-carrying Mϕ accumulated 2.24% of CD4+CD38+ T cells in their spleen. In contrast, chimeras reconstituted with CAD T cells mobilized only 1.19% of CD4+CD38+ T cells (Fig.1j).
The Pfizer-BioNTech (BNT162b2) and Moderna (mRNA-1273) mRNA COVID-19 vaccines induce measurable T cell responses to Spike protein37,38. To examine whether COVID-19 vaccination can assist CAD patients to generate adequate T cell immunity to SARS-CoV2 antigens, we recruited fully vaccinated healthy controls and CAD patients. Strikingly, IFN-γ production was twice as high in the vaccinated compared to the non-vaccinated healthy individuals (Fig.1k). Also, Spike-reactive CD69+CD40L+ T cells reached ~3% of CD4+ T cells, 3-fold higher than the ~1% frequencies measured in non-vaccinated healthy donors (Fig.1l). Vaccination with the mRNA-based vaccines did not significantly change the frequency of anti-SARS-CoV2-reactive T cells in CAD patients. Vaccination slightly, but non-significantly boosted IFN-γ production (Fig.1k). In a cohort of 20 post-vaccine CAD patients, 17 patients had frequencies of Spike-induced CD69+CD40L+ T cells of less than 1% (Fig.1l).
Together, these data identified a population of IFN-γ-producing CD4+ memory T cells that proliferated when recognizing viral antigens. In CAD patients, anti-viral CD4+ T cells were poorly responsive to SARS-CoV2 and EBV antigens and vaccination with an mRNA-based vaccine could not overcome the defect.
CAD Mϕ overexpress the immunoinhibitory ligand CD155
The intensity and durability of antigen-specific T cell responses depends on antigen recognition but is critically influenced by the co-stimulatory and co-inhibitory signals delivered by the antigen-presenting cell39. We profiled the transcriptome of Mϕ derived from patients and controls for 12 co-stimulatory and co-inhibitory molecules (Fig.2a and Extended Data Fig.4a). Transcripts for PD-L1 and CD155 were significantly increased in CAD Mϕ, but CD155 displayed the most robust difference. Flow cytometric analysis of control and CAD Mϕ confirmed high surface expression of CD155 (Fig.2b). Confocal imaging of CD155 demonstrated high expression of the protein in the cytoplasm and on the cell surface in CAD Mϕ (Fig.2c). We explored whether Mϕ residing in the atherosclerotic plaque have a CD155hi phenotype. Dual color immunohistochemistry of atheroma tissue placed CD155 exclusively on CD68+ Mϕ (Fig.2d). Plaque-residing Mϕ are a heterogenous population18. To understand which Mϕ subtypes express CD155, we digested the atherosclerotic arteries and utilized multiparametric flow cytometry to define relevant cell populations (Extended Data Fig.3a). Based on the expression pattern of the antigen-presenting molecule HLA-DR and the Mϕ marker CD206, tissue-derived CD45+ CD68+ cells fell into 4 clusters; two of which expressed HLA-DR and where therefore capable of antigen presentation (Extended Data Fig.3b). HLA-DRhi CD206neg and HLA-DRint CD206pos tissue Mϕ were both strongly positive for CD155 (Extended Data Fig.3c). Conversely, HLA-DRneg tissue Mϕ, including a CD206pos and CD206neg population, lacked CD155 expression. Accordingly, polarization of monocyte-derived CAD Mϕ with either LPS plus IFN-γ (M1-like Mϕ) or IL-4 (M2-like Mϕ) aligned CD155 expression to the pro-inflammatory phenotype (Extended Data Fig.3d).
Fig. 2. CD155hi macrophages suppress anti-viral T cell responses.
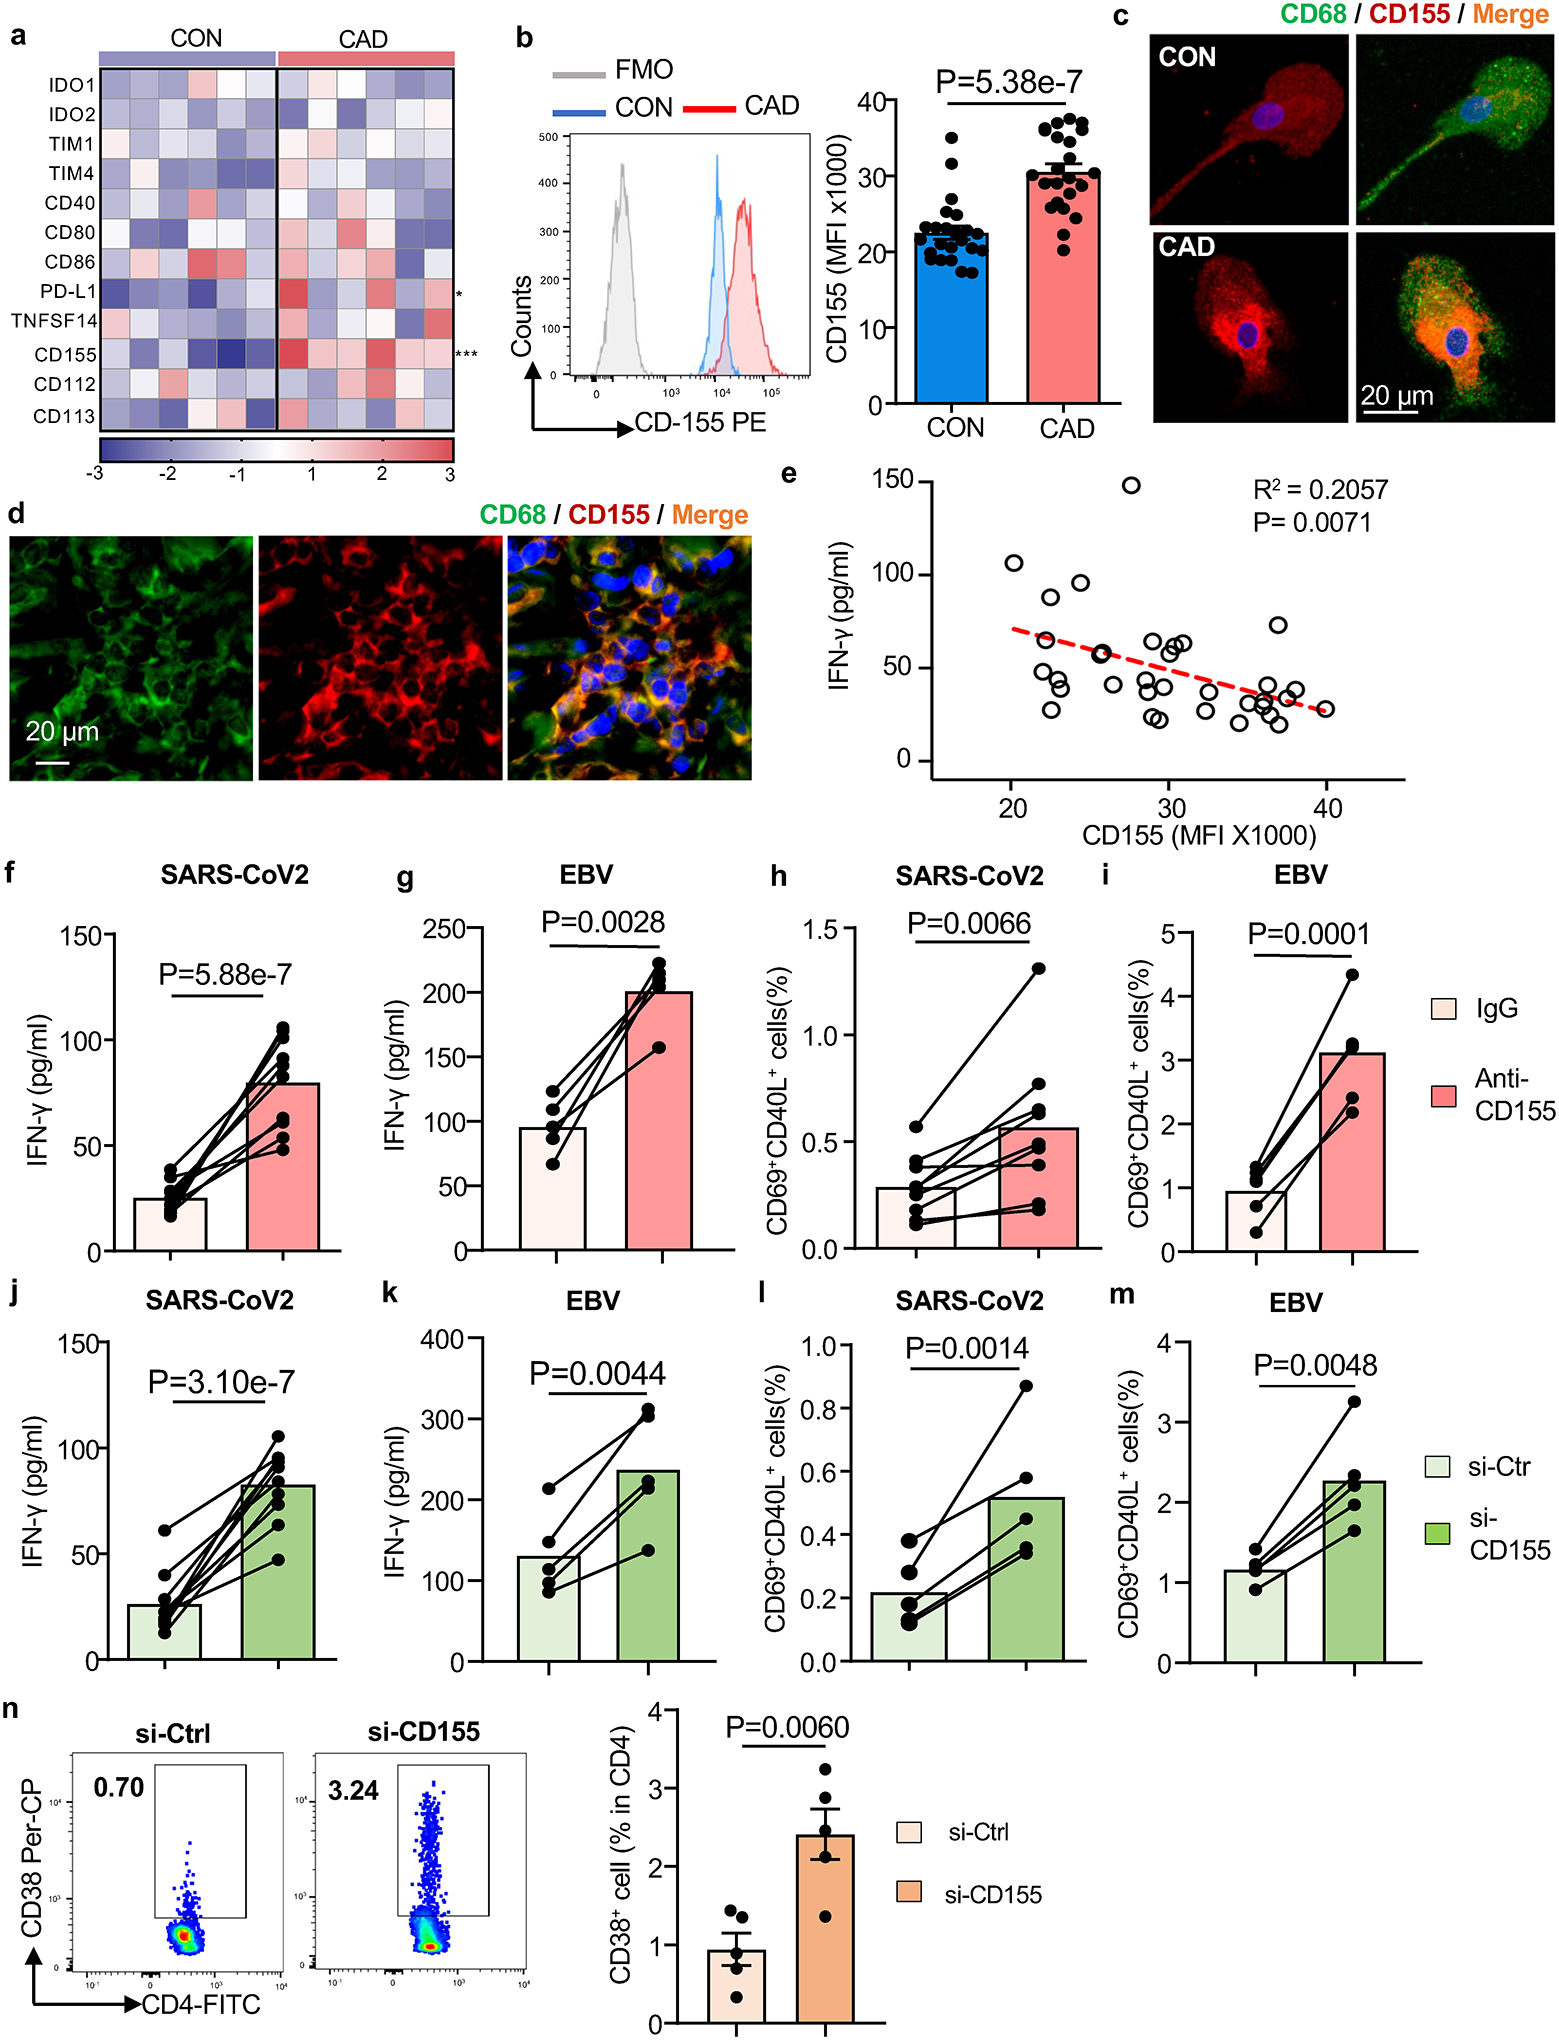
a-c. Monocyte-derived macrophages (Mϕ) were generated from patients and controls. Gene expression signature for 14 immune checkpoint genes in healthy and CAD Mϕ (n=6). qPCR results shown as a heat map (a). Flow cytometry of CD155 surface expression in healthy and CAD Mϕ. Representative histograms and summary data from n=27 controls and 27 patients are shown (b). Confocal immunofluorescence of CD155 protein expression in healthy and CAD Mϕ. Representative images from 3 independent experiments (c).
d. Fluorescence microscopy of atherosclerotic plaque tissue sections stained for CD68 (green) and CD155 (red). Representative images from 4 experiments.
e. Correlation of antigen-induced IFN-γ release and Mϕ CD155 expression in n=34 CAD patients.
f-g. IFN-γ secretion after SARS-CoV2 antigen (f, n=10) or EBV antigen (g, n=5) stimulation in the absence or presence of anti-CD155 antibodies.
h-i. Frequencies of CD69+CD40L+ T cells induced by SARS-CoV2 antigen (h, n=8) or EBV antigen stimulation (i, n=5) with and without CD155 blockade.
j-m. Mϕ were transfected with control or CD155 siRNA prior to antigen loading. IFN-γ induction after stimulation with SARS-CoV2 antigen (j, n=10) or EBV antigen (k, n=5). Frequencies of SARS-CoV2-reactive CD69+ CD40L+ T cells. (l, n=6) and EBV-reactive CD69+ CD40L+ T cells (m, n=5).
n. In vivo anti-SARS-CoV-2 T cell responses were measured in immuno-deficient NSG mice that were reconstituted with human PBMC and immunized with viral protein. Mϕ were transfected with control or CD155 siRNA before the adoptive transfer. After one week, antigen-induced human CD4+ CD38+ T cells were measured in the spleen. Representative dot blots of CD4+ CD38+ T cells and frequencies of CD4+ CD38+ T cells. Data from 5 experiments. Data are mean ± SEM. Comparison by one-way ANOVA. Correlation analysis with linear regression. P-values shown in each panel.
To define the functional impact of CD155hi expression on CAD Mϕ, we analyzed whether the abundance of CD155 on Mϕ has relevance for anti-viral T cell immunity. CD155 expression on the Mϕ surface negatively correlated with antigen-induced IFN-γ production (Fig.2e). Further, we suppressed CD155-dependent signaling through CD155 blocking antibodies or by CD155 knockdown (Extended Data Fig.4b–4c). T cells responding to viral antigens were quantified as the measure of functional outcome. Both strategies successfully restored the ability of CAD Mϕ to activate anti-viral T cells (Fig.2f–2m). Blocking CD155 on patients Mϕ restored antigen-presenting function but CD155 blockade of healthy Mϕ had no impact on T cell responsiveness (Extended Data Fig.4d–4k). For both, SARS-CoV2 and EBV antigens, anti-CD155 blocking antibodies improved antigen-induced IFN-γ production to the level of normal controls (Fig.2f–2g) and brought CAD T cell yield into the normal range (Fig.2h–2i). Knockdown of CD155 was similarly successful, normalizing the frequencies of IFN-γ release and CD4+ CD69+ CD40L+ T cells (Fig.2j–2m).
To expand these findings to in vivo conditions, we injected NSG mice with CAD Mϕ, T cells and SARS-CoV2 antigen (Extended Data Fig.2a). CD155 knockdown in Mϕ prior to the adoptive transfer enhanced the activation and expansion of antigen-reactive T cells more than 4-fold (Fig.2n). Both ex vivo and in vivo, correcting CD155 overexpression was sufficient to restore CD4+ T cell reactivity against SARS-CoV2 antigen to a level seen in healthy controls. These data implicated the immunoinhibitory ligand CD155 in suppressing anti-viral T cell immunity and mapped the immune defect in CAD patients to Mϕ.
Inhibitory receptors of CD155 accumulate on memory T cells
CD155 delivers a negative signal to T cells by binding to the ITIM motif-containing receptors TIGIT and CD9616. To identify T cells capable of recognizing CD155, we analyzed CD4+ memory T cell populations for the expression of TIGIT and CD96. Naive CD4+ T cell and resting CD4+ memory populations were essentially negative for both receptors (Fig.3a–3b). T-cell receptor-mediated stimulation resulted in robust upregulation of TIGIT and CD96 transcripts and protein (Fig.3a–3e), starting 72 hrs post stimulation.
Fig.3. Expression of the CD155 receptors TIGIT and CD96 on activated memory CD4+ T cells.
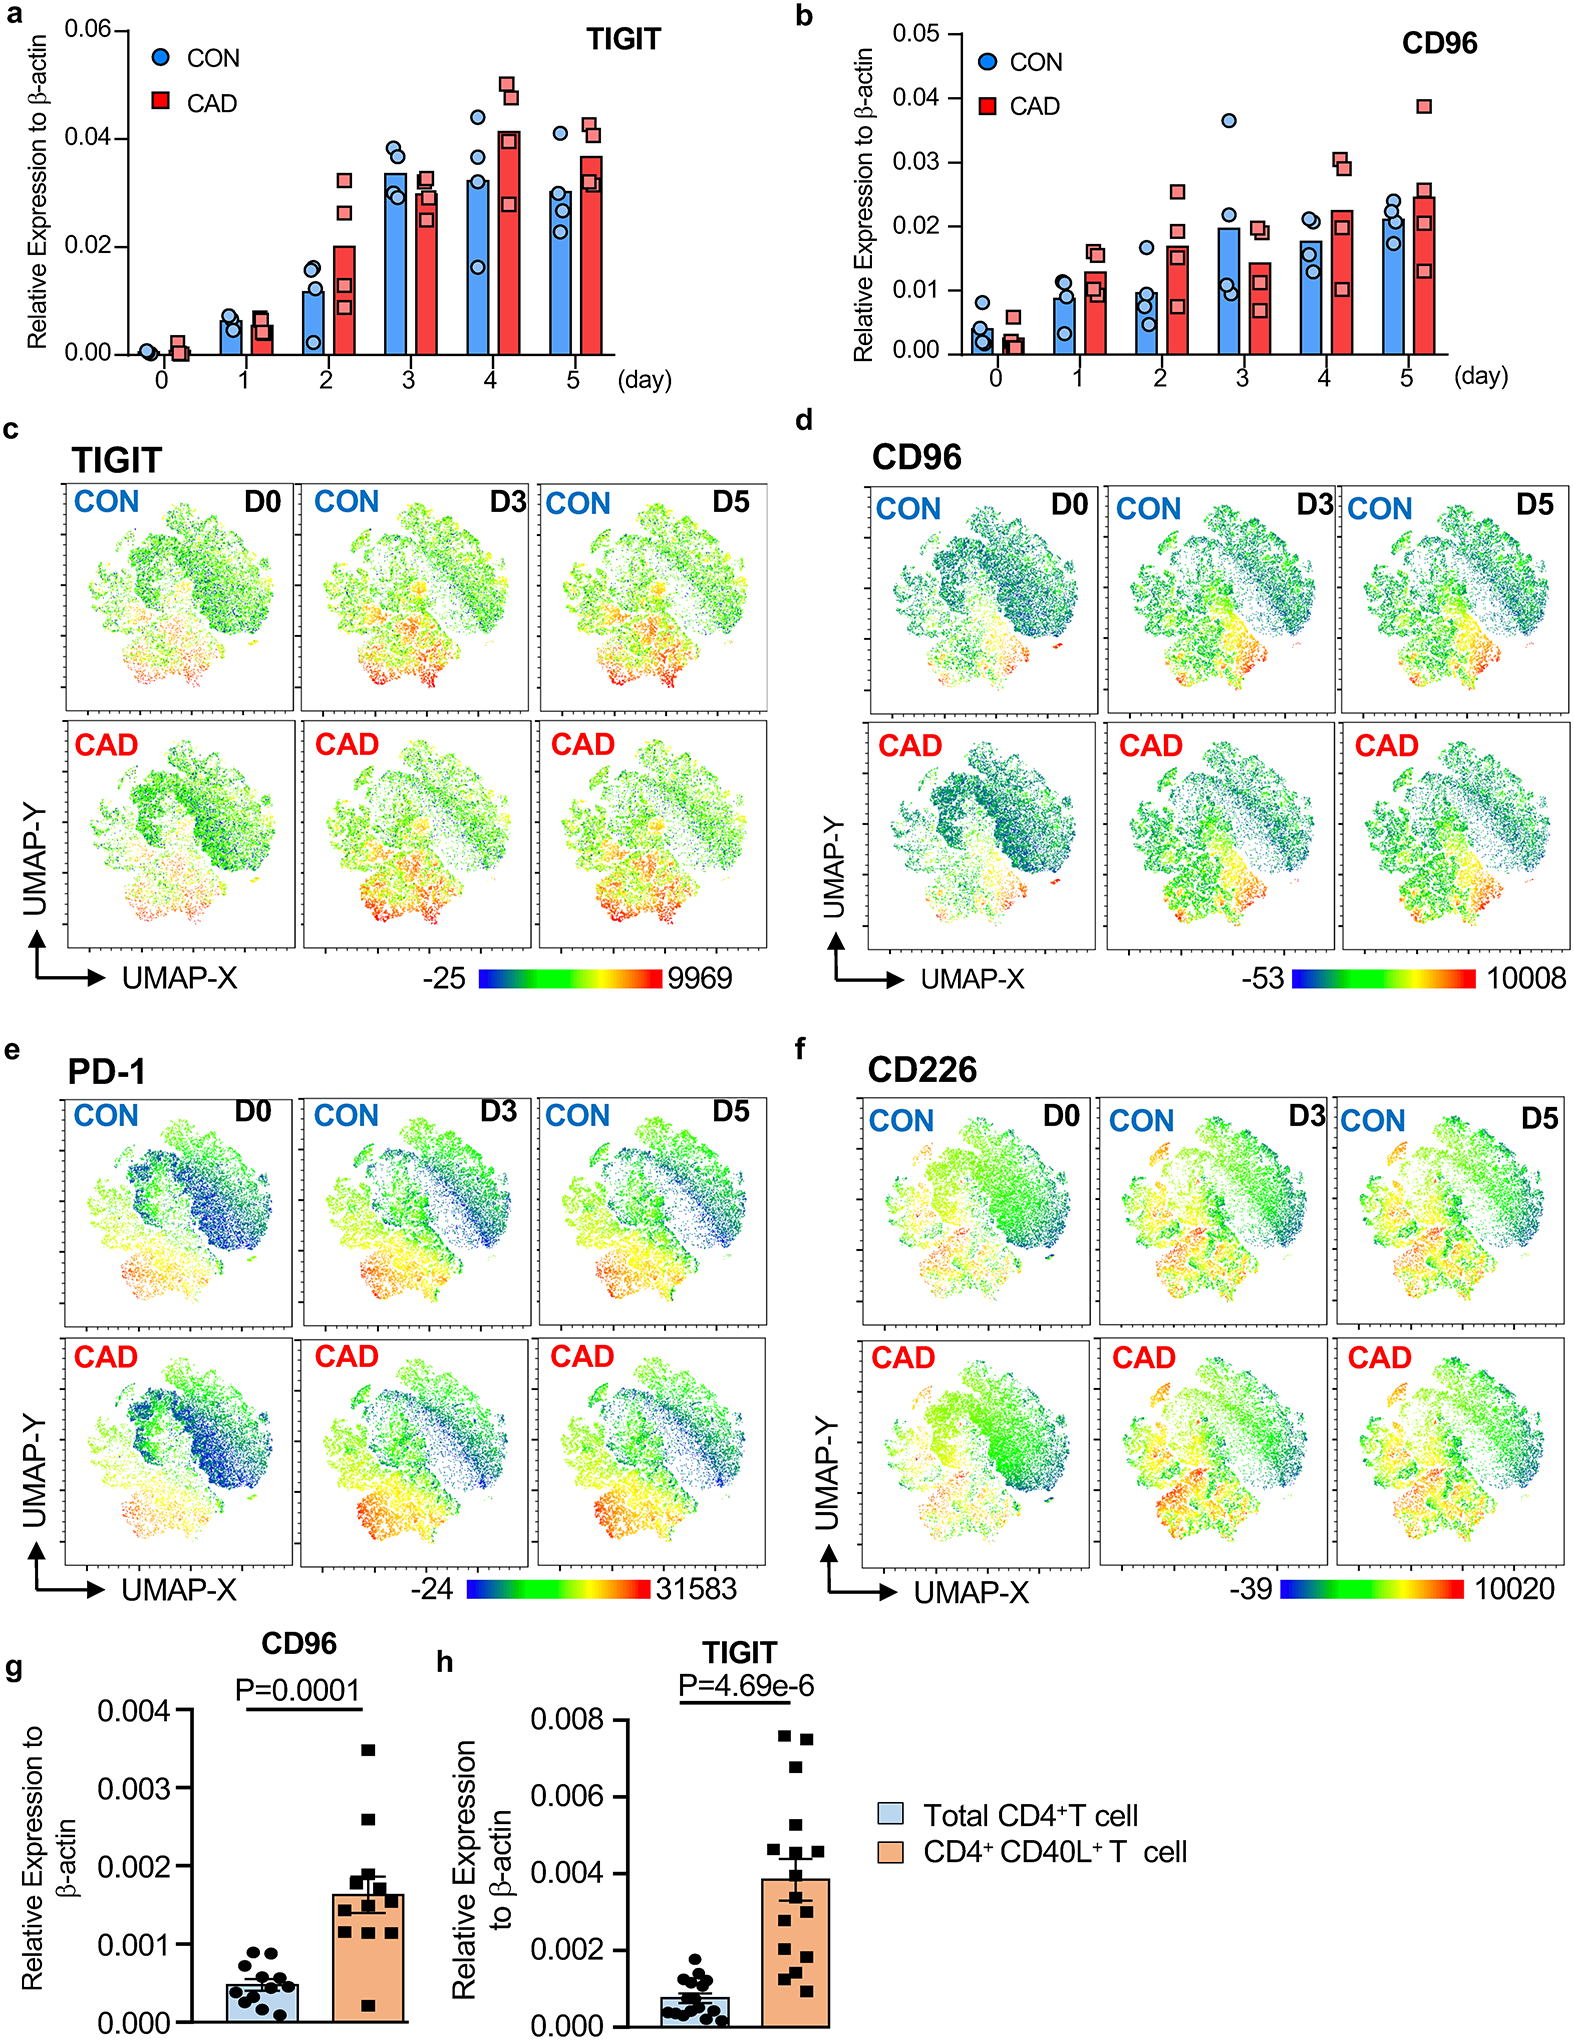
a-d. CD4+ CD45RO+ memory T cells isolated from healthy individuals and CAD patients were stimulated with anti-CD3/anti-CD28 for 5 days. Kinetics of TIGIT (a) and CD96 (b) transcript expression measured by RT-PCR (n=4 patients and 4 controls). UMAP clustering of multi-parametric flow cytometry data. The expression of the co-inhibitory receptors TIGIT (c), CD96 (d), PD-1 (e), and CD226 (f) is indicated. Each dot plot concatenates data from 6 experiments.
g-h. PBMCs were stimulated with SARS-CoV2 proteins (1μg/ml) for 5 days. Total CD4+ T cells and antigen-reactive CD40L+ T cells were isolated and TIGIT (g, n=12) and CD96 (h, n=16) transcripts were measured by RT-PCR.
Data are mean ± SEM. Comparison by one-way ANOVA. P-values shown in each panel.
To analyze the expression patterns of T cell receptors mediating inhibitory signals, we used multi-parametric flow cytometry for CD96, TIGIT, PD-1 and CD226 on stimulated CD4+ memory T cells from patients and controls. UMAP plots revealed partly overlapping expression of TIGIT and CD96 on activated T cells. Besides the CD4+ TIGIT+ CD96+ T cell subset, we found a subpopulation of TIGIT+ CD96neg cells (Fig.3c–3d). CD4+ TIGIT+ CD96− T cells and CD4+CD96+TIGIT+ double positive T cells accounted for about 15% on day 3 and 20% on day 5 (Fig.3c–3d). Some of the TIGIT+ CD96+ cells also expressed PD-1 (Fig.3e). In contrast, CD226+ T cells belonged to a separate cluster (Fig.3f). Thus, about 1/4 of the memory T cell population possesses receptors capable of interacting with CD155, being susceptible to negative signaling delivered by CD155hi expressing Mϕ. The distributions of CD4+ T cell clusters expressing CD96, TIGIT, PD-1 and CD226 were indistinguishable in patients and controls.
We asked whether CD4+ T cells activated by viral protein fell into the TIGIT+CD96+ subset, thus being receptive to the inhibitory signals from CD155hi Mϕ. We sorted CD40L+ T cells after SARS-CoV2 antigen stimulation for 5 days. Total CD4+ T cells were purified to serve as a control. TIGIT and CD96 transcripts were highly enriched amongst antigen-reactive, CD40L-expressing T cells, with 3- or 4- fold higher prevalence compared to the overall CD4+ T cell pool (Fig.3g–3h). Thus, antigen stimulation upregulates the inhibitory receptors CD96 and TIGIT in CD4+ T cells, rendering them vulnerable to negative signaling from CD155+ antigen-presenting cells.
N6-methyltransferase METTL3 stabilizes CD155 mRNA in CAD Mϕ
To identify and characterize mechanisms underlying the CD155hi phenotype in CAD Mϕ, we determined CD155 mRNA stability through an actinomycin D-dependent RNA decay assay40. CD155 mRNA turnover was high, with half of the transcripts being degraded within 3–4 hours (Fig.4a). In CAD Mϕ, the half-life of CD155 mRNA was significantly prolonged, with 50% of transcripts still available after 6 hrs, suggesting that CD155 overexpression on CAD Mϕ was a consequence of increased RNA stability.
Fig. 4. The N6-Adenosine Methyltransferase-like 3 (METTL3) stabilizes CD155 mRNA in CAD macrophages.
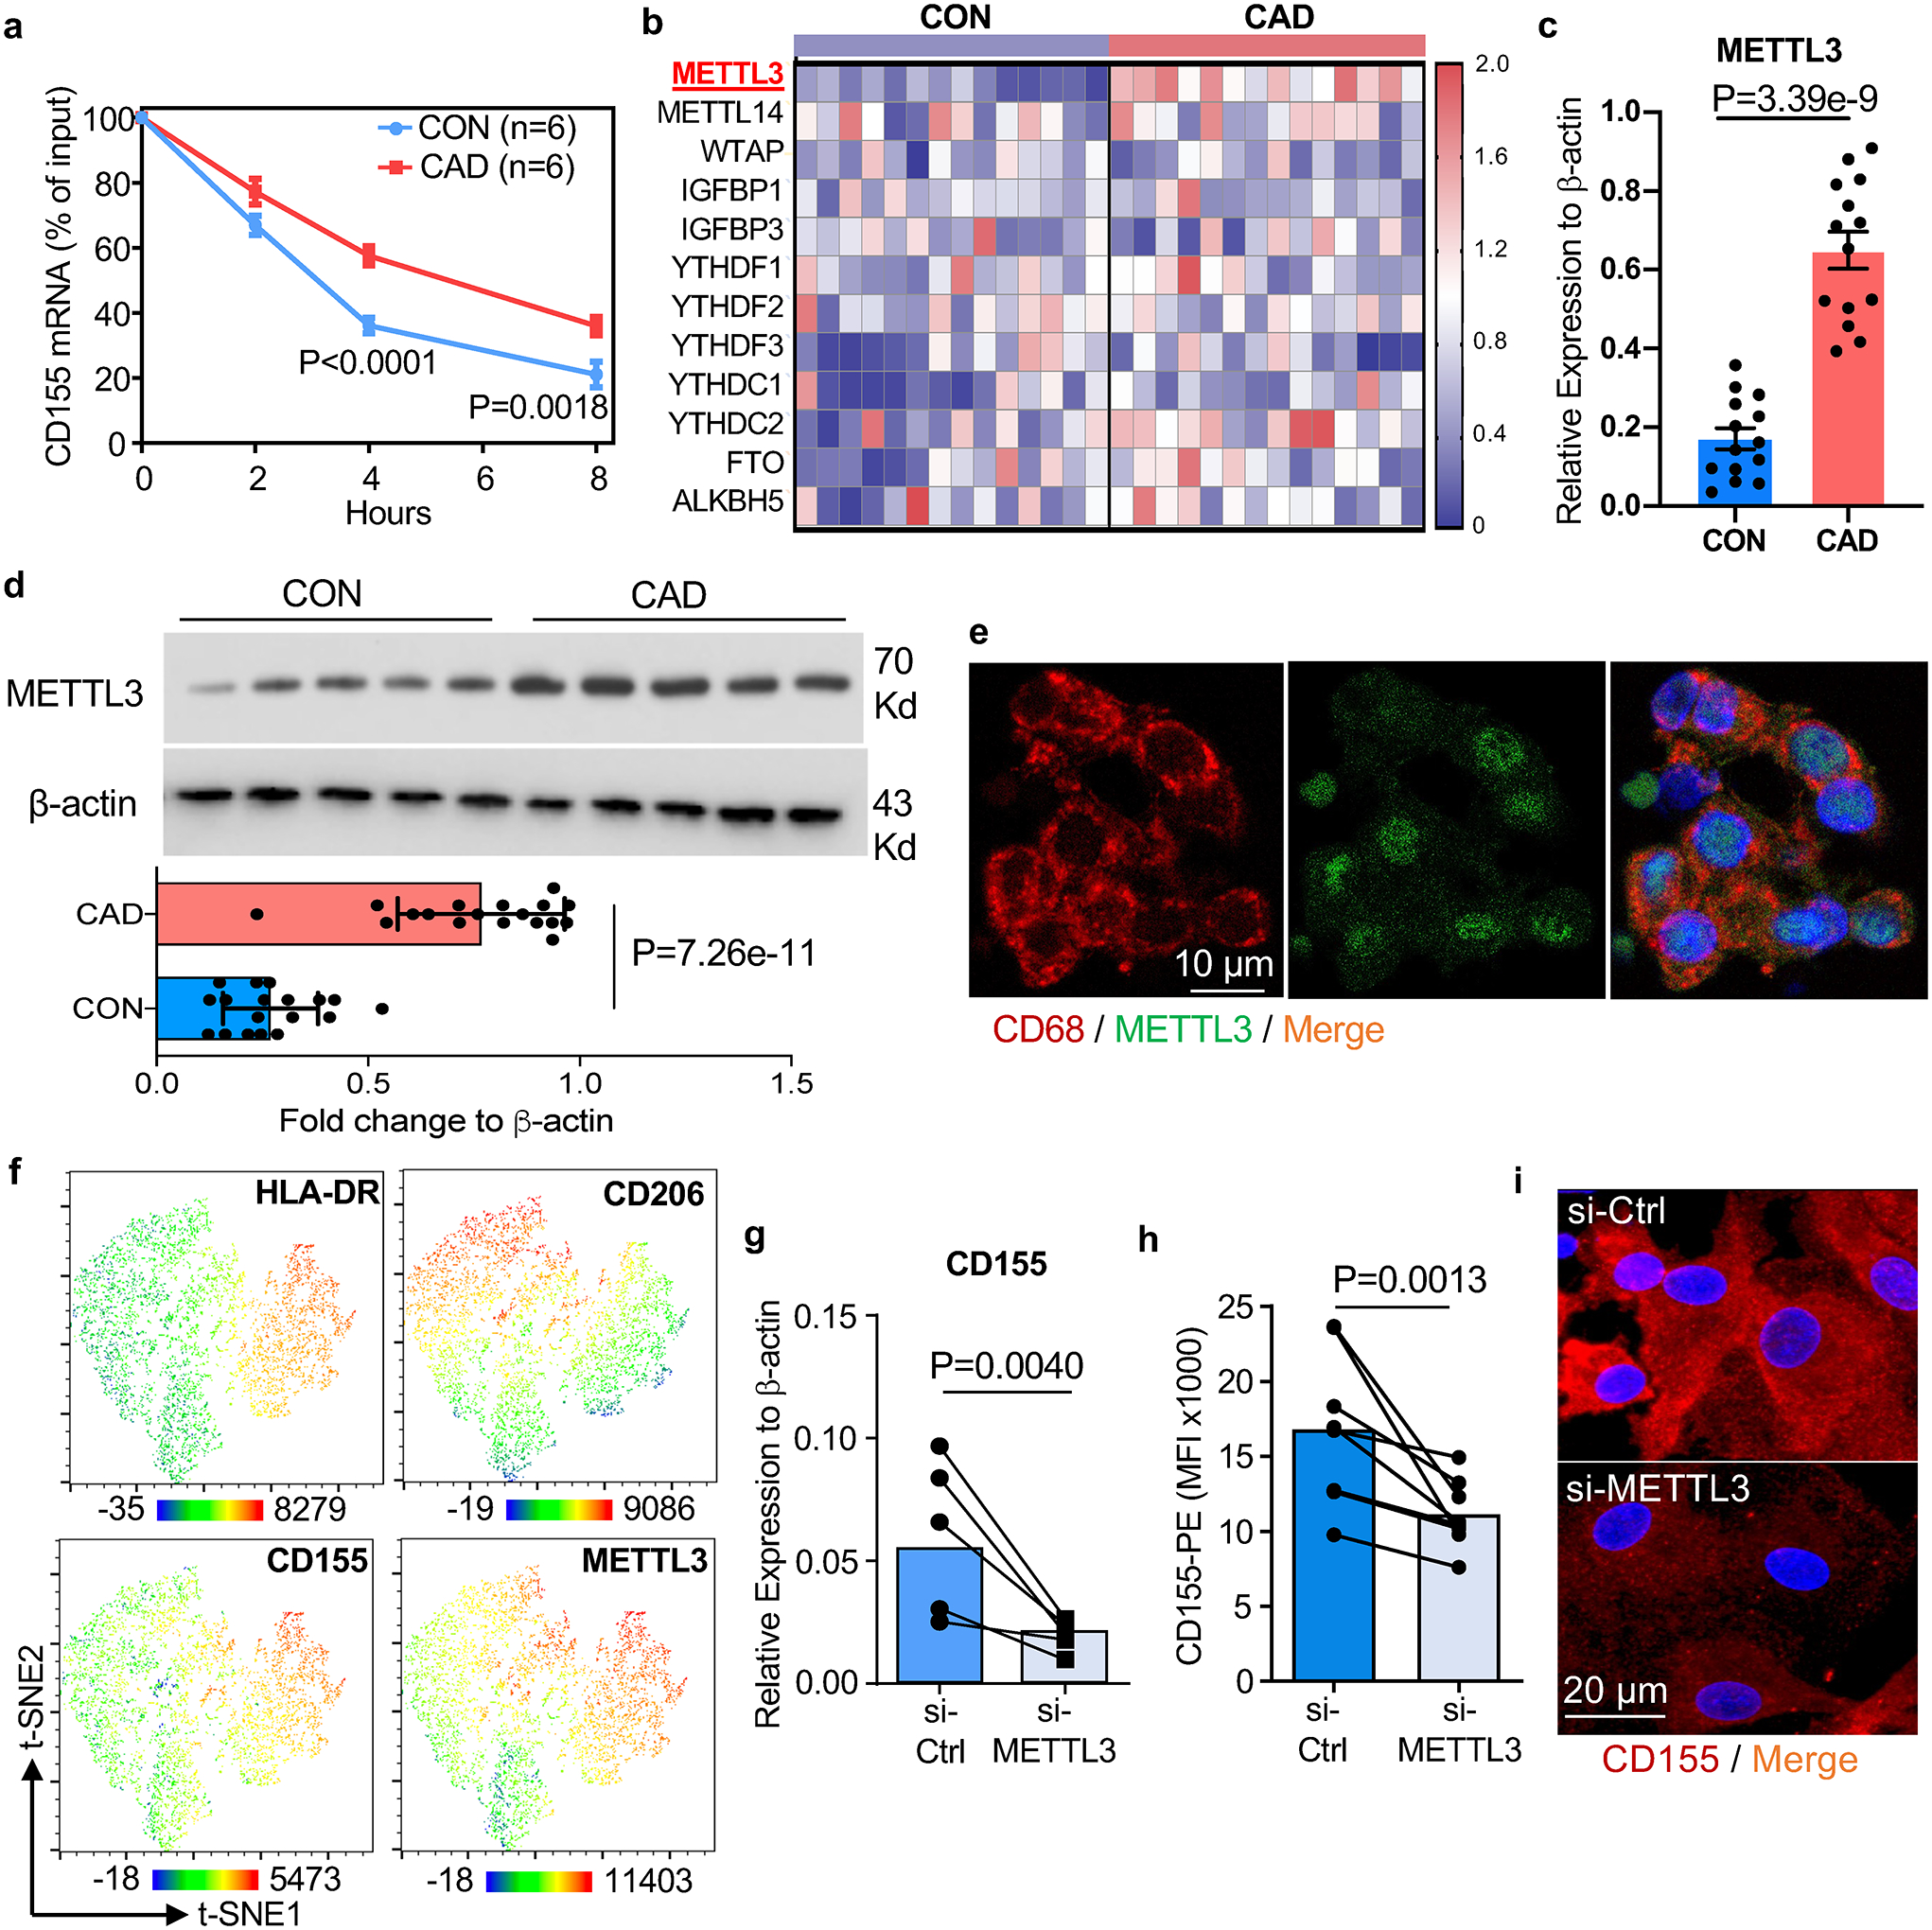
a-d. Monocyte-derived Mϕ were generated from controls and CAD patients. CD155 mRNA was quantified after treatment with the transcription inhibitor actinomycin D (3μg/ml; 0–8 hours) (a, n=6). Transcripts of 12 m6A-related genes measured by RT-PCR. Data shown as heatmaps (b, n=14). RT-PCR quantification of METTL3 transcripts (c, n=14). Immunoblotting of METTL3 protein. β-actin served as control. Representative blot and data from 18 patients and 18 controls (d).
e. METTL3 (green) in CD68+ tissue residing Mϕ (red) in atherosclerotic plaque tissue sections. Representative images from 4 experiments.
f. t-SNE clustering of multi-parametric flow cytometry data from Mϕ isolated from human atherosclerotic arteries. Expression patterns of HLA-DR, CD206, CD155 and METTL3 indicated by color code. Each dot plot concatenates data from 2 tissues.
g-i. siRNA-mediated METTL3 knockdown in control and CAD Mϕ. CD155 transcripts measured by RT-PCR (g, n=5). CD155 surface expression analyzed by flow cytometry (h, n=8). Confocal immunofluorescence staining for CD155 (red). Images are representative of 3 independent experiments (i).
Each point represents one patient or one healthy control. Data are mean ± SEM. Comparison by two-tailed unpaired student t-test (b, d), two-tailed paired student t-test (g, h). P-values are shown in each panel.
mRNA modifications have been implicated in regulating mRNA stability and fate21. Specifically, the most abundant mRNA modification, N6-Methyladenosine (M6A), determines target mRNA concentrations by affecting RNA stability, decay, and alternative splicing20. The M6A process is reversible and requires 2 different components: the “writer” N6-methyltransferase complex which catalyzes the formation of m6A while the “eraser” demethylases reverse the methylation. We profiled gene expression patterns for 12 common M6A-related genes, including ‘writers’, ‘readers’ and ‘erasers’ (Fig.4b). Most genes were expressed at similar abundance in control and CAD Mϕ, but transcripts for the writer METTL3, the only methylase in the N6-methyltransferase complex41, were significantly higher in CAD Mϕ (Fig.4c). Immunoblotting confirmed two-fold higher protein concentrations of METTL3 in CAD compared to healthy Mϕ (Fig.4d). To evaluate METTL3 expression in tissue residing Mϕ within the atheroma, we applied dual color immunohistochemistry. METTL3 was highly expressed in plaque infiltrating CD68+ Mϕ. Most of the enzyme localized to the nucleus (Fig.4e).
To understand the expression pattern of METTL3 in atherosclerotic arteries, we performed multiparametric flow cytometry of Mϕ isolated from atherosclerotic arteries (Extended Data Fig.3a). Again, HLA-DRhi CD206neg and HLA-DRint CD206pos tissue Mϕ stained strongly positive for METTL3 (Extended Data Fig.6a). t-SNE visualization of plaque-residing Mϕ confirmed the overlap of METTL3, CD155 and HLA-DR expression on CD206neg Mϕ (Fig.4f), assigning antigen presentation to Mϕ recognized for their proinflammatory features42.
To mechanistically connect METTL3-dependent M6A to CD155 mRNA stability, we used siRNA technology to knock down Mϕ METTL3 (Extended Data Fig.6b–6c). The culture and knockdown of METTL3 did not make a difference in the survival of Mϕ between groups (Extended Data Fig.5a–5h). Reducing METTL3 availability promptly lowered Mϕ CD155 mRNA concentrations (Fig.4g) and protein expression (Fig.4h, Extended Data Fig.6d). Confocal imaging of Mϕ transfected with control or METTL3 siRNA confirmed the dependency of CD155 expression on the methyltransferase (Fig.4i). Similarly, treat Mϕ with m6A inhibitor 3-deazaadenosine (3-DAA) also lead to a reduction of CD155 transcript level and protein accumulation in Mϕ (Extended Data Fig.6e–6f).
The m6A modification is most likely to occur in a DRACH (D=A, G or U; H=A, C or U) consensus motif. To identify potential DRACH sites in CD155 mRNA, we analyzed the CD155 sequence with the m6A prediction server SRAMP32 and searched Me-RIP sequence data obtained from the human monocytic cell lines monomac-6 (GSE7641433) and Nomo-1 (GSE87190)34; yielding 6 potential sites with high confidentiality scores (Extended Data Fig.6g and Supplementary Table 1). All 6 DRACH sites were localized in the 3’-UTR region of CD155 mRNA (Fig.5a). To interrogate site-specific m6A, we applied a RT-PCR based system35 which relies on the m6A-dependent suppression of retrotranscription with Bst enzyme but not with MRT enzyme (Fig.5a). This approach mapped highly methylated sites to positions 1635A and 3103A of CD155 mRNA in CAD Mϕ (Fig.5b–5c). Site-specific mutations followed by dual-luciferase reporter assays provided strong support for functional relevance of m6A modification at the two positions (Fig.5d). Luciferase activity for a reporter carrying the CD155 3’UTR wild-type region was higher in patient-derived versus healthy Mϕ. After the two m6A sites were mutated, luciferase activity was indistinguishable in control and CAD Mϕ (Fig.5e–5f). METTL3 knockdown in CAD Mϕ eliminated the difference in luciferase activity, confirming the relevance of methylation in controlling CD155 mRNA expression (Fig.5g–4h).
Fig.5A. modification on 1635A and 3103A enhances the stability of CD155 mRNA.
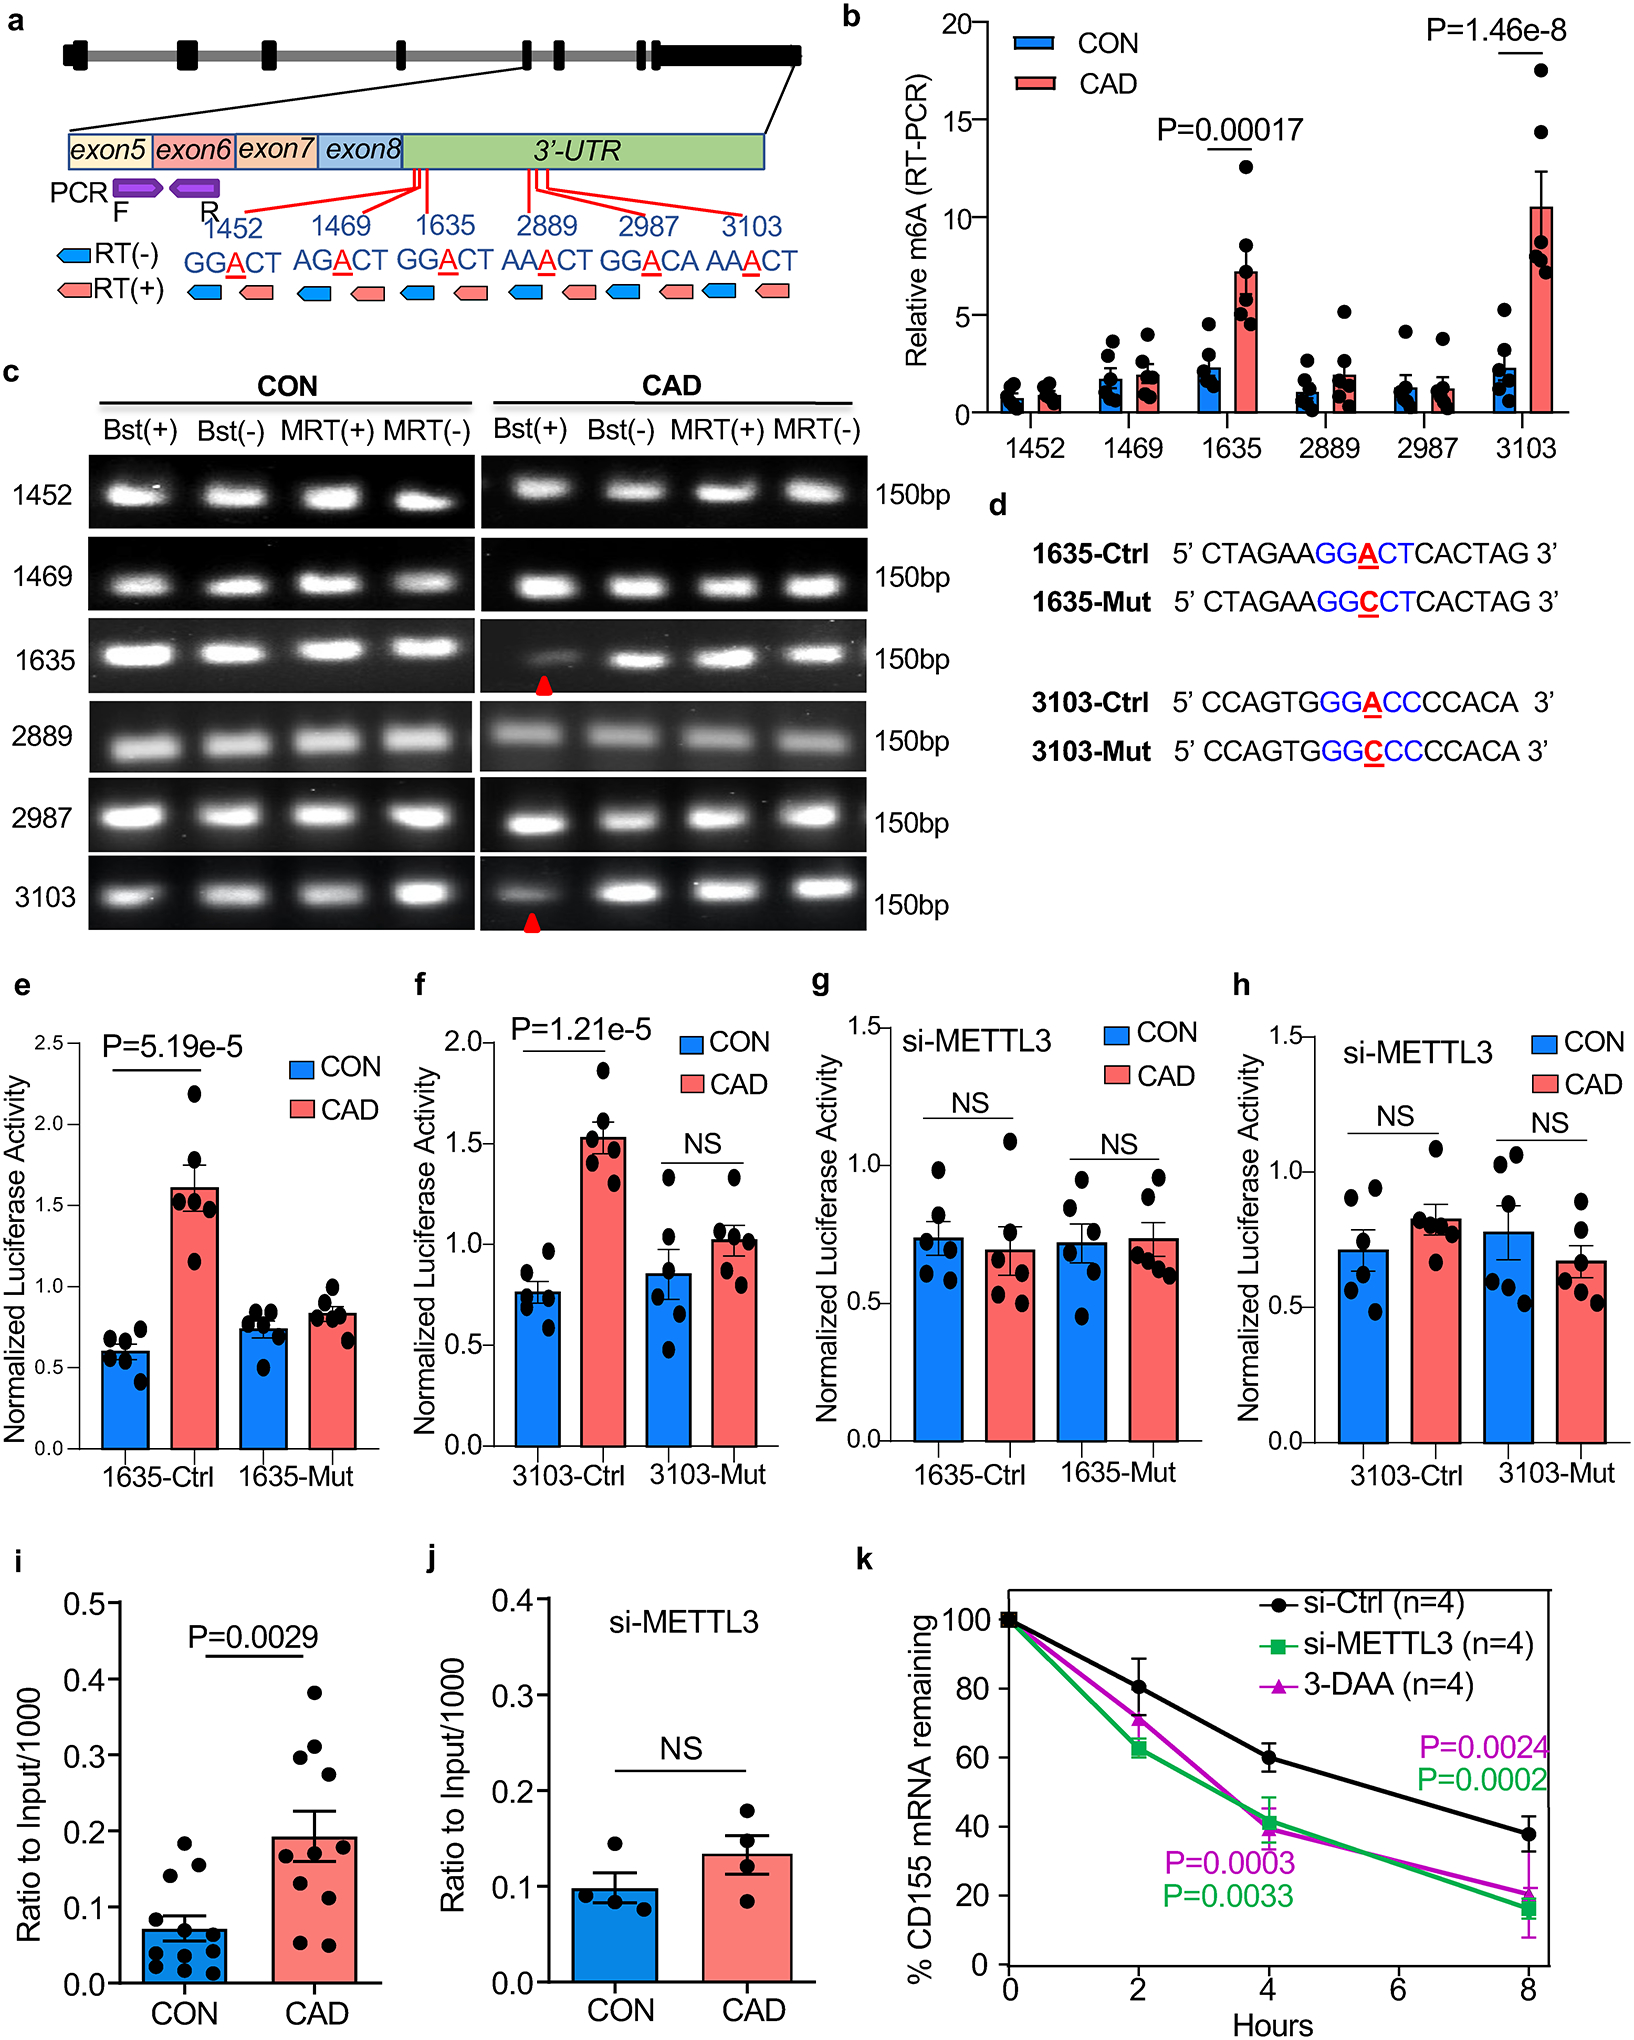
a. Scheme of CD155 genomic organization, potential m6A sites, strategy of retro-transcription and RT-PCR for mapping of m6A sites.
b-c. PCR of retro-transcribed Mϕ RNA using m6A (+) and (−) primers and Bstl and MRT enzymes. m6A-RT-PCR for different m6A sites on CD155 transcripts (b, n=6). Representative agarose gel electrophoresis of PCR products for different m6A sites on CD155 Transcripts (c).
d. Design of the m6A point mutations in the 3’-UTR region of CD155.
e-f. Dual luciferase reporter assays for m6A sites in the 3’-UTR region of CD155. (e) 1635A, (f) 3103A (n=6).
g-h. Dual luciferase reporter assays for m6A sites in the 3’-UTR regions of CD155 after METTL3 knockdown. (g) site 1635A, (h) site 3103A (n=6).
i-j. Methylated RNA immunoprecipitation (Me-RIP) assay to quantify M6A. Methylated CD155-specific mRNA in control and CAD Mϕ measured by Me-RIP (i, n=12). Methylated CD155 mRNA determined by Me-RIP after siRNA-mediated METTL3 knockdown (j, n=4).
k. CD155 mRNA decay assay in Mϕ treated with the M6A inhibitor 3-DAA or transfected with METTL3 siRNA (n=4).
Each point represents one patient or one healthy control. Data are mean ± SEM. Comparisons by unpaired Student t-test (b,i and j), one-way ANOVA (e-h), and two-way ANOVA (k). P-values shown in each panel.
To further evaluate the contribution of m6A modification on CD155 mRNA stability, we performed a m6A RNA immunoprecipitation (Me-RIP) assay using m6A capture antibodies (Extended Data Fig.6h). In healthy Mϕ, the m6A modification of CD155 mRNA was barely detectable (Fig.5i). In contrast, m6A capture antibodies successfully pulled down CD155 mRNA in CAD Mϕ (Extended Data Fig.6i). Capture with IgG isotype control antibodies yielded no differences in CD155 mRNA pulldown (Extended Data Fig.6i). Knockdown of METTL3 in patient-derived Mϕ eliminated the enrichment of m6A-modified CD155 mRNA (Fig.5j, Extended Data Fig.6j). Suppressing m6A generation by either using the m6A inhibitor 3-DAA or by knocking down METTL3, effectively accelerated the decay of CD155 RNA (Fig.5k). These data identified METTL3 as a regulator of CD155 mRNA stability and implicated m6A RNA methylation in determining the antigen-presenting capacity of Mϕ.
METTL3 controls anti-viral T cell responses
Association of the METTL3hi CD155hi phenotype in CAD Mϕ with impaired anti-SARS-CoV2 T cell responses raised the question whether METTL3 ultimately controls the intensity and intactness of adaptive anti-viral immunity. Correlative studies indicated that the amount of METTL3 protein on Mϕ negatively correlated with the release of anti-viral IFN-γ in each patient tested (Fig.6a). To examine the role of METTL3-dependent m6A in regulating the antigen-presenting function of Mϕ, we quantified the induction of anti-viral-reactive T cells before and after METTL3 knockdown. Reducing the concentration of METTL3 mRNA by 50% in healthy Mϕ had no impact on the expansion of both SARS-CoV2 and EBV responsive T cells (Extended Data Fig.7a–7d) in the in vitro antigen presentation assay. In contrast, transfection of CAD Mϕ with METTL3 siRNA profoundly changed the ability of these Mϕ to present viral proteins and stimulate T cells (Fig.6b–6e). METTL3 knockdown disrupted the immunoinhibitory function of CAD Mϕ and increased both the production of IFN-γ (Fig.6b–6c) and the frequency of CD40L+CD69+ CD4+ T cells (Fig.6d–6e) in cultures primed with both viral antigens. Treatment of antigen-presenting Mϕ with the M6A inhibitor 3-DAA normalized antigen responsiveness and IFN-γ release of patient-derived T cells (Fig.6f–6i) but did not make a difference in control cells (Extended Data Fig.7e–7h). The beneficial effects of inhibiting the methyltransferase activity of METTL3 were maintained in vivo. Suppression of m6A modification in Mϕ through METTL3 knockdown prior to their adoptive transfer restored the induction of antigen-driven T cell responses indicated by the expansion of CD4+CD38+ T cells in the spleens of antigen-immunized NSG mice (Fig.6j). Taken together, these data indicate that excess methylation of CD155 mRNA due to inappropriate expression of the methyltransferase METTL3 weakens the induction of antigen-specific T cells and undermines host protective immune responses against viral antigens.
Fig.6.
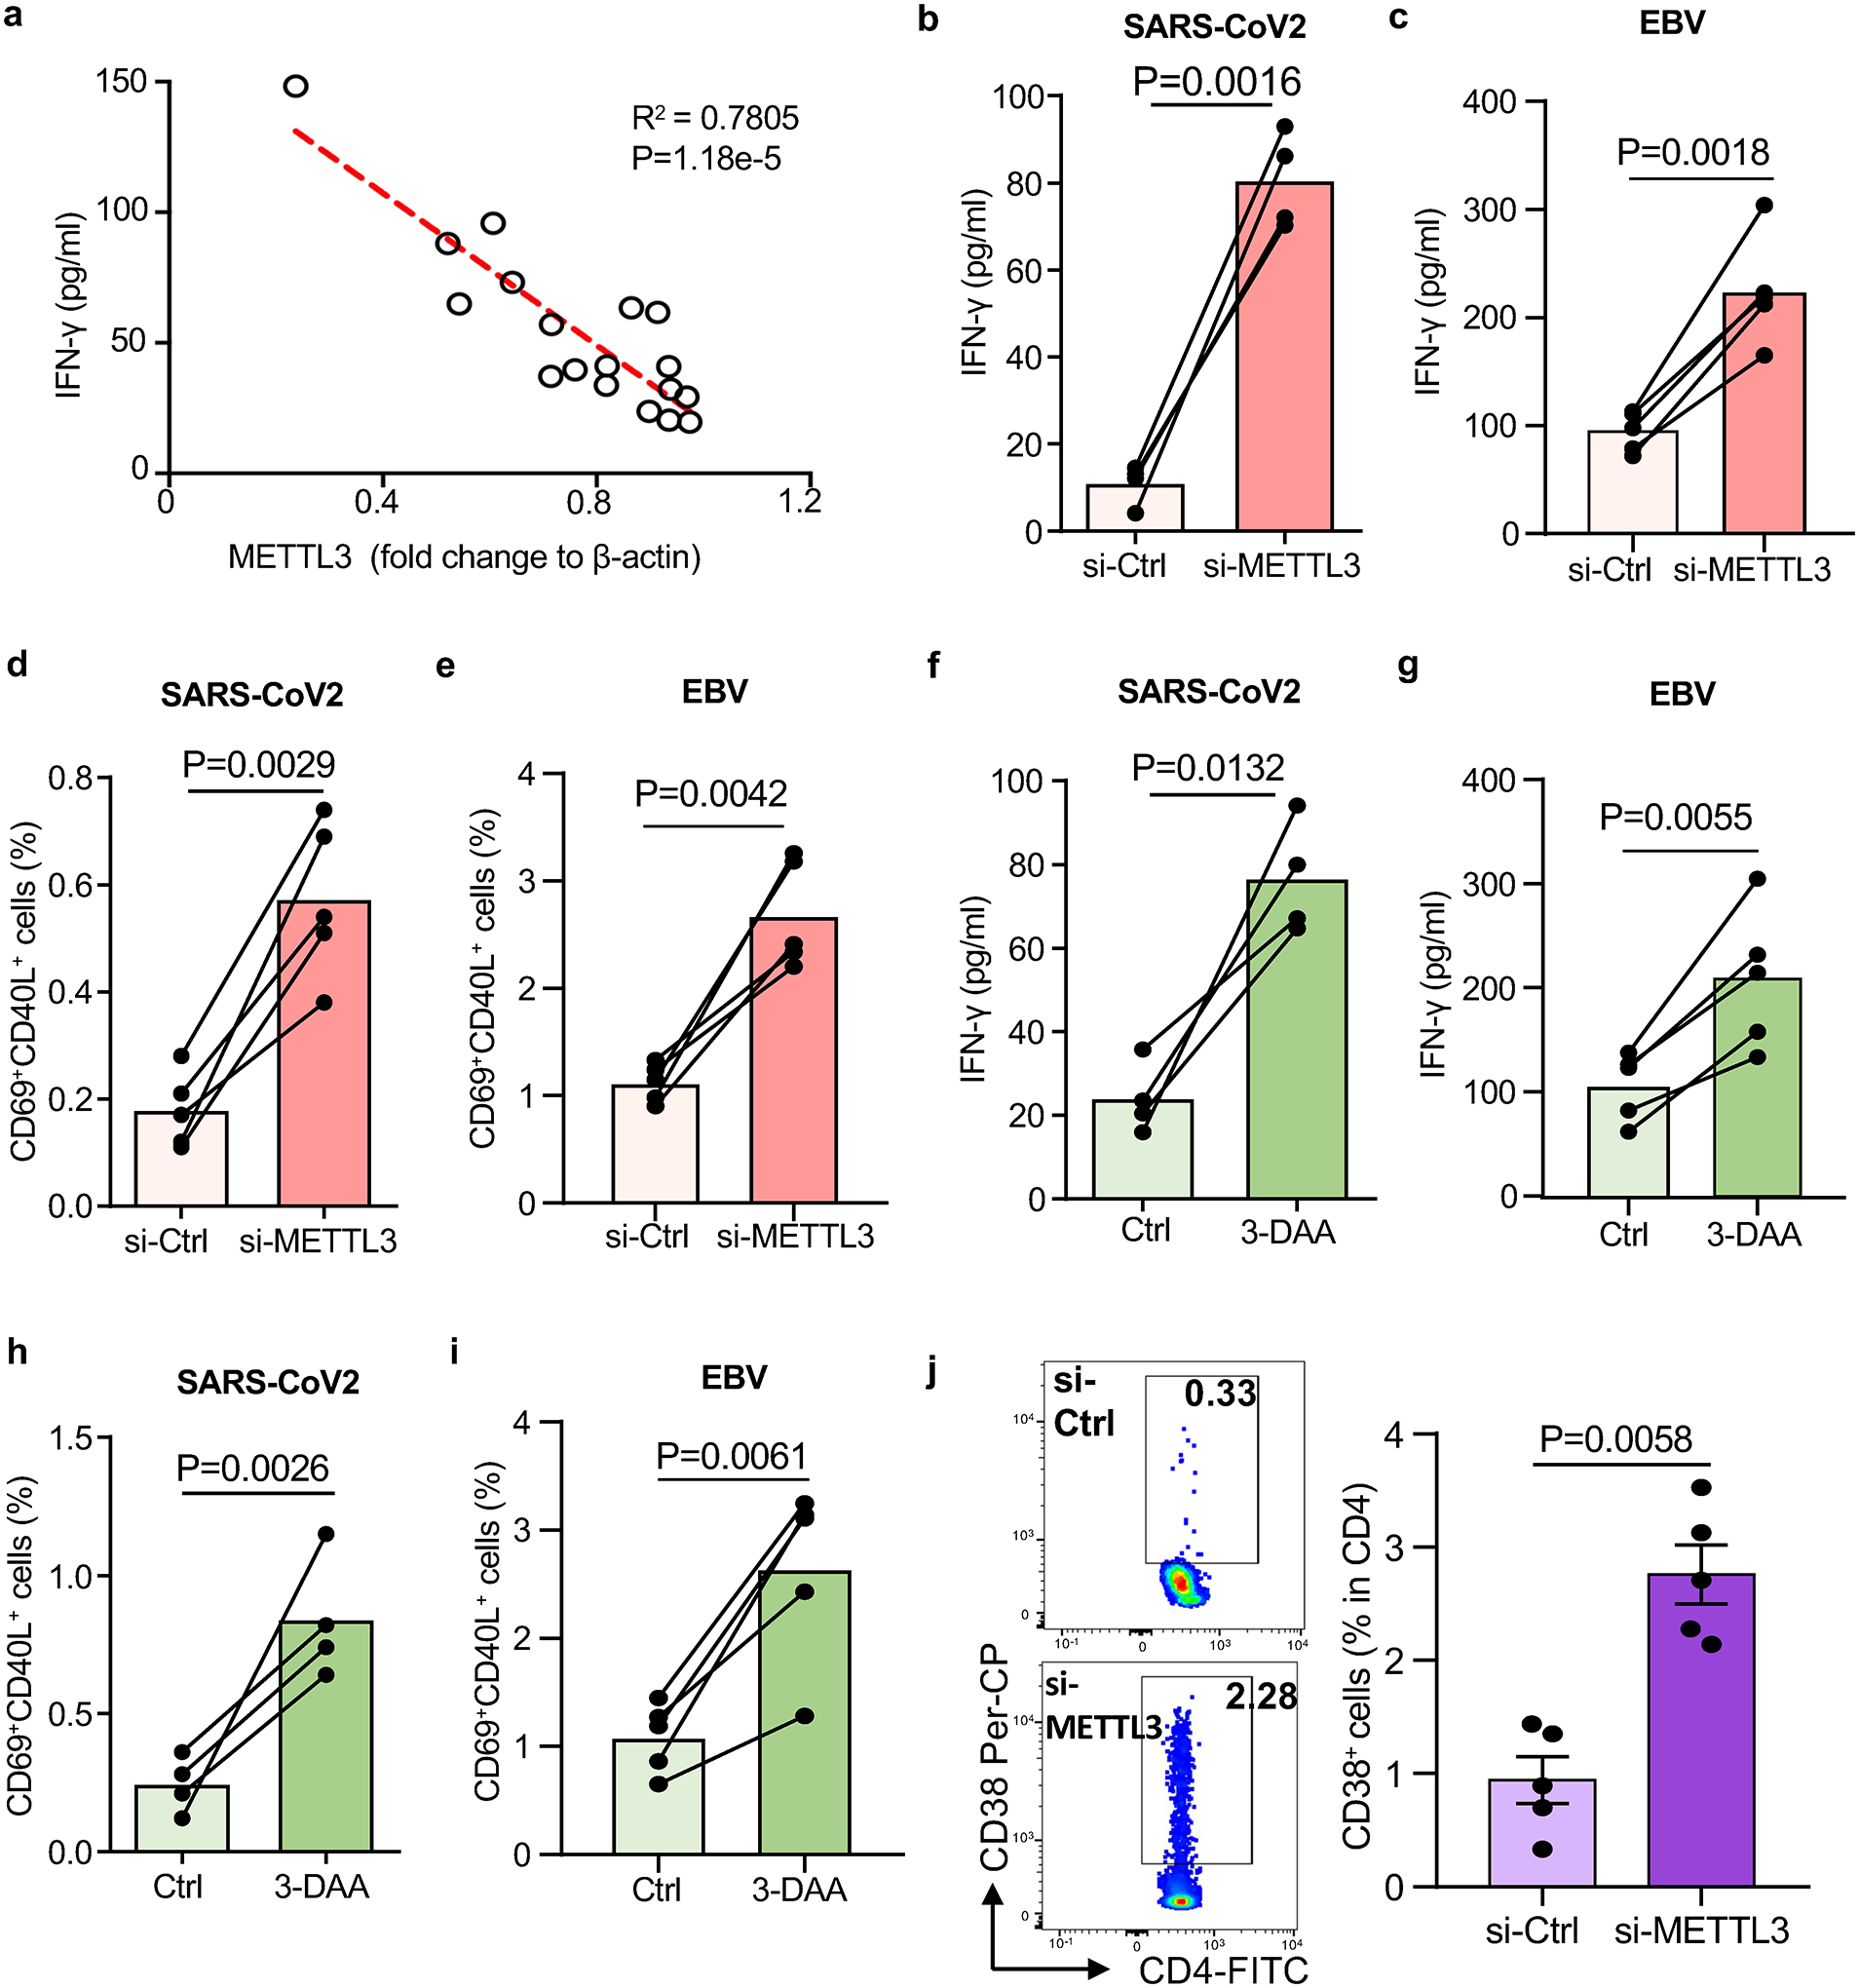
Suppressing N6-Adenosine modification of CD155 mRNA restores antiviral T cell responses.
a. SARS-CoV-2 antigen-induced T cell responses were analyzed as described in Fig.1. Correlation of antigen-induced IFN-γ released by T cells and the protein level of METTL3 in Mϕ from n=18 CAD patients.
b-e. METTL3 was knocked down in Mϕ by si-RNA technology before examining their ability to induce T cell responses. IFN-γ release in response to SARS-CoV2 antigen (b) and EBV antigen (c) stimulation was measured in 4–5 experiments. Frequencies of SARS-CoV2-specific CD69+ CD40L+ CD4+ T cells (d) and EBV-specific CD69+ CD40L+ CD4+ T cells (e) was measured in 5 experiments.
f-i. CAD Mϕ were treated with the m6A inhibitor 3-deazaadenosine (3-DAA) or vehicle. IFN-γ release in response to SARS-CoV2 (f, n=4) and EBV antigen (g, n=5) stimulation was quantified. Frequencies of SARS-CoV2-specific (h, n=4) and EBV-specific CD69+ CD40L+ CD4+ T cells (i, n=5) measured by flow cytometry.
j. To analyze the role of N6-adenosine-methyltransferase in antiviral T cell responses in vivo, METTL3 was knocked down in CAD Mϕ prior to their transfer into NSG mice. Chimeras were immunized with SARS-CoV-2 antigen and CD4+ CD38+ T cells were identified in the spleen. n=5 experiments.
Individual data points are presented. Data are mean ± SEM. Comparisons by one-way ANOVA. Correlation was analyzed by linear regression. P-values are shown in each panel.
LDL induces the METTL3hiCD155hi phenotype in CAD monocytes
The METTL3hiCD155hi phenotype is shared by ex vivo differentiated Mϕ and tissue residing Mϕ in the atherosclerotic plaque. To explore how and when end-differentiated Mϕ are reprogrammed to overexpress METTL3, we examined bone-marrow derived circulating CD14+ monocytes. Transcriptomic and flow cytometric analysis confirmed the CD155hi phenotype in CD14+ CAD monocytes (Extended Data Fig.8a–8c). Also, CD14+ monocytes shared with Mϕ the METTL3hi phenotype and immunoblotting demonstrated 2-fold higher amounts of METTL3 protein in patient-derived cells (Extended Data Fig.8d–8e). We determined CD155 mRNA stability through an actinomycin D-dependent RNA decay assay (Extended Data Fig.8f). The CD155 mRNA half-life was significantly longer in CAD monocytes versus healthy controls. Quantification of m6A-modified CD155 mRNA by m6A RNA immunoprecipitation (Me-RIP) assay demonstrated significant enrichment of CD155 mRNA bound by the capture antibodies in patient-derived cells (Extended Data Fig.8g). These results confirmed persistence of the reprogramming process from precursor cells to mature Mϕ and guided the search for METTL3 inducers to the bone marrow environment.
In the first series of experiments, we explored whether serum lipids can induce CAD monocytes to acquire the METTL3hi CD155hi phenotype, similar to the process in which bone marrow myeloid cells undergo epigenetic and functional changes that enhance immune activation upon re-exposure43. To mimic physiologic conditions, healthy monocytes were cultured in plasma samples with varying concentrations of LDL, HDL, and triglycerides (TG). The priming effect was assessed by quantifying METTLE3 and CD155 mRNA transcripts after 48 hr. Correlative analysis between LDL and TG levels and transcript expression for METTL3 and CD155 pointed towards LDL as a possible “primer”, whereas plasma high in TG failed to affect METTLE3 and CD155 mRNA pools (Fig.7a–7d). In subsequent experiments, we utilized individual stimuli known to function as potent monocyte activators. Two stimuli effectively transformed healthy monocytes into METTL3hi CD155hi cells (Fig.7e–7f). Exposure to LDL and oxidized LDL was sufficient to induce high abundance of both METTL3 and CD155 transcripts. There was a trend for LPS to function as an inducer of the two mRNAs, but all other stimuli were ineffective (Fig.7e–7f).
Fig. 7. Induction of CD155 and METTL3 mRNA expression in monocytes.
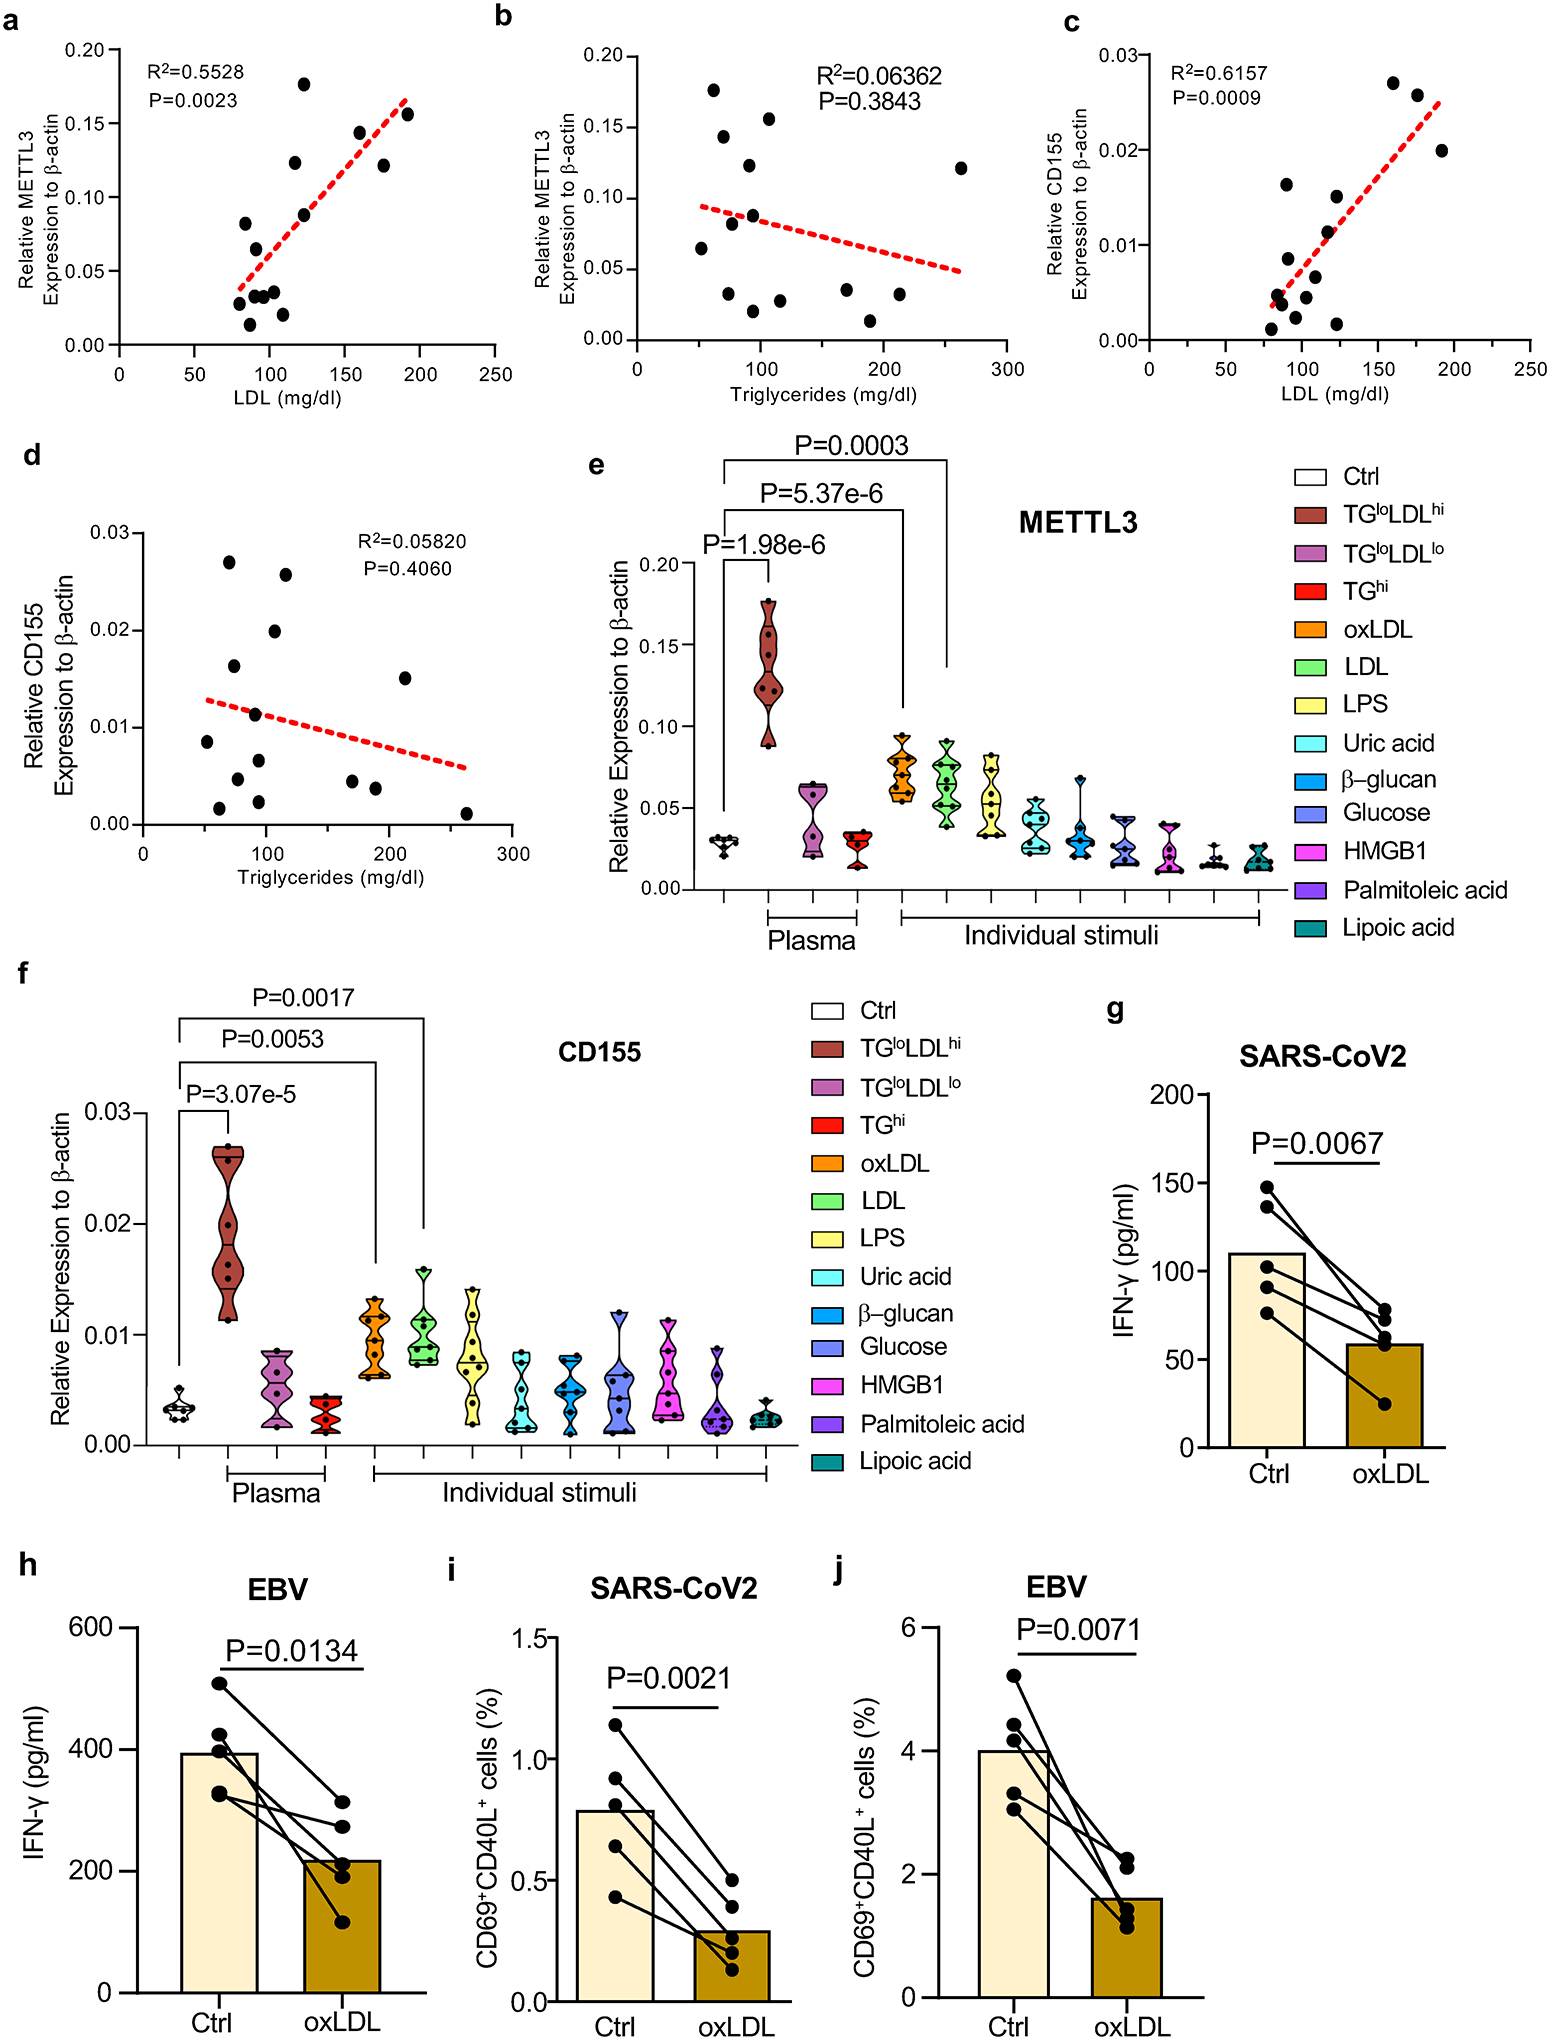
a-d. CD14+ monocytes were isolated from healthy individuals and cultured in human plasma (10%) for 48 hrs. Transcripts specific for METTL3 (a-b) and CD155 (c-d) were quantified by RT-PCR. Expression levels of METTL3 and CD155 mRNA were correlated with LDL (a, c) and triglycerides (b, d) concentrations in 14 different plasma samples.
e-f. CD14+ monocytes were isolated from healthy individuals and primed with the indicated stimuli for 48 hr. METTL3 and CD155 mRNA levels were quantified by RT-PCR. Results are given as violin blots.
g-j. Mϕ from healthy individuals were treated with oxLDL for two days, then loaded with antigen and mixed with T cells to measure induction of antigen-specific T cell immunity. IFN-γ release in response to SARS-CoV2 antigen (g) and EBV antigen (h) was quantified in 5 experiments. Frequencies of SARS-CoV2 -specific CD69+ CD40L+ CD4+ T cells (i) and EBV-specific CD69+ CD40L+ CD4+ T cells (j) were measured in 5 experiments.
Individual data points are displayed. Data shown as mean ± SEM. Comparison by one-way ANOVA (e, f) and paired t-test (g-j). Correlations analyzed by linear regression. P-values indicated in each panel.
To investigate whether oxLDL regulates the ability of Mϕ to present viral antigens, we treated healthy Mϕ with oxLDL for two days before loading them with viral antigens. T cell reactivity to control and oxLDL-pretreated antigen-presenting cells was assessed through IFN-γ production (Fig.7g–7h) and mobilization of CD69+CD40L+ T cells (Fig.7i–7j). oxLDL pretreatment was sufficient to suppress T cell responses to both, the SARS-CoV2 and the EBV antigen
In summary, the reprogramming of CAD Mϕ begins early in their life cycle by affecting their precursor cells. A well-known metabolic abnormality in CAD, the increase in LDL and oxidized LDL, appears to have marked functional impact on antigen-presenting cells by altering mRNA methylation.
Discussion
Coronary artery disease is independently associated with an increased risk of in-hospital death amongst individuals infected with SARS-CoV2, but mechanisms underlying the inability of CAD patients to mount protective immune responses are poorly understood. By probing the competence of CAD patients to mobilize T cell immunity against Spike and nucleocapsid antigens, we have defined a defect in antigen-presentation caused by inappropriate expression of the co-inhibitory ligand CD155. CD155hi CAD Mϕ engaged CD4+ CD96+ and CD4+ TIGIT+ memory T cells, delivering an inhibitory signal that essentially disrupted the clonal expansion of antigen-reactive CD4+ T cells. Proliferative inhibition of anti-viral CD4+ T cells extended to the release of IFN-γ, a key protective factor in anti-viral immunity. We have defined the mechanisms underlying the functional reprogramming of CAD macrophages, rendering the defect druggable. Specifically, inappropriate expression of the methyltransferase METTL3 equipped CAD Mϕ to accumulate N6-adenosine-modified and stabilized CD155 mRNA, translating into a CD155hi phenotype (Fig.8). Abnormal CD155 mRNA methylation was already present in Mϕ precursor cells and persisted in tissue-infiltrating Mϕ populating the atherosclerotic lesion. Oxidized LDL and LPS functioned as potent inducers of METTL3, linking the metabolic abnormalities of CAD to epigenetic interference resulting in impaired antigen-presenting function and T cell hyporesponsiveness. The inability to generate protective immunity against Spike protein extended to the EBV glycoprotein 350, identifying the underlying mechanisms as a fixed signature in the patients’ immune system. Our data delineate a possible immunotherapy for CAD patients to strengthen anti-viral immunity and protect these patients from chronic infection, morbidity, and mortality.
Fig.8. Immunosuppressive macrophages in coronary artery disease.
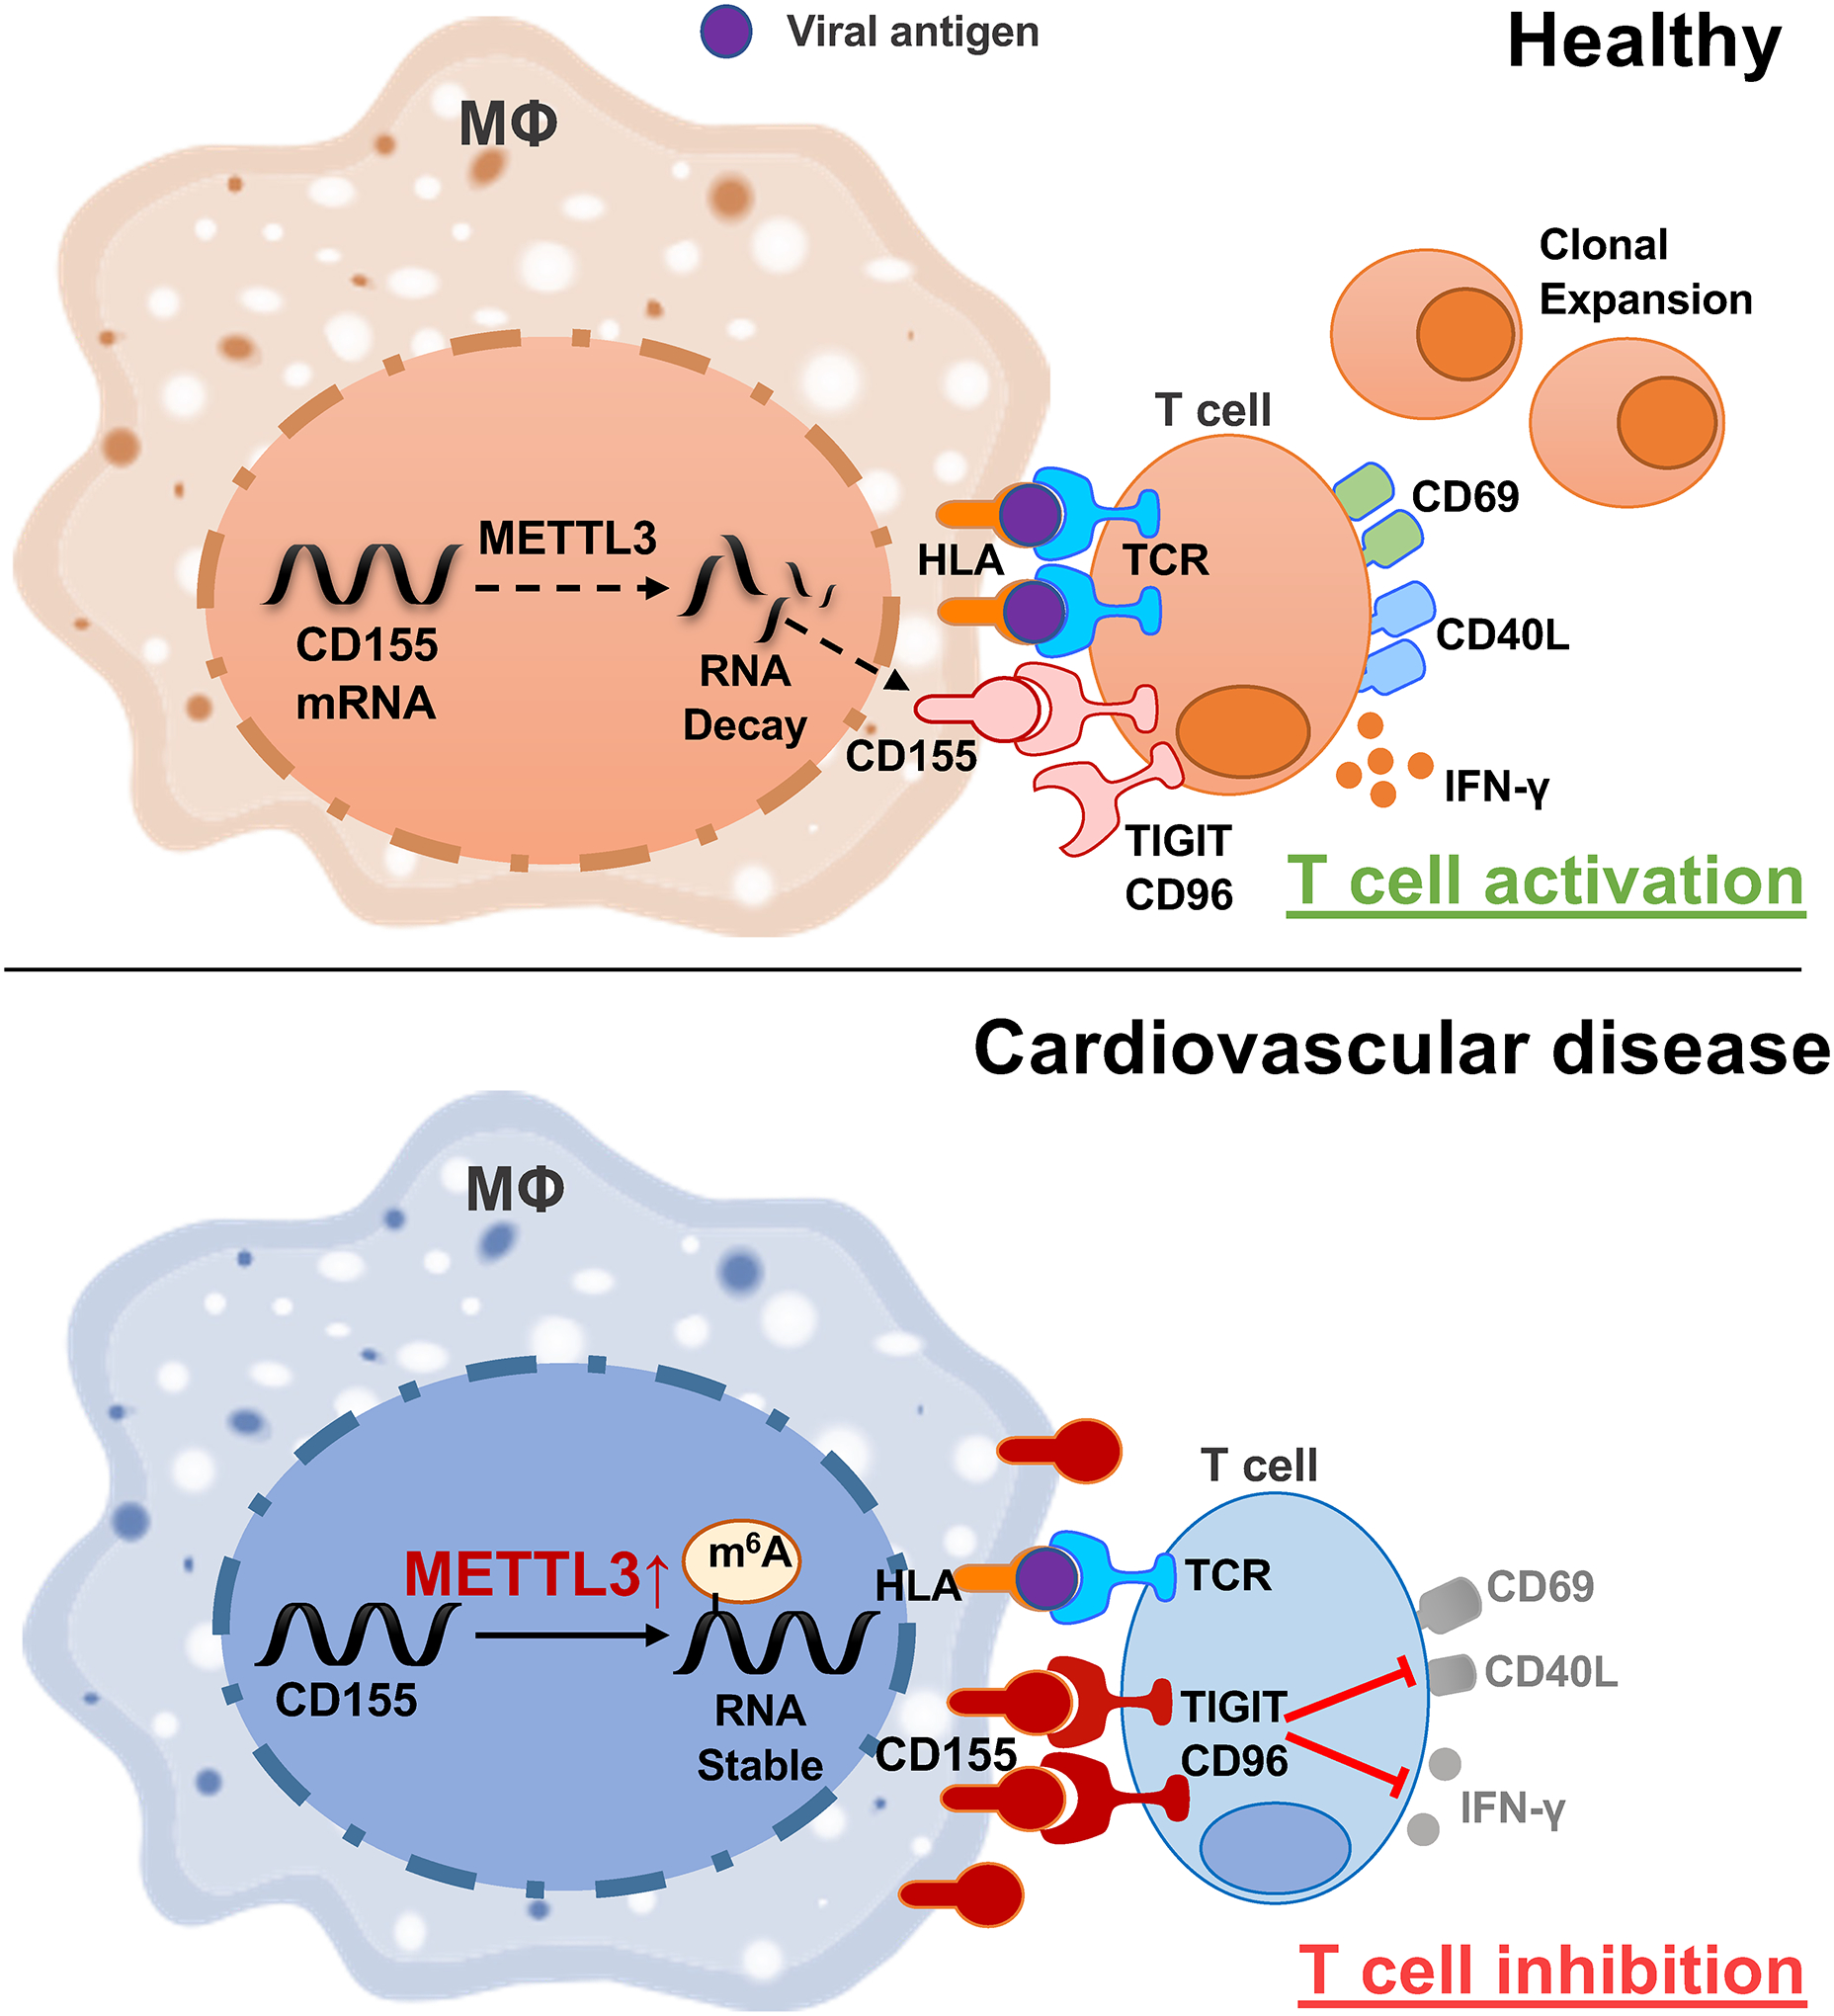
Upper panel: In healthy Mϕ, the methyltransferase METTL3 is expressed at a low level, CD155 mRNA is relatively unstable and Mϕ presenting viral antigens stimulate antigen-specific T cells that differentiate into memory and effector T cells.
Lower panel: High expression of the methyltransferase METTL3 increases m6A modifications on CD155 mRNA, which stabilizes the transcripts and results in high surface expression of CD155 protein. CD155 transmits a “stop signal” to T cells that express the CD155 receptors TIGIT or CD96, effectively suppressing anti-viral immunity.
Besides their role as antigen-presenting cells, Mϕ function as critical effector cells in the atherosclerotic plaque where they are the prime cellular partner of tissue-infiltrating T cells11 and hold a key position as inflammatory amplifiers. The effector portfolio of increased inflammatory potential combined with suppressed antigen-presenting function appears to be specific for CAD Mϕ44. Specifically, Mϕ from CAD patients differ from those in autoimmune vasculitis by enhanced production of chemokines (CXCL10) and cytokines (IL-6), excluding host inflammation as the underlying cause of Mϕ reprogramming. Prior studies have implicated bioenergetic regulation in rendering CAD Mϕ pro-inflammatory. Specifically, glucose and pyruvate have been described as drivers of excessive chemokine and cytokine production27,44, with mitochondrial ROS inducing posttranslational modifications of the glycolytic enzyme PKM2 and nuclear transition of “moonlighting” PKM2 to drive the cytokine hyperproducing state of CAD Mϕ27. Glucose had no role in turning CAD monocytes and Mϕ into METTL3 and CD155 high expressors, outlining several co-existent metabolic pathways modulating Mϕ function in cardiovascular disease.
Current data have emphasized the critical position of antigen-presenting Mϕ in enabling expansion of Spike-protein and EBV glycoprotein 350 reactive CD4+ T cells. Such T cells are a condition sine qua non to render the host immune against SARS-CoV2 and EBV infection9,45. CD4+ helper T cells are irreplaceable in supporting B cells to produce high affinity, neutralizing antibodies46. Profiling of co-stimulatory and co-inhibitory ligands expressed by CAD Mϕ revealed differences exclusively for molecules delivering a negative signal and included both, PD-L1 and CD155. PD-L1 is well established as a regulator of anti-tumor T cells and is successfully targeted in immune checkpoint inhibitor therapy of cancer patients to unleash anti-tumor immunity47. Blockade of CD155 is currently explored as an alternative strategy to enhance T cell responses against tumor antigens48. The combined upregulation of PD-L1 and CD155 on CAD Mϕ amplifies the immunosuppressive functions of these cells and remains unopposed by co-stimulatory ligands, such as CD80, CD86 and CD40. PD-L1 and CD155 share the impact on anti-viral T cell responses. As previously described for the inhibitory effect of CAD Mϕ on the expansion of T cells specific for varicella zoster virus14, current data extend the defect in the induction of anti-viral T cells to SARS-CoV2 and EBV. It is likely that this Mϕ-dependent immunodeficiency of CAD patients has relevance for other antigens, as IFN-γ production was effectively suppressed in all immune responses tested. However, upstream signals leading to aberrant PD-L1 and CD155 expression appear to be different. While the glycolytic breakdown product pyruvate effectively controls upregulation of PD-L1 transcription, CD155 mRNA was selectively induced by oxidized LDL and LPS. Thus, both ligands are differentially regulated by the cell’s metabolic microenvironment.
While the PD-L1hi phenotype of CAD Mϕ resulted from excess transcriptional activity, higher CD155 expression on the Mϕ surface was a consequence of altered mRNA stability. Patient’s cells accumulated N6-methyladenosine(m6A)-rich CD155 mRNA, pointing towards an epitranscriptomic mechanism determining Mϕ function. Formation of m6A in mRNA is now recognized as a potent modification to control gene expression in cellular differentiation and in cancer biology41. Remarkably, screening of healthy and CD155hi CAD Mϕ for m6A readers, m6A writer-complex components and erasers revealed a selective upregulation of METTL3 in the CAD patients’ cells. METTL3 is the methyltransferase that reversibly modifies mRNA to shape the epitransciptomic landscape49 and regulate complex processes such as RNA nuclear export, translation efficiency and polyadenylation18. M6A modification has been described to play a role in the initiation and progression of human cancers, but there is limited information on METTL3’s contribution to cellular function of non-malignant cells. The methyltransferase promotes proliferation and fibroblast-to-myofibroblast transition in cardiac remodeling50 and mediates endothelial activation in response to oscillatory stress51. In murine macrophages, METTL3-induced methylation stabilizes STAT1 mRNA, which serves as a master regulator of M1 polarization, identifying the enzyme as a pro-inflammatory regulator25. Opposite to human Mϕ, mouse dendritic cells seem to rely on METTL3-mediated mRNA m6A methylation for enhanced expression of the co-stimulatory ligands CD40 and CD80, rendering them more effective antigen-presenting cells26. Notably, Mϕ from CAD patients responded to changes in their metabolic environment, e.g. elevation of oxLDL, to reprogram their functional activities, classifying the high expression of METTL3 as a maladaptive mechanism.
The functional adaptation of Mϕ in CAD patients is best captured by a combination of excess inflammatory activity with a defect in APC function. Hybrid Mϕ with strong pro-inflammatory capabilities and lacking proficiency in host protection deviate the immune system of CAD patients, producing inappropriate cytokine release while compromising T-cell stimulation. This dilemma has relevance during SARS-CoV2 infection, known to produce a deleterious cytokine storm while attempting to develop protective immunity. The reprogramming of CAD Mϕ amplifies the negative effects of pro-inflammatory commitment and the lack of appropriate T-cell stimulatory capacity. The molecular mechanisms described here offer opportunities to reeducate CAD Mϕ to rescue their quintessential contribution to host protection. Reducing exposure of monocytes to oxLDL could provide a preventive measure. More promising would be to directly manipulate the inappropriate activity of METTL3, to reduce the burden of m6A modification. Two interventions proved beneficial in enhancing anti-viral T cell reactivity: knockdown of METTL3 and treatment with the m6A inhibitor 3-DAA. Improved expansion of anti-viral CD4+ T cells in vivo are encouraging as such strategies of immune engineering could be translated to the patient. Such mechanism-oriented immune interventions could be valuable during both vaccination and during the natural viral infection. Alternatively, blocking access to CD155 or CD96/TIGIT could provide an elegant approach to optimize induction of adaptive immunity and improve the outcome of both vaccination and viral infection in high-risk individuals with pre-existing cardiovascular disease.
Methods
Patients
Patients were defined to have coronary artery disease if they had a history of coronary bypass surgery, history of coronary stent placement or documented myocardial infarction. To eliminate inflammatory activity directly related to myocardial ischemia, 87 patients were enrolled that were at least 90 days post event. Detailed clinical features of enrolled patients are displayed in Extended Data Table 1. Healthy controls had no evidence for coronary artery disease as based on evaluation by a physician. Recruitment criteria included: no personal history of cancer, chemotherapy, chronic inflammatory disease, chronic viral infection, or autoimmune disease. Since the patient samples were collected early during the COVID-19 pandemic, only one study subject had recorded COVID-19 infection prior to testing. 93.75% of study subjects carried antibodies against EBV nuclear antigen (EBNA). The Institutional Review Board at Stanford University and at Mayo Clinic reviewed and approved the study protocol. All participants were informed appropriately, written consent documents based on the Declaration of Helsinki were signed by all participants.
Cell culture
Peripheral blood mononuclear cells (PBMC) were purified by density gradient centrifugation with Lymphoprep (STEMCELL technologies) as previously describe27. Memory CD4+ T cells were isolated by negative selection with Easysep human cell isolation kits (STEMCELL Technologies, #19157). Monocytes were isolated as previously reported14. To induce macrophages, monocytes were treated with 20ng/ml of M-CSF (Biolegend) for 5 days in 10% FBS (Lonza) and were differentiated by stimulation with 100ng/ml LPS (Sigma-Aldrich) and 100U/ml IFN-γ (Sino Biologicals) for 24 hours. Mϕ were detached from the culture plates with Accutase® Cell Detachment Solution (Innovative Cell technologies) for 10 min at 37°C. CD155 and METTL3 knock down were performed with Lipofectamine 3000 transfection reagent (Thermo Fisher Scientific) using corresponding 10 nM siRNA (Santa Cruz Biotechnology).
In vitro Antigen Presentation Assay
PBMC (2×10⁶) were primed with viral antigens (1ug/ml SARS-CoV-2 spike protein, 1ug/ml SARS-CoV-2 nucleocapsid protein, 1ug/ml EBV Glycoprotein gp350) in RPMI 1640 medium supplemented with 10% FBS for 5 days. For recall responses, antigen-stimulated PMBC were washed on Day 5 and kept in antigen-free medium for 24 hours to remove the antigens. On Day 6, primed PBMC were mixed with syngeneic macrophages (2×10⁵) that had been loaded with antigen by overnight culture. Six hours later, T cell activation was measured by flow cytometry staining for the surface receptors CD69 and CD40L. IFN-γ production in the supernatant was quantified with the IFN-γ High Sensitivity Human ELISA Kit assay system (abcam). Supernatants were collected after 24 hrs of antigen rechallenge. Naïve and memory CD4+ T cells were isolated by negative selection with EasySep™ Human Naïve CD4+ T Cell Isolation Kit II (STEMCELL Technologies, #17555) and EasySep™ Human Memory CD4+ T Cell Enrichment Kit (STEMCELL Technologies, #19157) repectively.
Monocyte priming
CD14+ monocytes were isolated from PMBC of healthy individuals with EasySep™ Human Monocyte Isolation Kit (STEMCELL Technologies, #19359). Monocytes were cultured in medium supplemented with 10% plasma from human donors with known concentrations of triglycerides, low-density and high-density lipoproteins (LDL, HDL). Detailed lipid profiles are given in Extended Data Table 2. Plasma samples were categorized in triglyceride (TG) high; TG low, LDL low; TG low, LDL high. In parallel, monocytes were treated with ox-LDL (50μg/ml), LDL (100μg/ml), uric acid (10mM), β-glucan(1μM), glucose (50mM), HMGB-1 (100ng/ml), palmitic acid (0.5mM) and lipoic acid (1mM), respectively. After 48 hours, METTL3 and CD155 mRNAs were quantified by RT-PCR.
Flow cytometry
Cell surface staining was performed as previously described28 Data were collected using a BD LSR Fortessa flow cytometer or a CYTEK NL-3000 and analyzed by FlowJo 10.0 (Tree Star Inc.). The following antibodies were used for staining: Brilliant Violet 785™ anti-human CD154 (Biolgend 310842,1:100), Brilliant Violet 510™ anti-human CD69 Antibody (Biolgend 310936,1:100), Brilliant Violet 421™ anti-human CD3 Antibody (Biolgend 344834,1:100), PE/Cyanine7 anti-human CD4 Antibody (Biolgend 34357410,1:100), Brilliant Violet 650™ anti-human CD8 Antibody (Biolgend 344730,1:100), APC/Cyanine7 anti-human CD45RA Antibody (Biolgend 304128,1:100), FITC anti-human CD45RO Antibody (Biolgend 304242,1:100), PerCP/Cyanine5.5 anti-human CD38 Antibody (Biolgend 356614,1:100), Brilliant Violet 711™ anti-human CD163 Antibody (Biolgend 333630,1:100), PE/Cyanine7 anti-human CD45 Antibody (Biolgend 368532,1:100), Brilliant Violet 711™ anti-human CD4 Antibody (Biolgend 317439,1:100), Pacific Blue™ anti-human HLA-DR Antibody (Biolgend 307624,1:100), APC anti-human CD206 (MMR) Antibody (Biolgend 321110,1:100), PE anti-human CD155 (PVR) Antibody(Biolgend 337610,1:100). Detailed information of all antibodies used are listed in Supplementary Table 2.
RNA extraction and RT-PCR
Direct-zol RNA MiniPrep kits were supplied by Genesee Scientific to extract total RNA from the samples. cDNA reverse transcription was performed with cDNA with High-Capacity cDNA Reverse Transcription Kits (Thermo Fisher Scientific). SYBR Green qPCR Master Mix (Bimake) was used for Quantitative RT-PCR. Samples were analyzed with a RealPlex2 Mastercycler (Eppendorf). Gene relative expression levels were normalized to the expression of β-actin transcripts. Primers for RT-PCR are listed in Supplementary Table 3.
Immunofluorescence and confocal microscopy
The methods used for dual-color immunostaining have previously been described29. Cells were fixed with 4% paraformaldehyde solution (Affymetrix) in glass bottom tissue culture plates, incubated with primary antibody at 4 °C overnight, followed by fluorescence conjugated secondary antibody at room temperature for 2 hr. For tissue staining, atherosclerotic plaques were cut into 4μm thick sections and permeabilized with 0.5% Triton-X-100 in PBS for 20 min. Tissue sections were incubated with primary antibodies for overnight at 4 °C and secondary antibodies for 1 hour at 37°C. Nuclei were labeled with DAPI (Santa Cruz Biotechnology) for 10 mins at room temperature. Images were analyzed using the Olympus fluorescence microscopy system (Olympus, Tokyo, Japan) or the All-in-One Fluorescence Microscope BZX800E system (Keyence, Kyoto, Japan). Following antibodies were used: CD155 Monoclonal Antibody (Thermo Fisher Scientific, MA5–13493,1:200), CD68 Monoclonal Antibody (Thermo Fisher Scientific,MA5–13324,1:200), METTL3 (E3F2A) Rabbit mAb (Cell Signaling Technology 86132S,1:200), Goat anti-rabbit IgG (H+L), Alexa Fluor 488 (Thermo Fisher Scientific, A-11008,1:200) and Goat anti-mouse IgG (H+L), Alexa Fluor 594 (Thermo Fisher Scientific, A-31635,1:200). Detailed information of all antibodies used are listed in Supplementary Table 2.
Western blotting
Techniques applied for immunoblotting have previously been reported29. Basically, cells were harvested and lysed with RIPA buffer (Abcam) supplemented with proteinase inhibitor (Thermo Fisher Scientific). Proteins were electrophoresed in 4–15% SDS-PAGE (Bio-Rad, 4561083) and transferred to PVDF membranes (Bio-Rad, 1620177). After 1 hour blocking in 2% BSA, membranes were incubated with primary antibodies METTL3 (E3F2A) Rabbit mAb (Cell Signaling Technology 86132S,1:500) at 4 °C for overnight and secondary antibodies Anti rabbit IgG, HRP linked Antibody (Cell Signaling Technology 7074S,1:10000) at room temperature for 1 hr. Antibody binding was detected by SuperSignal West Femto Maximum Sensitivity Substrate (Thermo Fisher Scientific 34094).
RNA decay assays
To measure RNA stability, the transcription inhibitor Actinomycin D was added to the culture at the dose of 10 μg/ml. Samples were harvested at 0, 2, 4 and 8 hour time points. RNA and cDNA were prepared as described above and remaining transcripts were quantified with QRT-PCR.
m6A RNA enrichment (Me-RIP)
Me-RIP assays were performed using EpiQuik™ CUT&RUN m6A RNA Enrichment kits (EpiGentek, P-9018). In brief, 10 μg total RNA were incubated with a beads-bound m6A capture antibody and isotype IgG antibody, respectively for 90 min at room temperature. The enriched RNA fragments were released and purified with RNA binding beads. Eluted mRNA was reverse transcribed into cDNA and quantified with QRT-PCR.
In vivo Antigen Presentation Assay
NSG mice were obtained from the Jackson Laboratory and maintained in specific pathogen-free conditions at 20–22 °C and at a 12:12 h light:dark cycle. All mice had free access to water and food. NSG mice were immuno-reconstituted by adoptive transfer of 1×10⁷ PBMC as previously described30,31. Syngeneic monocytes were differentiated into Mϕ (1×10⁶) and loaded with SARS-CoV-2 protein (1μg/ml) for 24 hours prior to injection into the mice. Reconstituted mice were primed with SARS-CoV-2 protein (10μg) or vehicle intraperitoneally. After 7 days, the spleen was harvested, and activated human T cells were evaluated by surface staining with fluorescence-conjugated anti-human CD45, CD3, CD4 and CD38 antibodies. All experiments were approved and performed in accordance with the guidelines of the Institutional Animal Care and Use Committee.
Cell survival quantification
Three different approaches were used to measure the survival of Mϕ30. Live/dead staining was performed with the LIVE/DEAD™ Cell Imaging (488/570) (Thermo Fisher Scientific). The release of Lactate Dehydrogenase (LDH) by dead cells was evaluated with the Pierce LDH Cytotoxicity Assay (Thermo Fisher Scientific) in the culture supernatant of Mϕ. Relative cell viability was quantified with the AlamarBlue Cell Viability Reagent (Thermo Fisher Scientific). All assays were performed following the manufacturers’ instructions.
Prediction of m6A DRACH sites
The full length CD155 cDNA sequence was analyzed with the open access m6A prediction server SRAMP32, 12 DRACH motifs with high confidentiality score were identified. By analyzing a Me-RIP database from the human myeloid cell lines monomac-6 cell line (GSE76414)33 and Nomo-1 (GSE87190)34, 10 m6A peaks were found; most peaks were localized in two regions of the 3’-UTR of CD155 mRNA. We then mapped the predicted sites and peaks back to CD155 mRNA, yielding 6 potential DRACH sites.
RT-PCR based quantification of m6A
For site-specific detection and quantification of m6A sites, we applied a RT-PCR-based approach35. Retro-transcription of CD155 was performed with two different enzymes: Bstl and MRT, using primers including (RT+) and excluding (RT-) the m6A sites. M6A modification diminishes the retrotranscription capability of BstI enzyme but not MRT enzyme. Differences in retro-transcription between the two enzymes were detected with qPCR and agarose gel electrophoresis. The primer sequences are listed in Supplementary Table 4.
Luciferase reporter assay
The 3’-UTR regions of CD155 with or without mutated m6A sites were cloned downstream of the firefly luciferase translation sequence of the pMIR-REPORT vector (Thermo Fisher). Activation of the luciferase reporter reflects to which degree changes in the 3’-UTR region regulates gene transcription. Recombinant plasmids were transfected into control or CAD Mϕ with Lipofectamine 3000 transfection reagent. A control Renilla luciferase plasmid was used to normalize the transfection efficiency. Luciferase activities were tested with the Dual-Luciferase® Reporter Assay System (Promega). Relative luciferase activity was calculated by dividing the firefly luminescence by the Renilla luminescence.
Statistics
All data analyses applied Prism graphpad 8.0.(GraphPad Software). Normal distribution of all data sets was confirmed. All data are shown as Mean ± SEM, values of P<0.05 were considered statistically significant. Two-tailed student’s t test and paired one-way ANOVA were applied to compare groups. Two-way ANOVA with Bonferroni’s post-test was used to compare data collected over time.
Data Availability
All data generated or analyzed are included in the main article and associated files. Source data are provided with this paper. Potential m6A DRACH sites were predicted with publically available data at GSE76414 and GSE87190.
Extended Data
Extended Data Fig.1. Blunted anti-viral T cell responses in patients with coronary artery disease (CAD).

PBMCs were harvested from coronary artery disease (CAD) patients and healthy controls (CON) and stimulated with a mixture of SARS-CoV2 spike and nucleocapsid proteins (1μg/ml) for 5 days.
a. Gating strategy to detect T cell subpopulations. Cells in the CD4+T gate was corresponded to data in Fig 1c,1e,1g,1i,2h,2i,2l,2m,6d,6e,6h,6i,7i and 7j.
b. IFN-γ production by antigen-stimulated T cells in patients and controls measured over a period of 5 days. n=14.
c. Frequencies of antigen-reactive T cells in the CD4+ and CD8+ subpopulations. Data from 14 controls and 12 patients
d. Comparison of CD4+ and CD8+ T cell frequencies in patients and controls. n=10.
e. Frequencies of naïve CD45RA+ and memory CD45RO+ T cell amongst control and patient derived CD4+ T cells. n=6.
f. Frequencies of antigen-reactive CD4+ T cells within the naïve (CD45RA+) and memory (CD45RO+) population. n=6.
g.-h. T cells were stimulated with SARS-CoV2 spike (g) or nucleocapsid (h) protein. Percentages of CD4+ CD69+ CD40L+ and CD8+ CD69+ CD40L+ T cells were measured by flow cytometry. n=12 for spike, n=10 for nucleocapsid.
Individual data points are displayed. Data are mean ± SEM. Differences were compared with one-way ANOVA. p-value was shown on each panel.
Extended Data Fig.2. In vivo testing of antigen-reactive T cells.
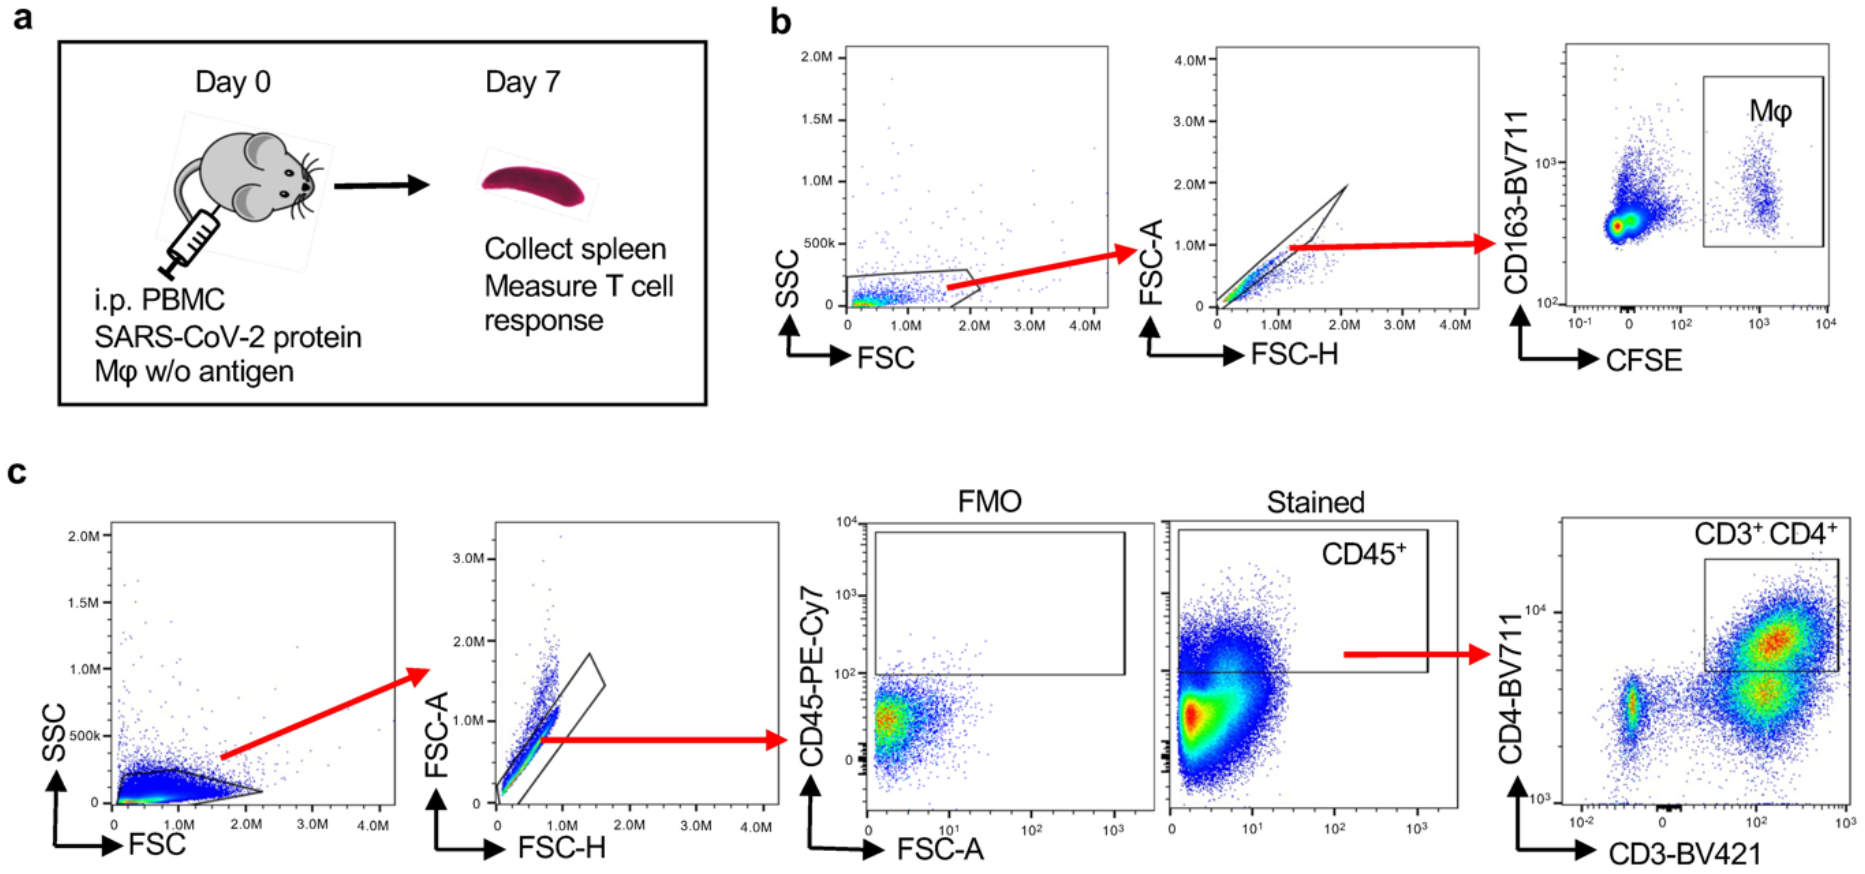
NSG mice were immuno-reconstituted with human PBMC (10 million/mouse) and immunized with SARS-CoV-2 protein (10μg/mouse). In addition, mice received CFSE-labeled autologous Mϕ loaded with SARS-CoV-2 protein. After 7 days, the spleen was harvested and activation markers on human CD3+ CD4+ T cells were analyzed by flow cytometry.
a. Schematic graph for the in vivo model.
b. Flow cytometric detection of CFSE+ CD163+ human macrophages in the spleen.
c. Gating strategy for human T cells in the spleen. Cells in CD3+CD4+ gate corresponded with Fig 1j,2n and 6j.
Extended Data Fig.3. CD155 expression in tissue macrophages and in monocyte-derived macrophages.
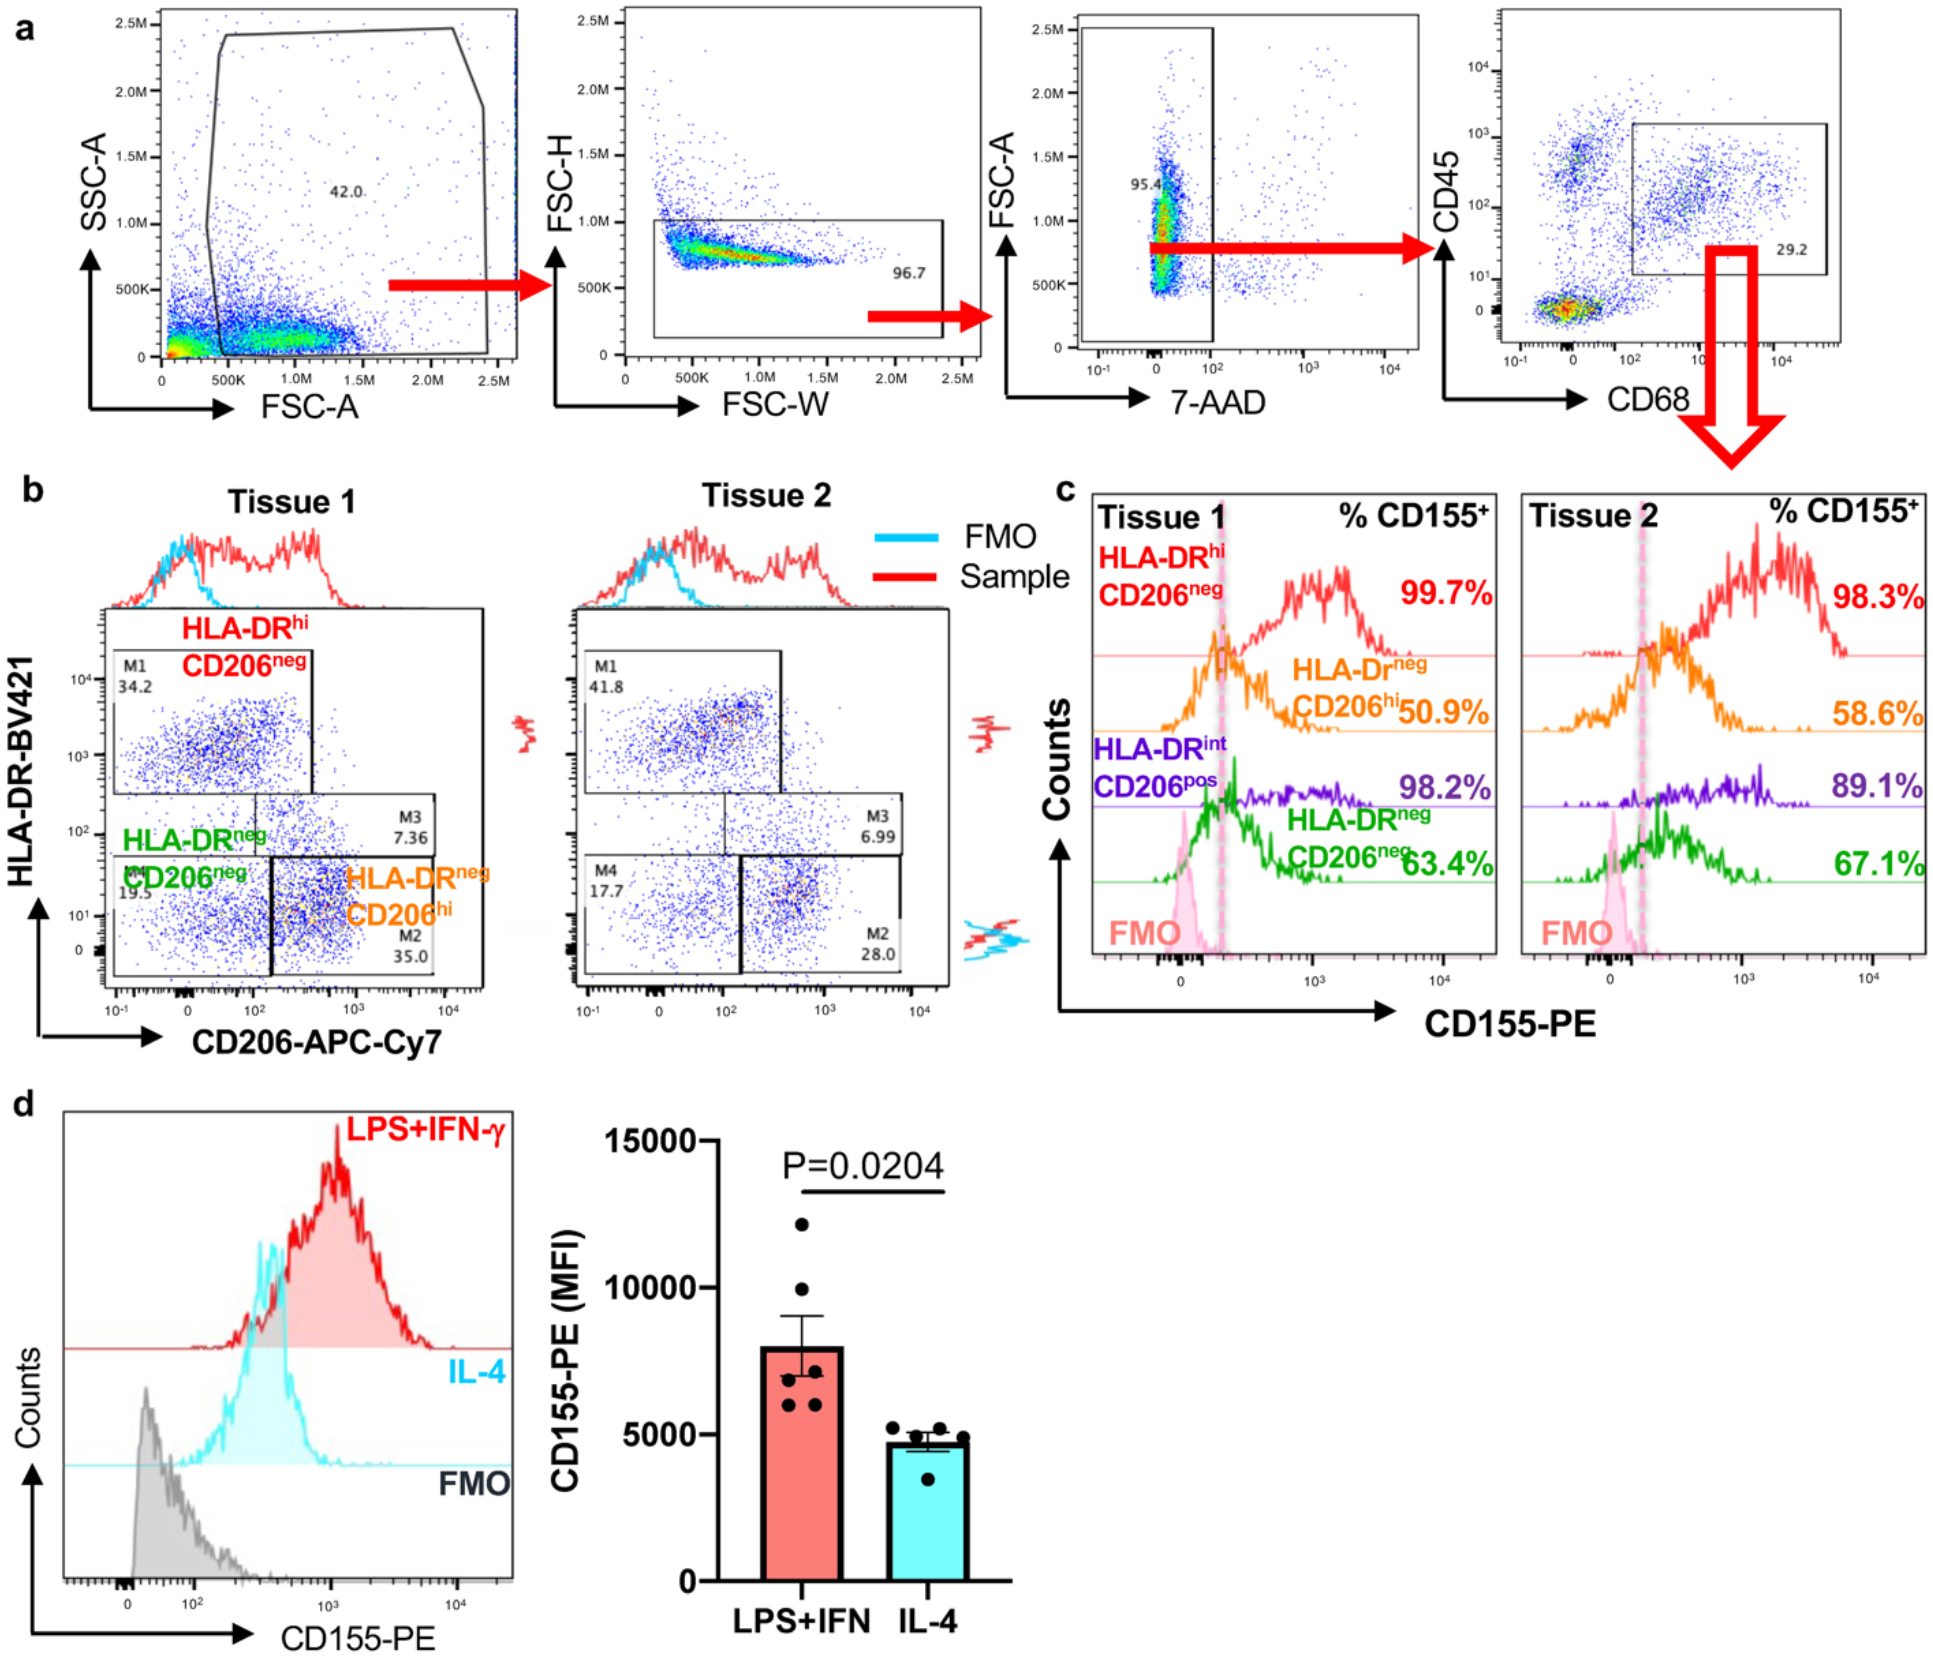
a. Single cell suspensions were generated from human atherosclerotic arteries and analyzed by flow cytometry. Gating strategy to identify CD68+ macrophages. Corresponded to panels b, c, and Extended data Fig 1.
b. Representative plot graphs from 2 tissues defining co-expression of CD206 and HLA-DR.
c. Surface expression of CD155 on different tissue macrophage clusters. Data from two tissues are shown.
d. Monocyte-derived macrophages (Mϕ) were treated with either LPS (100ng/ml) +IFN-γ(100u/ml) or IL-4 (20ng/ml). Surface CD155 expression was determined by FACS. Representative histograms and mean ± SEM of mean fluorescence intensities from 6 experiments. Two-tailed student t test. P value shown on figure.
Extended Data Fig.4. Efficiency of CD155 knockdown and impact of CD155 on anti-viral immune responses in healthy individuals.
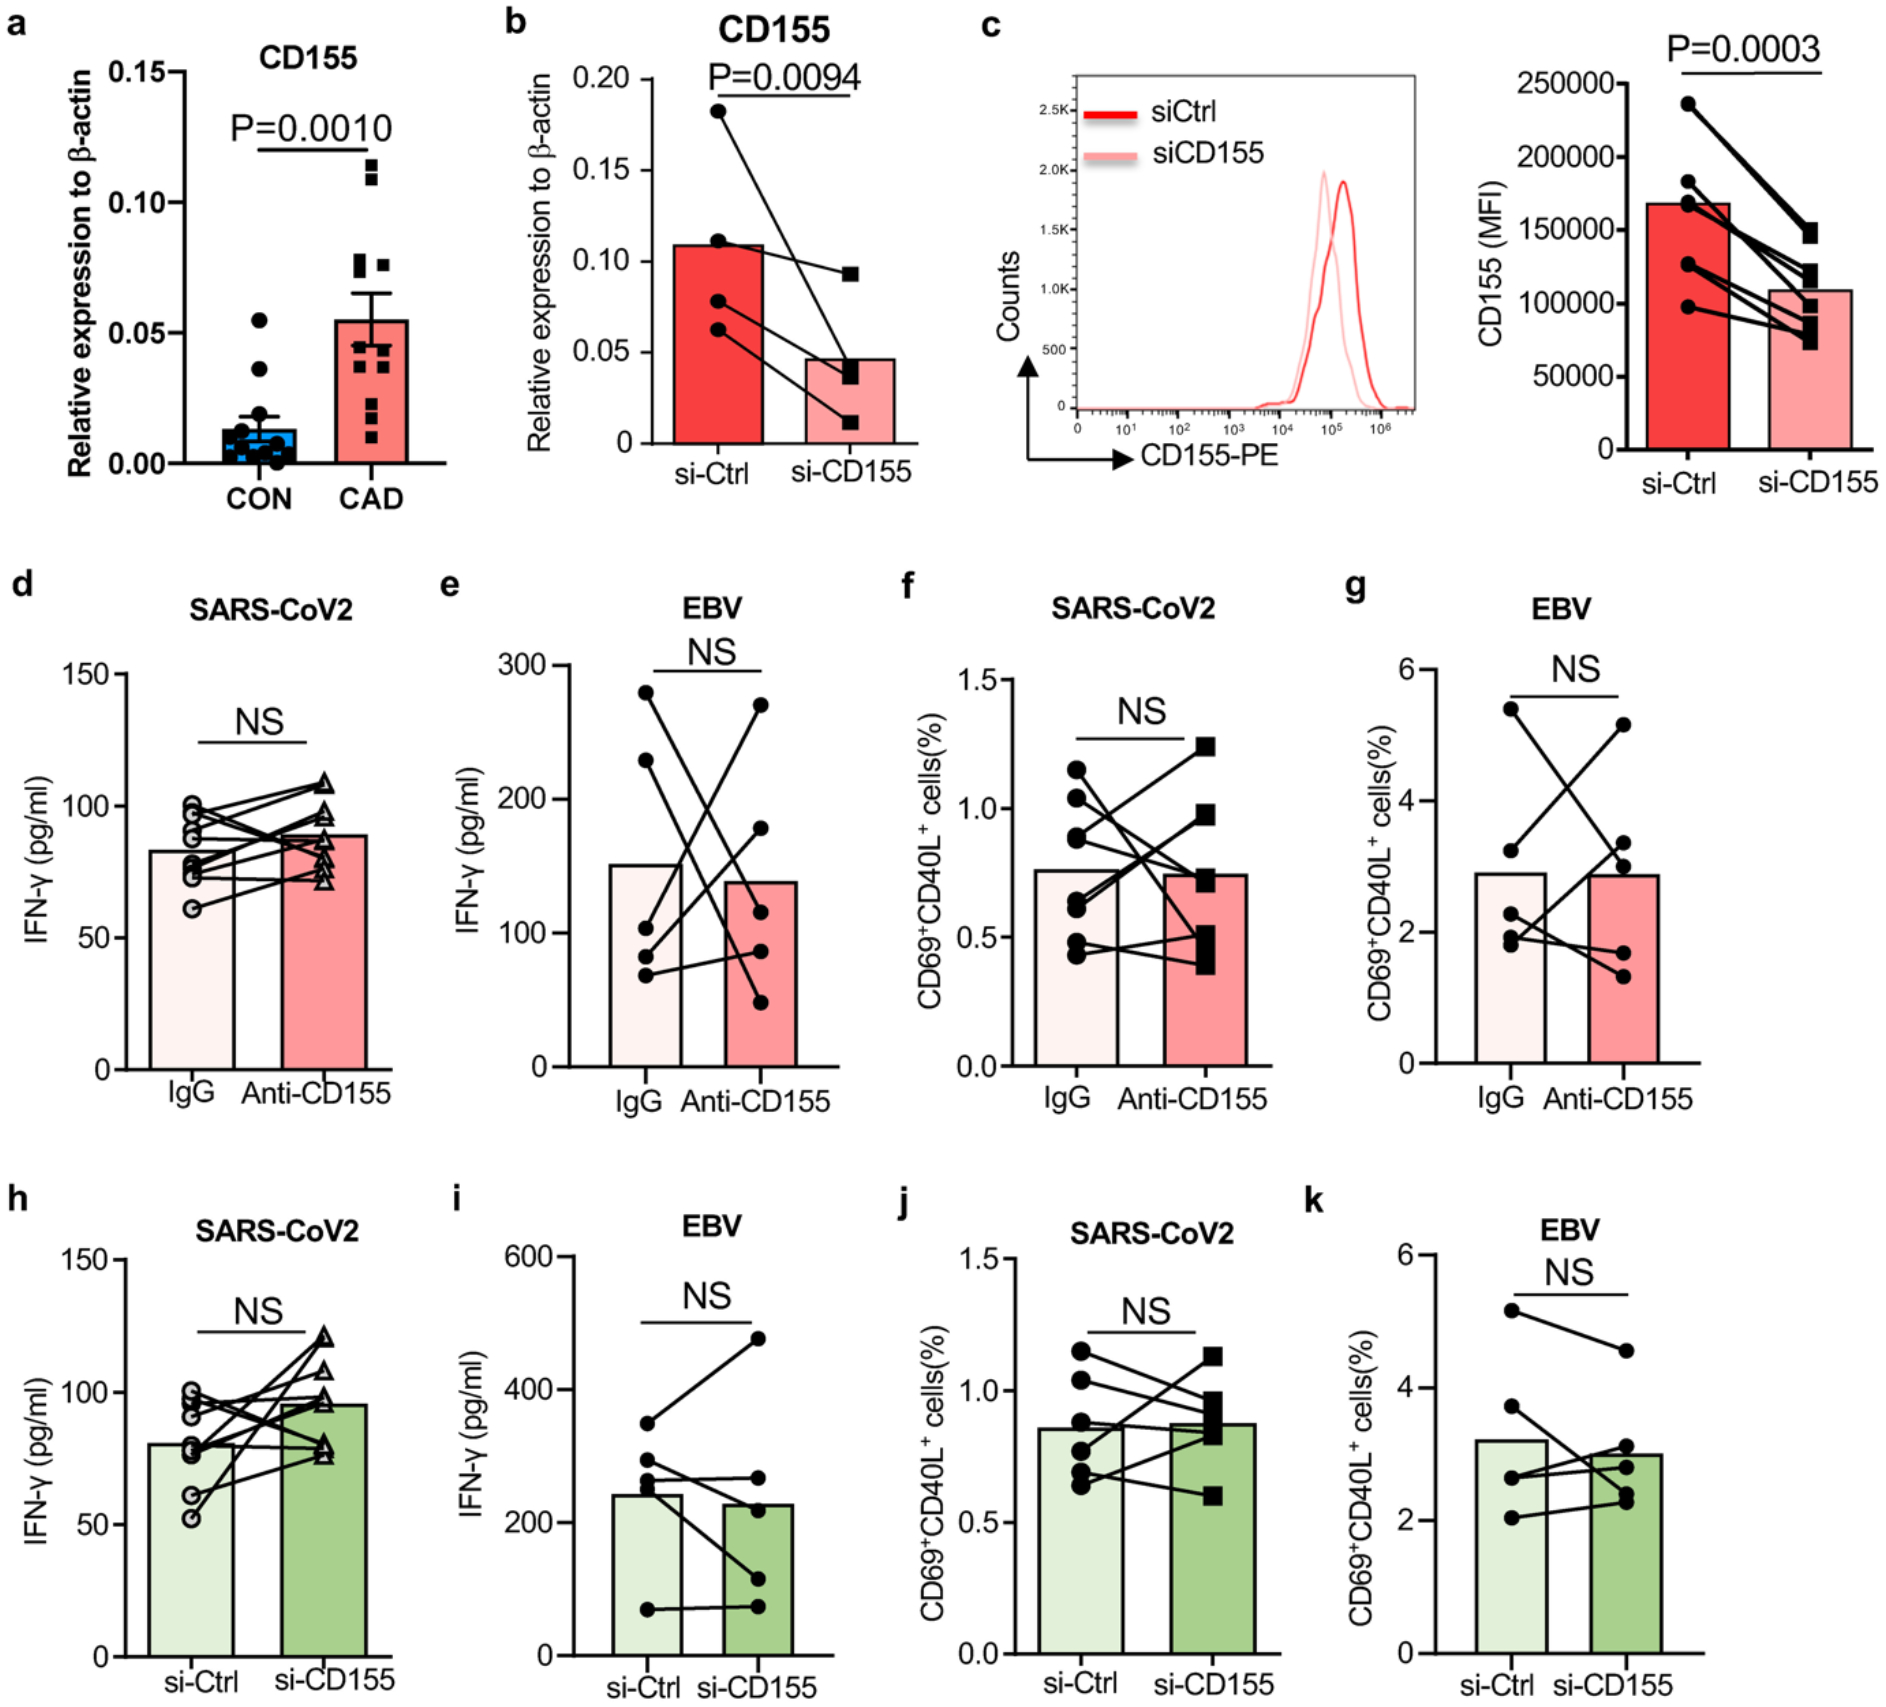
a. Monocyte-derived macrophages (Mϕ) were generated from patients and controls. Relative expression CD155 transcripts in healthy and CAD Mϕ (n=12).
Mϕ were generated as in Fig. 2 and transfected with control or CD155 siRNA.
b. CD155 transcripts were quantified by qPCR
c. CD155 expression on the surface of Mϕ detected by flow cytometry. n=8.
T cells from healthy individuals were stimulated with viral antigen-loaded Mϕ. In parallel cultures, anti-CD155 antibodies were added or CD155 was knocked down by siRNA technology. Six hours later, antigen-responsive CD69+ CD40L+ T cells were measured by flow cytometry.
d. IFN-γ secretion after SARS-CoV2 antigen stimulation in the absence and presence of anti-CD155 antibodies. n=10 each.
e. IFN-γ secretion after EBV antigen stimulation in the absence and presence of anti-CD155 antibodies. n=5 each.
f. Frequencies of anti-SARS-CoV2 CD69+ CD40L+ T cells after CD155 blockade. n=8.
g. Frequencies of anti-EBV CD69+ CD40L+ T cells after CD155 blockade. n=5.
h. IFN-γ release induced by SARS-CoV2 antigen-pulsed CD155 siRNA-transfected Mϕ. n=10.
i. IFN-γ release induced by EBV antigen-pulsed CD155 siRNA-transfected Mϕ. n= 5.
j. Frequencies of anti-SARS-CoV2 CD69+ CD40L+ T cells after CD155 knockdown. n=8.
k. Frequencies of anti-SARS-CoV2 CD69+ CD40L+ T cells after CD155 knockdown. n=5.
Individual data points are displayed. Data are mean ± SEM. Difference were compared with 2 tail student t test. p-value was shown on each panel.
Extended Data Fig.5. Macrophage survival.

a.-d. Monocytes were isolated and differentiated into macrophages (Mϕ) with M-CSF over 5 days. Cell survival rates were quantified by 3 different approaches:
a.-b. Simultaneous Live/dead cell staining with calcein AM (live) and BOBO-3 (dead). (a) Representative image from 3 independent experiments. (e) Cell survival rates from 12 controls and 12 patients.
c. Cell death was measured by LDH release. Data from 12 controls and 12 patients.
d. Cell viability was measured d by staining with the alamarBlue cell viability reagent. Data from 12 controls and 12 patients.
e.-h. Monocyte-derived macrophages (Mϕ) were transfected with control siRNA, CD155-specific si-RNA or METTL3-specific siRNA. Cell survival was quantified after 48 hrs. (e) Calcein AM (live) / BOBO-3 (dead) staining. Representative images from 8 experiments in each group. (f) Cell death rates measured in all 8 experiments. (g) LDH release measured in all 8 experiments. (h) AlamarBlue cell viability staining. Data from 8 experiments.
Individual data points are displayed. Data are mean ± SEM. Difference were compared with one-way ANOVA.
Extended Data Fig.6. Tissue METTL3, efficiency of METTL3 knockdown, strategy of predicting methylation sites and Me-RIP quantification.
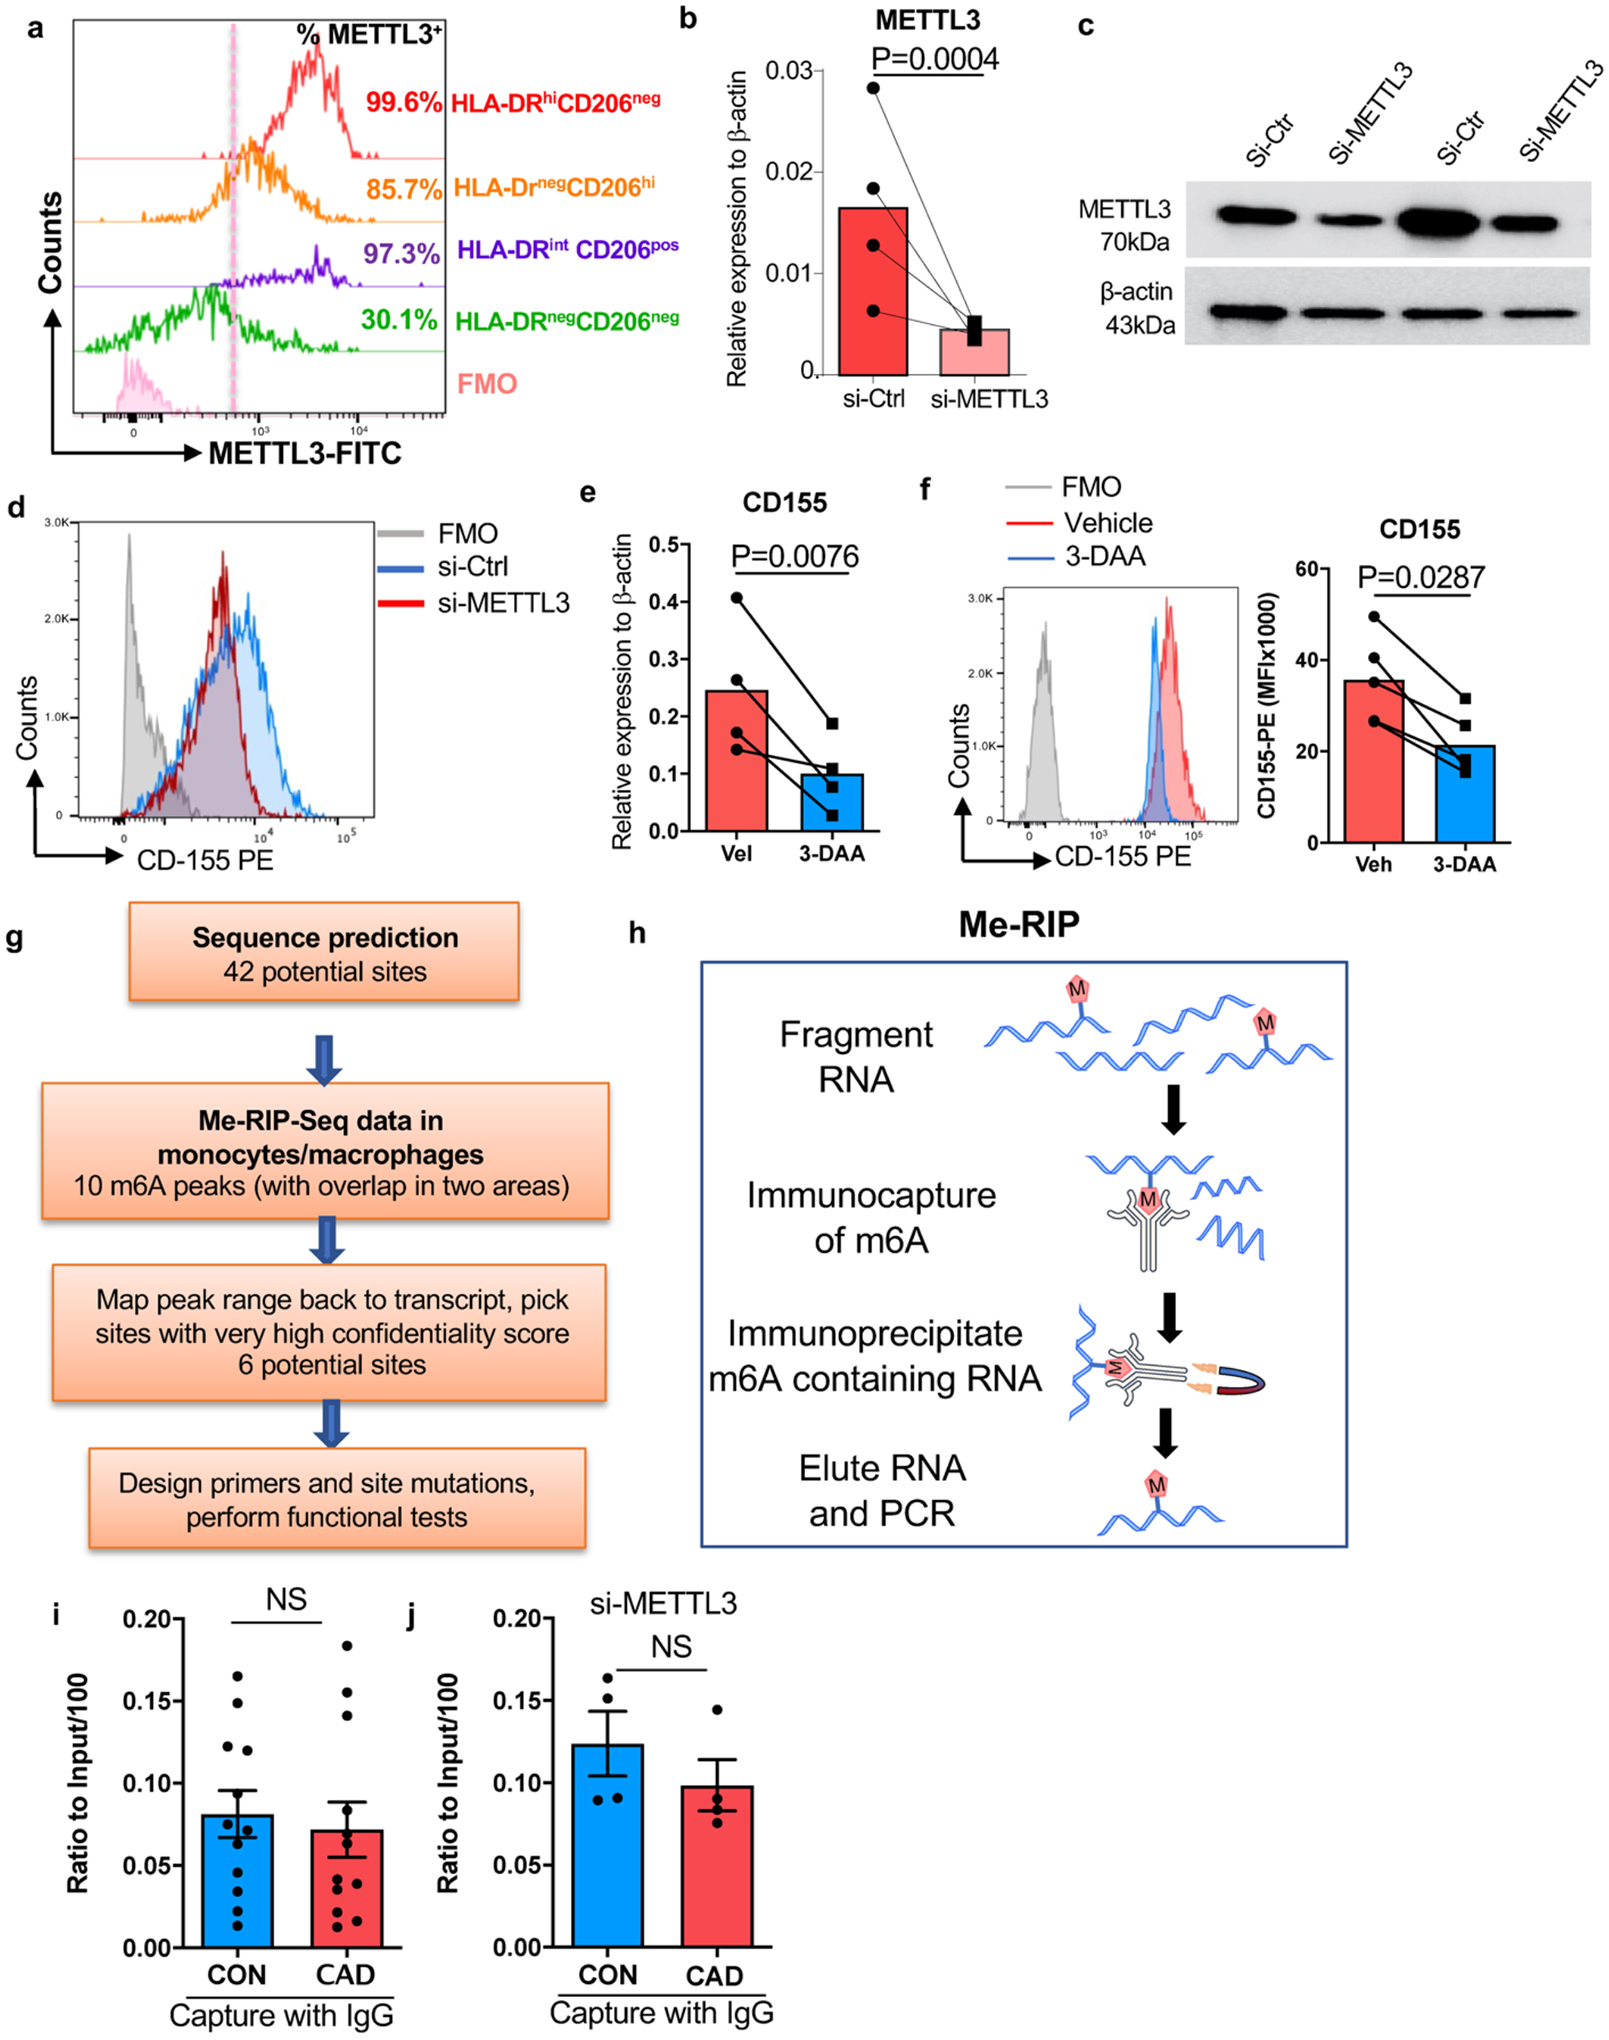
a. Human atherosclerotic arteries were collected and analyzed by flow cytometry as Extended Data Fig 3a–3b shown. Intranuclear expression of METTL3 on different tissue macrophage clusters.
Mϕ were generated from monocyte precursors of healthy individuals and CAD patients as in Fig.1.
b. Knockdown efficiency for METTL3 in control and patient-derived Mϕ. Cells were transfected with METTL3 siRNA and METTL3 transcripts were quantified by RT-PCR (n=4 experiments).
c. METTL3 protein expression was determined by Western blotting (n=2 control-CAD pairs).
d. Representative histogram for CD155 expression on macrophages after knockdown of METTL3.
e.-f. Mϕ were treated with the m6A inhibitor 3-DAA. (e) CD155 transcripts were quantified by RT-PCR. N=4. (f) CD155 protein expression was measured by FACS. Representative histogram (left) and mean fluorescence intensity (right) from 5 experiments.
g. Scheme delineating the process of determining m6A sites on CD155 mRNA.
h. Scheme depicting the method to quantify Me-RIP.
i.-j.Immunoprecipitation of Methylated RNA (Me-RIP) with IgG control antibody.
i. CD155 mRNA was precipitated with IgG control antibody in healthy and CAD Mϕ and quantified by Me-RIP. N=12 experiments.
j. METTL3 was knocked down in control and CAD Mϕ by siRNA technology. CD155 mRNA was precipitated with IgG antibody and measured by Me-RIP. N=4 experiments.
Individual data points are displayed. Data are mean ± SEM. Difference were compared with two tail student t test. p-value was shown on each panel.
Extended Data Fig.7. Viral antigen presentation after inhibition of m6A modification in healthy Mϕ.
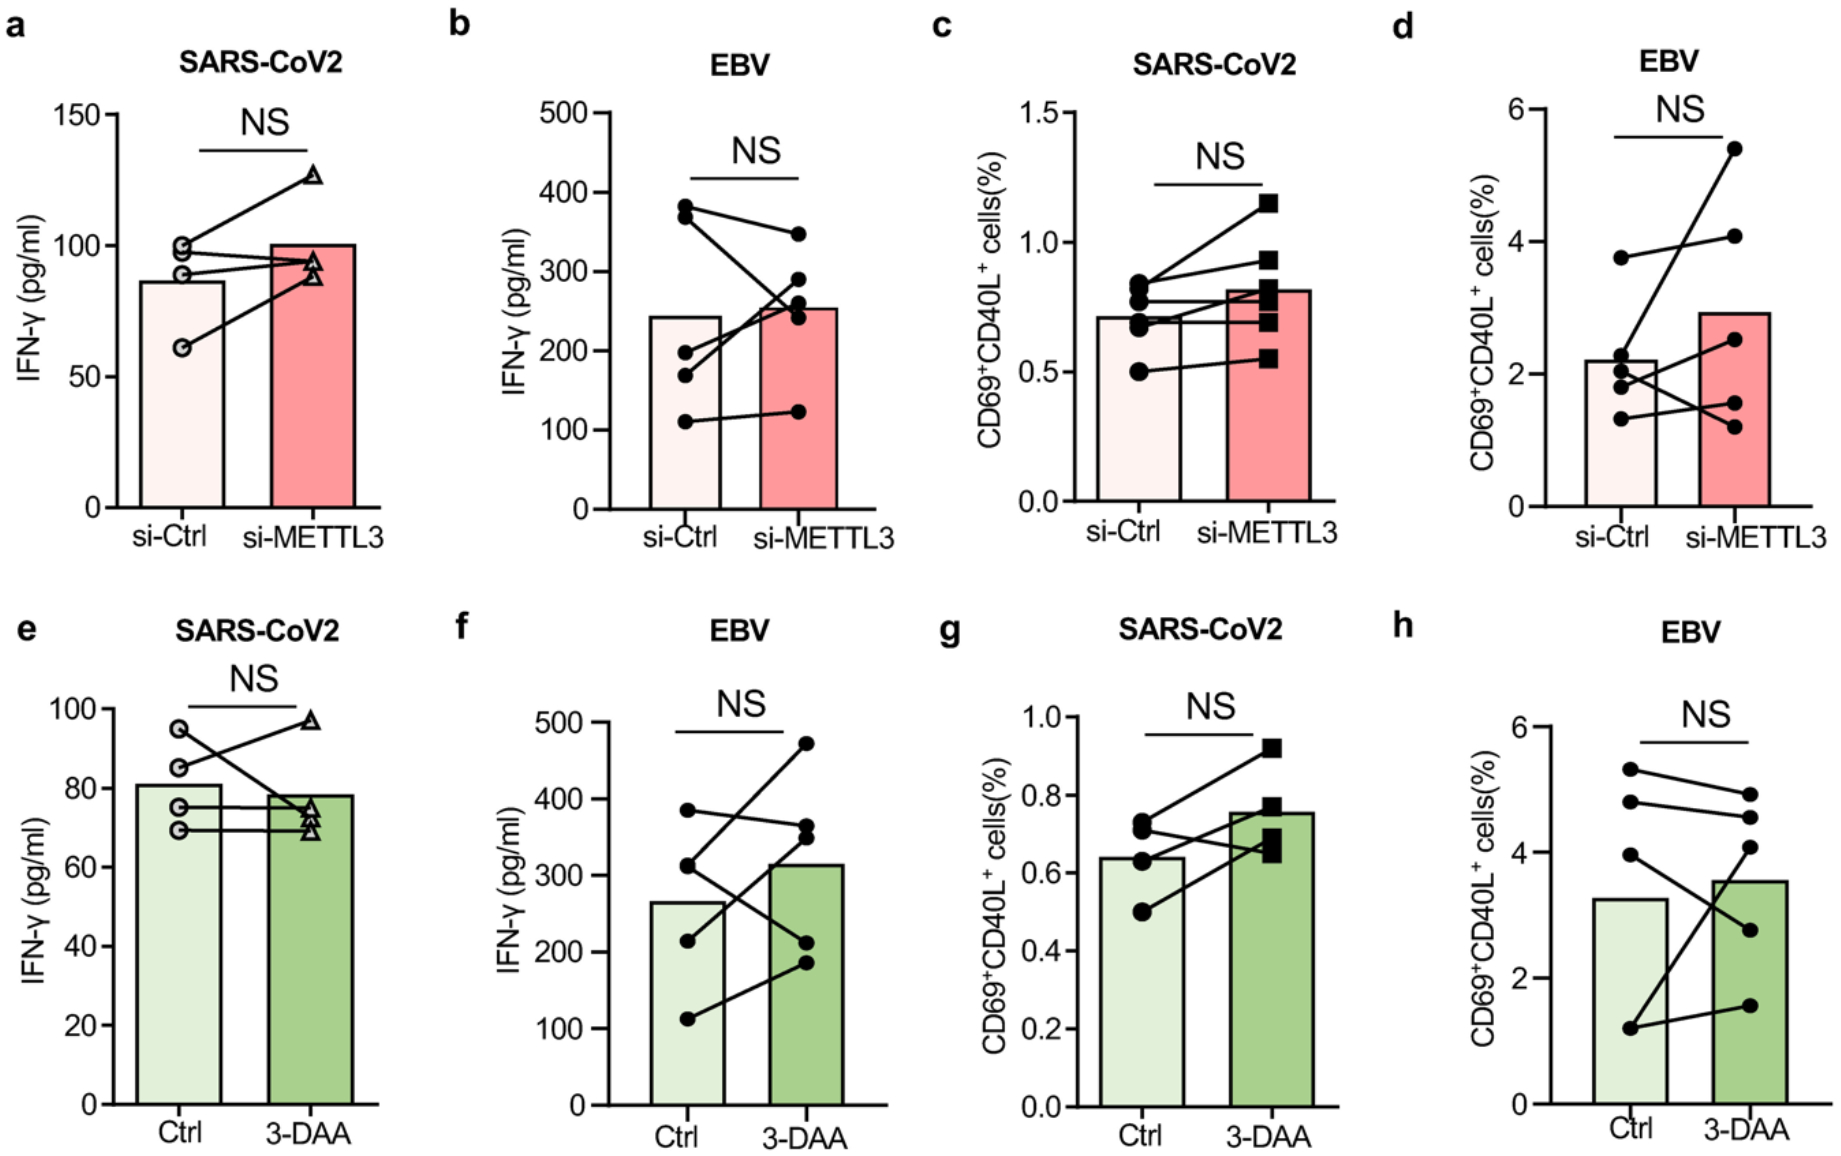
a.-d. Mϕ generated from healthy individuals were transfected with METTL3 siRNA and subsequently used as antigen-presenting cells to stimulate anti-viral T cells.
a. IFN-γ release in response to SARS-CoV2 antigen quantified in 4 experiments.
b. IFN-γ release in response to EBV antigen quantified in 5 experiments.
c. Frequencies of SARS-CoV2 specific CD69+ CD40L+ CD4+ T cells measured in 6 experiments.
d. Frequencies of EBV specific CD69+ CD40L+ CD4+ T cells measured in 5 experiments.
e.-h. Mϕ from healthy individuals were treated with the m6A inhibitor 3-Deazaadenosine (3-DAA), loaded with antigen and mixed with T cells.
e. IFN- γ release in response to SARS-CoV2 antigen quantified in 4 experiments.
f. IFN- γ release in response to EBV antigen quantified in 5 experiments.
g. Frequencies of SARS-CoV2 specific CD69+ CD40L+ CD4+ T cells measured in 6 experiments.
h. Frequencies of EBV specific CD69+ CD40L+ CD4+ T cells measured in 5 experiments.
Individual data points are displayed. Data are mean ± SEM. Difference were compared with one-way ANOVA.
Extended Data Fig 8. CD155hi METTL3hi monocytes in patients with CAD.
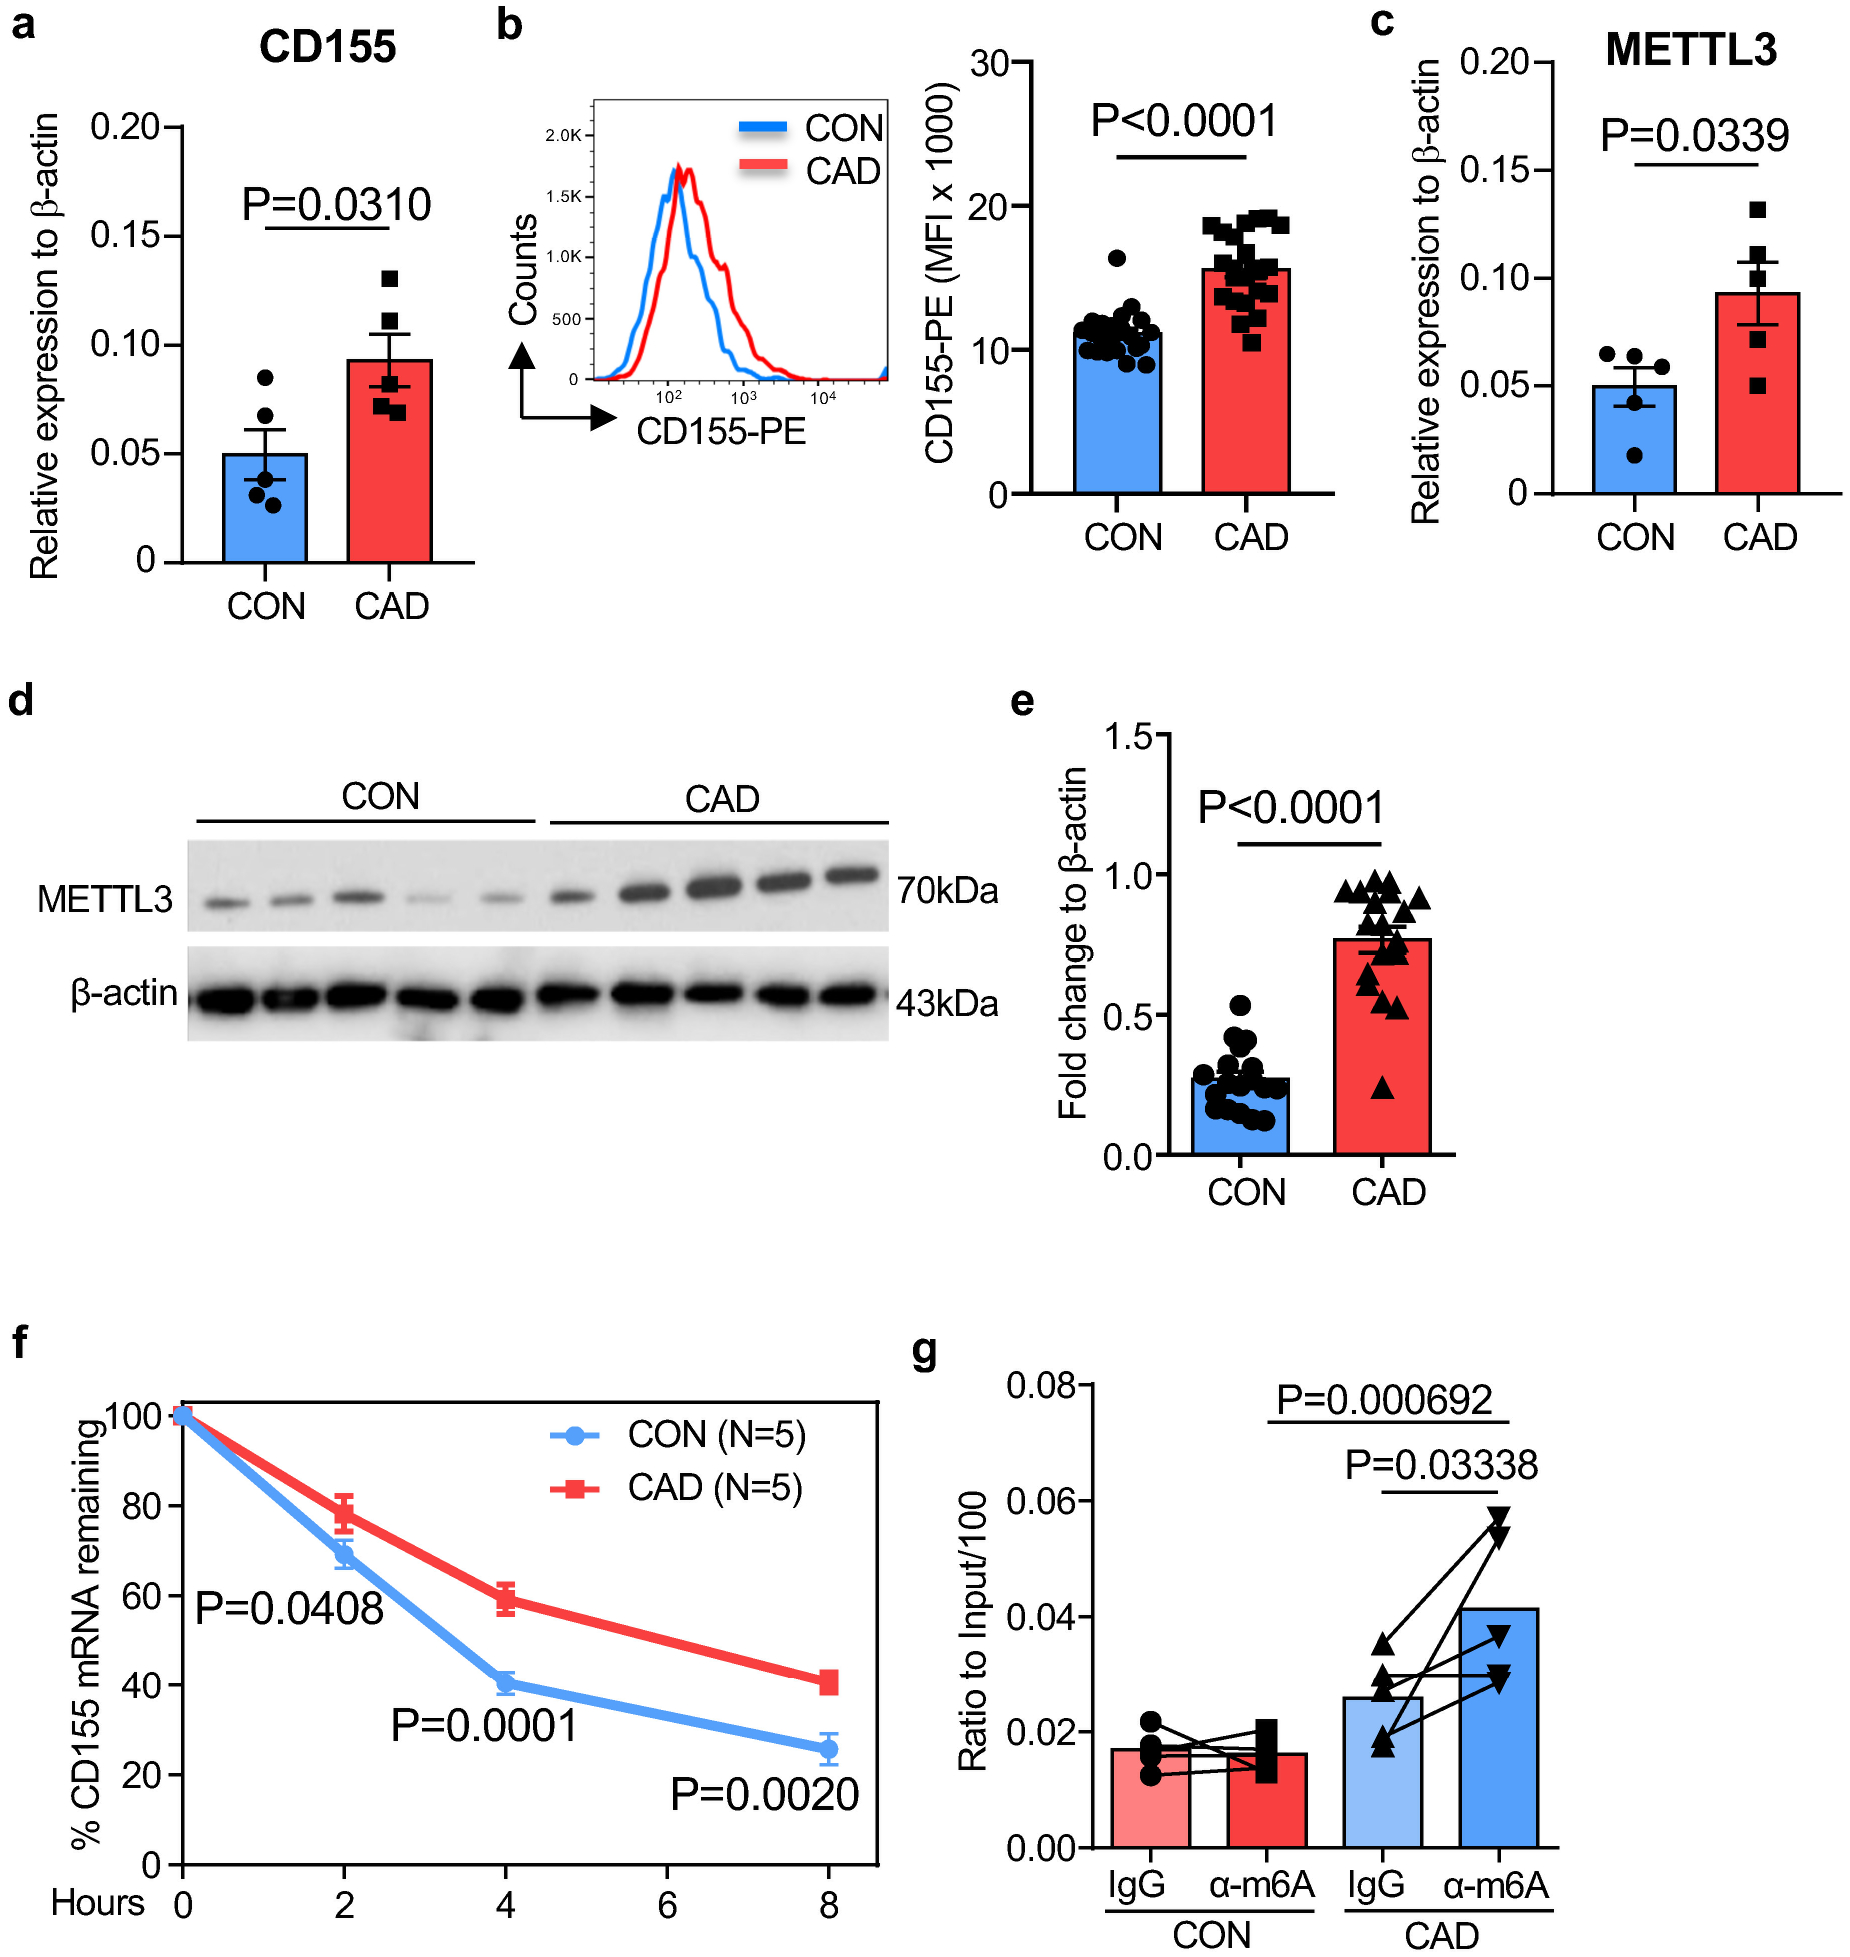
CD14+ monocytes were isolated from the blood of CAD patients and age-matched controls.
a. CD155 transcripts quantified by RT-PCR.
b. Flow cytometry for CD155 protein expression. Representative histogram and data from 5 experiments.
c. METTL3 transcripts measured by RT-PCR(n=5).
d.-e. Quantification of METTL3 protein by immunoblot in monocytes from 5 patients and 5 controls. β-actin served as loading control.
f. CD155 mRNA decay assay in control and CAD monocytes (n=5).
g. Methylated CD155 mRNA measured by Me-RIP in control and CAD monocytes (n=5).
Individual data points are displayed. Data are mean ± SEM. Difference were compared with one-way ANOVA. p-value was shown on each panel.
Extended Data Table 1.
Clinical characteristics of patients with CAD
| Parameters | N=87 |
|---|---|
| Age (mean ± SD) | 68.51 ± 8.40 |
| Male | 78.16% |
| Ethnicity | |
| BMI (mean ± SD) | 29.81 ± 6.70 |
| Diabetes mellitus | 24.1% |
| Hypertension | 58.6% |
| Hyperlipidemia | 55.2% |
| Family history of CAD | 27.6% |
| EBV exposure | 83.9% |
| Smoking | |
| Coronary Artery Disease | |
| Treatment |
Extended Data Table 2.
Lipid profiles for plasma donors
| TGhi (n=4) | TGloLDLhi (n=7) | TGloLDLlo (n=4) | |
|---|---|---|---|
| Total cholesterol (mg/dl) | 173.75±13.86 | 236.33±23.29 | 185.5±23.76 |
| HDL (mg/dl) | 40.25±9.73 | 70±20.93 | 77.25±24.98 |
| LDL (mg/dl) | 91.5±8.73 | 148.5±29.08 | 93.5±9.34 |
| Triglyceride (mg/dl) | 208.75±34.83 | 90±19 | 74.25±14.94 |
| Non-HDL-C (mg/dl) | 133.5±5.39 | 166.33±31.25 | 100±22.17 |
Supplementary Material
Acknowledgments
This work was supported by the National Institutes of Health (R01AR042527, R01AI108906, R01HL142068, and P01HL129941 to CMW and R01AI108891, R01AG045779, U19AI057266, R01AI129191 to JJG).
Footnotes
Declaration of Interests: The authors have declared that no conflict of interest exists.
References
- 1.Clerkin KJ et al. COVID-19 and Cardiovascular Disease. Circulation 141, 1648–1655, doi: 10.1161/CIRCULATIONAHA.120.046941 (2020). [DOI] [PubMed] [Google Scholar]
- 2.Madjid M et al. Influenza epidemics and acute respiratory disease activity are associated with a surge in autopsy-confirmed coronary heart disease death: results from 8 years of autopsies in 34,892 subjects. Eur Heart J 28, 1205–1210, doi: 10.1093/eurheartj/ehm035 (2007). [DOI] [PMC free article] [PubMed] [Google Scholar]
- 3.Macias AE et al. The disease burden of influenza beyond respiratory illness. Vaccine 39 Suppl 1, A6–A14, doi: 10.1016/j.vaccine.2020.09.048 (2021). [DOI] [PMC free article] [PubMed] [Google Scholar]
- 4.Joesoef RM, Harpaz R, Leung J & Bialek SR Chronic medical conditions as risk factors for herpes zoster. Mayo Clin Proc 87, 961–967, doi: 10.1016/j.mayocp.2012.05.021 (2012). [DOI] [PMC free article] [PubMed] [Google Scholar]
- 5.Offor UT et al. Transplantation for congenital heart disease is associated with an increased risk of Epstein-Barr virus-related post-transplant lymphoproliferative disorder in children. J Heart Lung Transplant 40, 24–32, doi: 10.1016/j.healun.2020.10.006 (2021). [DOI] [PubMed] [Google Scholar]
- 6.Onishi Y et al. Resolution of chronic active EBV infection and coexisting pulmonary arterial hypertension after cord blood transplantation. Bone Marrow Transplant 49, 1343–1344, doi: 10.1038/bmt.2014.129 (2014). [DOI] [PubMed] [Google Scholar]
- 7.Sette A & Crotty S Adaptive immunity to SARS-CoV-2 and COVID-19. Cell 184, 861–880, doi: 10.1016/j.cell.2021.01.007 (2021). [DOI] [PMC free article] [PubMed] [Google Scholar]
- 8.Grifoni A et al. Targets of T Cell Responses to SARS-CoV-2 Coronavirus in Humans with COVID-19 Disease and Unexposed Individuals. Cell 181, 1489–1501 e1415, doi: 10.1016/j.cell.2020.05.015 (2020). [DOI] [PMC free article] [PubMed] [Google Scholar]
- 9.Dan JM et al. Immunological memory to SARS-CoV-2 assessed for up to 8 months after infection. Science 371, doi: 10.1126/science.abf4063 (2021). [DOI] [PMC free article] [PubMed] [Google Scholar]
- 10.Amyes E et al. Characterization of the CD4+ T cell response to Epstein-Barr virus during primary and persistent infection. J Exp Med 198, 903–911, doi: 10.1084/jem.20022058 (2003). [DOI] [PMC free article] [PubMed] [Google Scholar]
- 11.Fernandez DM et al. Single-cell immune landscape of human atherosclerotic plaques. Nat Med 25, 1576–1588, doi: 10.1038/s41591-019-0590-4 (2019). [DOI] [PMC free article] [PubMed] [Google Scholar]
- 12.Flego D, Liuzzo G, Weyand CM & Crea F Adaptive Immunity Dysregulation in Acute Coronary Syndromes: From Cellular and Molecular Basis to Clinical Implications. J Am Coll Cardiol 68, 2107–2117, doi: 10.1016/j.jacc.2016.08.036 (2016). [DOI] [PMC free article] [PubMed] [Google Scholar]
- 13.Nakajima T et al. De novo expression of killer immunoglobulin-like receptors and signaling proteins regulates the cytotoxic function of CD4 T cells in acute coronary syndromes. Circ Res 93, 106–113, doi: 10.1161/01.RES.0000082333.58263.58 (2003). [DOI] [PubMed] [Google Scholar]
- 14.Watanabe R et al. Pyruvate controls the checkpoint inhibitor PD-L1 and suppresses T cell immunity. J Clin Invest 127, 2725–2738, doi: 10.1172/JCI92167 (2017). [DOI] [PMC free article] [PubMed] [Google Scholar]
- 15.Lupo KB & Matosevic S CD155 immunoregulation as a target for natural killer cell immunotherapy in glioblastoma. J Hematol Oncol 13, 76, doi: 10.1186/s13045-020-00913-2 (2020). [DOI] [PMC free article] [PubMed] [Google Scholar]
- 16.Yu X et al. The surface protein TIGIT suppresses T cell activation by promoting the generation of mature immunoregulatory dendritic cells. Nat Immunol 10, 48–57, doi: 10.1038/ni.1674 (2009). [DOI] [PubMed] [Google Scholar]
- 17.Freed-Pastor WA et al. The CD155/TIGIT axis promotes and maintains immune evasion in neoantigen-expressing pancreatic cancer. Cancer Cell 39, 1342–1360 e1314, doi: 10.1016/j.ccell.2021.07.007 (2021). [DOI] [PMC free article] [PubMed] [Google Scholar]
- 18.Frye M, Harada BT, Behm M & He C RNA modifications modulate gene expression during development. Science 361, 1346–1349, doi: 10.1126/science.aau1646 (2018). [DOI] [PMC free article] [PubMed] [Google Scholar]
- 19.Dominissini D et al. Topology of the human and mouse m6A RNA methylomes revealed by m6A-seq. Nature 485, 201–206, doi: 10.1038/nature11112 (2012). [DOI] [PubMed] [Google Scholar]
- 20.Fu Y, Dominissini D, Rechavi G & He C Gene expression regulation mediated through reversible m(6)A RNA methylation. Nat Rev Genet 15, 293–306, doi: 10.1038/nrg3724 (2014). [DOI] [PubMed] [Google Scholar]
- 21.Roundtree IA, Evans ME, Pan T & He C Dynamic RNA Modifications in Gene Expression Regulation. Cell 169, 1187–1200, doi: 10.1016/j.cell.2017.05.045 (2017). [DOI] [PMC free article] [PubMed] [Google Scholar]
- 22.Geula S et al. Stem cells. m6A mRNA methylation facilitates resolution of naive pluripotency toward differentiation. Science 347, 1002–1006, doi: 10.1126/science.1261417 (2015). [DOI] [PubMed] [Google Scholar]
- 23.Lin S, Choe J, Du P, Triboulet R & Gregory RI The m(6)A Methyltransferase METTL3 Promotes Translation in Human Cancer Cells. Mol Cell 62, 335–345, doi: 10.1016/j.molcel.2016.03.021 (2016). [DOI] [PMC free article] [PubMed] [Google Scholar]
- 24.Dorn LE et al. The N(6)-Methyladenosine mRNA Methylase METTL3 Controls Cardiac Homeostasis and Hypertrophy. Circulation 139, 533–545, doi: 10.1161/CIRCULATIONAHA.118.036146 (2019). [DOI] [PMC free article] [PubMed] [Google Scholar]
- 25.Liu Y et al. The N(6)-methyladenosine (m(6)A)-forming enzyme METTL3 facilitates M1 macrophage polarization through the methylation of STAT1 mRNA. Am J Physiol Cell Physiol 317, C762–C775, doi: 10.1152/ajpcell.00212.2019 (2019). [DOI] [PubMed] [Google Scholar]
- 26.Wang H et al. Mettl3-mediated mRNA m(6)A methylation promotes dendritic cell activation. Nat Commun 10, 1898, doi: 10.1038/s41467-019-09903-6 (2019). [DOI] [PMC free article] [PubMed] [Google Scholar]
- 27.Shirai T et al. The glycolytic enzyme PKM2 bridges metabolic and inflammatory dysfunction in coronary artery disease. J Exp Med 213, 337–354, doi: 10.1084/jem.20150900 (2016). [DOI] [PMC free article] [PubMed] [Google Scholar]
- 28.Jin K et al. NOTCH-induced rerouting of endosomal trafficking disables regulatory T cells in vasculitis. J Clin Invest 131, doi: 10.1172/JCI136042 (2021). [DOI] [PMC free article] [PubMed] [Google Scholar]
- 29.Wen Z et al. N-myristoyltransferase deficiency impairs activation of kinase AMPK and promotes synovial tissue inflammation. Nat Immunol 20, 313–325, doi: 10.1038/s41590-018-0296-7 (2019). [DOI] [PMC free article] [PubMed] [Google Scholar]
- 30.Li Y et al. The DNA Repair Nuclease MRE11A Functions as a Mitochondrial Protector and Prevents T Cell Pyroptosis and Tissue Inflammation. Cell Metab 30, 477–492 e476, doi: 10.1016/j.cmet.2019.06.016 (2019). [DOI] [PMC free article] [PubMed] [Google Scholar]
- 31.Wen Z et al. The microvascular niche instructs T cells in large vessel vasculitis via the VEGF-Jagged1-Notch pathway. Sci Transl Med 9, doi: 10.1126/scitranslmed.aal3322 (2017). [DOI] [PMC free article] [PubMed] [Google Scholar]
- 32.Zhou Y, Zeng P, Li YH, Zhang Z & Cui Q SRAMP: prediction of mammalian N6-methyladenosine (m6A) sites based on sequence-derived features. Nucleic Acids Res 44, e91, doi: 10.1093/nar/gkw104 (2016). [DOI] [PMC free article] [PubMed] [Google Scholar]
- 33.Li Z et al. FTO Plays an Oncogenic Role in Acute Myeloid Leukemia as a N(6)-Methyladenosine RNA Demethylase. Cancer Cell 31, 127–141, doi: 10.1016/j.ccell.2016.11.017 (2017). [DOI] [PMC free article] [PubMed] [Google Scholar]
- 34.Su R et al. R-2HG Exhibits Anti-tumor Activity by Targeting FTO/m(6)A/MYC/CEBPA Signaling. Cell 172, 90–105 e123, doi: 10.1016/j.cell.2017.11.031 (2018). [DOI] [PMC free article] [PubMed] [Google Scholar]
- 35.Olazagoitia-Garmendia A & Castellanos-Rubio A Relative Quantification of Residue-Specific m(6)A RNA Methylation Using m(6)A-RT-QPCR. Methods Mol Biol 2298, 185–195, doi: 10.1007/978-1-0716-1374-0_12 (2021). [DOI] [PubMed] [Google Scholar]
- 36.Meckiff BJ et al. Imbalance of Regulatory and Cytotoxic SARS-CoV-2-Reactive CD4(+) T Cells in COVID-19. Cell 183, 1340–1353 e1316, doi: 10.1016/j.cell.2020.10.001 (2020). [DOI] [PMC free article] [PubMed] [Google Scholar]
- 37.Sahin U et al. COVID-19 vaccine BNT162b1 elicits human antibody and TH1 T cell responses. Nature 586, 594–599, doi: 10.1038/s41586-020-2814-7 (2020). [DOI] [PubMed] [Google Scholar]
- 38.Jackson LA et al. An mRNA Vaccine against SARS-CoV-2 - Preliminary Report. N Engl J Med 383, 1920–1931, doi: 10.1056/NEJMoa2022483 (2020). [DOI] [PMC free article] [PubMed] [Google Scholar]
- 39.Chen L & Flies DB Molecular mechanisms of T cell co-stimulation and co-inhibition. Nat Rev Immunol 13, 227–242, doi: 10.1038/nri3405 (2013). [DOI] [PMC free article] [PubMed] [Google Scholar]
- 40.Lugowski A, Nicholson B & Rissland OS Determining mRNA half-lives on a transcriptome-wide scale. Methods 137, 90–98, doi: 10.1016/j.ymeth.2017.12.006 (2018). [DOI] [PubMed] [Google Scholar]
- 41.Zaccara S, Ries RJ & Jaffrey SR Reading, writing and erasing mRNA methylation. Nat Rev Mol Cell Biol 20, 608–624, doi: 10.1038/s41580-019-0168-5 (2019). [DOI] [PubMed] [Google Scholar]
- 42.Chang Y et al. Single-cell transcriptomic identified HIF1A as a target for attenuating acute rejection after heart transplantation. Basic Res Cardiol 116, 64, doi: 10.1007/s00395-021-00904-5 (2021). [DOI] [PubMed] [Google Scholar]
- 43.Netea MG et al. Trained immunity: A program of innate immune memory in health and disease. Science 352, aaf1098, doi: 10.1126/science.aaf1098 (2016). [DOI] [PMC free article] [PubMed] [Google Scholar]
- 44.Watanabe R et al. Glucose metabolism controls disease-specific signatures of macrophage effector functions. JCI Insight 3, doi: 10.1172/jci.insight.123047 (2018). [DOI] [PMC free article] [PubMed] [Google Scholar]
- 45.Jung S et al. DNA-mediated immunization of glycoprotein 350 of Epstein-Barr virus induces the effective humoral and cellular immune responses against the antigen. Mol Cells 12, 41–49 (2001). [PubMed] [Google Scholar]
- 46.Luckheeram RV, Zhou R, Verma AD & Xia B CD4(+)T cells: differentiation and functions. Clin Dev Immunol 2012, 925135, doi: 10.1155/2012/925135 (2012). [DOI] [PMC free article] [PubMed] [Google Scholar]
- 47.Daassi D, Mahoney KM & Freeman GJ The importance of exosomal PDL1 in tumour immune evasion. Nat Rev Immunol 20, 209–215, doi: 10.1038/s41577-019-0264-y (2020). [DOI] [PubMed] [Google Scholar]
- 48.O’Donnell JS, Madore J, Li XY & Smyth MJ Tumor intrinsic and extrinsic immune functions of CD155. Semin Cancer Biol 65, 189–196, doi: 10.1016/j.semcancer.2019.11.013 (2020). [DOI] [PubMed] [Google Scholar]
- 49.Shi H, Wei J & He C Where, When, and How: Context-Dependent Functions of RNA Methylation Writers, Readers, and Erasers. Mol Cell 74, 640–650, doi: 10.1016/j.molcel.2019.04.025 (2019). [DOI] [PMC free article] [PubMed] [Google Scholar]
- 50.Li T et al. Silencing of METTL3 attenuates cardiac fibrosis induced by myocardial infarction via inhibiting the activation of cardiac fibroblasts. FASEB J 35, e21162, doi: 10.1096/fj.201903169R (2021). [DOI] [PubMed] [Google Scholar]
- 51.Chien CS et al. METTL3-dependent N(6)-methyladenosine RNA modification mediates the atherogenic inflammatory cascades in vascular endothelium. Proc Natl Acad Sci U S A 118, doi: 10.1073/pnas.2025070118 (2021). [DOI] [PMC free article] [PubMed] [Google Scholar]
Associated Data
This section collects any data citations, data availability statements, or supplementary materials included in this article.
Supplementary Materials
Data Availability Statement
All data generated or analyzed are included in the main article and associated files. Source data are provided with this paper. Potential m6A DRACH sites were predicted with publically available data at GSE76414 and GSE87190.


