Abstract
Breathing-related movement analysis is important in the study of many disease processes. The analysis of diaphragmatic motion via thoracic imaging in particular is important in a variety of disorders. Compared to computed tomography (CT) and fluoroscopy, dynamic magnetic resonance imaging (dMRI) has several advantages, such as better soft tissue contrast, no ionizing radiation, and greater flexibility in selecting scanning planes. In this paper, we propose a novel method for full diaphragmatic motion analysis via free-breathing dMRI. Firstly, after 4D dMRI image construction in a cohort of 51 normal children, we manually delineated the diaphragm on sagittal plane dMRI images at end-inspiration and end-expiration. Then, 25 points were selected uniformly and homologously on each hemi-diaphragm surface. Based on the inferior-superior displacements of these 25 points between end-expiration (EE) and end-inspiration (EI) time points, we obtained their velocities. We then summarized 13 parameters from these velocities for each hemi-diaphragm to provide a quantitative regional analysis of diaphragmatic motion. We observed that the regional velocities of the right hemi-diaphragm were almost always statistically significantly greater than those of the left hemi-diaphragm in homologous locations. There was a significant difference for sagittal curvatures but not for coronal curvatures between the two hemi-diaphragms. Using this methodology, future larger scale prospective studies may be considered to confirm our findings in the normal state and to quantitatively assess regional diaphragmatic dysfunction when various disease conditions are present.
Keywords: diaphragm, motion analysis, curvature, dynamic MRI
1. INTRODUCTION
Breathing-related movement analysis is important in the study of many disease processes [1]. The diaphragm is the main respiratory muscle involved during inspiration [2] and accounts for around 70% of the inspired air volume during regular breathing [3]. As such, the analysis of diaphragm motion via thoracic imaging is important in a variety of disorders. For example, in patients with thoracic insufficiency syndrome (TIS) [6,7] and scoliosis, diaphragm motion may be altered due to the curvature and rotation associated with scoliosis and deformities of the chest wall. No analysis of the pathomechanics of diaphragm motion in scoliosis nor its response to surgery for scoliosis have been pursued. Thus, analysis may be useful for evaluating the effects of surgical intervention. There has been much research proposed to analyze diaphragmatic movement in different disease conditions based on different imaging modalities [2–5]. In this paper, we propose a novel method for the analysis of diaphragm movement in 4D spatiotemporal space through dynamic magnetic resonance imaging (dMRI). Compared to computed tomography (CT) and fluoroscopy, dMRI has several advantages, such as better soft tissue contrast, no ionizing radiation, and greater flexibility in selecting scanning planes. However, limited by current hardware and software, it is difficult to achieve high spatial resolution and sufficient time resolution for real-time 3D volumetric MRI. Therefore, we used an approach with fast 2D sequences to first obtain 2D dynamic MR images, and then constructed the 4D image via optical flow for subsequent analysis. The 4D construction method was previously reported [8–11]. After 4D image construction, we manually delineated the diaphragm in end-expiration (EE) and end-inspiration (EI) time points. Then, 25 homologously placed points were selected uniformly on each hemi-diaphragmatic surface. Based on the displacements of these 25 points between EE and EI time points in the inferior-superior direction, we obtained their velocities and curvatures in sagittal and coronal planes separately. We then summarized these velocities and curvatures for each hemi-diaphragm in 13 homologous regions to provide a quantitative regional description of diaphragmatic motion and shape.
2. MATERIAL AND METHODS
2.1. Imaging Protocol
We utilized thoracic dMRI scans obtained in the supine position from 51 normal children for the analysis in this paper, including 24 boys (11.1 ± 2.4 years of age) and 27 girls (10.1 ± 2.3 years of age). The dMRI images were acquired using fast 2D image sequences. The dMRI scan protocol was as follows: 3T MRI scanner (Siemens Healthcare, Erlangen, Germany), true-FISP imaging with steady-state precession sequence; TR/TE = 3.82/1.91 msec; voxel size, approximately 1 × 1 × 6 mm3; 320 × 320 matrix; bandwidth = 558 Hz; flip angle = 76°. For each subject, 2D images were acquired at 30–40 sagittal slices at contiguous locations, and for each location, 80 slices were acquired continuously at a rate of approximately 400 ms per slice under free-breathing conditions. All data were acquired under an ongoing research protocol approved by the Institutional Review Board at the Children’s Hospital of Philadelphia (CHOP) and University of Pennsylvania, along with Health Insurance Portability and Accountability Act waiver.
2.2. Diaphragm delineation
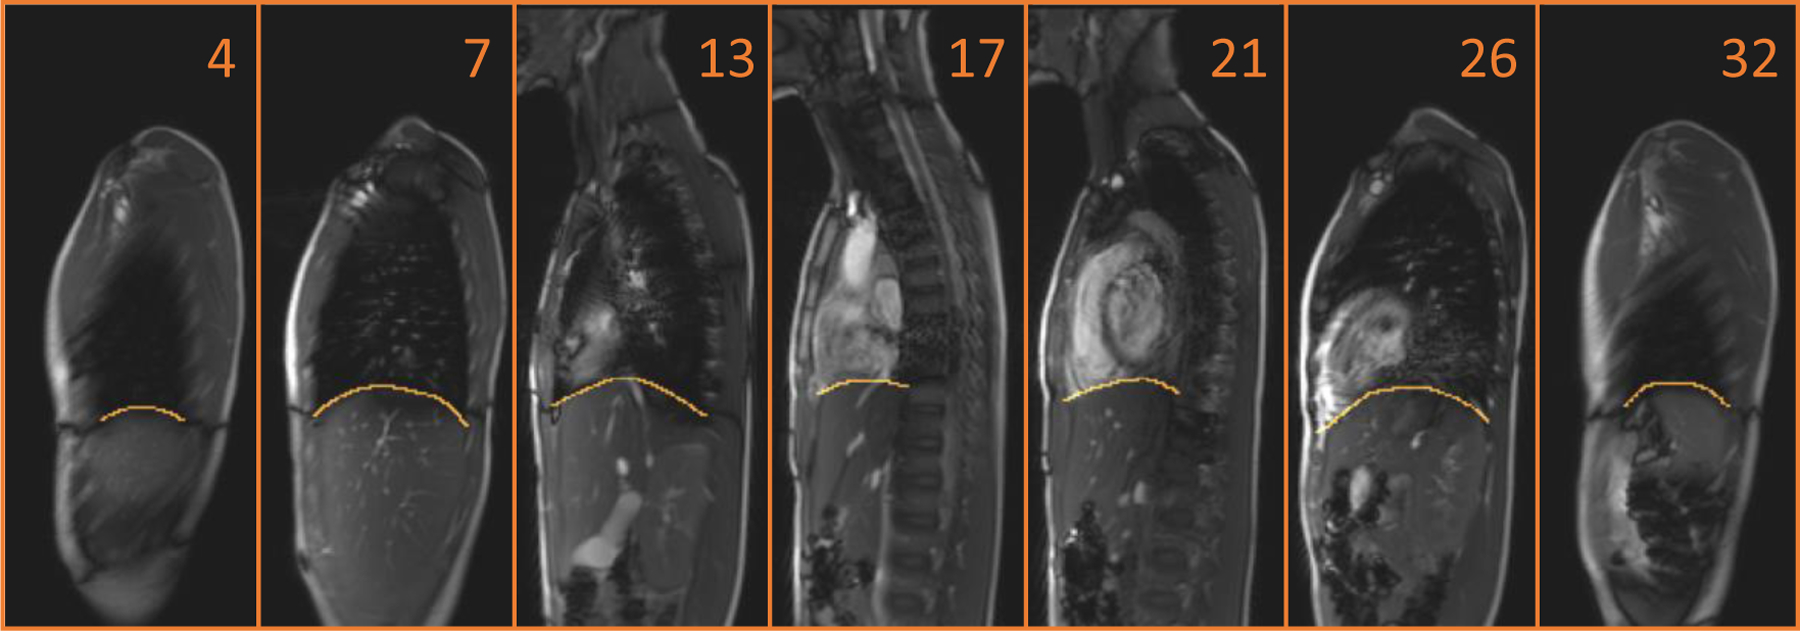
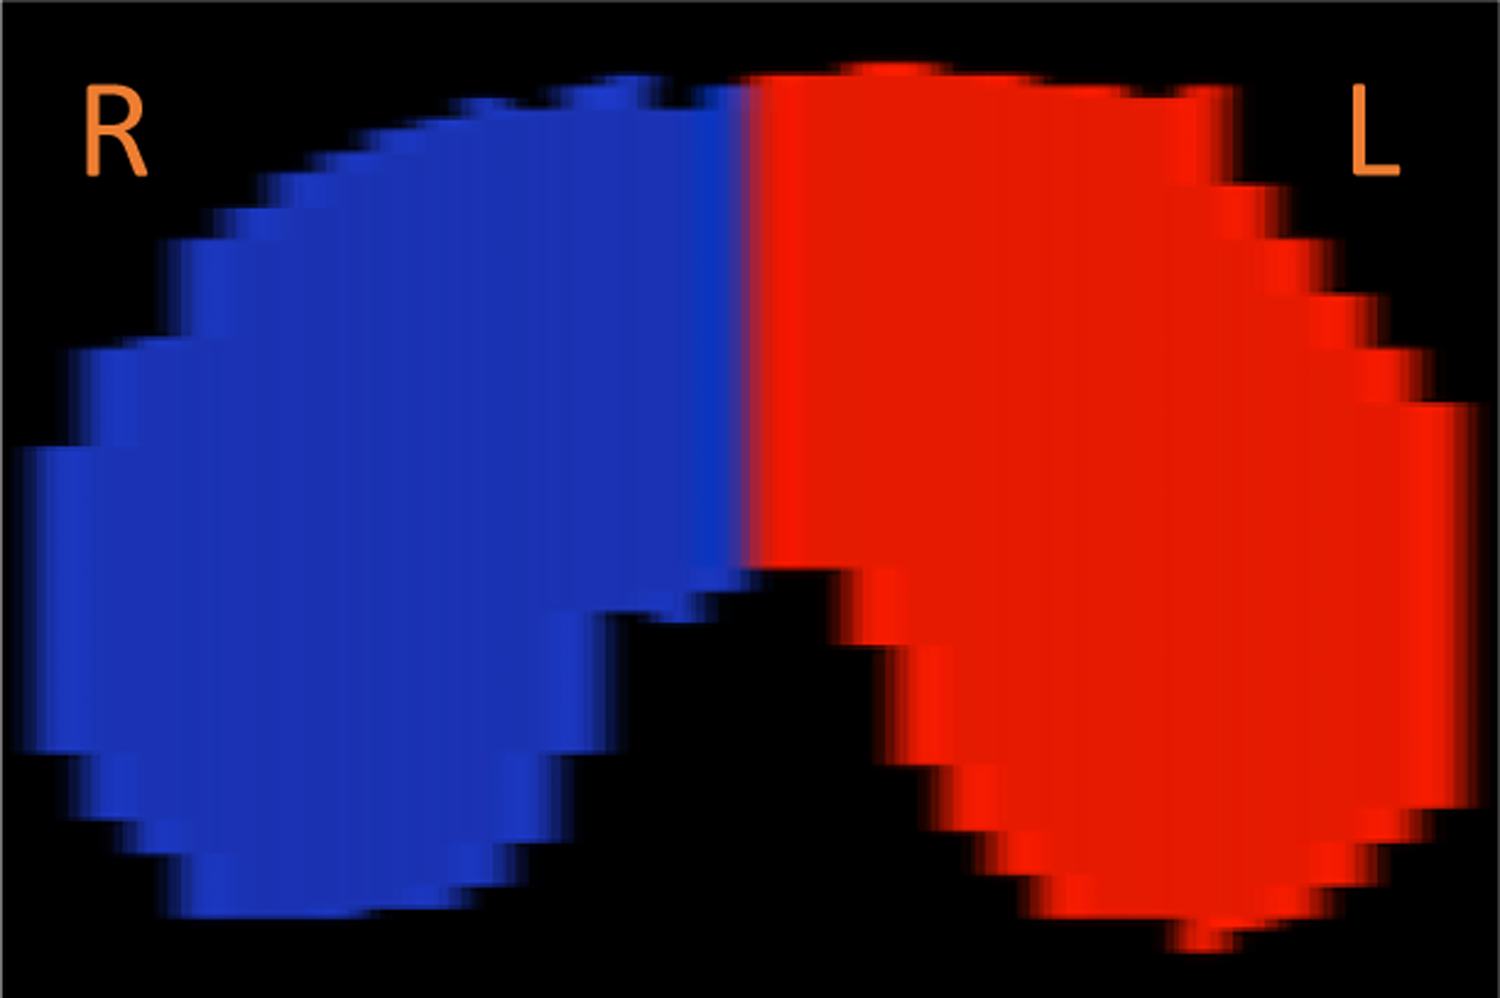
The diaphragm is dome-shaped, has a central tendon surrounded by muscle tissue, and separates the thorax from the abdomen. During breathing, the diaphragm descends with muscle contraction to generate negative pleural pressure, resulting in air flow into the lungs. After 4D image construction was completed, diaphragm delineation was performed manually at EE and EI time points by a trained operator in the sagittal plane as shown in Figure 1. We delineated the diaphragm from the anterior-most aspect to the posterior-most aspect in each sagittal slice, including portions adjacent to other organs/tissue structures such as the heart, liver, or mediastinal fat, on all slices passing through the diaphragm. After the whole diaphragm was delineated in this manner, for EE and EI time points, we obtained a surface in 3D space for each respiratory time point. Subsequently, we manually divided the diaphragm into right and left hemi-diaphragms using the midline sagittal slice as shown in Figure 2.
Figure 1:

The delineation of the diaphragm in the sagittal plane on dMRI. The displayed number indicates the location of the sagittal slice from patient’s right to left at EE.
Figure 2:

The delineated diaphragm was divided into right and left hemi-diaphragms as shown in this axial plane rendering.
2.3. Landmark Selection
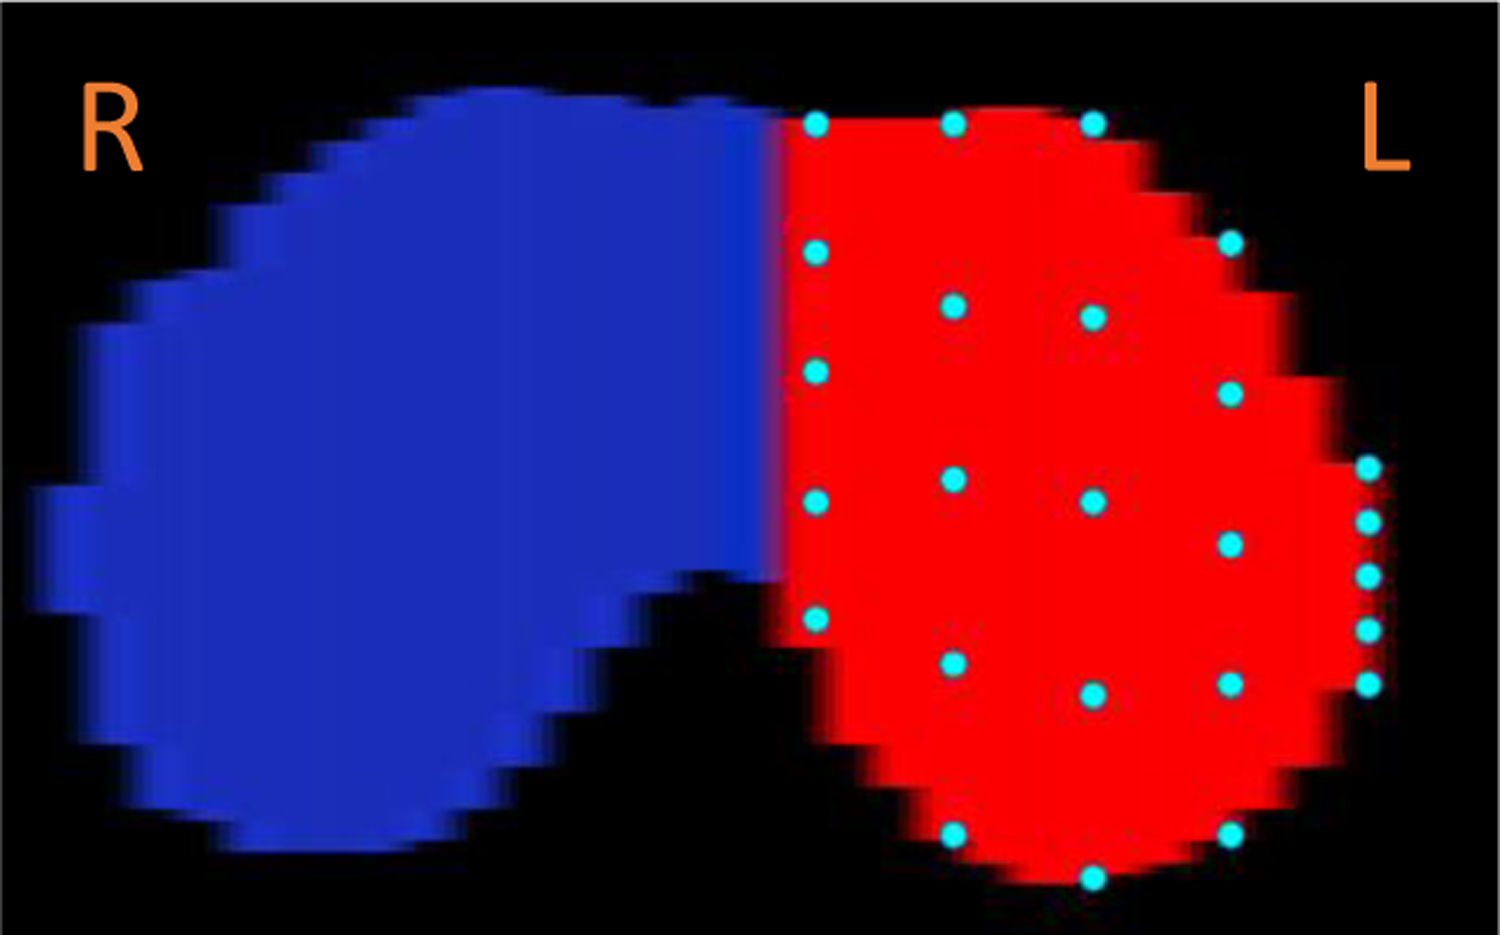
In the 4D images, the movement of the diaphragm will be represented by a moving surface. The goal of our method is to analyze the movement from a global perspective, not just from some specific portion. Therefore, in our method, we selected 25 points on each hemi-diaphragm surface uniformly as depicted in Figure 3. We selected 5 evenly spaced sagittal slices in the left-right direction that passed through each hemi-diaphragm. Then, in each of these sagittal slices, we selected 5 evenly-spaced points in the anterior-posterior direction along the delineated diaphragm. The inferior-superior displacements of these points during the breathing cycle in the 4D images were then quantified. These displacements provided the fundamental information extracted from the dMRI images, where all of the subsequent analysis of diaphragm movement will be based on them.
Figure 3:

The selection of 25 points from the left hemi-diaphragm as shown in this axial plane rendering.
2.4. Velocities
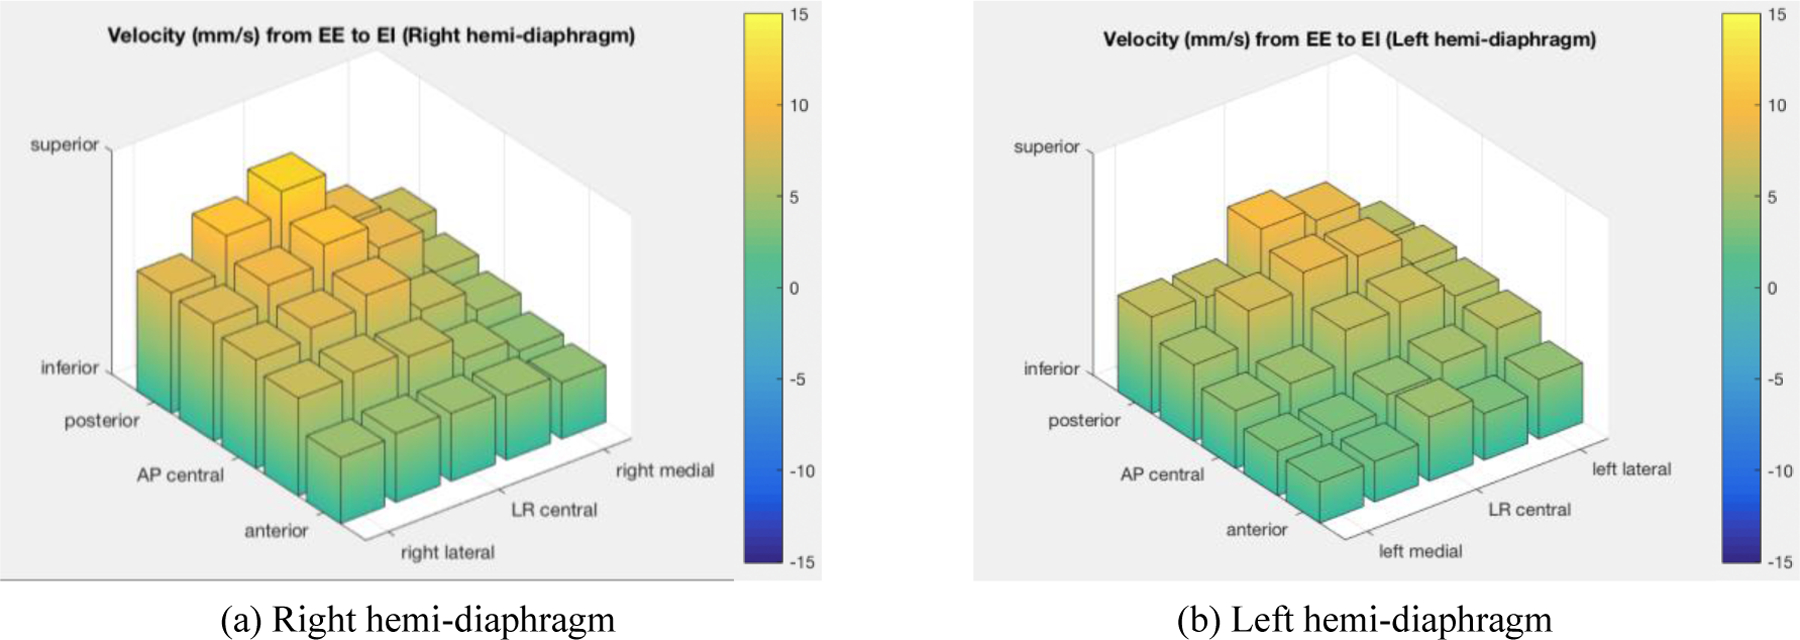
Since the time interval between time-adjacent slices while scanning is recorded in the DICOM file headers, with the displacement information extracted as explained above, we obtained the velocity in the inferior-superior direction of each point on the diaphragm in units of mm/s. For this initial exploration, we only utilized two time points, the EE and EI time points, although this approach can be expanded to employ other time points during the respiratory cycle in the future. From our cohort of normal pediatric subjects, we obtained the average velocity for each point on the diaphragm and plotted these velocities for the right hemi-diaphragm and left hemi-diaphragm separately as shown in Figure 4. In this figure, the 25 velocities for each hemi-diaphragm were plotted as a 5×5 matrix and their magnitudes were plotted using colored bars.
Figure 4:

The average velocities (mm/s) of 25 selected points on each of right and left hemi-diaphragms derived from dMRI in a cohort of normal pediatric subjects (LR central = left-right central. AP central = anterior-posterior central).
2.5. Curvature
Curvature is an important indicator to describe the diaphragm shape, and the curvature of the diaphragm varies in different locations and with the movement of breathing. Intuitively, curvature is the amount by which a curve deviates from a straight line. Formally, the curvature of the point on a 2D smooth curve can be defined through the osculating circle, which is the circle that best approximates the curve at that point, as shown in Equation (1),
where the curvature κ at a point on the curve is defined as the reciprocal of the radius R of the osculating circle and the radius R can be obtained by derivatives evaluated at that point. The larger the radius of the osculating circle, the lower the curvature, and the smaller the radius, the higher the curvature. Curvature has units of #pixel-1.
When applying the curvature concept three-dimensionally to the diaphragm surface, we first smooth the diaphragm. This is because the delineated digital curves may not be smooth locally, which leads to some noisy values. There are different ways of describing the 3D analog of curvature defined above for curves. Any such description has two components of curvature. Here we define the two components by considering curvature separately in the sagittal plane and coronal plane. We first obtain the two curves from the smoothed surface and then apply the above 2D definition to each curve to compute curvature.
As for the computation and description of velocities, the velocities, we employ the selected 25 points on the left and right hemi-diaphragm to compare their curvatures at EI and EE time points separately.
2.6. Measurements
We summarize 13 quantitative measurements from each hemi-diaphragm. 1) Anterior represents the mean of 10 points (2×5) from the 2 rows through the anterior hemi-diaphragm. 2) Posterior represents the mean of 10 points (2×5) from the 2 rows through the posterior hemi-diaphragm. 3) Lateral represents the mean of 10 points (5×2) from the 2 columns through the lateral hemi-diaphragms. 4) Medial represents the mean of 10 points (5×2) from the 2 columns through the medial hemi-diaphragm. 5) Central represents the mean of 9 points (3×3) in the center of the hemi-diaphragm. 6) Anterior-Lateral (AL) represent the mean of 4 points (2×2) closest to the anterior and lateral aspects of the hemi-diaphragm. 7) Anterior-Medial (AM) represents the mean of 4 points (2×2) closest to the anterior and medial aspects of the hemi-diaphragm. 8) Anterior-Central (AC) represents the mean of 6 points (2×3) in the anterior 2 rows and central 3 columns through the hemi-diaphragm. 9) Posterior-Lateral (PL) represents the mean of 4 points (2×2) closest to the posterior and lateral aspects of the hemi-diaphragm. 10) Posterior-Medial (PM) represents the mean of 4 points (2×2) closest to the posterior and medial aspects of the hemi-diaphragm. 11) Posterior-Central (PC) represents the mean of 6 points (2×3) in the posterior 2 rows and LR central 3 columns through the hemi-diaphragm. 12) Central-Lateral (CL) represents the mean of 6 points (3×2) in the AP central 3 rows and the 2 columns through the lateral hemi-diaphragm. 13) Central-Medial (CM) represents the mean of 6 points (3×2) in the AP central 3 rows and the 2 columns through the medial hemi-diaphragm.
To compare for statistically significant differences between the motion and curvature of the right and left hemi-diaphragms, we used homologous regions (for example, right posterior-medial and left posterior-medial) to compare corresponding components of the hemi-diaphragms with paired T-test, where p < 0.05 is considered to denote statistical significance.
3. EXPERIMENTS AND RESULTS
The mean and standard deviation (SD) of average velocities for right and left hemi-diaphragms obtained from dMRI in the cohort of 51 normal children are listed in Table 1 for the 13 regions. From the table, we may observe that the posterior-central portions of the hemi-diaphragms appear to have the maximal average velocities, and that the points along the diaphragm anterior edges tend to move slower.
Table 1:
Mean and standard deviation (SD) of average velocities (mm/s) for right and left hemi-diaphragms obtained from dMRI in a cohort of 51 normal children, along with p values of left-right comparisons for different homologous regions.
| Right hemi-diaphragm | Velocity (mean, SD) | Left hemi-diaphragm | Velocity (mean, SD) | P value | ||
|---|---|---|---|---|---|---|
| Anterior | 5.06 | 2.04 | Anterior | 3.73 | 1.75 | <0.0001 |
| Posterior | 8.74 | 3.69 | Posterior | 7.32 | 3.09 | 0.0070 |
| Lateral | 7.33 | 3.52 | Lateral | 5.99 | 3.68 | 0.0106 |
| Medial | 5.80 | 3.04 | Medial | 4.52 | 2.54 | 0.0135 |
| Central | 7.72 | 2.89 | Central | 5.96 | 2.85 | 0.0018 |
| Anterior-Lateral | 5.62 | 3.19 | Anterior-Lateral | 4.39 | 3.21 | 0.0106 |
| Anterior-Medial | 4.28 | 2.27 | Anterior-Medial | 2.86 | 1.94 | 0.0002 |
| Anterior-Central | 5.30 | 2.08 | Anterior-Central | 3.64 | 1.87 | <0.0001 |
| Posterior-Lateral | 8.87 | 4.10 | Posterior-Lateral | 7.36 | 4.36 | 0.0094 |
| Posterior-Medial | 7.40 | 4.27 | Posterior-Medial | 6.38 | 3.82 | 0.1790 |
| Posterior-Central | 9.83 | 4.38 | Posterior-Central | 8.18 | 4.28 | 0.0571 |
| Central-Lateral | 7.60 | 3.59 | Central-Lateral | 6.31 | 3.84 | 0.0219 |
| Central-Medial | 5.77 | 2.98 | Central-Medial | 4.45 | 2.39 | 0.0053 |
We observed that most regions of the right hemi-diaphragm have higher velocities compared to those of the left hemi-diaphragm. We also compared the p-value of all these 13 parameters taken together of left-right comparison with paired T-test, which was 9.0830e-12.
For the curvatures, the mean curvatures for right and left hemi-diaphragms obtained from the same data set are listed in Table 2. Here we show only sagittal curvatures. Coronal curvatures behave similarly although the differences in them between the left and right hemi-diaphragms are far fewer.
Table 2:
Mean sagittal curvatures (#pixel−1) for right and left hemi-diaphragms obtained from dMRI in a cohort of 51 normal children, along with p values of left-right comparisons for different homologous regions.
| Right hemi-diaphragm | Mean Curvature (EE) | Mean Curvature (EI) | Left hemi-diaphragm | Mean Curvature (EE) | Mean Curvature (EI) | P-Value (EE) | P-Value (EI) |
|---|---|---|---|---|---|---|---|
| Anterior | 0.0019 | 0.0031 | Anterior | 0.0025 | 0.0023 | <0.0001 | <0.0001 |
| Posterior | 0.0021 | 0.0028 | Posterior | 0.0025 | 0.0020 | <0.0001 | <0.0001 |
| Lateral | 0.0025 | 0.0031 | Lateral | 0.0027 | 0.0023 | 0.6083 | 0.0462 |
| Medial | 0.0023 | 0.0021 | Medial | 0.0021 | 0.0025 | <0.0001 | <0.0001 |
| Central | 0.0025 | 0.0026 | Central | 0.0027 | 0.0029 | 0.0001 | 0.0005 |
| Anterior-Lateral | 0.0025 | 0.0053 | Anterior-Lateral | 0.0040 | 0.0044 | <0.0001 | <0.0001 |
| Anterior-Medial | 0.0032 | 0.0035 | Anterior-Medial | 0.0033 | 0.0033 | <0.0001 | <0.0001 |
| Anterior-Central | 0.0021 | 0.0031 | Anterior-Central | 0.0030 | 0.0027 | <0.0001 | <0.0001 |
| Posterior-Lateral | 0.0026 | 0.0034 | Posterior-Lateral | 0.0031 | 0.0029 | <0.0001 | 0.0112 |
| Posterior-Medial | 0.0039 | 0.0039 | Posterior-Medial | 0.0037 | 0.0037 | 0.0012 | 0.0140 |
| Posterior-Central | 0.0027 | 0.0039 | Posterior-Central | 0.0033 | 0.0025 | <0.0001 | <0.0001 |
| Central-Lateral | 0.0041 | 0.0036 | Central-Lateral | 0.0042 | 0.0034 | 0.8257 | 0.2907 |
| Central-Medial | 0.0038 | 0.0034 | Central-Medial | 0.0033 | 0.0041 | <0.0001 | <0.0001 |
From our analysis, we observe many more significant differences in the sagittal curvatures of homologous portions of the left and right hemi-diaphragms than in the coronal curvatures.
4. CONCLUSION
In this paper, following 4D image construction and manual delineation of the diaphragm from sagittal dynamic MR images at end-inspiration and end-expiration in a cohort of 51 normal children, we propose a novel method to quantitatively analyze the regional motion and curvature of the diaphragm. Firstly, we select 25 homologous points uniformly on each hemi-diaphragm. Then, we summarize the quantitative measurements from 13 regional mean velocity measures obtained from each hemi-diaphragm. With the proposed method, we can quantitatively analyze the motion of the diaphragm regionally, which may be of value in many clinical applications. We observed that the regional velocities of the right hemi-diaphragm were almost always statistically significantly greater than those of the left hemi-diaphragm. We also observed more significant differences in sagittal curvatures than in coronal curvatures of homologous portions of the left and right hemi-diaphragms. Using this methodology, future larger scale prospective studies may be considered to confirm our findings in normal subjects and to quantitatively assess regional and global diaphragmatic dysfunction when various disease conditions are present.
5. ACKNOWLEDGMENT
This research is supported by a grant from the National Institutes of Health R01HL150147.
REFERENCES
- [1].Crompton G, “A brief history of inhaled asthma therapy over the last fifty years,” Primary care respiratory journal 15(6), 326 (2006). [DOI] [PMC free article] [PubMed] [Google Scholar]
- [2].Fayssoil A, Behin A, Ogna A, Mompoint D, Amthor H, Clair B, Laforet P, Mansart A, Prigent H, Orlikowski D, Stojkovic T, Vinit S, Carlier R, Eymard B, Lofaso F, & Annane D, “Diaphragm: Pathophysiology and Ultrasound Imaging in Neuromuscular Disorders,” Journal of neuromuscular diseases 5(1), 1–10 (2018). [DOI] [PMC free article] [PubMed] [Google Scholar]
- [3].Mead JERE, and Loring SH, “Analysis of volume displacement and length changes of the diaphragm during breathing,” Journal of Applied Physiology 53(3), 750–755 (1982). [DOI] [PubMed] [Google Scholar]
- [4].Iwasawa T, Kagei S, Gotoh T, Yoshiike Y, Matsushita K, Kurihara H, Saito K, and Matsubara S., “Magnetic resonance analysis of abnormal diaphragmatic motion in patients with emphysema,” European Respiratory Journal 19(2), 225–231 (2002). [DOI] [PubMed] [Google Scholar]
- [5].Nason LK, Walker CM, McNeeley MF, Burivong W, Fligner CL, & Godwin JD, “Imaging of the diaphragm: anatomy and function,” Radiographics 32(2), E51–E70 (2012). [DOI] [PubMed] [Google Scholar]
- [6].Campbell Robert M Jr Smith Melvin D, Mayes Thomas C, Mangos John A, Willey-Courand Donna B, Kose Nusret, Pinero Ricardo F, Alder Marden E, Duong Hoa L, and Surber Jennifer L. The effect of opening wedge thoracostomy on thoracic insufficiency syndrome associated with fused ribs and congenital scoliosis. JBJS, 86(8):1659–1674, 2004. [DOI] [PubMed] [Google Scholar]
- [7].Campbell Robert M Jrand Smith Melvin D. Thoracic insufficiency syndrome and exotic scoliosis. JBJS, 89:108–122, 2007. [DOI] [PubMed] [Google Scholar]
- [8].Tong Y, Udupa JK, Ciesielski KC, Wu C, McDonough JM, Mong DA, and Campbell RM Jr, “Retrospective 4D MR image construction from free-breathing slice acquisitions: A novel graph-based approach,” Medical image analysis 35, 345–359 (2017). [DOI] [PMC free article] [PubMed] [Google Scholar]
- [9].Cai J, Chang Z, Wang Z, Paul Segars W, and Yin F-F, “Four-dimensional magnetic resonance imaging (4D-MRI) using image-based respiratory surrogate: a feasibility study,” Medical physics 38(12), 6384–6394 (2011). [DOI] [PMC free article] [PubMed] [Google Scholar]
- [10].Hao Y, Udupa JK, Tong Y, Wu C, Li H, McDonough JM, Torigian DA, and Cahill PJ, “4D image construction from free-breathing MRI slice acquisitions of the thorax based on a concept of flux”, Proc. SPIE 11312, Medical Imaging 2020: Physics of Medical Imaging, 113122K (16 March 2020). [DOI] [PMC free article] [PubMed] [Google Scholar]
- [11].Hao Y, Udupa JK, Tong Y, Wu C, Li H, McDonough JM, Lott C, Qiu C, Galagedera N, Anari JB and Torigian DA, 2021. OFx: A method of 4D image construction from free-breathing non-gated MRI slice acquisitions of the thorax via optical flux. Medical Image Analysis, 72, p.102088. [DOI] [PMC free article] [PubMed] [Google Scholar]


