

Abstract
Background:
We’ve shown that combined caloric restriction (CR) and aerobic exercise training (AT) improve peak exercise O2 consumption (VO2peak); and quality-of-life (QOL) in older patients with obese heart failure with preserved ejection fraction (HFpEF). However, ~35% of weight lost during CR+AT was skeletal muscle (SM) mass. We examined whether addition of resistance training (RT) to CR+AT would reduce SM loss and further improve outcomes.
Methods:
Randomized, controlled, single-blind, 20-week trial of RT+CR+AT vs. CR+AT in 88 patients with chronic HFpEF and body mass index (BMI) ≥28 kg/m2. Outcomes at 20 weeks included: the primary outcome (VO2peak); MRI and dual X-ray absorptiometry; leg muscle strength and quality (leg strength ÷ leg SM area); Kansas City Cardiomyopathy Questionnaire (KCCQ).
Results:
77 participants completed the trial. RT+CR+AT and CR+AT produced non-significant differences in weight loss: mean (95% CI): −8(−9,−7) versus −9(−11,−8) (p=0.21). RT+CR+AT and CR+AT had non-significantly differences in the reduction of body fat [−6.5(−7.2,−5.8) versus −7.4(−8.1,−6.7) kg] and SM [−2.1(−2.7,−1.5) versus −2.1(−2.7,−1.4) kg] (p=0.20 and 0.23, respectively). RT+CR+AT produced significantly greater increases in leg muscle strength [4.9(0.7,9.0) versus −1.1(−5.5,3.2) Nm, p=0.05] and leg muscle quality [0.07(0.03,0.11) versus 0.02(−0.02,0.06) Nm/cm2, p=0.04]. Both RT+CR+AT and CR+AT produced significant improvements in VO2peak [108(958,157) versus 80(30,130) ml/min; p=0.001 and 0.002, respectively], and KCCQ score [17(12,22) versus 23(17,28); p=0.001 for both], with no significant between-group differences. Both RT+CR+AT and CR+AT significantly reduced LV mass and arterial stiffness. There were no study-related serious adverse events.
Conclusion:
In older obese HFpEF patients, CR+AT produces large improvements in VO2peak and QOL. Adding RT to CR+AT increased leg strength and muscle quality without attenuating SM loss or further increasing VO2peak or QOL.
Registration:
ClincalTrials.gov Identifier: NCT02636439
Keywords: Diastolic heart failure, Heart Failure, Elderly, Obesity, Exercise, Resistance Training
Introduction
Heart failure with preserved ejection fraction (HFpEF) is the most common form of HF, particularly among older persons and women, and is increasing in prevalence1–4 Even when stable and well-compensated, patients with chronic HFpEF have severe exercise intolerance, with exertional dyspnea and fatigue, and this is associated with severely reduced quality-of-life (QOL).5–8 However, other than diet and exercise, there are relatively few proven treatments for exercise intolerance in HFpEF.9–12
Obesity is one of the strongest risk factors for HFpEF2,5,13–15 and ~85% of HFpEF patients are overweight/obese, such that ‘obese/metabolic HFpEF’ is the most common HFpEF phenotype.5,11,16 compared to non-obese HFpEF patients, those with the obese HFpEF phenotype have worse symptoms, exercise capacity, hemodynamic abnormalities, and QOL.17 We have shown that patients with obese HFpEF have reduced skeletal muscle mass and increased thigh muscle fat infiltration and intra-abdominal fat mass, all of which are related to their reduced exercise capacity.5,11,16–21
In a prior trial,11 we showed that in patients with obese HFpEF, both caloric restriction (CR) and aerobic exercise training (AT) significantly increased VO2peak, and their effects were additive. These data supported combined CR+AT as a novel treatment to improve exercise intolerance and QOL in older patients with obese HFpEF. However, ~35% of the weight lost (=2.5 kg) during CR was skeletal muscle mass (SM), and this was not attenuated by the addition of AT.11 The loss of SM is of concern as it may attenuate gains in exercise capacity and has been associated with increased risk of frailty, physical disability, injuries, hospitalizations, and death.22–26 Thus, strategies to further increase VO2peak during CR+AT by preserving skeletal muscle mass, strength, and muscle quality in HFpEF warrant further investigation. Multiple lines of evidence indicate that resistance training (RT) could be an ideal addition to CR+AT for HFpEF.16–18, 20–25 In HF with reduced EF (HFrEF), RT improves VO2peak to a similar degree as AT.26,27 In older adults and patients with HFrEF, RT increases muscle mass, strength, and muscle quality significantly more than AT.28–29 However, despite these potential advantages, the addition of RT to AT, CR, or their combination has not been formally evaluated in patients with HFpEF. Furthermore, there have been concerns that RT may have potential deleterious consequences in HFpEF by further increasing blood pressure, LV hypertrophy and arterial stiffening.30
Thus, the purpose of this controlled, randomized, single-blind trial was to determine whether adding RT to CR+AT in obese older HFpEF patients further improves VO2peak (primary outcome), and leg muscle mass, strength and quality, QOL, and LV structure/function and arterial function (secondary outcomes).
Methods
The trial was conducted at Wake Forest University School of Medicine from 2015–2021, institutional review board approved, and registered (NCT02636439). Participants provided written informed consent. The data that support the findings of this study are available from the corresponding author upon reasonable request.
Study Participants
Potential participants were interviewed and examined by a board-certified cardiologist who verified the diagnosis of HF and participant qualification. As previously described and in accord with the ACC/AHA definition of HFpEF,2,8,10,11 key inclusion criteria were: symptoms and signs of HFLV EF≥50%; age≥60 years; body mass index (BMI)≥28 kg/m2; and either NHANESHF score ≥331 or the criteria of Rich et al,32 or both. Major exclusion criteria were: prior history of reduced LV EF (<45%); significant ischemic or valvular heart disease; or any other disorder that could explain the participants’ symptoms. Participants were clinically stable and were not undergoing regular exercise or diet programs prior to enrollment.
Outcomes
Primary Outcomes
Outcomes were assessed by personnel who were blinded to participant group assignment at baseline and after the 20-week intervention. VO2peak (in ml/min) was determined by expired gas analysis (Ultima, Medical Graphics) and obtained during the last 30 seconds of exercise on a treadmill (Modified Naughton Protocol) to exhaustion.11
Secondary Outcomes
Total body fat and lean mass were measured by using dual x-ray absorptiometry (DXA, Hologic Inc.).11 Scans of the thigh, abdomen, and heart were performed by magnetic resonance imaging (MRI) as previously described.11 Cross-sectional areas of skeletal muscle (SM), subcutaneous fat (SCF), intramuscular fat (IMF), and bone were measured at the mid-thigh of the left leg. Total thigh area was calculated as the sum of SCF, IMF, SM and bone, and thigh compartment (TC) area was calculated as the sum of SM, IMF, and bone. A slice at the second lumbar vertebra was used to determine abdominal fat measurements, including SCF, visceral and intraperitoneal and retroperitoneal fat. Epicardial and paracardial fat volumes, were assessed by MRI as previously described.11
Knee extensor strength (Nm) was assessed by isokinetic dynamometry (Biodex Medical Systems, Inc., Shirley, NY) at 60° per second with participant seated and hips and knees flexed at 90° as previously described.11,33 Participants performed four repetitions; two trials on each leg. Peak torque (Nm) for the dominant leg were used in analyses. SM quality was calculated as the ratio of knee extensor strength to thigh muscle area assessed by MRI (Nm/cm2).11,34 Six-Minute Walk Distance (6MWD) was measured according to the American Thoracic Society and the Short Physical Performance Battery (SPPB) was conducted as previously described.11,35
Heart failure–specific QOL was assessed with the Kansas City Cardiomyopathy Questionnaire (KCCQ and general QOL was assessed with EuroQOL as well as the 36-item Short-Form Health Survey (SF-36) physical component score.36 Doppler echocardiograms were performed and analyzed per American Society of Echocardiography recommendations. Carotid-femoral pulse-wave velocity were assessed as previously described.11 LV mass and volumes were assessed by cardiac MRI as previously described.11
Randomization
After baseline testing, participants were randomly assigned to either RT+CR+AT or CR+AT, stratified by sex.
Interventions
Caloric Restriction
Participants in both groups were prescribed a hypocaloric diet using meals (lunch, dinner, and snacks) prepared by the Wake Forest Clinical Research Unit Metabolic Kitchen under the direction of a registered dietitian, as previously described and as detailed in the Online Supplement.11,37,38
Aerobic and Resistance Exercise Training
The exercise prescription was based on ACSM and AHA guidelines for older persons and for HFrEF.39,40 and were individualized and progressive. Both groups exercised three times per week for 20 weeks. Warm-up and cool-down phases were ~5–10 min of stretching, flexibility, and light walking. The total stimulus phase of the RT+CR+AT was ~60 minutes (40 min for AT and 20 min for RT). To maintain a similar duration between groups, for the CR+AT group, ~20 min of light chair-based range-of-motion, stretching, and flexibility exercises was included at the end of the 40-minute aerobic exercise sessions; this 20 minute added ‘control period’ provided no resistance or aerobic exercise. Sessions were conducted with medical supervision to ensure safety and a uniform, robust stimulus. To eliminate potential for cross-group contamination, treatment groups exercised at different times.
The AT component was identical for both groups and included walking on an indoor track and/or stationary cycling and was identical to that previously described11 and as detailed in the Online Supplement.
The RT component (for the RT+CR+AT group only) was performed immediately after the AT session with heart rate, blood pressure, and cardiac rhythm monitored before and afterwards.39–40 The RT program was designed to allow a gradual progression so that participants could become familiar with the equipment, minimize muscle soreness, and reduce potential for injury. In accordance with published recommendations,39,40 and to optimize the RT stimulus for maximal functional gains, the exercise prescription was based on a relative intensity level and progressed at a rate specific to the individual’s strength gains. The RT consisted of two upper body (chest press and compound row) and four lower body (leg extension and flexion, seated leg press, and calf plantar flexion) on Nautilus RT equipment. For the initial three weeks, one set of 8–12 repetitions was performed for each RT exercise which then progressed to two sets of each after four weeks. Using a 2:1 recovery- exercise ratio (1 min recovery after 30 sec RT), the RT (12 total sets of RT exercises) required a total of ~20 minutes. The initial resistance setting on each piece of equipment began at 20–30% of participants’ one repetition maximum (1-RM) but increased to 40–50% of 1-RM after four weeks. During the study, if >12 repetitions were completed on the 2nd set in 2 consecutive sessions, the resistance for that exercise was increased by ~5% for the next session. The 1-RM testing was repeated every 4 weeks to assess gains in strength and to ensure optimal resistance settings.
Statistical Analysis
This 2-arm, randomized, parallel design trial was designed to test the effect of adding RT to a previously tested regimen of CR+AT, using an intention-to-treat analysis, in older patients with obese HFpEF. Analysis on the main outcome of absolute VO2peak (ml/min) collected at week 20 was conducted using analysis of covariance (ANCOVA) with baseline measure, age, and gender as predefined covariates. Similar analyses were performed for all secondary/exploratory outcomes to evaluate treatment effect. A two-sided p-value of 0.05 was used to determine significance. To assess within-group changes, we used constrained linear mixed-effects models (cLMM) adjusted for age and sex. Baseline and 20-week measures were analyzed together as a dependent variable. The models included treatment, visit, and treatment-by-visit interaction under the constraint that the baseline measures are equal across treatment arms to reflect the design of the randomized trial. Within-group differences were estimated using linear contrasts.
Sample size calculations were based on data from our previous trial of CR+AT.11 The square root of the mean square error from an ANCOVA model was estimated to be 107.5 ml/min. In order to have 90% power to detect a relative effect due to RT of 5.6% (absolute difference of 82.0 ml/min) in VO2peak at the 0.05 two-sided level of significance, the study required 38 evaluable participants per group. To allow for 15% loss to follow-up, 44 subjects per group (88 total) were randomized. The sample size also had power to test the secondary outcomes.
Results
As shown in Figure 1, 424 participants were screened by telephone and 132 were scheduled for a screening visit. Ultimately, 88 participants (mean±SD: age, 68±5 years; BMI, 40±6 kg/m2) were enrolled and randomized: RT+AT+RT (n=44) and CR+AT (n=44) (Figure 1). Of these, 77 participants (RT+CR+AT n=39; CR+AT n=38) completed the intervention and had evaluable testing for the primary outcome (Figure 1). Two participants (both RT+CR+AT) were excluded from analysis of the primary outcome: one because exercise effort judged by the blinded tester was clearly submaximal; and one due to malfunctioning expired gas collection. Exercise attendance was 82±8% and diet adherence was 99±1%. There were no study-related serious adverse events. Participant characteristics were in accord with those in population based HFpEF studies (Table1).
Figure 1:
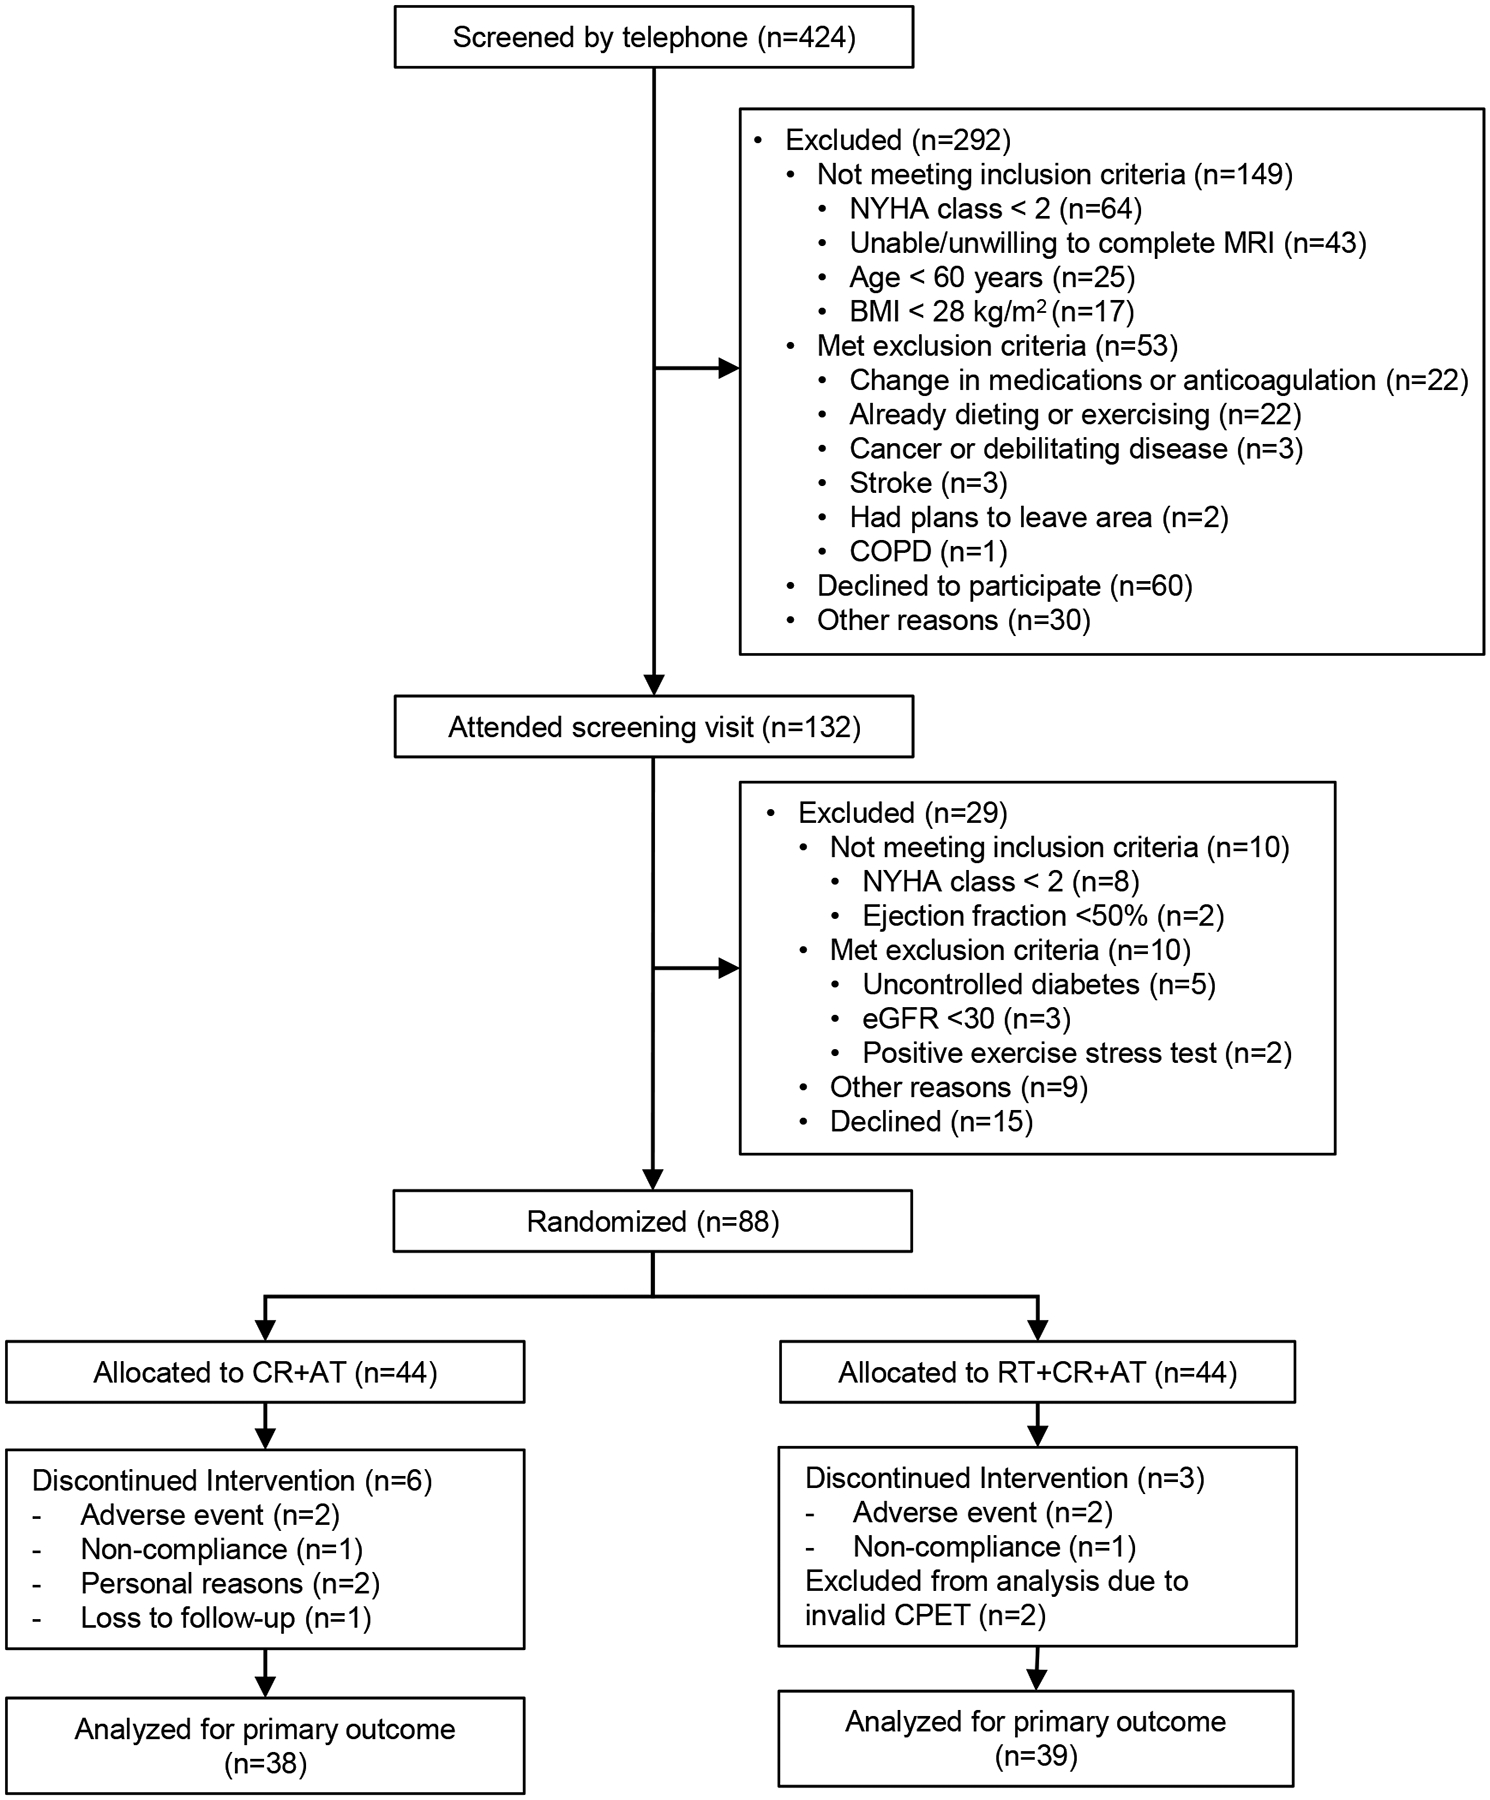
Flow of Participants Through the Study
GFR = Glomerular Filtration Rate
CPET = Cardiopulmonary Exercise Testing
Table 1.
Baseline Characteristics of Treatment Groups at Randomization
| Characteristic | CR + AT (n=44) |
RT + CR + AT (n=44) |
p-value |
|---|---|---|---|
| Age, years | 67.9±5.4 | 69.7±5.8 | 0.13 |
| Women | 37 (84%) | 38 (86%) | 0.76 |
| White | 19 (46%) | 21 (48%) | 0.67 |
| Weight, kg | 106.1±19.6 | 104.3±17.9 | 0.57 |
| Body surface area, m2 | 2.08±0.22 | 2.07±0.20 | 0.80 |
| Body mass index, kg/m2 | 40.0±5.9 | 39.2±5.6 | 0.71 |
| Body fat, % (by DXA) | 50±4 | 49±4 | 0.33 |
| Cardiovascular Measures | |||
| NYHA Class | |||
| II | 15 (34%) | 16 (36%) | 0.82 |
| III | 29 (66%) | 28 (64%) | |
| Ejection fraction, % | 61±5 | 61±6 | 0.63 |
| Relative wall thickness | 0.51±0.09 | 0.52±0.08 | 0.69 |
| Diastolic filling pattern* | |||
| Normal | 1 (2%) | 3 (7%) | 0.47 |
| Impaired relaxation | 38 (86%) | 37 (84%) | |
| Pseudonormal | 5 (11%) | 3 (7%) | |
| Restrictive | 0 (0%) | 1 (2%) | |
| e’, cm/s | 6.4±1.6 | 6.5±2.1 | 0.77 |
| E/e’, ratio | 13.3±6.4 | 13.1±4.5 | 0.89 |
| N-terminal proBNP, pg/mL, median (IQR)† | 55 (42,89) | 100 (55,154) | 0.048 |
| Systolic blood pressure, mmHg | 137±14 | 135±15 | 0.59 |
| Diastolic blood pressure, mmHg | 79±9 | 77±10 | 0.35 |
| Comorbidities | |||
| History of Atrial fibrillation | 0 (0%) | 4 (9%) | 0.041 |
| Diabetes mellitus | 14 (32%) | 20 (45%) | 0.19 |
| Hypertension | 42 (95%) | 42 (95%) | 1.00 |
| Current Medications | |||
| ACE Inhibitor | 8 (18%) | 12 (27%) | 0.31 |
| Angiotensin receptor blocker | 20 (45%) | 15 (35%) | 0.31 |
| Diuretic | 36 (82%) | 36 (84%) | 0.81 |
| B-blocker | 18 (41%) | 17 (40%) | 0.90 |
| Calcium antagonist | 16 (36%) | 19 (44%) | 0.46 |
| Aldosterone antagonist | 2 (5%) | 5 (12%) | 0.22 |
| Nitrate | 2 (5%) | 4 (9%) | 0.38 |
| Insulin | 4 (9%) | 10 (23%) | 0.07 |
| Oral diabetic agents | 11 (25%) | 19 (44%) | 0.06 |
| Metformin | 7 (16%) | 13 (30%) | 0.13 |
| Sulfonylureas | 5 (11%) | 6 (14%) | 0.75 |
| GLP-1 receptor agonist | 0 (0%) | 1 (2%) | 0.31 |
| D-PP4 inhibitor | 1 (2%) | 2 (5%) | 0.56 |
| Antidepressant | 15 (35%) | 11 (26%) | 0.35 |
Data presented as mean±SD or N (%), unless otherwise noted. Abbreviations: ACE: angiotensin-converting enzyme; E, E-wave velocity; e’: early mitral annulus velocity (septal); IQR: interquartile range; NYHA, New York Heart Association; RER: respiratory exchange ratio.
Diastolic filling pattern determined according to American Society of Echocardiography criteria.
Sample size for NT-proBNP collection=27 (N=13 for CR+AT and N=14 for RT+CR+AT)
Primary Outcome
VO2peak increased significantly in both the RT+CR+AT and CR+AT groups (108 vs. 80 mL/min, respectively, which equates to 7% and 5% improvement from baseline) with no significant between-group difference (44 (−25,112) mL/min; p=0.21). Effect sizes for the primary (and key secondary outcomes) are presented in Figure 2 (Central Figure).
Figure 2 Central Figure”:
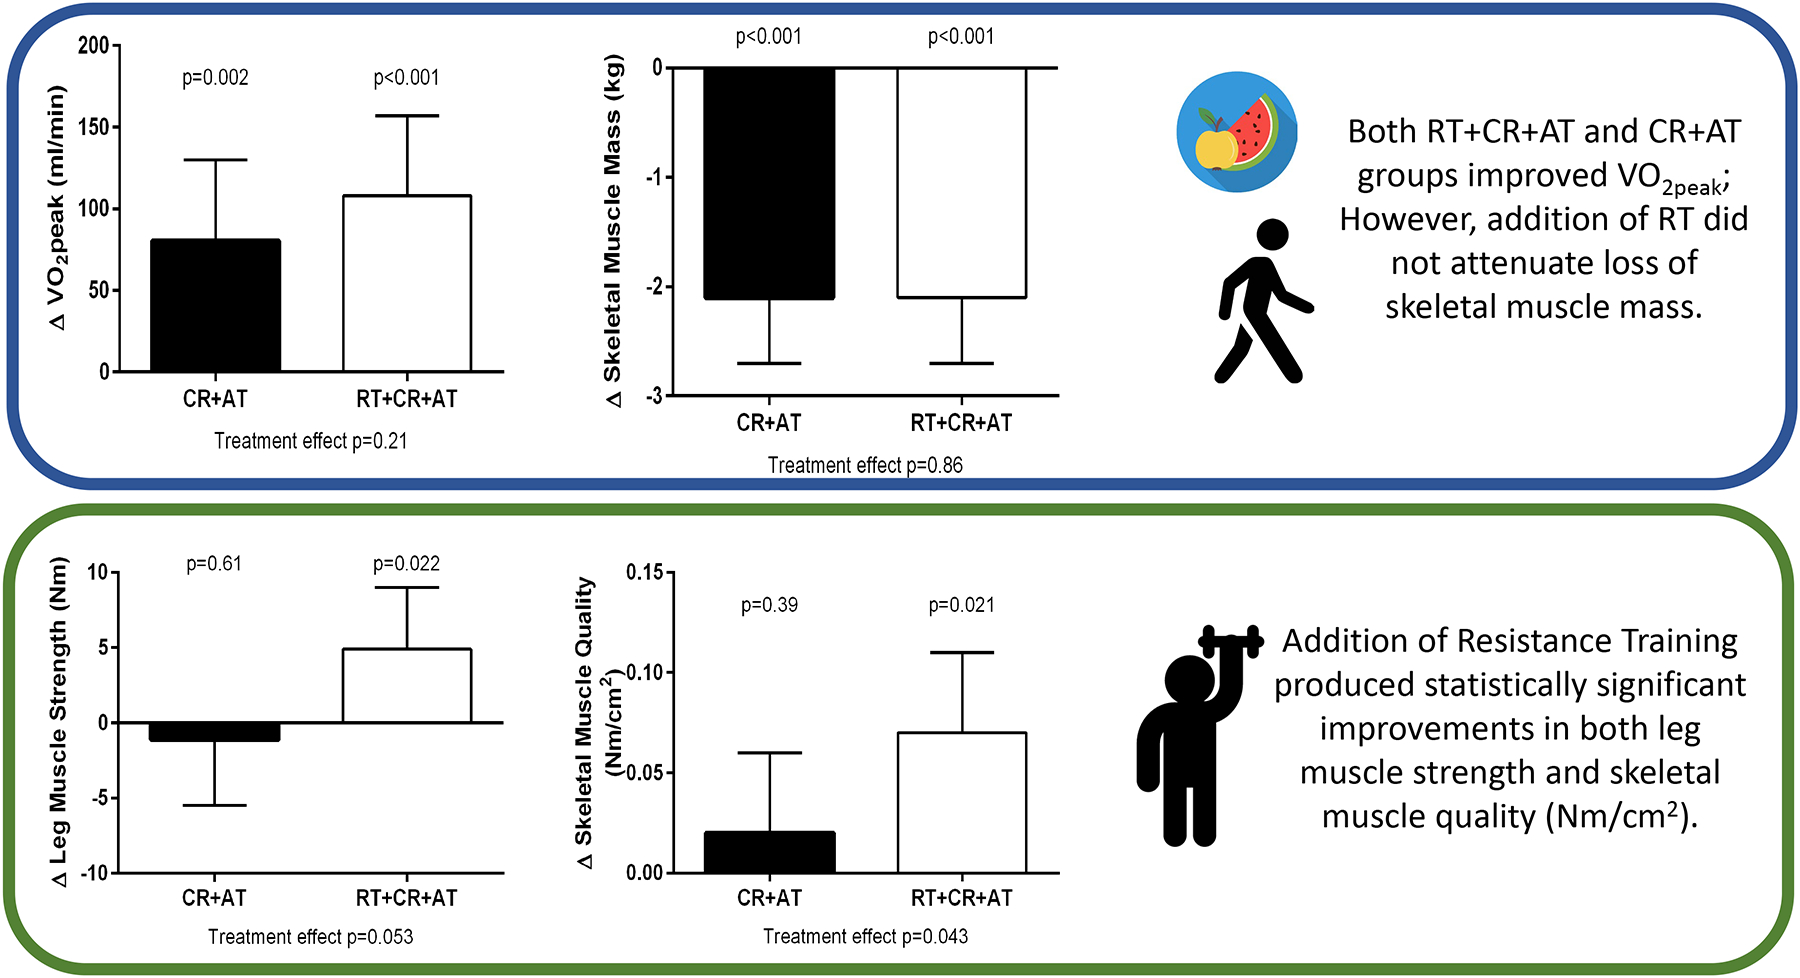
Effect Sizes for the Primary (peak VO2) and Key Secondary Outcomes (strength and body/muscle composition) from Baseline to 20 Week Follow up.
VO2peak m/min = peak exercise oxygen consumption
Secondary Outcomes
Significant within-group improvements, without between-group differences, were also observed for other expressions of exercise capacity or physical function (VO2peak mL/kg/min, VO2peak mL/kg lean body mass/min, VO2peak mL/kg leg lean mass/min, VO2peak mL/cm2 thigh muscle/min, exercise time, peak workload, peak METs, and 6-minute walk distance and SPPB), as well as multiple HF-specific and general QOL measures, NYHA class, and depression scores. (Table 2).
Table 2.
Exercise Performance and Quality of Life Outcomes by Treatment Group
| CR + AT (n=38) |
RT + CR + AT (n=39) |
Treatment Effect Size | p-value | |||||
|---|---|---|---|---|---|---|---|---|
| Exercise Performance | Baseline | Follow-up | Within group Change (95% CI) |
Baseline | Follow-up | Within group Change (95% CI) |
Between Group Difference (95%CI) |
|
| VO2peak mL/min | 1529±375 | 1609 (1561,1657) | 80 (30,130)* | 1530±366 | 1653 (1605,1700) | 108 (58,157)** | 44 (−25,112) | 0.21 |
| VO2peak mL/kg/min | 14.6±2.9 | 16.8 (16.3,17.4) | 2.2 (1.7,2.7)** | 14.8±2.9 | 17.1 (16.6,17.6) | 2.4 (1.9,2.9)** | 0.3 (−0.5,1.0) | 0.48 |
| VO2peak mL/kg lean body mass/min | 30.0±5.5 | 32.5 (31.5,33.5) | 2.9 (1.9,3.8)** | 29.7±5.1 | 33.3 (32.4,34.3) | 3.4 (2.5,4.4)** | 0.7 (−0.7, 2.1) | 0.30 |
| VO2peak mL/kg leg lean mass/min | 94.1±17.8 | 98.4 (96.7,100.1) | 4.9 (3.2,6.6)** | 92.6±18.0 | 98.8 (97.1,100.4) | 5.2 (3.5,6.9)** | 0.4 (−2.0, 2.8) | 0.74 |
| VO2peak mL/cm2 thigh muscle/min | 14.1±2.9 | 15.0 (14.5,15.5) | 1.1 (0.6,1.6)** | 13.6±2.3 | 15.3 (14.8,15.8) | 1.3 (0.8,1.8)** | 0.3 (−0.4,1.0) | 0.40 |
| Exercise time, min | 9.2±2.4 | 11.3 (10.8,11.8) | 2.2 (1.7,2.6)** | 9.2±2.4 | 11.4 (10.9,11.9) | 2.3 (1.8, 2.6)** | 0.1 (−0.6, 0.8) | 0.83 |
| METs | 5.5±1.2 | 6.5 (6.2,6.7) | 1.1 (0.8,1.3)** | 5.4±1.2 | 6.6 (6.4,6.8) | 1.2 (1.0,1.4)** | 0.1 (−0.2, 0.5) | 0.49 |
| Peak heart rate, beats/min | 142±21 | 136 (133,140) | −1 (−4,3) | 130±22 | 139 (136,142) | 3 (−1,7) | 2 (−2,7) | 0.32 |
| Peak systolic blood pressure, mmHg | 181±18 | 179 (173,186) | −6 (−12,1) | 187±21 | 177 (171,183) | −8 (−14,−1)* | −2 (−11,7) | 0.63 |
| Peak diastolic blood pressure, mmHg | 81±10 | 72 (69,75) | −7 (−10, −4)** | 77±30 | 73 (71,76) | −6 (−9,−3)** | 1 (−3,5) | 0.54 |
| Peak RER | 1.08±0.10 | 1.11 (1.08,1.14) | 0.01 (−0.02,0.05) | 1.10±0.16 | 1.11 (1.08,1.14) | 0.02 (−0.02,0.06) | 0.00 (−0.04,0.04) | 0.94 |
| VE/VCO2 slope | 28.3±4.4 | 28.2 (27.4,29.0) | −0.9 (−1.7, −0.1)* | 29.6±3.8 | 28.5 (27.8,29.4) | −0.4 (−1.2,0.4) | 0.3 (−0.8,1.4) | 0.62 |
| 6-minute walk distance, m | 364±67 | 419 (405,434)** | 61 (47,76) | 353±74 | 405 (391,419)** | 47 (33,60) | −14 (−34,6) | 0.16 |
| SPPB Score | 9.8±1.3 | 10.2 (9.8,10.7)** | 0.8 (0.3,1.2) | 9.1±2.0 | 10.2 (9.8,10.6)** | 0.8 (0.4,1.3)** | 0.0 (−0.6,0.6) | 0.99 |
| Leg strength, Nm | 105.8±29.8 | 97.5 (92.8,102.1) | −1.1 (−5.5,3.2) | 89.5±27.0 | 103.9 (99.5,108.3)* | 4.9 (0.7,9.0)* | 6.4 (−0.1,12.9) | 0.053 |
| Leg muscle quality Nm/cm2 | 0.96±0.18 | 0.90 (0.86,0.95) | 0.02 (−0.02,0.06) | 0.80±0.23 | 0.97 (0.93,1.01)* | 0.07 (0.03,0.11)* | 0.07 (0.00,0.13) | 0.043 |
| Quality of Life | ||||||||
| KCCQ Score | ||||||||
| Overall | 68±19 | 91 (88,95) | 23 (17,28)** | 70±19 | 87 (83,90)** | 17 (12,22)** | −5 (−10,0) | 0.07 |
| Clinical | 71±17 | 91 (87,95) | 20 (15,25)** | 71±19 | 86 (83,90)** | 15 (10,20)** | −5 (−10,1) | 0.09 |
| Physical | 72±19 | 91 (88,96) | 20 (14,26)** | 72±20 | 87 (83,91)** | 15 (9,20)** | −5 (−11,1) | 0.08 |
| Social | 70±26 | 95 (90,100) | 25 (17,33)** | 72±25 | 89 (84,93)** | 18 (11,26)** | −6 (−13,0) | 0.07 |
| QOL | 60±25 | 88 (84,93) | 26 (19,33)** | 65±25 | 84 (79,88)** | 20 (13, 27)** | −5 (−11,2) | 0.16 |
| Symptoms | 70±19 | 90 (86,95) | 20 (14,26)** | 70±21 | 86 (82,90)** | 16 (10,21)** | −4 (−10,2) | 0.16 |
| SF-36 | ||||||||
| Physical composite score | 37±9 | 47 (45,50) | 10 (7,13)** | 38±9 | 47 (44,50)** | 9 (7,12)** | −1 (−4,3) | 0.79 |
| Mental composite score | 53±9 | 57 (55,60) | 4 (1,7)* | 53±12 | 57 (55,59)* | 3 (0,6)* | 0 (−4,3) | 0.95 |
| EuroQol Thermometer | 72±15 | 84 (80,88) | 14 (9,18)** | 70±17 | 82 (78,85)** | 11 (7,16)** | −2 (−7,3) | 0.42 |
| CES-D Score | 10±6 | 6 (5,8) | −3 (−5, −1)* | 9±7 | 7 (5,9)* | −2 (−4,−0)* | 1 (−2,3) | 0.66 |
| NYHA Class | 2.7±0.5 | 1.7 (1.6,1.9) | −1.0 (−1.1, −0.8)** | 2.6±0.5 | 1.8 (1.6,1.9)** | −0.9 (−1.0,−0.7)** | 0.1 (−0.1,0.3) | 0.53 |
Baseline data presented as mean±SD. Follow-up data presented as LSMeans (95%CI) adjusted for baseline value, age, and sex from ANCOVA. Within-group change estimates derived from cLMM. Abbreviations: CES-D: Centers for Epidemiologic Studies Depression Scale; KCCQ: Kansas City Cardiomyopathy Questionnaire; MET: metabolic equivalent; Nm: Newton-meter; NYHA: New York Heart Association; SF-36: Short Form 36-item Health Survey; SPPB: Short Physical Performance Battery; RER: respiratory exchange ratio; VAT: ventilatory anaerobic threshold; VE/VCO2: ventilatory equivalent for carbon dioxide; VO2, volume of oxygen consumption.
significant at p<0.05
significant at p<0.001
The total weight loss (Table 3) of −8 versus −9 kg (8% vs. 9%) was significant in both the RT+CR+AT and CR+AT groups, respectively. DXA revealed that both the RT+CR+AT and CR+AT groups lost significant amounts of body fat (−6.5 vs. −7.4 kg; a decrease of 12% vs. 13%), percent body fat (−2.2% vs. −2.5%), and SM (−2.1 vs. −2.1 kg), respectively. However, the percentage of SM (relative to total body weight) increased significantly in both groups (2.0% vs. 2.5%, respectively). There were no significant between-group differences for these DXA derived body composition measurements.
Table 3.
Body Composition and Cardiac Function Outcomes by Treatment Group
| CR + AT (n=38) |
RT + CR + AT (n=39) |
Treatment Effect Size | p-value | |||||
|---|---|---|---|---|---|---|---|---|
| Body Composition | Baseline | Follow-up | Within group Change (95% CI) |
Baseline | Follow-up | Within group Change (95% CI) |
Between Group Difference (95% CI) |
|
| Weight, kg | 106±20 | 96 (95,97) | −9 (−11, −8)** | 104±18 | 97 (96,98) | −8 (−9, −7)** | 1 (−1,3) | 0.21 |
| DXA Measurements | ||||||||
| Skeletal muscle, kg | 51.6±10.8 | 49.4 (48.8,50.1) | −2.1 (−2.7, −1.4)** | 51.8±9.5 | 49.4 (48.8,50.0) | −2.1 (−2.7, −1.5)** | −0.1 (−1.0,0.8) | 0.86 |
| Fat, kg | 53.0±10.5 | 45.2 (44.3,46.0) | −7.4 (−8.1, −6.7)** | 51.3±10.6 | 46.0 (45.1,46.8) | −6.5 (−7.2, −5.8)** | 0.8 (−0.4,2.0) | 0.20 |
| Skeletal muscle, % | 48.2±4.0 | 51.0 (50.6,51.4) | 2.3 (1.8, 2.7)** | 49.2±4.2 | 50.6 (50.2,51.1) | 2.0 (1.6,2.5)** | −0.4 (−1.0,0.2) | 0.23 |
| Fat, % | 49.6±4.1 | 46.5 (46.1,47.0) | −2.5 (−3.0, −2.1)** | 48.6±4.5 | 46.9 (46.5,47.4) | −2.2 (−2.7, −1.8)** | 0.4 (−0.2,1.1) | 0.19 |
| MRI Measurements | ||||||||
| Thigh | ||||||||
| Subcutaneous fat, cm2 | 181±64 | 141 (136,145) | −24 (−29, −19)** | 162±71 | 141 (136,145) | −24 (−29, −18)** | 0.2 (−6.2,6.6) | 0.95 |
| Skeletal muscle, cm2 | 111±30 | 109 (106,111) | −3 (−5, −1)* | 113±21 | 109 (107,111) | −3 (−5, −1)* | 0.5 (−2.8,3.8) | 0.77 |
| Intramuscular fat, cm2 | 34±11 | 29 (28,30) | −4 (−5,−3)** | 32±10 | 30 (29,31) | −4 (−5, −3)** | 0.3 (−1.1,1.9) | 0.66 |
| SM:IMF ratio | 3.5±1.1 | 4.0 (3.8,4.2) | 0.4 (0.2,0.6)** | 3.7±1.1 | 4.0 (3.8,4.1) | 0.4 (0.2,0.5)** | 0 (−0.3,0.2) | 0.85 |
| Abdominal | ||||||||
| Subcutaneous fat, cm2 | 375±121 | 326 (315,338) | −58 (−71,−45)** | 400±110 | 329 (319,340) | −57 (−6, −45)** | 3 (−13,19) | 0.72 |
| Visceral fat, cm2 | 194±106 | 165 (156,174) | −36 (−48, −25)** | 194±89 | 172 (163,180) | −30 (−40, −20)** | 6 (−6,19) | 0.29 |
| Epicardial fat, cm2 | 24.1±13.2 | 25.9 (22.9,28.9) | 0.5 (−2.6,3.6) | 25.3±9.8 | 25.0 (22.5,27.5) | −0.5 (−3.2,2.2) | −0.9 (−4.9,3.0) | 0.64 |
| Paracardial fat, cm2 | 24.0±13.8 | 24.9 (21.8,27.9) | −0.1 (−3.5,3.3) | 24.6±12.9 | 23.6 (21.1,26.2) | −1.0 (−3.9,1.9) | −1.2 (−5.2,2.8) | 0.55 |
| Pericardial fat, cm2 | 48.1±26.4 | 50.8 (45.5,56.0) | 0.2 (−5.4,5.9) | 49.9±21.4 | 48.6 (44.2,53.1) | −1.8 (−9.1,5.5) | −2.1 (−9.0,4.8) | 0.54 |
| Cardiac Function | ||||||||
| MRI Measurements | ||||||||
| LV mass, g | 101±20 | 100 (98,103) | −3 (−5, −1)* | 107±21 | 102 (100,104) | −1 (−3,1) | 1 (−2,5) | 0.37 |
| End-diastolic volume, mL | 126±25 | 123 (119,127) | −5 (−9,0)* | 135±26 | 123 (120,127) | −5 (−9—,1)* | 0 (−5,6) | 0.89 |
| LV mass/end-diastolic volume | 0.81±0.13 | 0.82 (0.79,0.85) | 0.00 (−0.03,0.03) | 0.80±0.13 | 0.83 (0.80,0.86) | 0.02 (−0.01,0.05) | 0.01 (−0.03,0.05) | 0.49 |
| Ejection fraction, % | 61±5 | 61 (60,62) | 0 (−1,1) | 61±6 | 60 (59,61) | −1 (−2,0) | −1 (−2,1) | 0.36 |
| Echo-Doppler Measurements | ||||||||
| LV mass, g | 204±50 | 190 (179,200) | −14 (−25,−3)* | 202±47 | 191 (181,202) | −11 (−22, −1)* | 2 (−13,17) | 0.82 |
| Relative wall thickness | 0.51±0.09 | 0.53 (0.50,0.55) | 0.02 (−0.01,0.04) | 0.52±0.08 | 0.52 (0.50,0.55) | 0.00 (−0.02,0.03) | −0.01 (−0.04,0.03) | 0.66 |
| Left atrium diameter, cm | 3.9±0.6 | 4.0 (3.8,4.1) | 0.1 (−0.0,0.2) | 3.9±0.6 | 3.9 (3.8,4.0) | 0.0 (−0.1,0.1) | −0.1 (−0.2,0.1) | 0.28 |
| E/A ratio | 0.89±0.32 | 0.92 (0.86,0.99) | 0.06 (−0.00,0.13) | 0.87±0.27 | 0.91 (0.85,0.98) | 0.04 (−0.03,0.10) | −0.01 (−0.10,0.08) | 0.83 |
| e’, cm/s | 6.4±1.6 | 6.3 (5.9,6.6) | −0.1 (−0.6,0.3) | 6.5±2.1 | 6.1 (5.7,6.4) | −0.4 (−0.9,0.0) | −0.2 (−0.7,0.3) | 0.42 |
| E/e’ ratio | 13.3±6.4 | 13.6 (12.5,14.6) | 0.4 (−0.8,1.6) | 13.1±4.5 | 14.1 (13.1,15.2) | 1.2 (0.0,2.3)* | 0.6 (−0.9,2.1) | 0.42 |
| Pulse wave velocity, cm/s† | 1011±256 | 965 (909,1020) | −72 (−144,0) | 1057±352 | 959 (907,1011) | −84 (−152, −16)* | −6 (−83,71) | 0.88 |
Baseline data presented as mean±SD. Follow-up data presented as LS Means±SE (95%CI) adjusted for baseline value, age, and sex from ANCOVA. Within-group change estimates derived from cLMM. Abbreviations: DXA: dual X-ray absorptiometry; SM: skeletal muscle; IMF: intramuscular fat; LV: left ventricular; E: E-wave velocity; E/A: early to atrial filling velocity; e’; early mitral annulus velocity (septal); MRI: magnetic resonance imaging
significant at p<0.05
significant at p<0.001
determined using carotid-femoral artery by Doppler echocardiography
Thigh MRI (Table 3) revealed that both groups significantly decreased SCF area (−23.5 vs. −24.0 cm2; a decrease of 14% vs. 13%), IMF area (−3.6 vs. −4.2 cm2; a decrease of 11% vs. 12%), and SM area (−2.9 vs. −3.0 cm2; a decrease of 2% vs. 2%), respectively. Consequently, thigh skeletal muscle SM:IMF ratio increased significantly in both groups by 1%. There were no significant differences between groups for changes in thigh tissue composition.
Abdominal MRI (Table 3) revealed that abdominal SCF visceral fat decreased significantly within both groups, with no significant between-group differences.
Despite decreased SM in both groups, leg muscle strength improvement was observed in RT+CR+AT (4.9 Nm [5.4%]) but not CR+AT (−1.1 Nm [−1%]) with a between-group difference of 6.4(−0.1,12.9) Nm, p=0.053. Also, muscle quality improved significantly in the RT+CR+AT group (0.07 Nm/cm2=8.7%) but not in CR+AT (0.02 Nm/cm2 = −1%), with a between-group difference of 0.07(0.00,0.13) Nm/cm2, p=0.043.
Both RT+CR+AT and CR+AT significantly reduced LV mass and arterial stiffness with no between-group differences. (Table 3). Epicardial, pericardial, and paracardial fat were all unchanged from baseline to follow-up. (Table 3)
Discussion
This study is the first to examine whether addition of RT to CR+AT in older individuals with obese HFpEF further improves exercise capacity and attenuates loss of SM during CR+AT. In these older patients with obese HFpEF, we achieved excellent adherence to both exercise and dietary interventions and considerable weight reduction. This was associated with clinically meaningful improvements in both physical function and QOL, in accord with our prior trial results.11 This trial significantly extends prior knowledge by demonstrating that addition of RT appeared safe, was well tolerated, and significantly improved leg strength and muscle quality, without further increasing VO2peak or attenuating SM loss. Both RT+CR+AT and CR+AT significantly reduced LV mass and arterial stiffness, potentially important outcomes in HFpEF.
Effect of Adding RT on Exercise Capacity and QOL
VO2peak (ml/min) was the pre-planned primary outcome as it assesses total oxygen utilization during maximal exercise and is not directly influenced by changes in bodyweight. Both had significant, clinically meaningful increases in VO2peak, by 7 and 5%, respectively, without significant between-group difference. When VO2peak was expressed in ml/kg/min, there were improvements of 2.2 and 2.4 ml/kg/min (15% and 16%), in the RT+CR+AT and CR+AT groups, respectively. This magnitude of improvement in indexed peak (ml/kg/min) VO2 is large, and substantially exceeds the clinically meaningful differences of 1.0 mL/kg/min and 10% for this clinical population.41 However, contrary to our hypothesis, addition of RT to CR+AT did not result in further increased VO2peak.
Other secondary measures of exercise performance, including exercise time to exhaustion (2.3 vs. 2.2 minutes; 1 minute is clinically meaningful) and 6-minute walk distance (47 vs. 61 meters; 30 meters is clinically meaningful) also showed large, clinically meaningful, significant improvements in both groups, supporting improved exercise capacity. The Short Physical Performance Battery (SPPB), also improved significantly, by 0.8 units in both groups; clinically meaningful change is 0.6 units.35
While both the disease-specific (KCCQ) and multiple general measures (SF-36; EuroQOL) of QOL improved significantly with CR+AT, the addition of RT did not produce further improvements in these measures. The KCCQ score at baseline (mean of 69) indicated moderately impaired QOL yet both CR+AT and CR+AT+RT groups produced large improvements of 15–20 points during the intervention, greatly exceeding the threshold for clinically meaningful improvement of 5 points, confirming the strong effect of exercise plus dietary weight loss interventions in these patients.11,42 NYHA class by a blinded observer improved as well. Depressive symptoms, measured by the CES-D instrument, also significantly improved.
Effect of Adding RT on Body Weight/Composition
Both RT+CR+AT and CR+AT produced large, significant reductions in body weight, body fat, subcutaneous and visceral fat, and thigh intramuscular fat (IMF), with no between-group differences. By MRI, both groups had significant reductions, with no significant between-group difference in abdominal subcutaneous (15% vs. 14%) and visceral fat (16% vs. 18%), respectively. It is known that a reduction of 5–10% total bodyweight and/or body fat, particularly abdominal visceral fat, has many favorable health benefits in clinical populations, including patients with diabetes and with HFpEF.11,43,44 Despite improved exercise capacity and QOL, there was no significant change in epicardial or pericardial fat by MRI, a robust technique for measuring this outcome.
Most weight loss studies, including our prior trial of CR+AT in obese HFpEF, observed that 30–40% of the weight lost is lean body mass, which is primarily SM tissue.43,45 Skeletal muscle loss is concerning as it may hinder further gains in exercise capacity, reduce basal metabolic rate/caloric expenditure, and has been associated with disability, hospitalizations, and death.23,24,46 Despite providing a guideline-based RT program, and optimal protein intake (≥1.2 gm protein/kg body weight/day), the RT+CR+AT group had no significant difference in SM loss (−2.1 kg) and thigh skeletal muscle area loss (~3 cm2) as the CR+AT group. This outcome was contrary to our hypothesis, as prior studies have shown that RT, in the absence of caloric restriction, increases muscle mass in older adults in general and in patients with HFrEF.27,29 Moreover, RT has been shown to attenuate SM loss during hypocaloric weight loss in healthy adults.47 The mechanisms for the lack of attenuation of SM loss in older patients with obesity and HFpEF, despite the addition of RT, could be catabolism of low quality SM, thereby preserving and enhancing quality of the remaining muscle tissue.
Lower Extremity Muscle Mass, Strength and Quality
Although it has been postulated that reduced SM plays a major role in the age-related decline of strength, initial SM and changes SM explain only a small portion (~5%) of variability of age-related strength decline.48 In Health ABC,49 the loss of SM was associated with the decline in strength in older adults, but the decline in strength was much more rapid than the concomitant loss of SM, suggesting there is a decline in muscle quality during aging. Moreover, maintaining or gaining muscle mass did not appear to prevent aging-associated declines in muscle strength in Health ABC participants.49 The present investigation demonstrated, for the first time in this clinical population, that the addition of RT to CR+AT resulted in a significantly greater improvement in both isokinetic lower extremity strength and skeletal muscle quality. Peak torque during leg extension significantly increased by 16% (89.5 to 103.9 Nm) in the RT+CR+AT but decreased by 8% (105.8 vs. 97.5 Nm) in CR+AT group, indicating that addition of RT completely prevented this loss and even improved muscle strength. Although several studies have demonstrated the positive impact of RT on muscle strength in weight stable patients with HFrEF,26–30 this is the first study to demonstrate that RT can produce improvement in lower limb muscular strength during CR+AT induced weight loss in older patients with obese HFpEF. These positive effects of adding RT may be clinically important given the age of these patients, the concomitant effect of aging, and the additional SM loss due to the HFpEF condition which we previously reported.16–18,23 Indeed, muscle strength is an important clinical outcome among older persons, independent of muscle mass; reduced skeletal muscle strength is strong predictor of a range of adverse outcomes, including nursing home placement and death.
In addition to the well-recognized age and HF-related reductions in SM quantity, there is substantial evidence that SM quality may decrease as well.9,20,21,48. SM quality is as the capacity to generate force relative to the mass/volume of contractile tissue. Declines in SM strength with aging are not completely explained by declines in muscle mass.49,50 While strength alone quantifies the amount of force a muscle can generate, larger muscles are not necessarily stronger. A smaller muscle may be more effective at generating force, due to more contractile proteins, less fat infiltration, or other physiological properties that can alter the quality of the muscle.9,10,48,49 In the present study, lower extremity (quadriceps) skeletal muscle quality, assessed by the ratio of knee extensor strength to thigh muscle area (expressed in Nm/cm2) as previously described,11 improved significantly in RT+CR+AT (by 21%) but did not improve in the CR+AT group. Thus, the current study indicates that during CR+AT induced weight and fat loss, addition of RT can significantly improve muscle quality in older patients with obese HFpEF. Although the clinical importance of muscle quality is less established than muscle strength and mass, because it takes into account both strength and body composition, muscle quality is a highly relevant outcome in older persons23,43.
Impact of RT on Cardiac Structure and Function and Arterial Stiffness
CT+AT resulted in small but significant decreases in LV and end-diastolic volume as well as a nearly significant (p=0.06) increase in LV E/A ratio consistent, with our previous findings.11 Addition of RT resulted in significant improvements with no significant between-group difference in LV mass (by echo) and end-diastolic volume (by MRI). Despite limited evidence, there are lingering concerns that RT may negatively impact LV systolic and/or diastolic function in HF patients via increased blood pressure and LV afterload. While several studies have examined the effect of RT in HFrEF,26–29 this is the first trial to formally test the effects of adding RT to traditional AT in HFpEF. A novel finding was the favorable effects on arterial stiffness, measured by carotid-femoral pulse-wave velocity on Doppler echocardiography, which were observed in both groups. This suggests that the concern that RT may adversely HFpEF by increased afterload may be unfounded. These results suggest that supervised RT, when added to CR+AT, appears to have no adverse effect on cardiac or arterial structure and function, is safe, and was not associated with any exercise-related adverse events. Finally, improved LV mass, end-diastolic volume, and arterial stiffness with CR and exercise are highly relevant to HFpEF where abnormalities in each of these contribute to the pathogenesis and severity of the disorder.
Strengths and Limitations
Strengths of the current study include that it was a randomized, controlled, single-blind clinical trial with a well-defined population of older patients with obese HFpEF, extensive phenotyping including with serial CPET and MRI, professionally administered CR diet, and medically supervised AT and RT with careful and frequent monitoring. Thus, efficacy and safety could differ under other conditions. We did not test effects of RT alone, without concomitant CR +AT. The minimum BMI for study participants was 28, which is based on World Health Organization recommendations for dietary intervention for the general population, and which includes most patients with HFpEF. However, our data do not address safety and efficacy of this intervention in patients with lower BMIs. The participants had typical clinical features of obese HFpEF, including severe exercise intolerance, LV hypertrophy, and LV diastolic dysfunction, 93% were on maintenance diuretics, and met predetermined criteria for HFpEF utilized in prior publications2,8,10.11,31,32 and in accord with 2013 recommendations of the AHA and ACC which were the most current at the time of trial design. Patients enrolled in the study were medically stable and well-compensated; therefore, the results may not apply to other populations, particularly those who are unstable or have acute decompensated HFpEF, who may require other approaches.50 Although the RT intervention was in accord with ACSM guidelines for RT at the time, we cannot exclude the possibility that increased stimulus (time and/or intensity) and larger sample size could have produced significantly increased muscle mass. However, SM strength and muscle quality did improve significantly with RT, and these outcomes are important to patients. Finally, we cannot exclude that greater intensity of protein supplementation or RT may have reduced SM loss.
Conclusion
In older patients with obese HFpEF, combined CR+AT produced robust weight loss and improvements in physical function (including the primary outcome of VO2peak), QOL, body composition, as well as cardiac and arterial function. The addition of RT to CR+AT was well-tolerated and resulted in increased leg strength and leg muscle quality without attenuating SM loss or further increasing VO2peak or QOL. These positive findings are particularly notable in a study population, predominantly non-white obese women, that is unduly burdened by obese HFpEF and are often under-represented in clinical trials.
Supplementary Material
What is new ?
This is the first clinical trial to add resistance exercise training (RT) to an already effective lifestyle intervention of caloric restriction (CR) and aerobic exercise training (AT), in older patients with obese HFpEF. The addition of RT to CR+AT was well-tolerated and resulted in increased leg strength and leg muscle quality without attenuating SM loss or further increasing exercise capacity (VO2peak) or QOL. These positive findings are particularly notable in a study population, predominantly non-white obese women, that is unduly burdened by obese HFpEF and are often under-represented in clinical trials.
What are the clinical implications?
The results of this study suggest that supervised resistance training (RT), when added to caloric restriction and aerobic exercise training (CR+AT), appears to have no adverse effect on cardiac or arterial structure and function, is safe, and was not associated with any exercise-related adverse events. Finally, improved LV mass, end-diastolic volume, and arterial stiffness with CR and exercise are highly relevant to HFpEF where abnormalities in each of these contribute to the pathogenesis and severity of the disorder. Clinicians should consider adding supervised RT to improve skeletal muscle strength and muscle quality of older patients with obese HFpEF.
Sources of Funding:
National Institutes of Health: R01AG045551; R01AG18915; P30AG021332; U24AG059624; U01 AG076928; U01HL160272
Also supported in part by the Kermit Glenn Phillips II Chair in Cardiovascular Medicine and by the Oristano Family Fund at Wake Forest School of Medicine.
Non-standard Abbreviations and Acronyms
- ACC
American College of Cardiology
- ACSM
American College of Sports Medicine
- AHA
American Heart Association
- AT
aerobic exercise training
- cLMM
constrained linear mixed-effects models
- CPET
cardiopulmonary exercise test
- CR
caloric restriction diet
- DXA
dual x-ray absorptiometry
- HFpEF
heart failure with preserved ejection fraction
- HFrEF
HF with reduced ejection fraction
- KCCQ
Kansas City Cardiomyopathy Questionnaire
- LV
left ventricle
- QOL
quality-of-life
- RT
resistance training
- SM
skeletal muscle mass
- SPPB
short physical performance battery
- TC
thigh compartment area
- VO2peak
peak exercise oxygen consumption
- IMF
intramuscular fat
- 6MWD
Six-Minute Walk Distance
- SF 36
36-item Short-Form Health Survey
- cLMM
constrained linear mixed-effects models
Footnotes
Disclosures
P.H.B. has received honoraria as a consultant for Boston Scientific, Boehringer Ingelheim, Corvia Medical, and Merck
D.W.K. has received honoraria as a consultant for Bayer, Medtronic, Relypsa, Merck, Corvia Medical, Boehringer Ingelheim, Ketyo, Rivus, NovoNordisk, AstraZeneca and Novartis, grant funding from Novartis, Bayer, NovoNordisk and AstraZeneca and has stock ownership in Gilead Sciences
References
- 1.Tsao CW, Aday AW, Almarzooq ZI, et al. Heart Disease and Stroke Statistics—2022 Update: A Report From the American Heart Association. Circulation. 2022;145: e153–e639 [DOI] [PubMed] [Google Scholar]
- 2.Yancy CW, Jessup M, Bozkurt B, et al. 2013 ACCF/AHA guideline for the management of heart failure. J AmColl Cardiol. 2013;62(16):e147–e239.. [DOI] [PubMed] [Google Scholar]
- 3.Owan TE, Hodge DO, Herges RM, et al. Trends in prevalence and outcome of heart failure with preserved ejection fraction. N Engl J Med 2006; 355:251–259. [DOI] [PubMed] [Google Scholar]
- 4.Kitzman DW, Gardin JM, Gottdiener JS, et al. Importance of heart failure with preserved systolic function in patients > or = 65 years of age. CHS Research Group. Cardiovascular Health Study. Am J Cardiol. 2001; 87:413–419. [DOI] [PubMed] [Google Scholar]
- 5.Pandey A, Shah SJ, Butler J, et al. Exercise Intolerance in Older Adults with Heart Failure with Preserved Ejection Fraction: JACC State-of-the-Art Review. J Am Coll Cardiol. 2021. Sep 14;78(11):1166–1187. [DOI] [PMC free article] [PubMed] [Google Scholar]
- 6.Spertus JV, Hatfield LA, Cohen DJ, et al. Integrating Quality of Life and Survival Outcomes Cardiovascular Clinical Trials. Circ Cardiovasc Qual Outcomes. 2019. Jun;12(6): e005420, [DOI] [PMC free article] [PubMed] [Google Scholar]
- 7.Kitzman DW, Little WC, Brubaker PH, et al. Pathophysiological characterization of isolated diastolic heart failure in comparison to systolic heart failure. JAMA. 2002; 288:2144–2150. [DOI] [PubMed] [Google Scholar]
- 8.German CA, Brubaker PH, Nelson MB, et al. Relationships Between Objectively Measured Physical Activity, Exercise Capacity, and Quality of Life in Older Patients with Obese Heart Failure and Preserved Ejection Fraction. J Card Fail. 2021. Jun;27(6):635–641 [DOI] [PMC free article] [PubMed] [Google Scholar]
- 9.Lavie CJ, Carbone S, Neelan IJ. Prevention and Treatment of Heart Failure. JACC Cardiovasc Imaging. 2021. Jan;14(1):216–218 [DOI] [PMC free article] [PubMed] [Google Scholar]
- 10.Upadhya B, Haykowsky MJ, Kitzman DW. Therapy for heart failure with preserved ejection fraction: current status, unique challenges, and future directions. Heart Failure Reviews. 2018;23(5):609–29 [DOI] [PMC free article] [PubMed] [Google Scholar]
- 11.Kitzman DW, Brubaker PH, Morgan T, et al. Effects of Caloric Restriction and Aerobic Exercise Training on Peak Oxygen Consumption and Quality of Life Obese Older Patients with Heart Failure Patients and a Preserved Ejection Fraction: A Randomized Clinical Trial. JAMA 2016. Jan 5;315(1):36–46. [DOI] [PMC free article] [PubMed] [Google Scholar]
- 12.Nassif ME, Windsor SL, Borlaug BA, et al. The SGLT2 inhibitor dapagliflozin in heart failure with preserved ejection fraction: a multicenter randomized trial. Nat Med. 2021. Nov;27(11):1954–1960. [DOI] [PMC free article] [PubMed] [Google Scholar]
- 13.Nicklas BJ, Cesari M, Penninx BW, et al. Abdominal Obesity Is an Independent Risk Factor for Chronic Heart Failure in Older People. J Am Geriatr Soc 2006; 54:413–420. [DOI] [PubMed] [Google Scholar]
- 14.Haass M, Kitzman DW, Anand IS, et al. Body Mass Index and Adverse Cardiovascular Outcomes in Heart Failure Patients with Preserved Ejection Fraction / Clinical Perspective. Circ Heart Fail 2011; 4:324–331. [DOI] [PMC free article] [PubMed] [Google Scholar]
- 15.Carbone S, Canada JM, Buckley LF, et al. Obesity contributes to exercise intolerance in heart failure with preserved ejection fraction. J Am Coll Cardiol. 2016; 68:2487–2488. [DOI] [PMC free article] [PubMed] [Google Scholar]
- 16.Reddy YNV, Rikhi A, Obokata M, et al. Quality of life in heart failure with preserved ejection fraction: importance of obesity, functional capacity, and physical inactivity. European Journal of Heart Failure. 2020;22(6):1009–1018. [DOI] [PubMed] [Google Scholar]
- 17.Obokata M, Reddy YNV, Pislaru SV, Melenovsky V, Borlaug BA. Evidence Supporting the Existence of a Distinct Obese Phenotype of Heart Failure With Preserved Ejection Fraction. Circulation. 2017;136(1):6–19. [DOI] [PMC free article] [PubMed] [Google Scholar]
- 18.Kitzman DW, Nicklas B, Kraus WE, et al. Skeletal muscle abnormalities and exercise intolerance in older patients with heart failure and preserved ejection fraction. Am J Physiol Heart Circ Physiol 2014;306:H1364–1370. [DOI] [PMC free article] [PubMed] [Google Scholar]
- 19.Haykowsky M, Brubaker P, Morgan T, Kritchevsky S, Eggebeen J, Kitzman D. Impaired aerobic capacity and physical functional performance in older heart failure patients with preserved ejection fraction: role of lean body mass. J Gerontol A Biol Sci 2013; 68:968–975. [DOI] [PMC free article] [PubMed] [Google Scholar]
- 20.Haykowsky M, Kouba EJ, Brubaker PH, et al. Skeletal muscle composition and its relation to exercise intolerance in older patients with heart failure and preserved ejection fraction. Am J Cardiol 2014; 113:1211–1216. [DOI] [PMC free article] [PubMed] [Google Scholar]
- 21.Carbone S, Kirkman DL, Garten RS, et al. Muscular strength and cardiovascular disease: an updated State-of-the Art Narrative Review. J Cardiopulm Rehabil Prev. 2020. Sep;40(5):302–309. [DOI] [PubMed] [Google Scholar]
- 22.Kitzman DW, Haykowsky MR, Tomczak CJ. Making the Case for Skeletal Muscle Myopathy and Its Contribution to Exercise Intolerance in Heart Failure with Preserved Ejection Fraction. Circ Heart Fail. 2017. Jul;10(7): e004281. [DOI] [PMC free article] [PubMed] [Google Scholar]
- 23.Carbone S, Billingsley HE, Rodriguez-Miguelez P, et al. Lean mass abnormalities in heart failure: the role of sarcopenia, sarcopenic obesity, and cachexia. Curr Probl Cardiol. 2020. Nov;45(11):100417. [DOI] [PMC free article] [PubMed] [Google Scholar]
- 24.Selvaraj S, Kim J, Ansari BA, et al. Body Composition, Natriuretic Peptides, and Adverse Outcomes in Heart Failure with Preserved and Reduced Ejection Fraction. JACC Cardiovasc Imaging. 2021. Jan;14(1):203–215 [DOI] [PMC free article] [PubMed] [Google Scholar]
- 25.Billingsley HE, Hummel SL, Carbone S. The role of diet and nutrition in heart failure: A state-of-the-art narrative review. Prog Cardiovasc Dis. 2020. Sep-Oct;63(5):538–55 [DOI] [PMC free article] [PubMed] [Google Scholar]
- 26.Metter EJ, Talbot LA, Schrager M, Conwit R. Skeletal muscle strength as a predictor of all-cause mortality in healthy men. J Gerontol Biol Sci. 2002; 57A:B359–B365. [DOI] [PubMed] [Google Scholar]
- 27.Pu C, Johnson M, Forman D, et al. Randomized trial of progressive resistance training to counteract the myopathy of chronic heart failure. J Appl Physiol 2001; 90:2341–2350. [DOI] [PubMed] [Google Scholar]
- 28.Mandic S, Tymchak W, Kim D, et al. Effects of aerobic or aerobic and resistance training on cardiorespiratory and skeletal muscle function in heart failure: a randomized controlled pilot trial. Clin Rehabil 2009; 23:207–216. [DOI] [PubMed] [Google Scholar]
- 29.Jewiss D, Ostman C, Smart NA. The effect of resistance training on clinical outcomes in heart failure: a systematic review and meta-analysis. Int J Cardiol. 2016; 221:674–81. [DOI] [PubMed] [Google Scholar]
- 30.Tucker WJ, Beaudry RI, Liang Y, et al. Meta-analysis of exercise training on left ventricular ejection fraction in heart failure with reduced ejection fraction: a 10-year update. Prog Cardiovasc Dis. 2019;62(2):163–71. [DOI] [PMC free article] [PubMed] [Google Scholar]
- 31.Schocken D, Arrieta M, Leaverton P, et al. Prevalence and mortality rate of congestive heart failure in the United States. J Am Coll Cardiol. 1992;20(2):301–306 [DOI] [PubMed] [Google Scholar]
- 32.Rich MW, Beckham V, Wittenberg C, Leven CL, Freedland KE, Carney R. A multidisciplinary intervention to prevent the readmission of elderly patients with congestive heart failure. N Engl J Med 1995; 333:1190–5. [DOI] [PubMed] [Google Scholar]
- 33.Schroeder ET, Wang Y, Castaneda-Sceppa C, et al. Reliability of maximal voluntary muscle strength and power testing in older men. J Gerontol A Biol Sci Medl Sc 2007;62:543–549. [DOI] [PubMed] [Google Scholar]
- 34.Fragala MS, Kenny Anne M AM, Kuchel George A GA. Muscle quality in aging: a multi-dimensional approach to muscle functioning with applications for treatment. Sports Med 2015. May;45(5):641–58 [DOI] [PubMed] [Google Scholar]
- 35.Pavasini R, Guralnik J, Brown JC, et al. Short physical performance battery and all-cause mortality: systematic review and meta-analysis. BMC Med 2016;14:215–215. [DOI] [PMC free article] [PubMed] [Google Scholar]
- 36.Spertus J, Peterson E, Conard MW, et al. Monitoring clinical changes in patients with heart failure: a comparison of methods. Am Heart J. 2005;150(4):707–715 [DOI] [PubMed] [Google Scholar]
- 37.Institute of Medicine (2005) Dietary Reference Intakes for Energy, Carbohydrate, Fiber, Fat, Fatty Acids, Cholesterol, Protein, and Amino Acids (Macronutrients). The National Academies Press, Washington DC. ISBN: 978-0-309-08525-0 [Google Scholar]
- 38.Bopp M, Houston D, Lenchik L, Easter L, Kritchevsky S, Nicklas B. Lean mass loss is associated with low protein intake during dietary-induced weight loss in postmenopausal women. J Am Diet Assoc 2008; 108:1216–1220. [DOI] [PMC free article] [PubMed] [Google Scholar]
- 39.Williams MA, Haskell WL, Ades PA, et al. Resistance exercise in individuals with and without cardiovascular disease: 2007 update: A scientific statement from the American Heart Association Council on Clinical Cardiology and Council on Nutrition, Physical Activity, and Metabolism. Circulation 2007; 116:572–584. [DOI] [PubMed] [Google Scholar]
- 40.ACSM’s Guidelines for exercise testing and prescription. Philadelphia: Lippincott Williams & Wilkins, 2021;11th edition. ISBN: 9781975150181, 197515018X [Google Scholar]
- 41.Fukuta H, Goto T, Wakami K, Ohte N. Effects of drug and exercise intervention on functional capacity and quality of life in heart failure with preserved ejection fraction: a meta-analysis of randomized controlled trials. Eur J Prev Cardiol. 2016;23(1):78–85 [DOI] [PubMed] [Google Scholar]
- 42.Butler J, Khan MS, Mori C, et al. Minimal clinically important difference in quality of life scores for patients with heart failure and reduced ejection fraction. Eur J Heart Fail. 2020. Jun;22(6):999–1005 [DOI] [PubMed] [Google Scholar]
- 43.Villareal DT, Aguirre L, Gurney AB, et al. Aerobic or resistance exercise, or both, in dieting obese older adults. N Engl J Med. 2017;376(20):1943–55. [DOI] [PMC free article] [PubMed] [Google Scholar]
- 44.Pandey A, Kitzman DW. Searching for the Optimal Exercise Training Regimen in Heart Failure with Preserved Ejection Fraction. JAMA. 2021. Feb 9;325(6):537–539 [DOI] [PMC free article] [PubMed] [Google Scholar]
- 45.Obokata M, Reddy Y, Pislaru SV, Melenovsky V, Borlaug BA. Evidence Supporting the Existence of Distinct Obese Phenotype of Heart Failure with Preserved Ejection Fraction. Circulation. 2017; 136:6. [DOI] [PMC free article] [PubMed] [Google Scholar]
- 46.Nicklas BJ, Brinkley TE, Houston DK, et al. Effects of caloric restriction on cardiorespiratory fitness, fatigue, and disability responses to aerobic exercise in older adults with obesity: a randomized controlled trial. J Gerontol A Biol Sci Med Sci. 2019. Jun 18;74(7):1084–1090. [DOI] [PMC free article] [PubMed] [Google Scholar]
- 47.Shea MK, Nicklas BJ, Marsh AP, et al. The effect of pioglitazone and resistance training on body composition in older men and women undergoing hypocaloric weight loss. Obesity (Silver Spring). 2011. Aug;19(8):1636–46 [DOI] [PMC free article] [PubMed] [Google Scholar]
- 48.Goodpaster BH, Park SW, Harris TB, et al. The loss of skeletal muscle strength, mass, and quality in older adults: the health, aging and body composition study. J Gerontol A Biol Sci Med Sci. 2006. Oct;61(10):1059–64 [DOI] [PubMed] [Google Scholar]
- 49.Newman A, Kupelian V, Visser M, et al. Strength, but not muscle mass, is associated with mortality in the Health, Aging and Body Composition Study cohort. J Gerontol Biol Sci Med Sci. 2006;61A:72–77. [DOI] [PubMed] [Google Scholar]
- 50.Mentz R, Whellan D, Reeves G, et al. Rehabilitation Intervention in older patients with acute heart failure with preserved versus reduced ejection fraction. JACC Heart Fail.2021; 9(10):747–757 [DOI] [PMC free article] [PubMed] [Google Scholar]
Associated Data
This section collects any data citations, data availability statements, or supplementary materials included in this article.