

Abstract
Ultrasound (US) has afforded an approach to tissue characterization for more than a decade now. The challenge is to reveal hidden patterns in the US data that describe tissue function and pathology that cannot be seen in conventional US images. Our group has developed a high-resolution analysis technique for tissue characterization termed H-scan US, which is an imaging method used to interpret the relative size of acoustic scatterers. In the present study, the objective was to compare local H-scan US image intensity to registered histological measurements made directly at the cellular level. Human breast cancer cells (MDA-MB 231, ATCC) were orthotopically implanted into female mile (N = 5). Tumors were allowed to grow for approximately four weeks before the study started. In vivo imaging of tumor tissue was performed using an US system (Vantage 256, Verasonics Inc) equipped with a broadband capacitive micromachined ultrasonic (CMUT) linear array transducer (Kolo Medical). A 15 MHz center frequency was used for plane wave imaging with 5 angles for spatial compounding. H-scan US image reconstruction involved use of parallel convolution filters to measure the relative strength of backscattered US signals. Color codes were applied to filter outputs to form the final H-scan US image display. For histologic processing, US imaging cross-sections were carefully marked on the tumor surface and tumors were excised and sliced along the same plane. Using optical microscopy, whole tumor tissue sections were scanned and digitized after nuclear staining. US images were interpolated to have the same number of pixels as the histology images and then spatially aligned. Each nucleus from the histological sections was automatically segmented using custom MATLAB software (MathWorks Inc). Nuclear size and spacing from the histology images were then compared to local H-scan US image features. Overall, local H-scan US image intensity exhibited a significant correlation with both cancer cell nuclear size (R2 > 0.27, p < 0.001) and inverse relationship with nuclear spacing (R2 > 0.17, p < 0.001).
Keywords: acoustic scatterers, cancer, histological analysis, H-scan ultrasound, tissue characterization, ultrasound imaging
INTRODUCTION
The role of noninvasive ultrasound (US) as a portable imaging modality is becoming increasingly important and one that is continuously evolving. Traditional US imaging is based on the detection and display of backscattered signals after rapid transmission of short US pulses by a handheld transducer placed on the tissue surface. Spatial variations in the acoustic impedance of different tissue types proportionally influences the local amplitude of backscattered US signals. After recording by the transducer, backscattered US data undergoes a series of signal processing steps before generation of the final brightness-scanned (B-scan) US image. This includes signal amplification, envelope detection, log compression, noise filtering, etc. This basic pulse-echo principle is the foundation for the vast majority of US imaging techniques currently used in the preclinical and clinical setting. While traditional B-scan US imaging provides quantitative information on tissue anatomy, it fails to offer diagnostic insight at the microstructural level.
For several decades now, quantitative ultrasound imaging has evolved as a method for parameterizing the frequency-dependent content of backscattered US signals from microscale tissue scatterers (Insana et al. 1990; Lizzi et al. 1997). More broadly known as tissue characterization, these quantitative US techniques look to extract clinically-relevant information that is otherwise discarded during formation of traditional B-scan US images. The more common approaches involve estimation of important tissue properties such as the attenuation coefficient, backscatter coefficient, and effective scatterer size and concentration (Oelze and Mamou 2016). In practice, a region-of-interest (ROI) is defined for the backscattered US data and encompasses an axial and lateral range. Through a series of small steps, sliding data windows typically select US signals in the axial direction. Spectral analysis is then applied at each window location to calculate parameters of value. This process is repeated for each vector in the lateral direction before image display in 2-dimensions (2-D). Preclinical and clinical uses of quantitative US imaging have been explored in numerous applications like classification of fatty liver disease (Deeba et al. 2021; Nguyen et al. 2019; Pirmoazen et al. 2020; Tang et al. 2019), characterization of benign versus malignant lesions (Goundan et al. 2021; Nam et al. 2013; Osapoetra et al. 2020b), and monitoring cancer response to treatment (DiCenzo et al. 2020; Sadeghi-Naini et al. 2017a; Tadayyon et al. 2017). An important consideration during quantitative US imaging is the resolution-precision tradeoff (Oelze 2020). While increasing the data window length improves the precision during spectral parameter estimation, spatial resolution decreases and vice versa. There is considerable research underway focused on overcoming the resolution-precision tradeoff using concepts such as data regularization and incorporation of spatial prior information (Coila and Lavarello 2018; Deeba et al. 2021; Jafarpisheh et al. 2021; Vajihi et al. 2018).
US scattering and its frequency dependence is influenced primarily by the rigid nuclear structure in highly cellular tissues like tumors. Given apoptosis-inducing anticancer drugs induce considerable nuclear condensation and fragmentation, quantitative US has emerged as a promising clinical modality for in vivo detection of early tumor response to neoadjuvant therapy (DiCenzo et al. 2020; Osapoetra et al. 2020b; Sadeghi-Naini et al. 2013; Sadeghi-Naini et al. 2017a; Tadayyon et al. 2016; Tadayyon et al. 2017). It must be noted from these clinical studies that individual cells were not resolved because of the frequencies used for human imaging, but quantitative US was sensitive to structural changes that cell ensembles undergo during the apoptotic process. Additional evidence was found indicating that chromatin, which is the stabilizing mechanical component of the nucleus, was the major scatterer of US and that the degree of compaction had a significant influence on quantitative US measurements (Pasternak et al. 2017). Collectively, these findings help promote the potential use of quantitative US imaging to noninvasively monitor and aid the customization of treatments based on responses to specific interventions.
Bypassing the resolution-precision tradeoff with quantitative US imaging, a new approach to tissue characterization was recently introduced. Based on theoretical models of US scattering, this approach uses a matched filter methodology involving different orders of Gaussian-weighted Hermite polynomial functions (Parker 2016). Termed H-scan US where the ‘H’ stands for Hermite or hue, this noninvasive modality allows discrimination of micrometer-sized US scatterers. In general, lower frequency spectral content is generated from larger scattering structures whereas higher frequency signal content is produced by an US wave interacting with an ensemble of smaller scatterers within the resolution cell on scale below the wavelength of the US transmit pulse like Rayleigh scatterers (Khairalseed et al. 2017). Given H-scan US neglects a calibration procedure to remove the influence of user or system setting like select quantitative US methods, it is more qualitative in approach but does afford real-time imaging of relative scatterer size. Possible clinical applications for H-scan US imaging include the assessment of early-stage fatty liver disease (Baek et al. 2021; Baek et al. 2022; Basavarajappa et al. 2021), classification of thyroid tumors (Ge et al. 2018; Khairalseed et al. 2021; Khairalseed et al. 2022), and monitoring early cancer response to neoadjuvant treatment (Dolui et al. 2022; Khairalseed et al. 2019; Tai et al. 2022). The latter facilitates personalized medicine and could lead to new clinical opportunities such as guiding needle and surgical excision biopsies for diagnostic purposes. The H-scan US format has since been extended to volume space for depiction of heterogenous scatterer ensembles throughout the entire cancer burden (Tai et al. 2022). The sensitivity of H-scan US imaging to variations in scatterer size was initially studied in phantom materials and ex vivo tissue samples (Khairalseed et al. 2017). A spatial comparison of in vivo US results to matched histology measures was then performed but limited in scope to a single tumor sample subregion (Khairalseed et al. 2020a) or multiple tumors using only a few smaller subregions (Khairalseed et al. 2020b) due to computational complexity of the image processing algorithms.
Compared to traditional piezoelectric transducers, a capacitive micromachined US transducer (CMUT) has a broader frequency response (Huang et al. 2006). Therefore, CMUT technology is particularly attractive for wideband applications such as spectral-based tissue characterization techniques like H-scan US imaging (Khairalseed and Hoyt 2019). In this work, we detail in vivo H-scan US imaging of breast cancer-bearing animals. After surgical removal of tumor tissue, histological sections from approximately the same US image plane were fluorescently stained to visualize the cancer cell nuclear morphology. A series of fully automated image processing methods were then used to segment and measure the size and spacing of each nucleus from digitized images amounting to millions of counts per whole tumor section. From registered H-scan US images, local intensity values were correlated to nuclear size and spacing (density) to reveal a distinct linear relationship.
MATERIALS AND METHODS
Cell culture and animal model
Experimental protocols for this project were approved by the Institutional Animal Care and Use Committee (IACUC) at the University of Texas at Dallas. Human breast cancer cells (MDA-MB-231, American Type Culture Collection, Manassas, VA) were cultivated in Leibovitz’s L-15 medium containing 10% fetal bovine serum. The cells had previously been transfected with the FUmGW plasmid (Addgene, Waterton, MA) to create a membrane-bound green fluorescent protein (GFP). Cells were incubated at 37 °C until about 90% confluent. Cells were enumerated using a digital cell counter (Countess II, Thermo Fisher Scientific, Hampton, NH). A million breast cancer cells were injected in the mammary fatty pad of six-week-old female athymic nude mice (N = 5; Charles River Laboratories, Wilmington, MA). A period of about four weeks was allowed for newly implanted tumors to grow. On the day of enrollment, animals were placed on a heating pad and maintained with 1 to 2% isoflurane anesthesia (Mobile Anesthesia Machine, Parkland Scientific, Coral Springs, FL). Next, the skin surface of the largest transverse tumor dimension was carefully lined using a permanent marker. After coating the target tissue surface with US transmission gel (Aquasonic 100, Parker Laboratories Inc, Fairfield, NJ), the transducer was then fixed at a position normal to the surface line and tumors were imaged using the H-scan US technique. Note the tissue surface mark was placed to indicate the US imaging cross-section and for preparation and registration with histology sections taken along the same plane.
In vivo H-scan ultrasound imaging
Data acquisition was performed using a programmable US system (Vantage 256, Verasonics Inc, Kirkland, WA) equipped with a CMUT linear array transducer (Kolo Medical Inc, San Jose, CA) (Zhao et al. 2015). This wideband transducer was comprised of 256 elements (pitch of 0.108 mm) that had a center frequency of 15 MHz (6 dB bandwidth of 80%) and fixed elevational focus of 15 mm. A 2:1 multiplexer was used to connect the transducer to the US system. Plane wave imaging was performed using transmitted US pulses and backscattered US signals (radiofrequency, RF, format) were recorded and sampled at a rate of 60 MHz and quantized to 12 bits. Five equal angles in the 18° range were used to successively steer and overlap the plane wave transmissions for spatial angular compounding (Khairalseed et al. 2018). At a depth of 20 mm, the peak negative pressure of the transmitted US pulses was 1.1 MPa as confirmed by hydrophone measurements (AIMS III, Onda Corp, Sunnyvale, CA).
To generate H-scan US images, three matched convolution filters were applied to the RF data sequences to analyze spectral content relative to nth-order Gaussian-weighted Hermite functions GHn namely, GH2(t), GH6(t), and GH10(t), after normalization by the signal energy . This filter set was carefully selected so that each GHn spectra was within the transducer bandwidth but overlap (correlation) was minimized. The signal envelope for each of these filtered and compounded data sequences is then calculated using a Hilbert transformation. The relative strength of the filter outputs was color coded whereby the lower frequency (GH2 ≅ 9 MHz) backscattered US signal components are assigned to the red (R) channel, moderate frequency (GH6 ≅ 15 MHz) signals are assigned to the green (G) channel, and the higher frequency (GH10 ≅ 21 MHz) signals to the blue (B) channel. All channel data was set to an 8-bit format. This assignment completes the standard RGB color map and forms the final H-scan US image. H-scan US image intensity was converted to a singular integer by summing the values of the three different color channels and dividing by 3. Using this format, H-scan US image intensities in the dynamic range from 0 to 255 denote the smallest to largest US scatterers, respectively. A schematic diagram summarizing the signal processing and H-scan image display is presented in Figure 1. B-scan US images were generated by calculating the envelop of the RF data using a Hilbert transformation.
Figure 1.
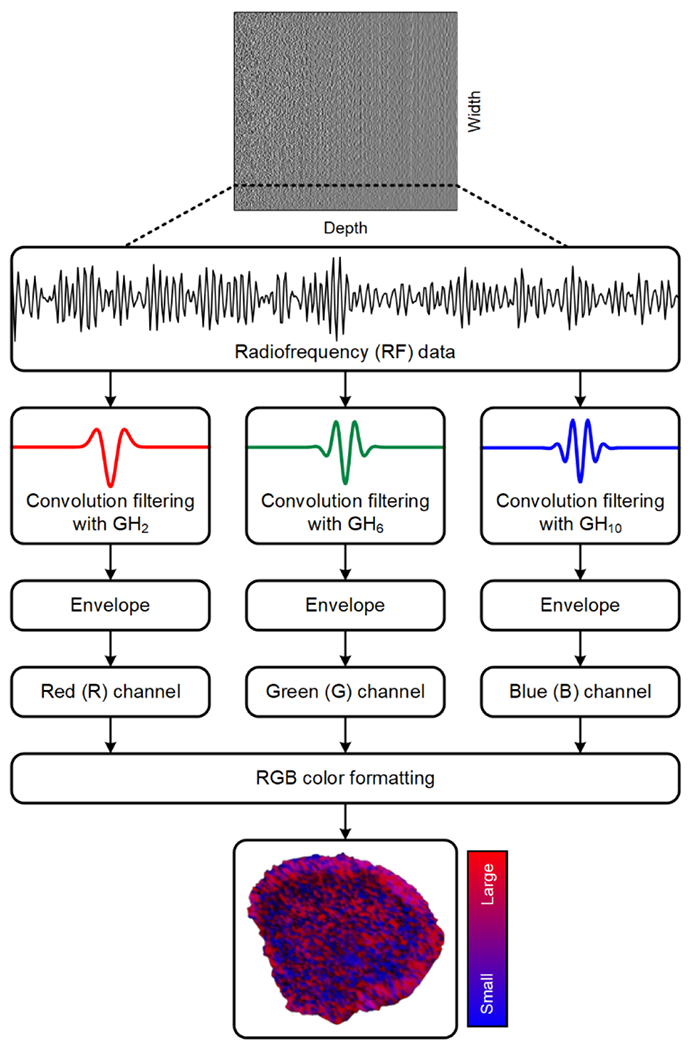
Schematic diagram of the signal processing strategy used to generate and display the H-scan ultrasound (US) images. Backscattered US signals (radiofrequency, RF, format) are processed using a matched filter approach using Gaussian-weighted Hermit polynomial functions of order 2, 6, and 10 (GH2, GH6, and GH10, respectively). After envelope detection, filter outputs are assigned to the red (R), green (G), or blue (B) channel of a standard RGB colormap format before final H-scan US image display.
Ex vivo processing of tumor tissue
Immediately after US imaging, animals were humanely euthanized via cervical dislocation under deep anesthesia. Tumors were carefully sliced along the tissue surface mark and US imaging plane before surgical removal and preservation in 4% paraformaldehyde at 4 °C. After complete fixation, tissue samples were embedded in paraffin and thin sections were prepared from the blocks. Deparaffinization was performed using xylene for 10 min followed by washing through descending alcohol series and tap water. This process was repeated three times. Sections were then washed three times (5 min each) with phosphate buffered saline (PBS). To help identify the cell nucleus, tissue sections were repeatedly treated with a 4′,6-diamidino-2-phenylindole (DAPI) solution (1 μg/mL, Thermal Fisher Scientific) and washed with PBS. Slides were mounted with fluorescent mounting media (HCO8, Millipore, Burlington, VT). Finally, whole tumor tissue sections were scanned and digitized using a fluorescence microscope equipped with a motorized volumetric scanning stage (Axio Observer 7, Carl Zeiss Inc, Thornwood, NY) and fluorescent filters for DAPI (λ = 461 nm) and GFP (λ = 510 nm).
Image processing and measurements
H-scan US images were upsampled (resized) using bicubic interpolation to the same number of pixels as the histology images. Geometric rotation and scaling of the former was performed as needed to maximize spatial correlation and image registration. Cell nucleus segmentation was based on an adaptive image intensity thresholding technique. To improve segmentation results and given the cancer cell nucleus is comparable in size to a white blood cell, all connected components that were fewer than 6 μm or greater than 40 μm diameter were assumed non-nuclear structures (Shashni et al. 2018) and removed using a morphological area opening operation. The major and minor axis lengths of each nucleus were calculated using second central moments. Then the mean nucleus diameter was estimated from the major and minor axis lengths. The final segmented image was used to estimate nuclear spacing (density). The spacing was based on the mean distance between each direct connected nucleus. Spatial coordinate boundaries (Xn, Yn) for all nuclei in each histology image ROI were extracted. Two vectors were used to save the spatial coordinates of the target nucleus (vector, T) and all other nuclei (vector, R). Euclidian distances between target spatial coordinates and other nuclei coordinates were computed in matrix K (size of the boundaries of the T × size of the boundaries of the R). The minimum distance column vector (in the Y direction) from matrix K were computed to identify the spatial coordinates in T and R. All nuclei that had a distance greater than (where M and N denote the size of matrix K) and close nuclei that had a distance less than 30 pixels were removed to speed up the computational time. This image processing was used to estimate lines of connectivity between T and R and each was plotted and colorcoded from a random palette. Multiplying the lines image with the negative of the segmented binary image allows only continuous lines to be completed, i.e., if a line passed through any nucleus it would be interrupted and considered incomplete. A histogram of lines with the specific colormap defined earlier was found (calculate only colors in colormap). A nucleus-to-nucleus clear path ratio (N2NPR) metric was then calculated as the ratio of the two histograms, namely, the completed lines histogram and the interrupted lines histogram. Finally, only nuclei with N2NPR > 97% were retained. The sequence of image processing steps used for nuclear segmentation from digitized histologic images is illustrated in Figure 2.
Figure 2.
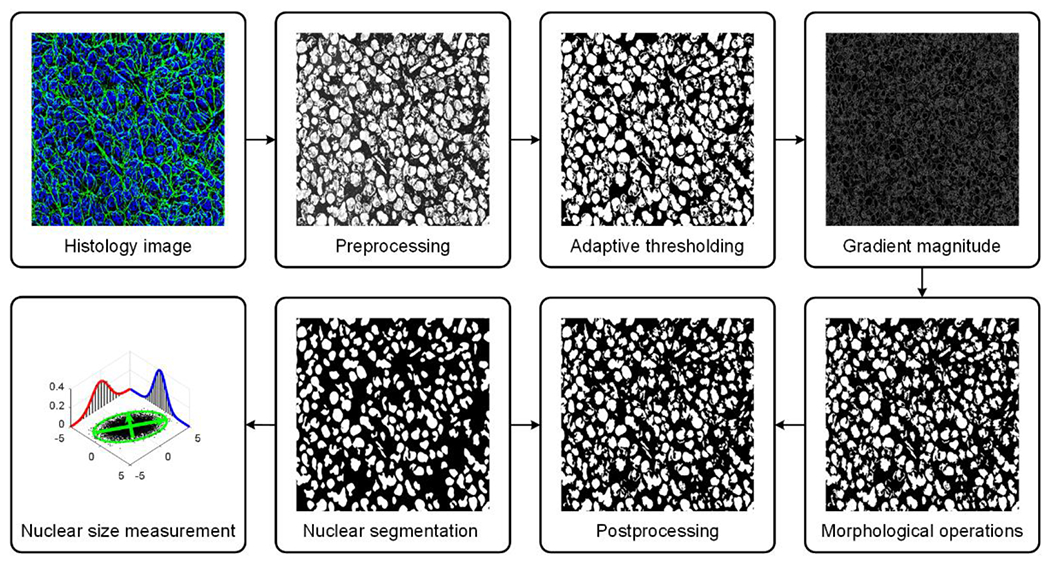
Schematic diagram of the histological image processing strategy for automated cancer cell nuclear segmentation. Segmentation was performed using adaptive thresholding. To improve segmentation results, a morphological operation was applied before mean nucleus diameter was estimated from the major and minor axis lengths.
Statistical analysis and performance measures
In an attempt to properly match histological and US images (or minimize any registration error), three different sized kernels of 160 × 160, 320 × 320, or 800 × 800 μm were used to partition both image sets into ROIs (see Table 1). Data within each of the many ROIs was averaged to yield a single discrete local value. A scatterplot was used to display data and highlight trends between local H-scan US image intensity and registered histology measures. A composite scatterplot including all local measurements from the five different subjects was generated for both B-scan and H-scan US image intensities. A linear regression analysis modeled this relationship by fitting a linear equation to the data measurements. From analysis of the compositive plot, the ratio of mean H-scan US image intensity to cancer cell nuclear size and spacing was computed as a metric of measurement sensitivity. The coefficient of determination, slope coefficient, and 95% confidence intervals (CIs) were recorded. The probability density function (PDF) and cumulative distribution function (CDF) were generated from histogram data. A p-value less than 0.05 was considered statistically significant. All statistical analyses were performed using Prism software (GraphPad Software, San Diego, CA).
Table 1.
Three different kernel sizes of 160 × 160, 320 × 320, or 800 × 800 μm were used to partition the matched ultrasound (US) and histological images into distinct region-of-interests (ROIs).
|
|
|||
|---|---|---|---|
| Kernel size (μm) | |||
|
|
|||
| 160 × 160 | 320 × 320 | 800 × 800 | |
|
|
|||
| Subject | Number of region-of-interests (ROIs) | ||
| 1 | 2216 | 525 | 71 |
| 2 | 2524 | 600 | 82 |
| 3 | 2386 | 567 | 77 |
| 4 | 1830 | 432 | 57 |
| 5 | 1887 | 448 | 62 |
RESULTS
In vivo H-scan US imaging of breast cancer-bearing mice was performed to estimate the relative size and spatial distribution of tissue scatterers. Immediately following, each animal was euthanized and tumor tissue sections underwent ex vivo analysis. After nuclear staining, digital histological images were analyzed using an automated segmentation process to estimate nuclear size and spacing throughout the entire tumor tissue section. Nuclear spacing measurements were based on a line connectivity algorithm and the mean distance between each nucleus and other directly connected neighboring cells. This mean distance was based on a N2NPR metric. Figure 3 demonstrates the line connectivity algorithm and measurement of mean nuclear spacing, which was calculated using N2NPR = 100%, N2NPR > 97% or N2NPR > 37%. In this study, N2NPR > 97% was used to calculate cancer cell nuclear spacing.
Figure 3.
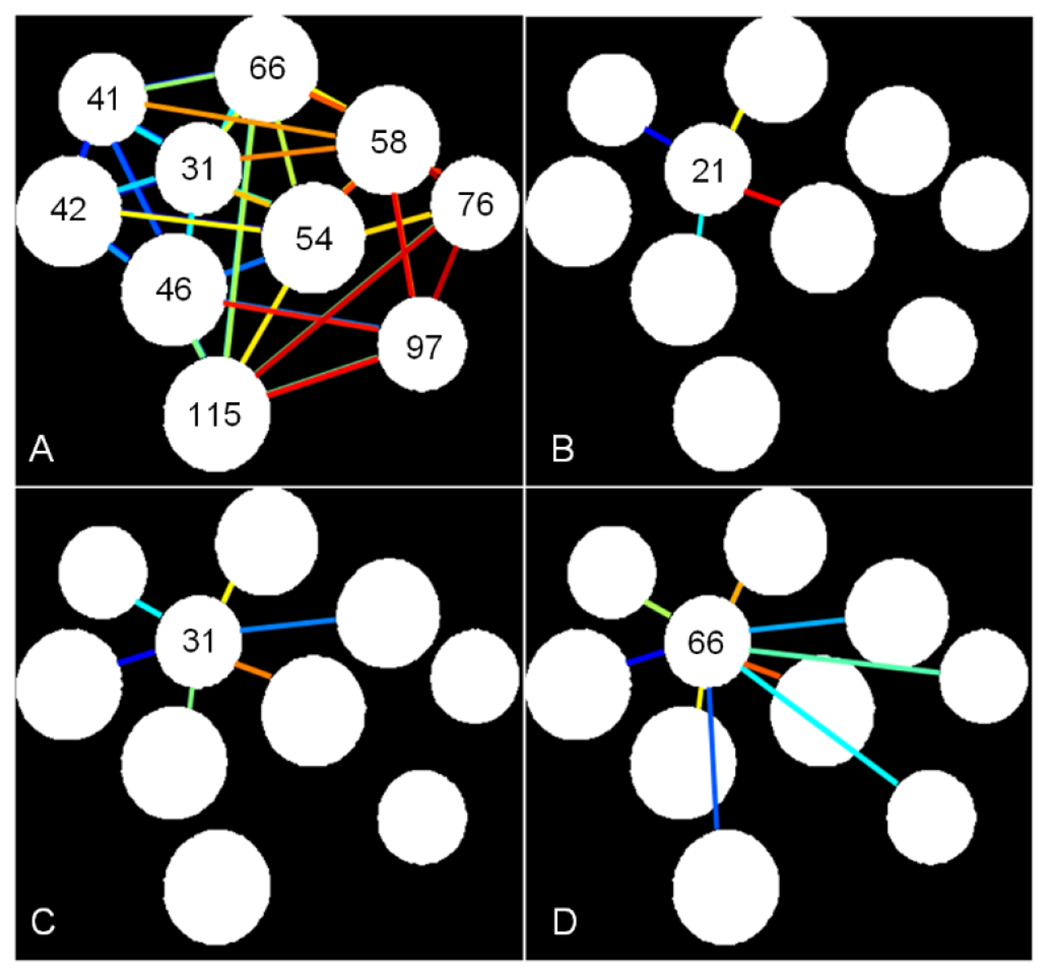
Illustration of the cancer cell nuclear spacing estimation technique based on lines of connectivity between each target nucleus and other surrounding directly connected nuclei. (A) Examples of a nucleus-to-nucleus clear path ratio (N2NPR) is shown for (A) All nuclei of N2NPR > 97%, and a selected nucleus of (B) N2NPR = 100%, (C) N2NPR > 97%, and (D) N2NPR > 37%. Numbers represent the mean spacing (in pixels) between each target nucleus and connected nuclei.
Comparison between H-scan US and histological images was possible because planes were oriented in the same way and upsampled to equal size. Custom software was developed to compare local US image features at the pixel level with measurements of nuclear size and spacing obtained from registered histology images. To assess optimal matching, three different kernel sizes were used to partition the H-scan US and histological images into a number of ROIs as detailed in Table 1. A representative pair of example images are illustrated in Figure 4. Three different kernels size of 160 × 160, 320 × 320, or 800 × 800 μm were used to partition both images into matched fully connected sets of spaced subregions. Example B-scan US, H-scan US, and histological images after partitioning images into a fully connected set of spaced ROIs that were each 160 × 160 μm in size are presented in Figure 5. Notice the spatial similarities between the H-scan US and histological images that are not found in the B-scan US type.
Figure 4.
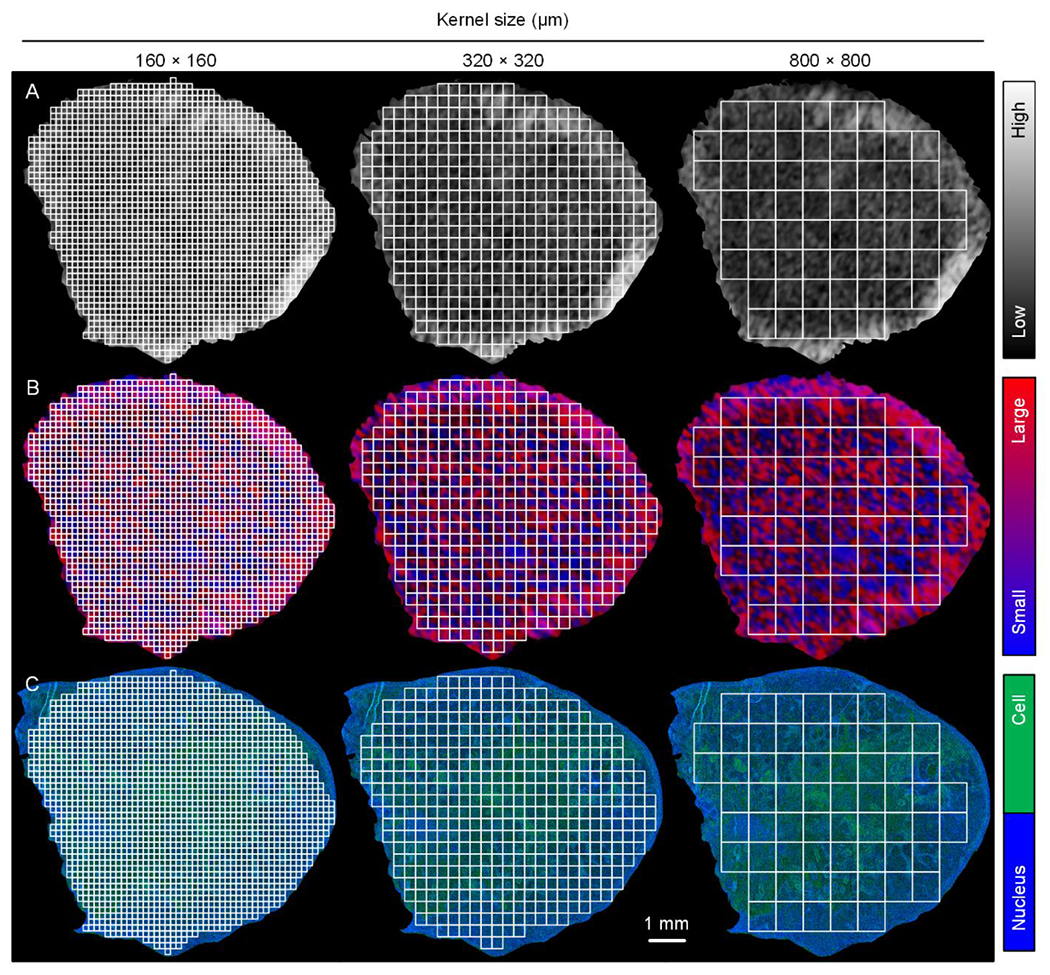
Matched (A) B-scan US, (B) H-scan US, and (C) histological images. Lower resolution US images were upsampled and then aligned with histology. To offset any registration errors, three different kernel sizes of 160 × 160, 320 × 320, or 800 × 800 μm were used to partition both images into a fully connected set of spaced region-of-interests (ROIs).
Figure 5.
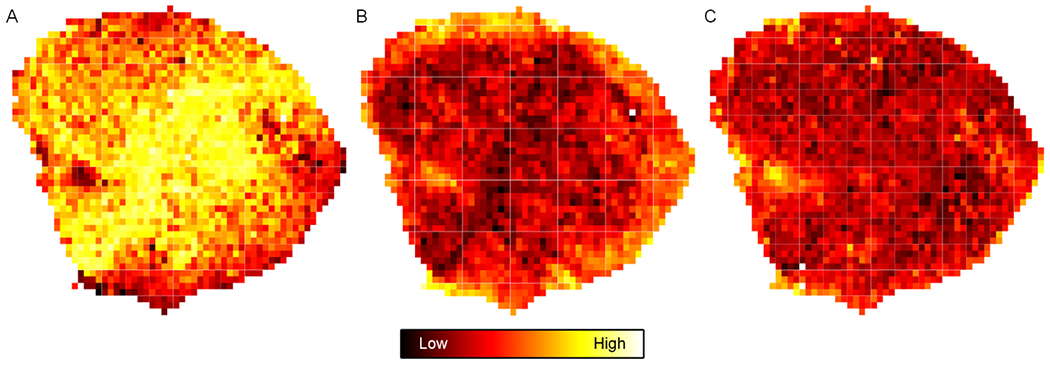
Example (A) B-scan US, (B) H-scan US, and (C) histological images after partitioning into a fully connected set of spaced ROIs that were each 160 × 160 μm in size. Scale bar indicates image intensity.
A correlation analysis between the local H-scan US image intensity and nuclear size at termination was performed and results are displayed in Figure 6. Inspection of the data reveals that increases in cancer cell nuclear size corresponded to increases in the local H-scan US image intensity regardless of kernel size. Correlation plots incorporating data from all five subjects were produced and included data counts of 1.1 × 10⁴, 2.6 × 10³, and 3.5 × 10² for kernel sizes of 160 × 160, 320 × 320, and 800 × 800 μm, respectively. Regression analyses of the H-scan US image intensities revealed a positive trend irrespective of kernel size (R2 > 0.27, p < 0.001) and more pronounced than that found from the registered B-scan US images (R2 > 0.09, p < 0.001). Assuming the ratio of mean H-scan US image intensity to nuclear size and spacing is a basic marker of measurement sensitivity, this calculation yields a value of 8.8 ± 1.6 dB/μm. The slope of the regression line was consistent regardless of kernel size used (p > 0.25). A summary of all statistical relationships between the different images are detailed in Table 2.
Figure 6.
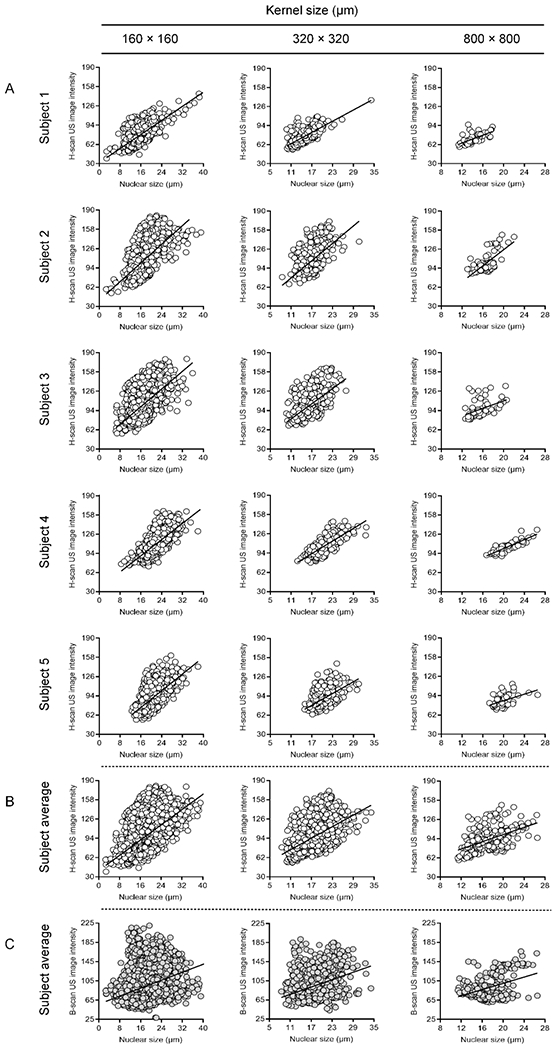
(A) Individual scatterplots between local H-scan US image intensity and nuclear size measurements from matched histological subregions. Regression analysis reveals a positive linear relationship (sold line). A total of five subjects and three different-sized kernel sizes of 160 × 160, 320 × 320, or 800 × 800 μm were studied. Subject averages are presented for comparison between registered (B) H-scan US and (C) B-scan US image intensities.
Table 2.
Summary of statistical relationships between the US and cancer cell nuclear size measurements from matched histological images and use of different kernel sizes. Values are reported from linear regression analyses and include the coefficient of determination (R2) and slope of the regression line. The 95% confidence interval (CI) was reported as a measure of statistical precision.
|
|
|
||||||
|---|---|---|---|---|---|---|---|
| Subject | Subject average | ||||||
|
|
|
||||||
| 1 | 2 | 3 | 4 | 5 | H-scan US | B-scan US | |
| Kernel size = 160 × 160 μm | |||||||
| p-value | < 0.001 | < 0.001 | < 0.001 | < 0.001 | < 0.001 | < 0.001 | < 0.001 |
| R 2 | 0.48 | 0.29 | 0.33 | 0.52 | 0.37 | 0.31 | 0.09 |
| 95% CI | 0.45 to 0.51 | 0.26 to 0.32 | 0.29 to 0.36 | 0.49 to 0.56 | 0.34 to 0.41 | 0.30 to 0.33 | 0.08 to 0.10 |
| Slope | 2.9 | 3.9 | 3.7 | 3.4 | 3.5 | 3.2 | 2.1 |
| 95% CI | 3.1 | 3.6 to 4.1 | 3.5 to 3.9 | 3.2 to 3.5 | 3.3 to 3.7 | 3.1 to 3.3 | 2.0 to 2.2 |
| Kernel size = 320 × 320 μm | |||||||
| p-value | < 0.001 | < 0.001 | < 0.001 | < 0.001 | < 0.001 | < 0.001 | < 0.001 |
| R 2 | 0.50 | 0.30 | 0.32 | 0.60 | 0.28 | 0.40 | 0.12 |
| 95% CI | 0.43 to 0.55 | 0.24 to 0.37 | 0.26 to 0.38 | 0.54 to 0.65 | 0.21 to 0.35 | 0.37 to 0.43 | 0.10 to 0.15 |
| Slope | 3.1 | 4.9 | 4.2 | 3.5 | 3.3 | 2.2 | 2.6 |
| 95% CI | 2.9 to 3.4 | 4.3 to 5.5 | 3.7 to 4.7 | 3.2 to 3.8 | 2.8 to 3.8 | 2.1 to 2.3 | 2.3 to 2.8 |
| Kernel size = 800 × 800 μm | |||||||
| p-value | < 0.001 | < 0.001 | < 0.001 | < 0.001 | < 0.001 | < 0.001 | < 0.001 |
| R 2 | 0.44 | 0.43 | 0.19 | 0.73 | 0.21 | 0.27 | 0.18 |
| 95% CI | 0.25 to 0.60 | 0.26 to 0.59 | 0.05 to 0.36 | 0.58 to 0.83 | 0.05 to 0.40 | 0.19 to 0.35 | 0.11 to 0.26 |
| Slope | 3.3 | 6.8 | 3.1 | 3.7 | 2.7 | 3.0 | 3.3 |
| 95% CI | 2.4 to 4.2 | 5.0 to 8.5 | 1.6 to 4.6 | 3.1 to 4.3 | 1.4 to 4.1 | 2.5 to 3.5 | 2.6 to 4.1 |
Next, comparisons between the local H-scan US image intensity and mean nuclear spacing measurements from spatially matched ROI locations was performed. Registered data plots are presented in Figure 7. Review of this data reveals that increases in nuclear spacing tended to produce a corresponding decrease in the local H-scan US image intensity. Contrast to trends found between H-scan US image and nuclear size, regression line slope was more variable during the same comparison to nuclear spacing measures. Assuming again that the ratio of mean H-scan US image intensity to nuclear spacing is a basic marker of measurement sensitivity, this calculation yields a value of −2.1 ± 2.2 dB/μm. The slope of the regression line was similar regardless of kernel size used (p > 0.31). A summary of all statistical relationships between the different images are detailed in Table 3. Again, correlation plots incorporating data from all five subjects reveals similar trends in H-scan US image intensity (R2 > 0.17, p < 0.001) that were considerably less pronounced that that found from the registered B-scan US images (R2 < 0.01, p < 0.23).
Figure 7.
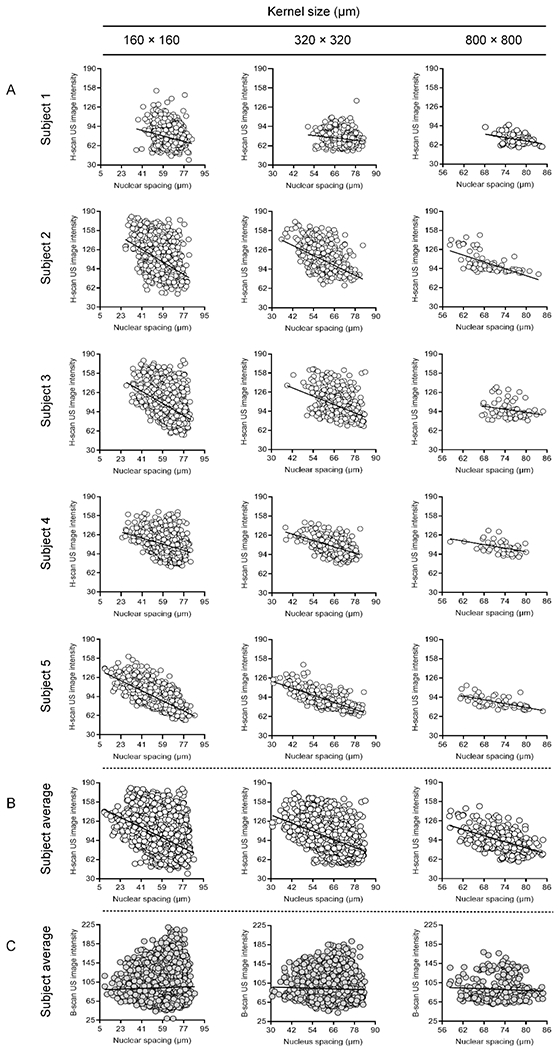
(A) Individual scatterplots between local H-scan US image intensity and nuclear spacing measurements from matched histological subregions. Regression analysis reveals a negative linear relationship (sold line). Subject averages are presented for comparison between registered (B) H-scan US and (C) B-scan US image intensities.
Table 3.
Summary of statistical relationships between the US and cancer cell nuclear spacing measurements from matched histological images and use of different kernel sizes.
|
|
|
||||||
|---|---|---|---|---|---|---|---|
| Subject | Subject average | ||||||
|
|
|
||||||
| 1 | 2 | 3 | 4 | 5 | H-scan US | B-scan US | |
| Kernel size = 160 × 160 μm | |||||||
| p-value | < 0.001 | < 0.001 | < 0.001 | < 0.001 | < 0.001 | < 0.001 | 0.002 |
| R 2 | 0.05 | 0.18 | 0.17 | 0.10 | 0.60 | 0.17 | 0.00 |
| 95% CI | 0.04 to 0.07 | 0.16 to 0.21 | 0.14 to 0.20 | 0.07 to 0.13 | 0.56 to 0.62 | 0.16 to 0.18 | 0.00 to 0.00 |
| Slope | −0.51 | −1.12 | −1.12 | −0.57 | −0.94 | −0.94 | 0.08 |
| 95% CI | −0.60 to −0.42 | −1.26 to −1.07 | −1.22 to −1.02 | −0.65 to −0.49 | −0.98 to −0.91 | −0.98 to −0.90 | 0.03 to 0.13 |
| Kernel size = 320 × 320 μm | |||||||
| p-value | < 0.001 | < 0.001 | < 0.001 | < 0.001 | < 0.001 | < 0.001 | 0.07 |
| R 2 | 0.03 | 0.27 | 0.17 | 0.25 | 0.58 | 0.22 | 0.00 |
| 95% CI | 0.01 to 0.06 | 0.21 to 0.33 | 0.11 to 0.23 | 0.18 to 0.32 | 0.52 to 0.64 | 0.19 to 0.24 | 0.00 to 0.01 |
| Slope | −0.3 | −1.4 | −1.2 | −0.9 | −0.7 | −1.1 | −0.1 |
| 95% CI | −0.5 to −0.2 | −1.6 to −1.2 | −1.4 to −1.0 | −1.0 to −0.7 | −0.9 to −0.60 | −1.2 to −1.0 | −0.2 to 0.0 |
| Kernel size = 800 × 800 μm | |||||||
| p-value | 0.003 | < 0.001 | 0.03 | 0.001 | < 0.001 | < 0.001 | 0.23 |
| R 2 | 0.12 | 0.40 | 0.06 | 0.18 | 0.42 | 0.29 | 0.01 |
| 95% CI | 0.02 to 0.29 | 0.23 to 0.56 | 0.00 to 0.20 | 0.03 to 0.38 | 0.23 to 0.60 | 0.21 to 0.37 | 0.00 to 0.03 |
| Slope | −1.0 | −1.9 | −0.9 | −1.0 | −0.9 | −1.1 | −0.3 |
| 95% CI | −1.6 to −0.4 | −2.4 to −1.4 | −1.6 to −0.1 | −1.6 to −0.4 | −1.2 to −0.6 | −1.4 to −0.7 | −0.7 to 0.2 |
From histogram data, PDFs and CDFs were used to further describe the relationship (distribution) between in vivo H-scan US image intensity and cancer cell nuclear size and spacing measurements from matched histological images. For simplicity, histogram data was from all five subjects and use of the 160 × 160 μm-sized kernel only. According to results presented in Figure 8, normalized histograms are skewed in distribution. A cumulative sum of these PDFs yields curves that are similar in shape and contour.
Figure 8.
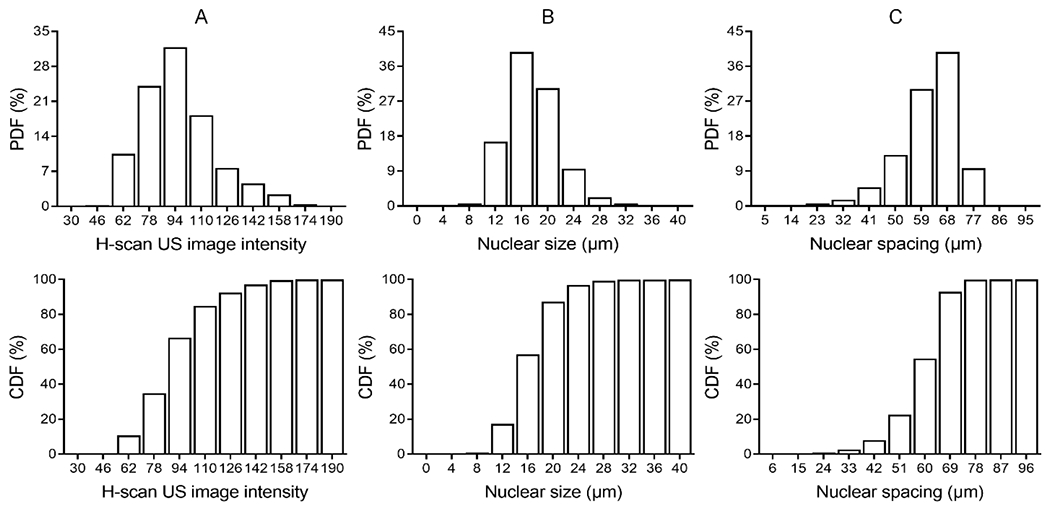
Normalized histogram (probability density function, PDF) of (A) H-scan US image intensity, (B) cancer cell nuclear size, and (C) cancer cell spacing measurements and corresponding cumulative distribution function (CDF) for each.
DISCUSSION
In this study, the relationship between local H-scan US image intensity values and histological measures of nuclear size and spacing were investigated. Assuming the H-scan US format provides information on relative scatterer size, statistical analyses intimated that image intensity was proportional to cancer cell nuclear size and inversely to cell aggregate concentration albeit to a lesser extent, which was consistent with in vitro experimental findings reported previously (Tai et al. 2020). One of the major structural and mechanical components of the cell nucleus is the interior chromatin (Stephens et al. 2018). This rigid chromatin (i.e., DNA and associated proteins) fills the nuclear cavity and dictates mechanical response to external forces like US pressure waves. In fact, independent research has provided compelling evidence that chromatin is a major scatterer of US and that the degree of its compaction has considerable influence on spectral features of the backscattered US signals from in vitro samples (Pasternak et al. 2016). The presence of branching blood vessels and other in vivo tissue structures likely results in more complex US scattering (Parker 2019a; Parker 2019b). Accordingly, any additional intratumoral tissue components could complicate any correlation of US-derived parameters with optical histology-measured data. This could help explain in part some of the apparent outlier values in Figures 6 and 7. Worth noting, comparisons between local H-scan US image intensity values and registered histological measures yielded similar regression statistics like line slope regardless of data kernel size, i.e., 160 × 160, 320 × 320, and 800 × 800 μm. Despite inevitable tissue manipulation during histological processing and considerable difference in slice thickness between the US and histological images, experimental results suggest a high degree of registration was obtained and a smaller kernel permissible for true comparisons. If future research and the experimental setup yields lower image registration accuracy, then larger sized kernels should be considered.
Nuclear size and morphology are essential features that are used clinically to distinguish benign from malignant cells and to render diagnostic conclusions that guide patient management (Fischer 2020). The regulatory mechanisms that underlie this increased nuclear size in malignant cells remain largely unknown (Denais and Lammerding 2014; Jevtić and Levy 2014). However, differences in nuclear size alter US scattering and this observation has been exploited for characterizing benign and malignant tumors in various tissue types (Oelze et al. 2004; Osapoetra et al. 2020a; Osapoetra et al. 2020b; Sadeghi-Naini et al. 2017b; Zhou et al. 2017). Given the prominent changes that are known to characterize nuclear changes such as during response to apoptosis-inducing anticancer treatment, trends in quantitative US measurements were shown to correlate with nuclear and chromatin compaction (distribution) during cell death (Pasternak et al. 2017). This supports the proposition of using spectral features derived from backscattered US signals for in vivo monitoring of human cancer response to drug treatment (DiCenzo et al. 2020; Sadeghi-Naini et al. 2013; Sadeghi-Naini et al. 2017a; Tadayyon et al. 2016; Tadayyon et al. 2017). Furthermore, data presented herein demonstrates that local H-scan US image intensity is linearly related to cancer cell nuclear size and spacing. With physiological changes in these tissue parameters during cancer treatment, it is projected that H-scan US imaging could be a useful modality for monitoring tumor response. This is strengthened by the fact that a patient examination only takes minutes to complete.
As with most US transducers, CMUTs find a primary application in medical imaging (Joseph et al. 2022). Unlike the more traditional piezoelectric-based US transducers, CMUTs provide a wide frequency range (bandwidth > 4 dB) of operation (Vallet et al. 2017). In a previous study, a L22-8 CMUT was compared against a 15 MHz lead zirconate titanate (PZT) transducer with a similar aperture (Zhao et al. 2015). The CMUT linear array exhibited improved image quality as confirmed by phantom and human thyroid examinations. More recently, use of a CMUT array was evaluated for H-scan US imaging of relative scatterer size (Khairalseed and Hoyt 2019). Relative to data collected in homogeneous phantom materials embedded with 15 μm scatterers, it was shown that H-scan US image intensity increased by 3.7 and 15.2 % in phantoms with 30 and 45 μm-sized scatterers, respectively. In comparison using the same phantom materials, the mean B-scan US image intensity only increased by 2.5 and 5.0 %. Since the amplitude of the backscattered US signal is proportional to the diameter of the scattering objects, an increase in B-scan US image intensity was expected. Using a similar US system and method, we revealed in this study that in vivo H-scan US imaging is sensitive to local variations in aggregate scatterer size and spatial distribution as confirmed from optical histology-measured data.
A broadband transducer with a center frequency of 15 MHz provides sufficient sensitivity to detect differences in subwavelength US scatterer aggregates. In theory, there is an advanced Gaussian autocorrelation function for calculating average differential US backscatter, which results in a limit for long wavelengths with a higher power law dependence on frequency and radius than the classical Rayleigh result. Based on ensemble averages and intensity variables, it has been shown that differential US scattering cross-sectional measurements per unit volume exhibit a frequency dependence approaching frequency to the fifth power in certain scattering configurations (Waag et al. 1989). Furthermore, a frequency dependence higher than f2 for intensity (f4 for envelope) is possible for a particular configuration of US scatterers. Backscattered US signals after plane wave transmission is assumed to be a linear function of US scatterer size in some sub-resolved range and above some minimum level determined by the US system (e.g., frequency) and Rayleigh scattering lower limits. This linear approximation was verified in the present study given the linear relationship that was found between the local H-scan US image intensity values and aggregate scatterer size and spacing from registered subregions.
CONCLUSIONS
Using xenograft tumors and a detailed ex vivo analyses it was shown that local H-scan US image intensity has a high correlation to histology-derived measurements of cancer cell nuclear size and spacing. This research further highlighted the potential of in vivo H-scan US imaging using a CMUT linear array for soft tissue characterization.
Acknowledgements -
The authors would like to thank Shreya Reddy and Jane Song for their help with the histological processing of tumor tissue samples. We also would like to thank Professor Kevin J. Parker from the University of Rochester for all the insightful discussions about the data presented in this paper. This work was supported in part by the National Institutes of Health (NIH) grants R01CA269973, R01DK126833, R01EB025841, and award RP180670 from the Cancer Prevention and Research Institute of Texas (CPRIT) to establish the Small Animal Imaging Facility at the University of Texas at Dallas.
Footnotes
Publisher's Disclaimer: This is a PDF file of an unedited manuscript that has been accepted for publication. As a service to our customers we are providing this early version of the manuscript. The manuscript will undergo copyediting, typesetting, and review of the resulting proof before it is published in its final form. Please note that during the production process errors may be discovered which could affect the content, and all legal disclaimers that apply to the journal pertain.
Conflict of interest disclosure
The authors declare they have no conflicts of interest.
Data availability
All data presented in this paper is available upon reasonable request.
REFERENCES
- Baek J, Basavarajappa L, Hoyt K, Parker KJ. Disease-specific imaging utilizing support vector machine classification of H-scan parameters: Assessment of steatosis in a rat model. IEEE Trans Ultrason Ferroelectr Freq Control 2022;69:720–731. [DOI] [PMC free article] [PubMed] [Google Scholar]
- Baek J, Poul SS, Basavarajappa L, Reddy S, Tai H, Hoyt K, Parker KJ. Clusters of ultrasound scattering parameters for the classification of steatotic and normal livers. Ultrasound Med Biol 2021;47:3014–3027. [DOI] [PMC free article] [PubMed] [Google Scholar]
- Basavarajappa L, Baek J, Reddy S, Song J, Tai H, Rijal G, Parker KJ, Hoyt K. Multiparametric ultrasound imaging for the assessment of normal versus steatotic livers. Sci Rep 2021;11:2655. [DOI] [PMC free article] [PubMed] [Google Scholar]
- Coila AL, Lavarello R. Regularized spectral log difference technique for ultrasonic attenuation imaging. IEEE Trans Ultrason Ferroelectr Freq Control 2018;65:378–389. [DOI] [PubMed] [Google Scholar]
- Deeba F, Schneider C, Mohammed S, Honarvar M, Lobo J, Tam E, Salcudean S, Rohling R. A multiparametric volumetric quantitative ultrasound imaging technique for soft tissue characterization. Med Image Anal 2021;74:102245. [DOI] [PubMed] [Google Scholar]
- Denais C, Lammerding J. Nuclear mechanics in cancer. Adv Exp Med Biol 2014;773:435–470. [DOI] [PMC free article] [PubMed] [Google Scholar]
- DiCenzo D, Quiaoit K, Fatima K, Bhardwaj D, Sannachi L, Gangeh M, Sadeghi-Naini A, Dasgupta A, Kolios MC, Trudeau M, Gandhi S, Eisen A, Wright F, Look Hong N, Sahgal A, Stanisz G, Brezden C, Dinniwell R, Tran WT, Yang W, Curpen B, Czarnota GJ. Quantitative ultrasound radiomics in predicting response to neoadjuvant chemotherapy in patients with locally advanced breast cancer: Results from multi-institutional study. Cancer Med 2020;9:5798–5806. [DOI] [PMC free article] [PubMed] [Google Scholar]
- Dolui S, James D, Trinh B, Machado P, Forte LA, Porembka J, Dogan B, Forsberg F, Nam K, Hoyt K. First-in-human H-scan ultrasound imaging of breast cancer. Proc IEEE Ultrason Symp 2022;1:1–4. [Google Scholar]
- Fischer EG. Nuclear morphology and the biology of cancer cells. Acta Cytol 2020;64:511–519. [DOI] [PubMed] [Google Scholar]
- Ge GR, Laimes R, Pinto J, Guerrero J, Chavez H, Salazar C, Lavarello RJ, Parker KJ. H-scan analysis of thyroid lesions. J Med Imaging 2018;5:013505. [DOI] [PMC free article] [PubMed] [Google Scholar]
- Goundan PN, Mamou J, Rohrbach D, Smith J, Patel H, Wallace KD, Feleppa EJ, Lee SL. A preliminary study of quantitative ultrasound for cancer-risk assessment of thyroid nodules. Front Endocrinol 2021;12:627698. [DOI] [PMC free article] [PubMed] [Google Scholar]
- Huang Y, Haeggström E, Bayram B, Zhuang X, Ergun AS, Cheng C-H, Khuri-Yakub BT. Comparison of conventional and collapsed region operation of capacitive micromachined ultrasonic transducers. IEEE Trans Ultrason Ferroelectr Freq Control 2006;53:1918–1933. [DOI] [PubMed] [Google Scholar]
- Insana MF, Wagner RF, Brown DG, Hall TJ. Describing small-scale structure in random media using pulse-echo ultrasound. J Acoust Soc Am 1990;87:179–192. [DOI] [PMC free article] [PubMed] [Google Scholar]
- Jafarpisheh N, Hall TJ, Rivaz H, Rosado-Mendez IM. Analytic global regularized backscatter quantitative ultrasound. IEEE Trans Ultrason Ferroelectr Freq Control 2021;68:1605–1617. [DOI] [PMC free article] [PubMed] [Google Scholar]
- Jevtić P, Levy DL. Mechanisms of nuclear size regulation in model systems and cancer. Adv Exp Med Biol 2014;773:537–569. [DOI] [PubMed] [Google Scholar]
- Joseph J, Ma B, Khuri-Yakub BT. Applications of capacitive micromachined ultrasonic transducers: A comprehensive review. IEEE Trans Ultrason Ferroelectr Freq Control 2022;69:456–467. [DOI] [PubMed] [Google Scholar]
- Khairalseed M, Hoyt K. Integration of a CMUT linear array for wideband H-scan ultrasound imaging. Proc IEEE Ultrason Symp 2019;1:1519–1522. [Google Scholar]
- Khairalseed M, Hoyt K, Ormachea J, Terrazas A, Parker KJ. H-scan sensitivity to scattering size. J Med Imaging 2017;4:043501. [DOI] [PMC free article] [PubMed] [Google Scholar]
- Khairalseed M, Javed K, Jashkaran G, Kim J-W, Parker KJ, Hoyt K. Monitoring early breast cancer response to neoadjuvant therapy using H-scan ultrasound imaging: Preliminary preclinical results. J Ultrasound Med 2019;38:1259–1268. [DOI] [PMC free article] [PubMed] [Google Scholar]
- Khairalseed M, Laimes R, Pinto J, Guerrero J, Chavez H, Salazar C, Ge GR, Parker KJ, Lavarello RJ, Hoyt K. Classification of thyroid nodules in H-scan ultrasound images using texture and prinicipal component analysis. Proc UFFC Latin Am Ultrason Symp 2021;1–4. [Google Scholar]
- Khairalseed M, Laimes R, Pinto J, Guerrero J, Chavez H, Salazar C, Ge GR, Parker KJ, Lavarello RJ, Hoyt K. H-scan ultrasound imaging for the classification of thyroid tumors. Proc UFFC Latin Am Ultrason Symp 2022;1–3. [Google Scholar]
- Khairalseed M, Rijal G, Hoyt K. H-scan format for classification of ultrasound scatterers and matched comparison to histology measurements. Proc IEEE Int Symp Biomedical Imaging 2020a;1:1820–1823. [Google Scholar]
- Khairalseed M, Rijal G, Hoyt K. Spatial comparison between the H-scan format for classification of ultrasound scatterers and histology - Preliminary results using an animal model of breast cancer. Proc IEEE Ultrason Symp 2020b;:1–4. [Google Scholar]
- Khairalseed M, Xiong F, Kim J-W, Mattrey RF, Parker KJ, Hoyt K. Spatial angular compounding technique for H-scan ultrasound imaging. Ultrasound Med Biol 2018;44:267–277. [DOI] [PMC free article] [PubMed] [Google Scholar]
- Lizzi FL, Astor M, Feleppa EJ, Shao M, Kalisz A. Statistical framework for ultrasonic spectral parameter imaging. Ultrasound Med Biol 1997;23:1371–1382. [DOI] [PubMed] [Google Scholar]
- Nam K, Zagzebski JA, Hall TJ. Quantitative assessment of in vivo breast masses using ultrasound attenuation and backscatter. Ultrason Imaging 2013;35:146–161. [DOI] [PMC free article] [PubMed] [Google Scholar]
- Nguyen TN, Podkowa AS, Tam AY, Arnold EC, Miller RJ, Park TH, Do MN, Oelze ML. Characterizing fatty liver in vivo in rabbits using quantitative ultrasound. Ultrasound Med Biol 2019;45:2049–2062. [DOI] [PMC free article] [PubMed] [Google Scholar]
- Oelze M Quantitative ultrasound successes: Past, present and future. SPIE Med Imaging 2020;11319:1–6. [Google Scholar]
- Oelze ML, Mamou J. Review of quantitative ultrasound: Envelope statistics and backscatter coefficient imaging and contributions to diagnostic ultrasound. IEEE Trans Ultrason Ferroelectr Freq Control 2016;63:336–351. [DOI] [PMC free article] [PubMed] [Google Scholar]
- Oelze ML, O’Brien WD, Blue JP, Zachary JF. Differentiation and characterization of rat mammary fibroadenomas and 4T1 mouse carcinomas using quantitative ultrasound imaging. IEEE Trans Med Imaging 2004;23:764–771. [DOI] [PubMed] [Google Scholar]
- Osapoetra LO, Chan W, Tran W, Kolios MC, Czarnota GJ. Comparison of methods for texture analysis of QUS parametric images in the characterization of breast lesions. PLoS One 2020a; 15:e0244965. [DOI] [PMC free article] [PubMed] [Google Scholar]
- Osapoetra LO, Sannachi L, DiCenzo D, Quiaoit K, Fatima K, Czarnota GJ. Breast lesion characterization using quantitative ultrasound (QUS) and derivative texture methods. Transl Oncol 2020b; 13:100827. [DOI] [PMC free article] [PubMed] [Google Scholar]
- Parker KJ. Scattering and reflection identification in H-scan images. Phys Med Biol 2016;61:L20–28. [DOI] [PubMed] [Google Scholar]
- Parker KJ. Shapes and distributions of soft tissue scatterers. Phys Med Biol 2019a;64:175022. [DOI] [PMC free article] [PubMed] [Google Scholar]
- Parker KJ. The first order statistics of back scatter from the fractal branching vasculature. J Acoust Soc Am 2019b;146:3318. [DOI] [PMC free article] [PubMed] [Google Scholar]
- Pasternak M, Doss L, Farhat G, Al-Mahrouki A, Kim CH, Kolios M, Tran WT, Czarnota GJ. Effect of chromatin structure on quantitative ultrasound parameters. Oncotarget 2017;8:19631–19644. [DOI] [PMC free article] [PubMed] [Google Scholar]
- Pasternak MM, Sadeghi-Naini A, Ranieri SM, Giles A, Oelze ML, Kolios MC, Czarnota GJ. High-frequency ultrasound detection of cell death: Spectral differentiation of different forms of cell death in vitro. Oncoscience 2016;3:275–287. [DOI] [PMC free article] [PubMed] [Google Scholar]
- Pirmoazen AM, Khurana A, El Kaffas A, Kamaya A. Quantitative ultrasound approaches for diagnosis and monitoring hepatic steatosis in nonalcoholic fatty liver disease. Theranostics 2020;10:4277–4289. [DOI] [PMC free article] [PubMed] [Google Scholar]
- Sadeghi-Naini A, Papanicolau N, Falou O, Zubovits J, Dent R, Verma S, Trudeau M, Boileau JF, Spayne J, Iradji S, Sofroni E, Lee J, Lemon-Wong S, Yaffe M, Kolios MC, Czarnota GJ. Quantitative ultrasound evaluation of tumor cell death response in locally advanced breast cancer patients receiving chemotherapy. Clin Cancer Res 2013;19:2163–2174. [DOI] [PubMed] [Google Scholar]
- Sadeghi-Naini A, Sannachi L, Tadayyon H, Tran WT, Slodkowska E, Trudeau M, Gandhi S, Pritchard K, Kolios MC, Czarnota GJ. Chemotherapy-response monitoring of breast cancer patients using quantitative ultrasound-based intra-tumour heterogeneities. Sci Rep 2017a;7:10352. [DOI] [PMC free article] [PubMed] [Google Scholar]
- Sadeghi-Naini A, Suraweera H, Tran WT, Hadizad F, Bruni G, Rastegar RF, Curpen B, Czarnota GJ. Breast-lesion characterization using textural features of quantitative ultrasound parametric maps. Sci Rep 2017b;7:13638. [DOI] [PMC free article] [PubMed] [Google Scholar]
- Shashni B, Ariyasu S, Takeda R, Suzuki T, Shiina S, Akimoto K, Maeda T, Aikawa N, Abe R, Osaki T, Itoh N, Aoki S. Size-based differentiation of cancer and normal cells by a particle size analyzer assisted by a cell-recognition PC software. Biol Pharm Bull 2018;41:487–503. [DOI] [PubMed] [Google Scholar]
- Stephens AD, Liu PZ, Banigan EJ, Almassalha LM, Backman V, Adam SA, Goldman RD, Marko JF. Chromatin histone modifications and rigidity affect nuclear morphology independent of lamins. Mol Biol Cell 2018;29:220–233. [DOI] [PMC free article] [PubMed] [Google Scholar]
- Tadayyon H, Sannachi L, Gangeh M, Sadeghi-Naini A, Tran W, Trudeau ME, Pritchard K, Ghandi S, Verma S, Czarnota GJ. Quantitative ultrasound assessment of breast tumor response to chemotherapy using a multi-parameter approach. Oncotarget 2016;7:45094–45111. [DOI] [PMC free article] [PubMed] [Google Scholar]
- Tadayyon H, Sannachi L, Gangeh MJ, Kim C, Ghandi S, Trudeau M, Pritchard K, Tran WT, Slodkowska E, Sadeghi-Naini A, Czarnota GJ. A priori prediction of neoadjuvant chemotherapy response and survival in breast cancer patients using quantitative ultrasound. Sci Rep 2017;7:45733. [DOI] [PMC free article] [PubMed] [Google Scholar]
- Tai H, Khairalseed M, Hoyt K. 3-D H-scan ultrasound imaging and use of a convolutional neural network for scatterer size estimation. Ultrasound Med Biol 2020;46:2810–2818. [DOI] [PMC free article] [PubMed] [Google Scholar]
- Tai H, Song J, Li J, Reddy S, Khairalseed M, Hoyt K. Three-dimensional H-scan ultrasound imaging of early breast cancer response to neoadjuvant therapy in a murine model. Invest Radiol 2022;57:222–232. [DOI] [PMC free article] [PubMed] [Google Scholar]
- Tang A, Destrempes F, Kazemirad S, Garcia-Duitama J, Nguyen BN, Cloutier G. Quantitative ultrasound and machine learning for assessment of steatohepatitis in a rat model. Eur Radiol 2019;29:2175–2184. [DOI] [PubMed] [Google Scholar]
- Vajihi Z, Rosado-Mendez IM, Hall TJ, Rivaz H. Low variance estimation of backscatter quantitative ultrasound parameters using dynamic programming. IEEE Trans Ultrason Ferroelectr Freq Control 2018;65:2042–2053. [DOI] [PMC free article] [PubMed] [Google Scholar]
- Vallet M, Varray F, Boutet J, Dinten J-M, Caliano G, Savoia AS, Vray D. Quantitative comparison of PZT and CMUT probes for photoacoustic imaging: Experimental validation. Photoacoustics 2017;8:48–58. [DOI] [PMC free article] [PubMed] [Google Scholar]
- Waag RC, Dalecki D, Christopher PE. Spectral power determinations of compressibility and density variations in model media and calf liver using ultrasound. J Acoust Soc Am 1989;85:423–431. [DOI] [PubMed] [Google Scholar]
- Zhao D, Zhuang S, Daigle R. A commercialized high frequency CMUT probe for medical ultrasound imaging. Proc IEEE Ultrason Symp 2015;1–4. [Google Scholar]
- Zhou Z, Wu W, Wu S, Jia K, Tsui P-H. A review of ultrasound tissue characterization with mean scatterer spacing. Ultrason Imaging 2017;39:263–282. [DOI] [PubMed] [Google Scholar]
Associated Data
This section collects any data citations, data availability statements, or supplementary materials included in this article.
Data Availability Statement
All data presented in this paper is available upon reasonable request.