

Abstract
Direct, quantitative measures of hyperactivity and motor coordination, two motor characteristics associated with impairment in autism, are limited in number. Wearable sensors might objectively index real-world movement variables that may relate to these behaviors. Here, we explored the feasibility of bilateral wrist accelerometers for measuring upper limb activity in 3–10-year-olds with autism (n = 22; 19 boys, 3 girls; M age = 5.64, SD = 2.73 years) and without autism (n = 26; 15 boys, 11 girls; M age = 6.26, SD = 2.47 years). We investigated the relationships between movement characteristics related to duration, intensity, complexity, and symmetry on the one hand and parent-reported hyperactivity and motor coordination on the other. Participants with and without autism wore the sensors for 12-hour periods. Sensor variables varied by age but not by sex, with movement intensity and complexity moderately related to motor coordination. These findings lend preliminary support to wearable sensors as a means of providing ecologically-valid metrics of motor characteristics that impact adaptive function in children with autism.
Keywords: Accelerometry, Autism, Wearable sensors, Movement disorders, Motor behavior
Introduction
Autism Spectrum Disorder (ASD) is a highly heritable neurodevelopmental condition that affects 1 in 54 children (Maenner et al., 2020). ASD is defined by persistent social and communication impairments and rigid, repetitive patterns of behavior (American Psychiatric Association, 2013). While not a diagnostic criterion, motor impairment is a nearly universal characteristic of ASD (Green et al., 2009; Mosconi & Sweeney, 2015). As many as 83% of children with ASD experience motor impairments (Hilton et al., 2012), and these impairments are often substantial relative to typically developing peers (Fournier et al., 2010). Importantly, motor deficits in infants later diagnosed with ASD have emerged as early as the first months of life (Teitelbaum et al., 1998), and motor dysfunction has been hypothesized to be a central factor in the development of ASD (Chukoskie et al., 2013). A child who struggles to execute goal-directed movements may also struggle to interact socially, explore the environment, and learn new skills (Glazebrook et al., 2006; R. B. Wilson et al., 2018; Xavier et al., 2019), and motor skill deficits have been associated with increased ASD severity (MacDonald et al., 2013).
Two motor behaviors frequently observed in individuals with ASD are hyperactivity and impaired motor coordination (Mous et al., 2017; Pohl et al., 2019), and there are high rates of co-occurrence between ASD, Attention-Deficit/Hyperactivity Disorder (ADHD), and Developmental Coordination Disorder (DCD) (Ketcheson et al., 2021; Murray, 2010). Poor coordination, or dyspraxia, refers to difficulties in the organization, planning, and execution of goal-directed movements (Gibbs et al., 2007). Hyperactivity is an excessive or developmentally inappropriate level of motor activity that commonly manifests in behaviors such as fidgeting, climbing, or difficulty staying in a seat (Lis et al., 2010; Magnus et al., 2021). In this context, hyperactivity and motor coordination have been viewed as motor traits (Faraone & Larsson, 2019; Lichtenstein et al., 2010) that are continuously distributed across the population (Kadesjö & Gillberg, 1998; Romano et al., 2006). Evidence suggests that they may account for over 50% of the variance in ASD recurrence in siblings of affected probands (Mous et al., 2017), consistent with shared inherited aspects of both motor traits and ASD. The ability to measure variations in hyperactivity and motor coordination objectively and quantitatively would enhance clinical assessment in ASD.
Investigations of motor function have typically involved standardized assessments administered by a clinician (Staples & Reid, 2010; R. B. Wilson et al., 2018). While such tools have provided valuable data, these are time-consuming laboratory-based assessment methods that are do not reflect real-world environments and behavior. Proxy reports from questionnaires administered to caregivers have been alternative assessment tools, but they may have limited accuracy (Rice et al., 2013). Direct behavioral observations or video recording have been used, but they are labor-intensive and require trained, reliable raters. A promising assessment alternative, addressed within this study, is the procurement of movement data through wearable sensors, possibly adding valuable information about behavior in naturalistic environments and complementing currently-available assessment methods.
Wearable sensors can be used to record real-world movement, and their use has expanded greatly in both research and consumer use (Lang et al., 2020; Peake et al., 2018). Wearable sensors such as Fitbit or Apple Watch have often been used to quantify the wearer’s gross physical activity or step counts. Wearable sensors have also been used in autism research to quantify gross physical activity levels, measure physiological responses (e.g. heart rate), study stereotyped behaviors, or monitor sleep (Benson et al., 2019; Fioriello et al., 2020; Goldman et al., 2017; Pan et al., 2011; Pan & Frey, 2006). These methodologies typically employ sensors at the ankle, hip, or upper arm.
Accelerometers are wearable devices that record linear movement acceleration in three dimensions. This acceleration is quantified in gravitational units (g’s), from which variables can be extracted that operationalize four characteristics of human movement: duration, intensity, symmetry, and complexity. Duration and/or intensity variables may quantify hyperactivity, as suggested by ankle-worn sensors in infants (Reetzke et al., 2021) and school-age children (Wood et al., 2009). Symmetry and/or complexity variables may quantify impaired coordination (Stergiou & Decker, 2011). The statistical relationships between these separate data may be used with children with autism to explore early risk assessment, clinical subtyping, developmental monitoring, and responses to interventions. For example, some motor disturbances have been found to emerge prior to other core autistic symptoms (Teitelbaum et al., 1998). Identifying the distributions of key sensor-derived variables might help define intermediate phenotypes that progress to more serious symptoms and thereby contribute to the additive developmental risk of having ASD.
Our purpose in this feasibility study was to examine the use of wearable movement sensors for quantifying and better describing the motor traits of hyperactivity and impaired coordination in a sample of children with and without ASD. We had three objectives. First, we explored the feasibility of bilateral wrist accelerometry for prolonged recording periods in children aged 3–10 years, with and without ASD. We hypothesized that 12 hours of bilateral wrist accelerometry would be achievable. Second, we explored how sex and age might relate to the obtained data from these sensors, given the well-established relationships between these variables and motor activity (Ishii et al., 2015; Trost et al., 2002). We hypothesized that sex and age would relate to movement duration and intensity. Third, we explored how data from the sensor variables might relate to parent-reported hyperactivity and coordination. To address this third objective, we used a dimensional approach to explore hyperactivity and motor coordination traits that are distributed across the population and quantitatively determine how they may relate to ASD liability. We hypothesized that movement duration and intensity would be positively correlated with parent-reported hyperactivity scores and that problems in movement symmetry and complexity would be positively correlated with parent-reported motor incoordination scores.
Method
Participants
We recruited 3–10-year-old children with and without ASD. We chose this age range because (a) there are already well established and previously validated questionnaires available for assessing hyperactivity in children of this age; (b) ASD diagnoses are likely to be stable at this age;, and (c) children this age are generally able to provide feedback related to the experience of wearing the sensors. Thus, we recruited children with ASD from community recreation programs, the Washington University Clinical Center, or word of mouth among colleagues. We were able to confirm an ASD diagnosis by a psychiatrist, neurologist, or other licensed mental health professional in all but two cases. In the two unconfirmed cases, the ASD diagnosis was parent-reported. We excluded children with ASD who were nonverbal. We recruited typically developing children in our control group by word-of-mouth. Based on parent-report, all participants with typical development were free from any neurodevelopmental conditions. Children with ASD were still included if they had comorbid ADHD or DCD since there is a frequent co-occurrence of these conditions among children with ASD and we were interested in recruiting a heterogeneous group of children with ASD. Participants were excluded from both groups if parents reported the presence of orthopedic or neurologic conditions that would alter their habitual movements.
We enrolled participants between November 2019 and October 2020. Parents of all participants provided written informed consent and participants ≥6 years old provided their verbal assent. We enrolled a total of 65 participants; 12 withdrew from the study, three parents reported insufficient time to complete the study, one participant was unwilling to wear the sensors, and one parent reported losing the sensors. Seven other families from among the original recruits provided no reasons for their withdrawal, but we believe it likely that daily life disruptions associated with the COVID-19 pandemic in 2020 contributed heavily to changes in their willingness to participate. Beyond these withdrawals, four participants had insufficient recorded data for later analysis, and one participant in the typically developing group was found to have Kabuki syndrome and was excluded from the analysis. Thus, we analyzed data from a final sample of 48 children (22 with ASD and 26 with typical development). Seven participants in the ASD group were reported to be on prescription medications (five on stimulants and two on alpha-adrenergic agonists). None of the children in the typically developing group were reported to be on prescription medications.
The enrollment process was performed in person until March 2020, after which a contactless recruitment process was used, due to the COVID-19 pandemic. For contactless enrollment, communications with parents took place by phone and study materials (consent forms, wearable accelerometers, questionnaires, etc.) were mailed to the participants’ homes. Families received $25 per participant for their time and inconvenience. The research protocol for this study was approved by the Washington University Human Research Protection Office, and it conformed to the principles of the Declaration of Helsinki.
Study Protocol
The participant’s parent or legal guardian received verbal and written instruction on the placement of the Actigraph sensors. Parents were asked to have the participant wear the sensors on both wrists for 12 hours on any two days; the days did not need to be contiguous. We recommended that the sensors be worn from morning wake-up until bedtime. Twelve hours were chosen to capture most waking hours and two recording days were chosen to allow us to determine the stability of sensor variables across days. We limited the number of days to two to minimize the burden of participation on the families. Sensors were placed on each wrist just proximal to the ulnar styloid (Figure 1). We encouraged continuous wearing, but parents were instructed to remove the sensors if the child was swimming or experiencing skin irritation or other adverse reactions. All parents were contacted after study materials were delivered to reinforce correct sensor placement and encourage wearing.
Figure 1.
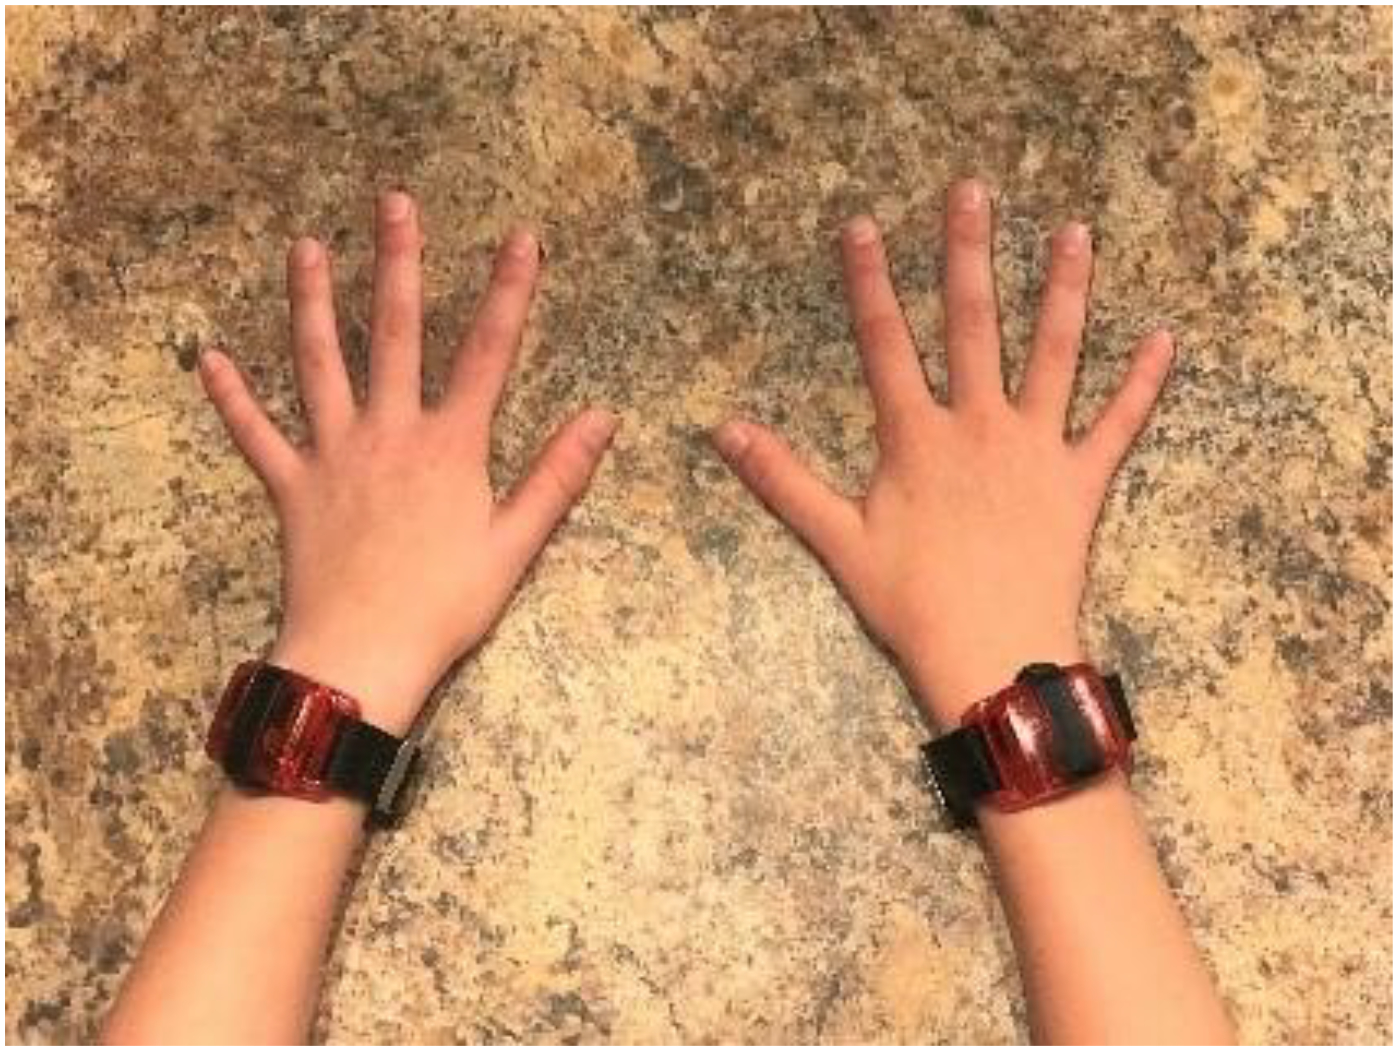
Wearable Sensor Placement on Participant’s Wrists.
Bilateral sensors at the wrist are a valid and reliable way to capture upper limb motion during prolonged periods (Bailey et al., 2014; Hoyt et al., 2019; Lang et al., 2013). We used GT3X-BT Activity Monitors (Actigraph, Pensacola, FL) that have a 3-axis, solid-state accelerometer with a dynamic range of ±8 gravitational units and recorded at 30 Hz. The device was unobtrusive and resembled a wristwatch (see Figure 1). The battery life of the device was approximately one month, giving parents flexibility in selecting when participants would wear the sensors. A nylon buckle wristband was chosen as they are nonabsorbent and easily cleaned.
Parents provided their children’s demographic information, health history, and a log of the children’s accelerometer wearing periods. We also recorded parent-reported household income and calculated an Area Deprivation Index (ADI) which is a measure of neighborhood socioeconomic disadvantage based on the participant’s home address (Kind & Buckingham, 2018). We used household income and the ADI to determine if our groups differed with respect to their socioeconomic status.
Motor Coordination, Hyperactivity, and Autism Symptom Measures
Motor Coordination
We used the parent-completed Developmental Coordination Disorder Questionnaire (DCDQ for ages 5–15; Cairney et al., 2008) and the Little DCDQ (for ages 3 and 4; B. N. Wilson et al., 2015) to quantify parental perceptions of the children’s motor coordination. Scores on both questionnaires range from 0–75, with higher scores indicating greater motor coordination and a cutoff score that varied by age group. The DCDQ has a Cronbach’s alpha of 0.94 and correlates with the Movement Assessment Battery for Children at r = 0.55 (B. N. Wilson et al., 2009). The Little DCDQ has a Cronbach’s alpha of 0.70 and can differentiate between children with and without DCD (Rihtman et al., 2011). We used raw scores in our analyses, as there are no standardized scores.
Hyperactivity
We used subtests from The Conners-3 Parents’ Rating Scale (for ages 6–18) (Cabral et al., 2020) or from the Conners-Early Childhood Scale (Conners-EC, ages 2–6) (Conners, 2009) to quantify the children’s parent-reported levels of hyperactivity. These questionnaires have been designed to distinguish children with and without ADHD, and they include items for parent ratings of cognitive, behavioral, and emotional symptoms related to ADHD. We used the restlessness subtest score of the Global Index from both the Conners-3 and the Conners-EC (hereafter referred to only as the Conners) to serve as a focused indicator of consistent motor hyperactivity. The Global Index has an ordinal alpha of 0.96 for the Conners-3 and 0.92 for the Conners-EC and the Conners-EC Global Index correlates with the Kiddie Schedule for Affective Disorders and Schizophrenia (K-SADS, a semi-structured diagnostic interview administered by trained clinicians) total score at 0.63 (Morales-Hidalgo et al., 2017). We selected this subtest index because it is shared across both test versions. We extracted this score as a T-score with a mean of 50 and a standard deviation of 10.
Autistic Traits
We used parent reports on the Social Responsiveness Scale-2 (SRS-2) School Age (ages 4–18) (Constantino et al., 2003; Constantino & Gruber, 2012) or the SRS-2 Preschool (ages 2.5–4.5) (Pine et al., 2006) to quantify the children’s autistic symptoms. The Cronbach’s alpha for the parent-report form is ≥0.92 at all ages (Constantino & Gruber, 2012). We extracted the SRS T-score to compare children across age groups (hereafter referred to as the SRS). A T-score of less than or equal to 59 on either SRS is indicative of typical development and T-scores of 76 or greater as indicative of severe ASD.
Accelerometry Data Extraction
We downloaded accelerometry data from the accelerometer device using ActiLife 6 software (Actigraph, Pensacola, FL). We then plotted the data and visually inspected that the sensors were worn continuously for the specified wearing periods. For the extraction of sensor variables, we used both the original 30 Hz data and a copy of the data down-sampled to 1 Hz. Most variables were extracted from the 1 Hz data because temporal resolution of less than one second is not necessary for the variables of interest. Movement frequency-based complexity variables were extracted from the 30 Hz data, as indicated in Table 1. These 1 Hz data were band-pass filtered between 0.25–2.5 Hz, using Actilife’s proprietary process to remove the constant linear accelerations, such as gravity and non-human accelerations due to external motion (e.g., riding in a car or elevator). For these 30 Hz variables, we converted the time series data from the time domain to the frequency domain with a fast Fourier transformation and bandpass filtered from 0.2 to 12 Hz, also to remove constant linear acceleration components.
Table 1.
Accelerometer Sensor Variables
| Movement Characteristic | Variable | Hz | Definition |
|---|---|---|---|
| Duration | Total Movement Hours | 1 | Total time spent moving for the 12-hour period1. |
| Right Only Hours | 1 | Total time only the right arm was moving for the 12-hour period2. | |
| Left Only Hours | 1 | Total time only the left arm was moving for the 12-hour period2. | |
| Simultaneous Hours | 1 | Total time spent moving both limbs at the same time for the 12-hour period1. | |
| Maximum Hour-Right Hours | 1 | Proportion of the maximum activity hour in which the right arm was moving. | |
| Maximum Hour-Left Hours | 1 | Proportion of the maximum activity hour in which the left arm was moving. | |
| Intensity | Total Magnitude | 1 | Sum of accelerations from both limbs for the 12-hour period1. |
| Right Magnitude | 1 | Sum of accelerations for the right arm for the 12-hour period1. | |
| Left Magnitude | 1 | Sum of accelerations for the left arm for the 12-hour period1. | |
| Symmetry | Vector Magnitude Correlation | 1 | The correlation coefficient between the vector magnitude time series of the right and left arm. |
| Use Ratio | 1 | Ratio of the total movement duration of the non-dominant arm compared to the dominant arm for the 12-hour period3. | |
| Complexity | Right Variance | 1 | SD of the vector magnitude from the right arm for the 12-hour period4. |
| Left Variance | 1 | SD of the vector magnitude from that left arm for the 12-hour period4. | |
| Entropy | 30 | A measure of time series variability from the accelerations of one arm for the hour of maximum activity. Calculated as sample entropy. Higher values indicate a more random signal5. | |
| Variance of the Frequency Spectrum | 30 | The weighted SD of the component frequencies from the acceleration time series from one arm for the 12-hour period6. | |
| Mean of the Frequency Spectrum | 30 | The weighted mean of the component frequencies from the acceleration time series from one arm for the 12-hour period6. | |
| Average Jerk | 30 | Rate of change of acceleration from one arm for the 12-hour period. Higher jerk represents less smooth motion7, 8. |
Note: Footnoted data were based on specific prior publications as follows:
We completed data extraction by first extracting the separate 12-hour wearing periods from the larger recording duration. We manually trimmed periods during the daytime when the participant did not wear the sensors or when the participant slept, as determined by the parent-completed log of sensor wear times and confirmed by visually examining the data. Second, we combined the accelerations from each axis into a single vector magnitude value using the equation √(x2 + y2 + z2). Since recordings were made while participants were going about their daily life, participants may have engaged in any number of movement activities during the wearing period. To control for varying relative levels of activity across participants, our third step was to extract the maximum hour, median hour, and minimum hour of activity intensity, based on the vector magnitude of the dominant limb. Candidate sensor variables were then calculated for each of the four time periods (12-hour total, maximum hour, median hour, and minimum hour). The sensor variables (Table 1) operationalized four characteristics of human movement: (a) duration, (b) intensity, (c) symmetry, and (d) complexity. Duration variables quantified the amount of time that one or both limbs were moving. Intensity variables summed the magnitude of the movement accelerations for one or both limbs and were reported in gravitational units (g’s). Faster or more numerous movements of the upper limb produced a higher value. Symmetry variables quantified the relative contribution of the two limbs during movement.
Complexity was a more heterogeneous movement category that included the variance in the magnitude of the signal as measured by its standard deviation, and variance in the time series as measured by entropy. Entropy represented the number of times the patterns in a signal were repeated and ranged in value from zero (perfectly regular, such as a sine wave) to two (perfectly random, such as white noise) (Richman & Moorman, 2000; Sokunbi, 2014). While several entropy calculations are available, we chose sample entropy because it is largely independent of data length and shows more consistency than other entropy measures; it has been used with other human movement data sets (Montesinos et al., 2018).
We also characterized complexity by finding the weighted mean and weighted standard deviation of the frequency spectrum acceleration time series. A wider variance in the frequencies employed during movement has been posited as more complex movement (R. B. Wilson et al., 2021). Small samples of five infants with accelerometers secured at the ankles showed that less variance in movement frequencies (lower complexity of movement) was related to later ASD outcomes. Finally, we used average jerk (the third derivative of position) to quantify smoothness of movement (Gulde & Hermsdörfer, 2018). In the motor control and engineering literature, poor coordination between limb segments has been represented by an increase in jerk (De Lucena et al., 2017; Hogan & Sternad, 2009).
Extracting multiple sensor variables from multiple time segments of the same recording period created a large data set with many highly correlated variables. Thus, most of the variables from the maximum activity hour and all variables from the median activity hour were removed due to their high correlations with the 12-hour variables. All variables from the minimum hour were removed as they did not relate to any other variables of interest. The final set of sensor variables used in our analyses are defined with references in Table 1. We chose to index the upper limbs as right and left. Running the analysis with the limbs indexed by hand dominance did not change the results.
Statistical Analyses
All data extraction and statistical analyses were performed in the R environment version 4.0.5 (R Core Team, 2020). Statistical significance was set at alpha < 0.05. Student’s t-tests or Chi-square tests were used to determine group differences. To determine the feasibility of bilateral wrist accelerometry, we calculated the mean and variance of the duration that participants wore the sensors. We also compared the sensor variables that were derived from the two separate days and between groups using paired t-tests. Where group differences were significant, we reported the effect size. Pearson correlations were used to evaluate relationships between age and sensor variables. Spearman correlations were used to evaluate relationships among the ordinal questionnaire scores or between the ordinal questionnaire scores and the sensor variables. Relationships between the sensor variables and the questionnaires were examined using partial correlations that controlled for age. We had sufficient statistical power to detect a zero-order Pearson correlation of 0.39; however, due to our sample size and the use of partial Spearman correlations, some correlation values as low as 0.24 were significant. Given the exploratory goals of this pilot study, which entailed an initial characterization of the magnitude and direction of relationships involving sensor variables, we did not adjust p-values.
Results
Participant Characteristics
We first analyzed sensor recordings from the 22 children with ASD and the 26 children with neurotypical development (total N = 48). Their demographic information and questionnaire scores are displayed in Table 2.
Table 2.
Participant Characteristics by Group, Showing Means (and Standard Deviations), Frequency Percentages, and Statistically Significant and Nonsignificant Group Differences
| ASD n=22 |
Neurotypical n=26 |
p-value | |
|---|---|---|---|
| Sex: | 0.06 | ||
| Female | 3 (13.6%) | 11 (42.3%) | |
| Male | 19 (86.4%) | 15 (57.7%) | |
| Age | 5.64 (2.73) | 6.26 (2.47) | 0.42 |
| Handedness: | 0.37 | ||
| Right | 14 (63.6%) | 24 (92.3%) | |
| Left | 3 (13.6%) | 2 (7.7%) | |
| Not Reported | 5 (22.7%) | 0 (0.0%) | |
| Race: | 0.002 | ||
| White | 14 | 23 | |
| Black/African American | 6 | 0 | |
| Asian | 0 | 3 | |
| American Indian or Alaska Native | 0 | 0 | |
| Native Hawaiian or other Pacific Islander | 0 | 0 | |
| No Response | 2 | 0 | |
| Ethnicity: | 1.0 | ||
| Non-Hispanic/Non-Latino | 16 | 24 | |
| Hispanic/Latino | 3 | 2 | |
| No Response | 3 | 0 | |
| ADI | 42.24 (25.23) | 29.84 (21.65) | 0.08 |
| Household Income: | 0.02 | ||
| <$5,000 | 2 | 0 | |
| $5,000 – 11,999 | 0 | 0 | |
| $12,000 – 15,999 | 1 | 0 | |
| $16,000 – 24,999 | 0 | 0 | |
| $25,000 – 34,999 | 2 | 0 | |
| $35,000 – 49,999 | 0 | 2 | |
| $50,000 – 74,999 | 3 | 1 | |
| $75,000 – 99,999 | 1 | 8 | |
| ≥$100,000 | 6 | 15 | |
| Unknown/Choose not to answer | 2 | 0 | |
| Wear Time | 11.2 (1.61) | 11.5 (1.05) | 0.34 |
| SRS t-score | 71.0 (11.9) | 44.8 (3.84) | <0.001 |
| Conners Global Index – Restlessness t-score | 69.4 (14.8) | 46.3 (7.35) | <0.001 |
| DCDQ | 45.6 (15.9) | 70.5 (4.79) | <0.001 |
| Adverse Events | 0 | 0 |
Note: SRS: Social Responsiveness Scale; DCDQ: Developmental Coordination Disorder Questionnaire
Participant groups were not statistically different for age or ADI; but they differed significantly by parent-reported race and income, and there was a borderline significant group difference in sex. As expected, the groups differed on scores for autistic symptoms, hyperactivity, and motor coordination, with children with ASD showing higher levels of these characteristics than children with typical development. The ASD group’s mean SRS score was well within the range for clinically significant ASD on this instrument. The group with ASD also attained a higher Conners’ restlessness sub-score than did children with typical development. The ASD group’s average DCDQ score suggested that many of these children fell into the range of a suspected DCD. The distributions of the data from parent-reported questionnaires are plotted in Figure 2. The correlation between the SRS and the DCDQ was ρ = −0.73, between the SRS and Conners it was ρ = 0.69, and between the DCDQ and Conners it was ρ = −0.69.
Figure 2.
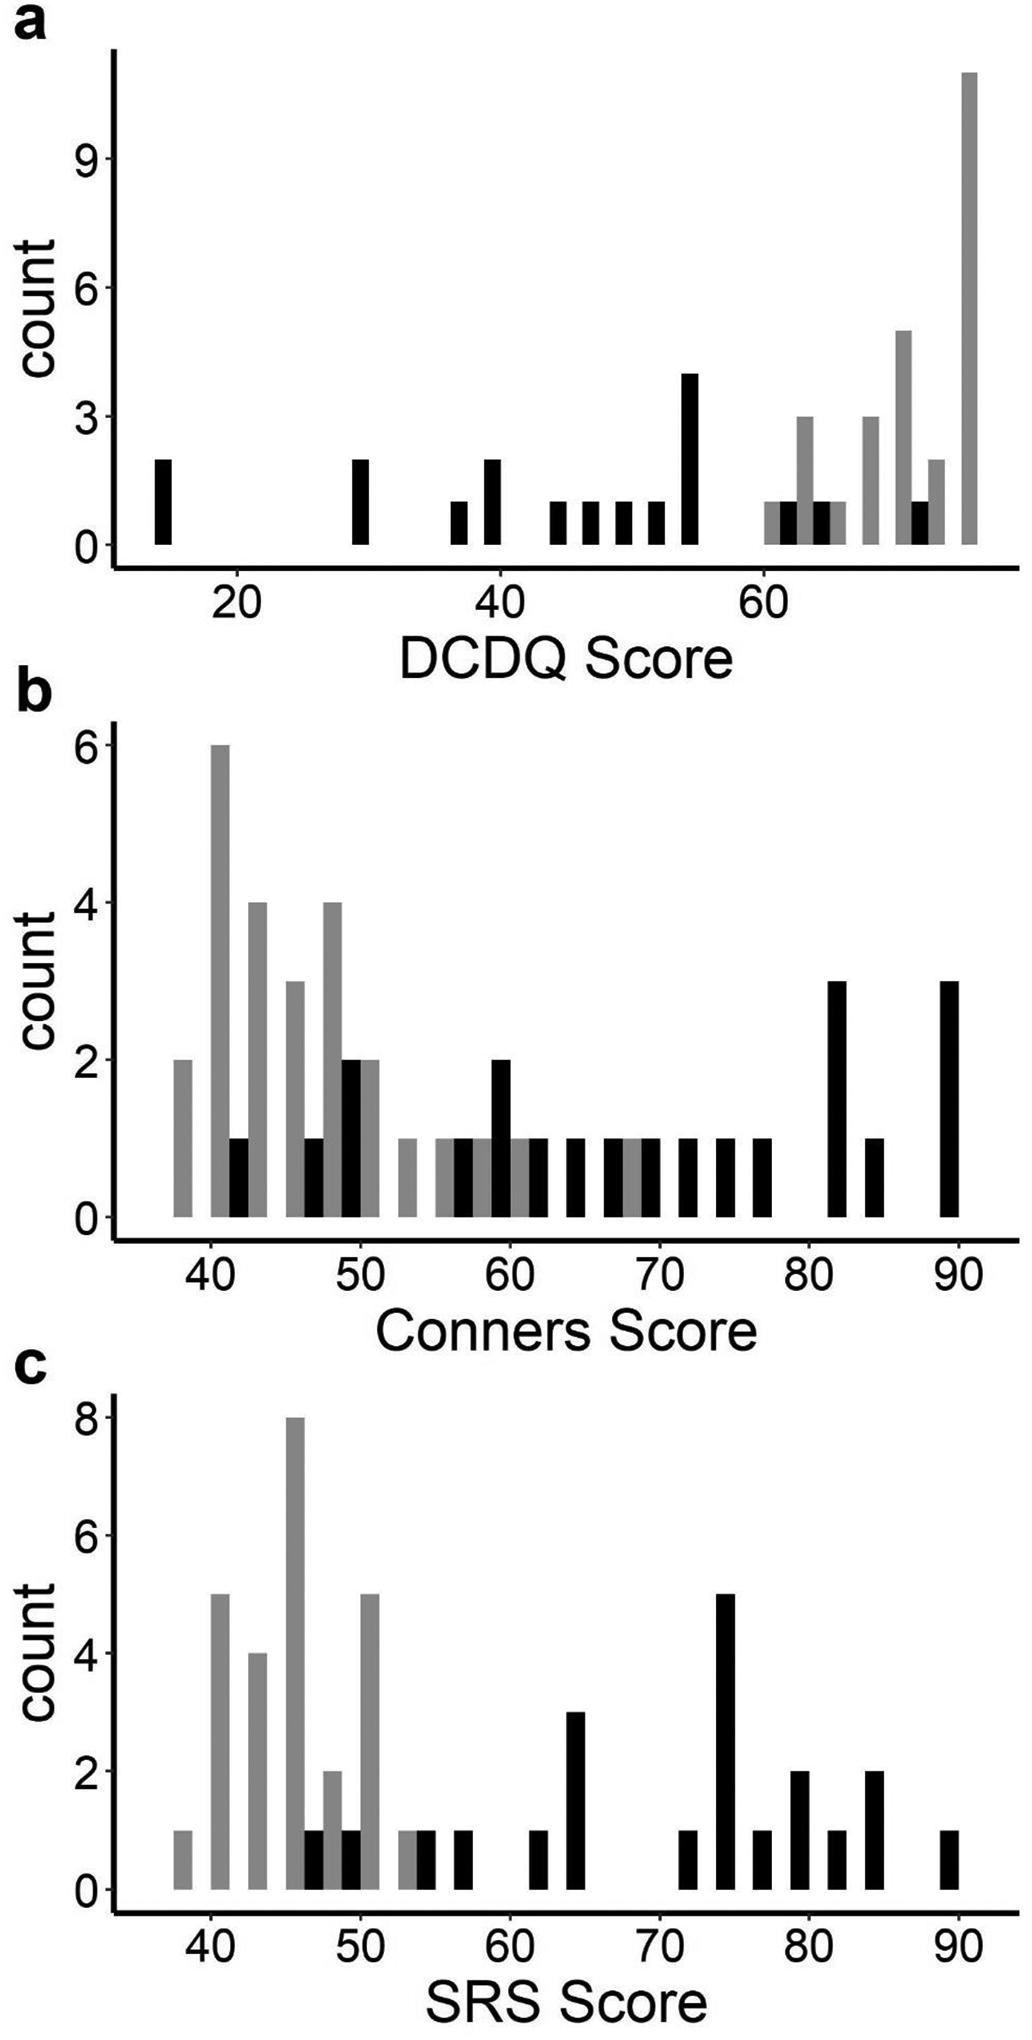
Distributions of Data from Parent-Report Questionnaires.
Note: Black = ASD group; grey = Neurotypical group. Lower scores signify impairment on the DCDQ. Higher Scores signify impairment for the Conners and SRS questionnaires.
Feasibility of Wearing Bilateral Wrist Sensors
Of the 12 hours per day the participants were asked to wear sensors, they achieved an overall average wear time of 11.4 (SD =1.3) hours, with no significant group difference (p = 0.34). There were zero reports of adverse events or behavioral issues due to the wearable sensors. When we compared the two recorded days, none of the sensor variables differed across them (all p values > 0.05). All subsequent analyses were based on the longer of the two recorded days for each participant. The average wear time for these longer recording days was 11.8 (SD =0.6) hours.
Sex and Age Effects on Sensor Variables
There were no significant sensor variable differences between male and female participants (all p values > 0.05), including the magnitude variables that reflect the overall intensity of movement (Figure 3a). Eight of 17 sensor variables were weakly or moderately related to age (see Table 3). Representative sex and age relationships with sensor variables are plotted in Figure 3c – f.
Figure 3.
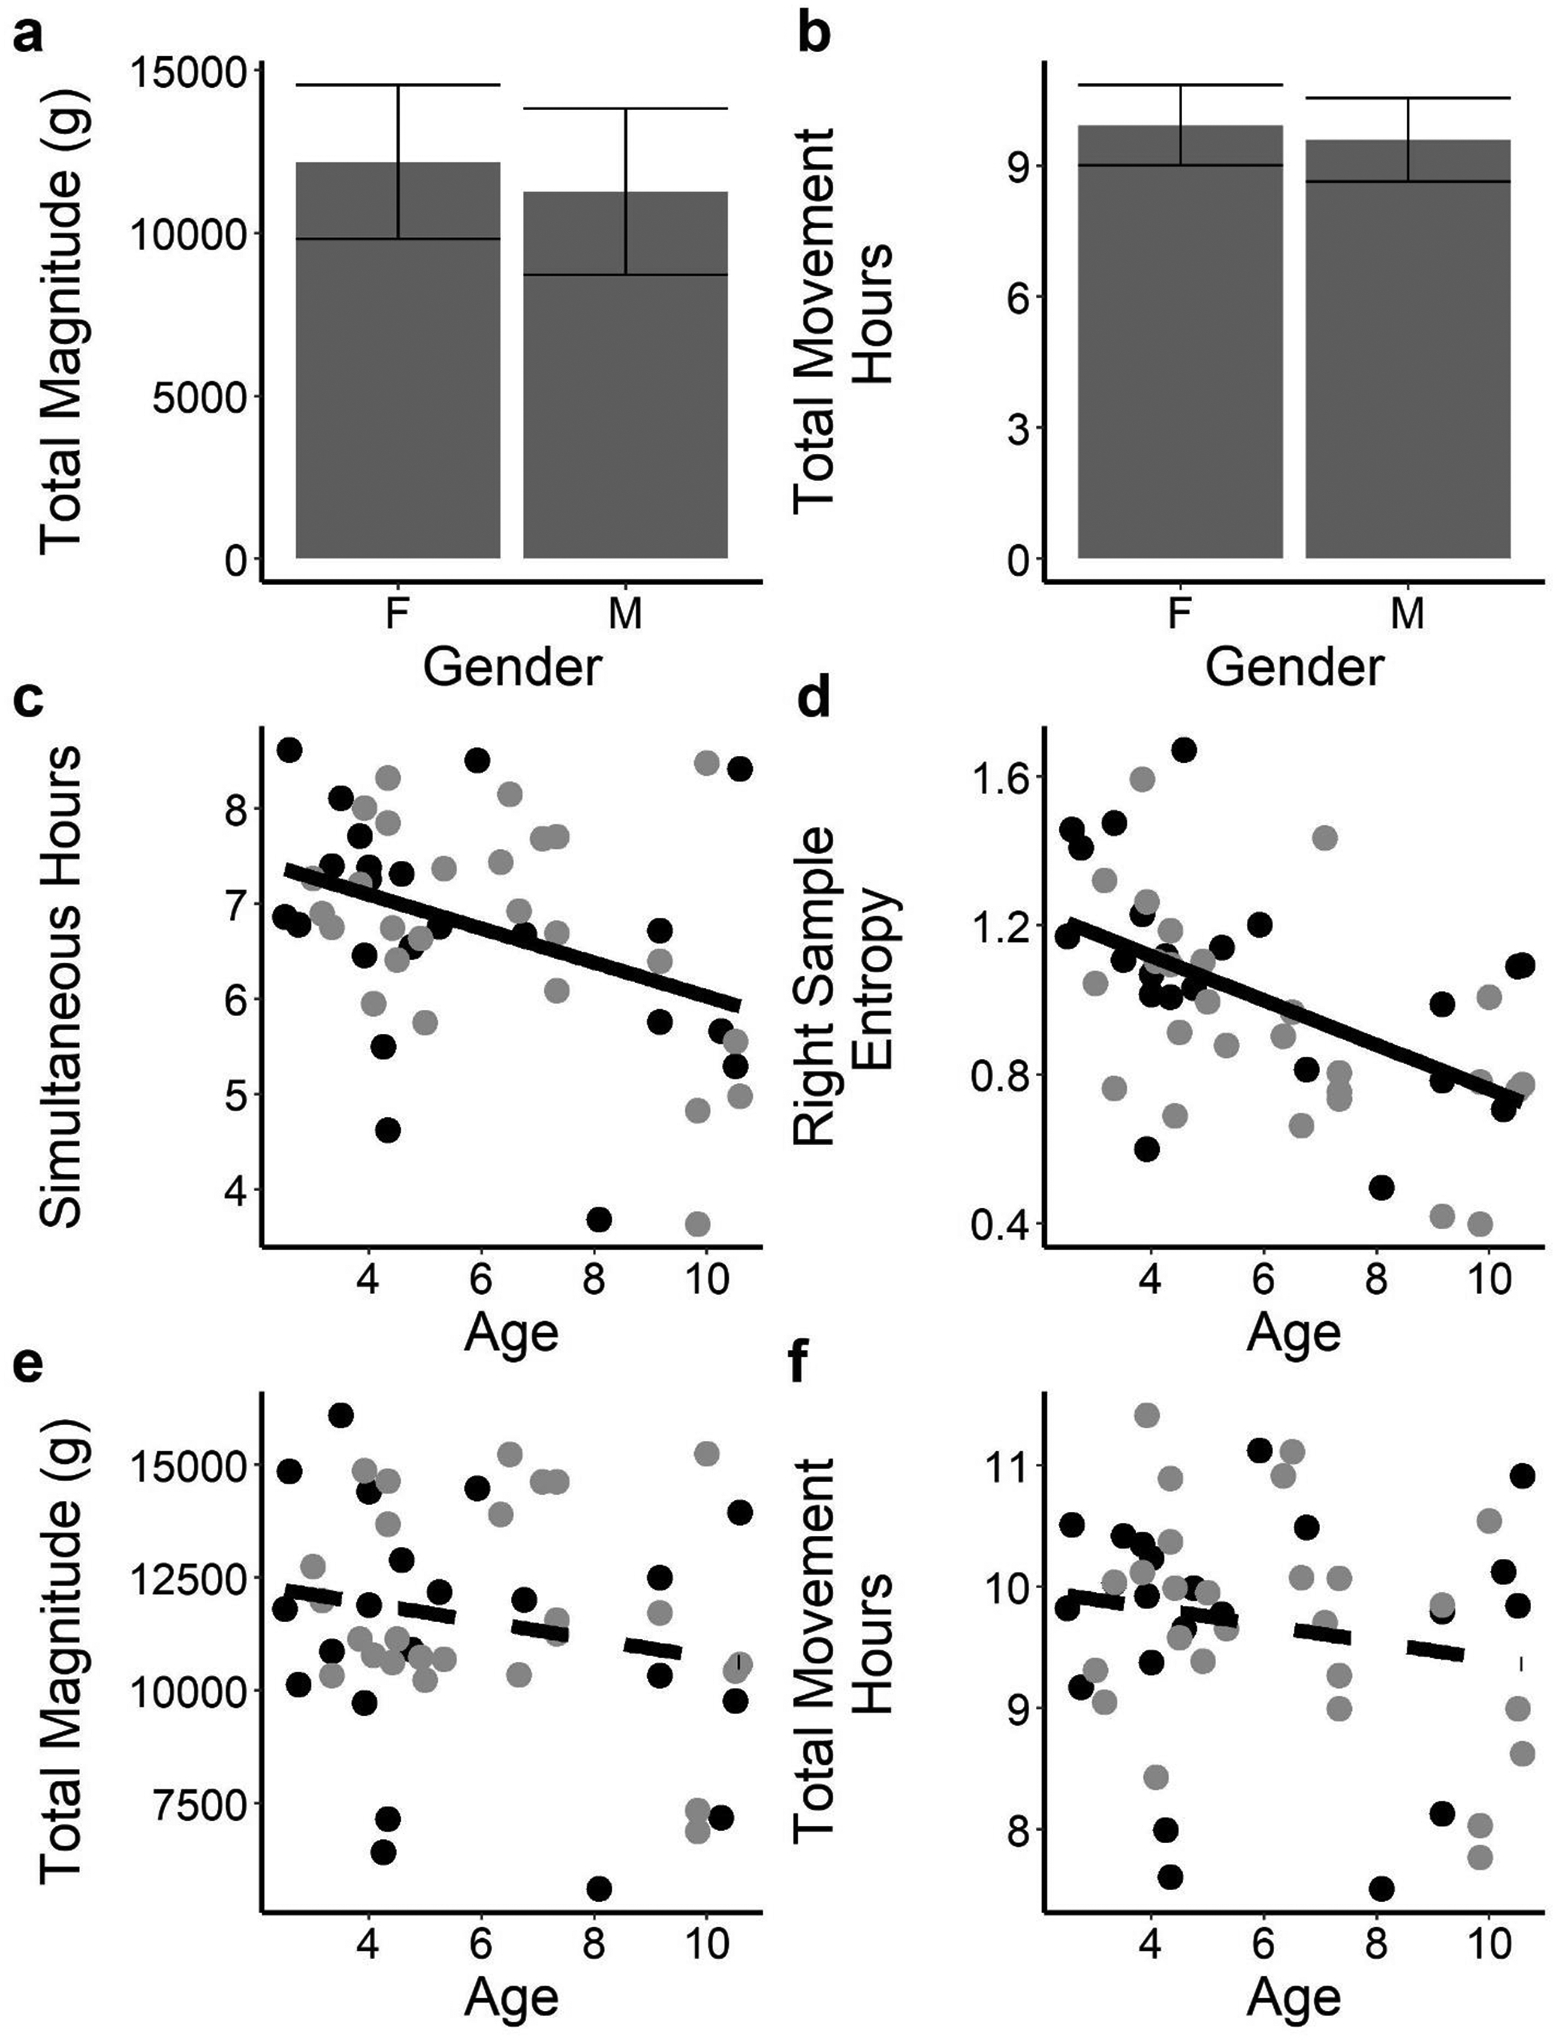
Relationships Between Sensor Variables and Participant’s Sex or Age
Note: (a) and (b). Total magnitude and total movement hours did not differ across sexes. (c) and (d). Simultaneous hours and right entropy correlate with age. (e) and (f). Neither total magnitude nor total movement hours correlate with age. On scatter plots: black = ASD group; grey = Neurotypical group. Error bars denote the SD. Solid fit lines depict statistically significant relationships, dashed lines are non-significant.
Table 3:
Relationships Between Sensor Variables and Participant Age or Parent-Completed Questionnaire Data.
| Movement Characteristic | Variable | Age | DCDQ | Conners’ - Restlessness |
|---|---|---|---|---|
| Duration | Total Movement Hours | −0.19 | 0.10 | 0.11 |
| Right Only Hours | 0.42 | 0.02 | −0.07 | |
| Left Only Hours | 0.24 | −0.06 | −0.05 | |
| Maximum Hour-Right Hours | −0.41 | 0.08 | 0.01 | |
| Maximum Hour-Left Hours | −0.34 | 0.21 | −0.07 | |
| Simultaneous Hours | −0.39 | 0.28 | 0.03 | |
| Intensity | Total Magnitude | −0.20 | 0.36 | −0.08 |
| Right Magnitude | −0.16 | 0.32 | −0.06 | |
| Left Magnitude | −0.24 | 0.37 | −0.10 | |
| Symmetry | Use Ratio | −0.27 | −0.05 | 0.07 |
| VM Correlation | 0.04 | 0.05 | 0.04 | |
| Complexity | Right Variance | 0.25 | 0.41 | −0.13 |
| Left Variance | 0.16 | 0.49 | −0.27 | |
| Entropy (Right, Left) | −0.53, −0.40 | −0.03, 0.04 | 0.02, 0.05 | |
| Variance of the frequency spectrum (Right, Left) | −0.39, −0.42 | −0.40, −0.13 | 0.26, −0.07 | |
| Mean of the frequency spectrum (Right, Left) | −0.46, −0.51 | −0.24, −0.05 | 0.14, 0.05 | |
| Average Jerk (Right, Left) | −0.34, −0.45 | −0.13, −0.09 | 0.10, −0.01 |
Note: Bold values reflect statistical significance at p ≤ 0.05. Pearson correlations were used between sensor variables and age. Partial Spearman correlations were used between sensor variables and questionnaires, with the influence of age removed. DCDQ: Developmental Coordination Disorder Questionnaire; GI: Global Index
At older ages, the duration in which participants used only one limb over the 12 hours changed such that there were a larger number of hours of right single limb use and shorter durations of movements of both limbs together for the older age group (Figure 3c). Older participants also tended to have shorter activity durations during their most active periods (negative correlations between age and maximum hour-left hours and maximum hour-right hours). All but two of the complexity variables were negatively related to age. As participant age increased, upper limb movements became less random (entropy decreased, Figure 3d) and smoother (left and right jerk decreased). Older participants also tended to have less complex movements, as represented by a lower mean and more narrow variance of the component frequencies (variance and mean of the frequency spectrum of the acceleration time series decreased).
Relationships Between Sensor Variables and Parent-Reported Motor Behaviors
Controlling for age, we found weak to moderate correlations between the sensor variables and indices of hyperactivity and motor coordination (Table 3, with example relationships plotted in Figure 4). Motor coordination on the DCDQ correlated with two movement intensity variables and four complexity variables. Greater coordination was associated with greater movement intensity (larger total magnitude and left magnitude) and greater variability in the intensity of upper limb movements (greater left variance and right variance). Greater coordination also tended to be associated with lower and narrower bands of component frequencies (lower variance and mean of the frequency spectrum of the acceleration time series). Only one sensor variable, a complexity variable, was weakly related to the Conners score after controlling for age in that higher Conners hyperactivity scores were related to less variability in movement intensity (smaller left variance). Contrary to our hypothesis, no duration or magnitude variables were related to the Conners score.
Figure 4.
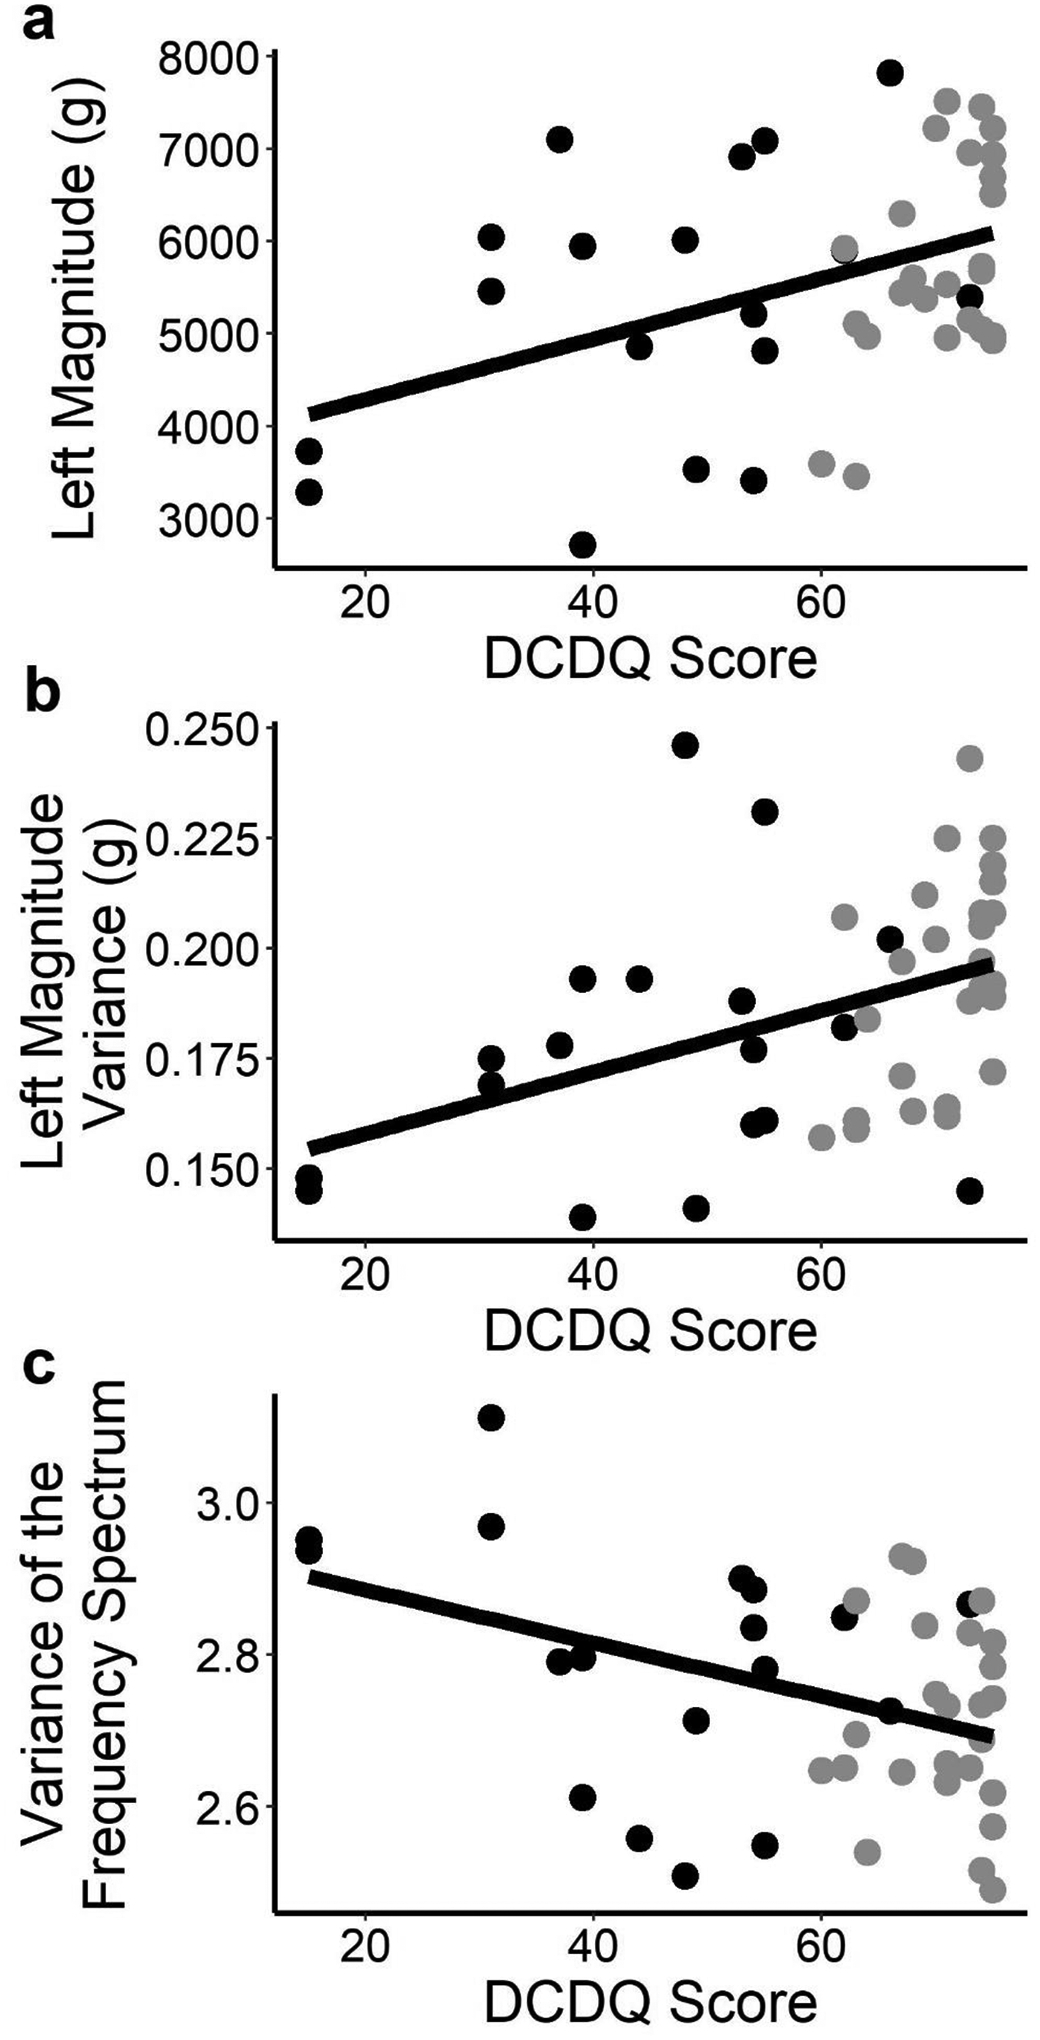
Relationships Between Sensor Variables and Questionnaires.
Note: (a) Left magnitude and DCDQ correlate. (b) Left variance and DCDQ correlate. (c) Variance of the frequency spectrum (right side shown) and DCDQ correlate. Black = ASD group; grey = Neurotypical group. Solid line is a linear fit.
Group Differences
Children with typical development and those with ASD differed on three movement complexity variables (Table 4). Typically developing children had greater variability in the magnitude of their left upper limb movements (greater left variance), while children with ASD used a greater range of frequencies (greater right variance of the frequency spectrum) and had less smooth right upper limb movements (greater right jerk).
Table 4.
Movement Variables of Interest: Participant Group Means (and Standard Deviations), Differences, and Effect Sizes
| Movement Characteristic | Variable | ASD | Neurotypical | p-value | Cohen’s d |
|---|---|---|---|---|---|
| Duration (Hrs) | Total Movement Hours | 9.67 (1.0) | 9.70 (0.9) | 0.93 | 0.03 |
| Right Only Hours | 1.48 (0.51) | 1.51 (0.33) | 0.83 | 0.06 | |
| Left Only Hours | 1.18 (0.30) | 1.24 (0.31) | 0.46 | 0.22 | |
| Maximum Hour-Right Hours | 0.91 (0.06) | 0.90 (0.06) | 0.47 | 0.21 | |
| Maximum Hour-Left Hours | 0.89 (0.07) | 0.89 (0.07) | 0.98 | 0.01 | |
| Simultaneous Hours | 6.73 (1.26) | 6.76 (1.16) | 0.93 | 0.03 | |
| Intensity (m/s2) | Total Magnitude | 11198.73 (2811.0) | 11823.16 (2247.12) | 0.41 | 0.25 |
| Right Magnitude | 5792.28 (1424.0) | 5995.36 (1161.62) | 0.60 | 0.16 | |
| Left Magnitude | 5406.45 (1433.34) | 5827.79 (1114.89) | 0.27 | 0.33 | |
| Symmetry | Use Ratio | 0.96 (0.06) | 0.97 (0.03) | 0.62 | 0.15 |
| VM Correlation | 0.45 (0.11) | 0.45 (0.14) | 0.92 | 0.03 | |
| Complexity | Right Variance | 0.18 (0.03) | 0.19 (0.03) | 0.19 | 0.39 |
| Left Variance | 0.17 (0.03) | 0.19 (0.02) | 0.02 | 0.70 | |
| Left: | 0.96 (0.30) | 0.87 (0.28) | 0.28 | 0.32 | |
| Left: | 2.76 (0.21) | 2.72 (0.15) | 0.57 | 0.17 | |
| Left: | 3.57 (0.42) | 3.53 (0.30) | 0.70 | 0.12 | |
| Left: | 2.25 (0.62) | 1.97 (0.64) | 0.13 | 0.45 |
Note: Bold values reflect statistical significance at p ≤ 0.05. ASD: Autism Spectrum Disorder
Discussion
This feasibility study demonstrated the practicality and value of using bilateral wrist-worn sensors during daily living to assess important movement values of participants aged 3–10 with and without ASD. The overall average wear time over two requested days of wear that were not necessarily consecutive was (11.4 hours). This was sufficiently close to our 12-hour goal to provide adequate data for extracting relevant sensor variables. Of particular importance, children with ASD did not differ from their non-ASD peers in their ability to wear the sensors for prolonged periods. There were also no significant differences in sensor variable data obtained from the two recorded days, implying that the sensor variables were stable across real-world, free-living activities and that multiple recorded days may not be needed for obtaining reliable data in future research with this methodology. The feasibility of bilateral wrist sensors, as shown here, opens new pathways to directly observing objective and quantifiable real-world motor behavior in neurodevelopmental research.
There were no significant participant sex differences in the data we obtained from all sensor variables, including movement duration and intensity variables. This finding was unexpected because past investigators using wearable sensors to measure physical activity levels in children have often reported that boys were more physically active than girls (Ishii et al., 2015; Stone et al., 2013; Vorwerg et al., 2013). This apparent discrepancy in findings from prior research may be due to methodological differences between our study and others. Our movement data were generated from upper limb activity measured at both wrists and were not solely related to gross physical activity level.
There were several moderate correlations between sensor variables and age, with older children showing higher right side only movement duration and shorter periods of simultaneous movement duration. This may indicate that, as school-age children develop, their upper limb activity may become more differentiated. Most of our complexity variables negatively correlated with age. These complexity measures capture different aspects of movement variability, an ever-present feature of human movement (Stergiou & Decker, 2011). Too little or too much variability is undesirable. Variability of movement is reduced in some conditions, such as with developmental disorders or certain orthopedic injuries (Deffeyes et al., 2009; Harbourne & Stergiou, 2009); and it may be increased in others, such as with Parkinson’s disease (Stergiou & Decker, 2011). The negative relationship between age and entropy reported here suggests that, in the 3–10-year-old age range, older children have less time series variability than younger children. In other words, as an older child’s upper limb behavior unfolds, their movement patterns are more consistent moment to moment, relative to younger children. This may be a result of the maturing motor system achieving more coordinated movement (Smits-Engelsman et al., 2006). Likewise, older children tended to vary their acceleration magnitude less often, utilize a narrower range of acceleration frequencies, and move with less jerking. Thus, their movements may be more careful, purposeful, and smoother. These findings are consistent with Yan et al. (2000), who found that 9-year-olds had smoother, less variable movements on a rapid reaching task than did 6-year-olds. Future longitudinal studies with larger samples are needed to understand how the relationships identified here apply to motor development trajectories during school-age years.
Parent-reported motor coordination was related to movement intensity and complexity after controlling for the effects of age. Better coordination was associated with higher movement intensity, consistent with previous work suggesting a positive relationship between motor skills and physical activity levels (Barnett, Lai, et al., 2016; Barnett, Salmon, et al., 2016). This relationship is likely developmentally reinforcing, since better motor coordination facilitates greater participation in physical activities and, therefore, greater movement intensity. This greater participation in physical activity contributes, in turn, to further development of actual and perceived motor skills (Stodden et al., 2012). Greater coordination can also lead to greater enjoyment of physical activity and greater self-efficacy; and this, in turn, leads to higher levels of physical activity (Adank et al., 2018; Loprinzi et al., 2015). Likewise, lower motor coordination may become an obstacle to movement intensity; it has has been termed the “proficiency barrier,” and it has occurred when a child’s poor motor coordination led to less success in physical activities, reduced motor confidence, and weaker motivation for further participation in physical activities. De Meester et al. (2018) found that, among 6 −11 year olds, only 12% of those in the lowest motor competency group met physical activity guidelines compared to 41% in a high motor competency group. Of note, children with ASD, a population reported to engage in lower physical activity than peers without ASD (Gehricke et al., 2020), exhibited lower parent-reported motor coordination in our sample, a finding that is consistent with prior literature (Purpura et al., 2020). Given this, poor coordination may be a specific barrier to physical activity in children with ASD and they may especially benefit from developmentally appropriate opportunities to engage in physical activity.
Not all complexity variables related to parent-reported coordination similarly. We hypothesized positive relationships between motor coordination and complexity measures; and, in fact, we found moderate positive correlations with the right and left variance in magnitude but weak to moderate negative correlations with the right variance and the mean values of the frequency spectrum. This may be due to the differences in our complexity variables. Variance in magnitude is a gross measure of overall variability across the time series, while the variance and mean of the frequency spectrum characterize moment-to-moment regularity in acceleration as the participant performs upper limb movement.
We were surprised that parent-reported hyperactivity, a well-established form of measurement in clinical practice, was not related to sensor measures of movement duration or intensity. Much like the non-significant sex difference between groups, our finding of no significant relationship between movement duration or intensity and parent-reported hyperactivity may be because this bilateral wrist methodology is better suited to capture upper limb activity than gross physical activity level. The absence of a correlation may indicate divergent validity, in which the different placements of sensor-based approaches are capturing different constructs, each pertaining to human movement but each distinct from the other in interpretive meaning. Another possibility is that parents are reporting qualitatively different movement than is reflected by accelerometer measures. Parents completing hyperactivity indices such as the DCDQ may be sensitive to off-task or distracted movement, while accelerometers reflect overall quantity of movement. Possibly, children with ADHD-related “hyperactivity” differ more in the type of their movement than in the amount of their movement.
While hyperactivity and poor coordination have been found to be independent in the general population (Pohl et al., 2019), their parent-completed questionnaire scores were highly correlated in this sample. A reason for this may be that our sample included many children with co-occurring coordination and hyperactivity disorders in the ASD group (Table 2). Parents of children with ASD were more likely than parents of typically developing children to report both hyperactivity and coordination problems in their children; perhaps these parents/children self-selected for participation this research.
We were also surprised that our group differences were in complexity variables only. While the variance in magnitude was lower among children with ASD, the variance of the frequency spectrum and the right jerk were greater in this group. This again suggests a difference in the motor behavior captured by the overall variance compared to the moment-to-moment complexity measures. Greater variance in the frequency spectrum and jerk was found in the ASD group and among younger participants (compared to older) would be consistent with the often observed report that children with ASD have some movement characteristics that are less mature than their peers (Liu & Breslin, 2013; Staples & Reid, 2010).
Based on our findings, complexity measures may have utility in screening for motor skill development delays. For example, our finding of moderate positive correlations between the DCDQ score and right and left variance suggest a common link between the parent’s report of motor skills and the variance in each limb’s accelerations. Specifically, children with greater motor skill may use a more variable movement repertoire with their upper limbs. Furthermore, select complexity variables may be useful in screening for the presence of autism-related motor difficulties. In our sample, left variance, right variance of the frequency spectrum, and the right average jerk were each found to be statistically different between groups and carried medium effect sizes. Such a measure of motor behavior that can distinguish between children with ASD and controls holds great clinical promise. Our finding of reduced left variance in children with ASD is consistent with the reduced movement variability associated with ASD that may be secondary to mechanisms underlying stereotypies or rigid repetitive behaviors, including reduced neural connectivity (Hadders-Algra, 2008) and disrupted sensorimotor integration (Shafer et al., 2017). Wearable sensors may be useful in quantifying that reduction in variability as related to ASD risk or profiles of symptom severity.
Limitations and Directions for Further Research
The group differences reported here should be considered preliminary, since these data were collected while the children were engaged in non-standardized, free-living daily activities. Further work is needed to examine any differences that may be evident in both structured and unstructured contexts. Other limitations affecting data interpretation are that our study was cross-sectional and our sample size was small and restricted, thus limiting interpretative generalizability until there have been replications of these findings. Our sample was primarily white, and females were over-represented in the typically developing group in comparison to the group with ASD (though we found no sex differences on movement sensory variables). While ASD is known to be more prevalent among males (Maenner et al., 2020), future investigators should try to recruit for a more representative distribution of participants by race, income, and sex in both groups. Additionally, while recording movement naturalistically was both a purpose and a methodological strength of this study, recording across long periods of uncontrolled activities may have washed out data gathered during particular periods of interest. We attempted to adjust for this by extracting shorter periods according to the level of activity (minimum hour, median hour, and maximum hour), but that may not have been sufficient. Future studies might study sensor variables across shorter time periods in both structured and unstructured settings to compare them. Also, we did not collect details related to medication use that may have impacted motor behavior and, future investigators should redress this omission. Finally, as noted above, there may be important differences in accelerometry data based on upper limb versus lower limb activity; future investigators should compare these across different populations of children with and without neurodevelopmental disorders. Also due to our sample size, we were not able to perform within-group correlations. Future studies with larger sample sizes that encompass a broad range of ASD severity might better determine the utility of using these sensor variables to quantify severity of ASD.
Conclusion
In this feasibility study, we found that the novel use of bilateral wearable sensors to capture upper limb movement for 12 hours in children aged 3–10 with and without ASD to be viable and to yield important preliminary data. Unlike prior accelerometry reports that found sex differences in gross physical activity, we found no significant sex differences in the intensity of upper limb activity in this age group. As our study focused only on upper limb activity, we suggest further research of both upper and lower limb sensor placements to better understand this failure to support prior research. Older participants showed more differentiated and smoothed upper limb movements that may relate to developmental trajectories. Movement intensity and complexity variables were related to ratings of motor coordination. While measuring movement outside the laboratory is difficult, we found wearable sensors promising for recording real-world motor behavior. Further research with this methodology is needed to support its use for the identification and management of motor traits related to ASD and other neurodevelopmental disorders.
Footnotes
Compliance with Ethical Standards:
The authors have no relevant financial or non-financial interests to disclose.
This study was approved by the Human Research Protection Office of Washington University and conformed to the Declaration of Helsinki. Parents provided informed consent and children ≥6 years old provided verbal assent.
Declaration of Conflicting Interests: The Authors declare that there are no conflicts of interest.
References:
- Adank AM, Van Kann DHH, Hoeboer JJAA, de Vries SI, Kremers SPJ, & Vos SB (2018). Investigating motor competence in association with sedentary behavior and physical activity in 7-to 11-year-old children. International Journal of Environmental Research and Public Health, 15(11). 10.3390/ijerph15112470 [DOI] [PMC free article] [PubMed] [Google Scholar]
- American Psychiatric Association. (2013). DSM-5 Diagnostic Classification. In Diagnostic and Statistical Manual of Mental Disorders. American Psychiatric Association. 10.1176/appi.books.9780890425596.x00diagnosticclassification [DOI] [Google Scholar]
- Bailey RR, Klaesner JW, & Lang CE (2014). An accelerometry-based methodology for assessment of real-world bilateral upper extremity activity. PLoS One, 9(7), e103135. 10.1371/journal.pone.0103135 [DOI] [PMC free article] [PubMed] [Google Scholar]
- Bailey RR, Klaesner JW, & Lang CE (2015). Quantifying Real-World Upper-Limb Activity in Nondisabled Adults and Adults With Chronic Stroke. Neurorehabil Neural Repair, 29(10), 969–978. 10.1177/1545968315583720 [DOI] [PMC free article] [PubMed] [Google Scholar]
- Bailey RR, & Lang CE (2013). Upper-limb activity in adults: referent values using accelerometry. J Rehabil Res Dev, 50(9), 1213–1222. 10.1682/JRRD.2012.12.0222 [DOI] [PMC free article] [PubMed] [Google Scholar]
- Barnett LM, Lai SK, Veldman SLC, Hardy LL, Cliff DP, Morgan PJ, Zask A, Lubans DR, Shultz SP, Ridgers ND, Rush E, Brown HL, & Okely AD (2016). Correlates of Gross Motor Competence in Children and Adolescents: A Systematic Review and Meta-Analysis. Sports Medicine (Auckland, N.Z.), 46(11), 1663–1688. 10.1007/S40279-016-0495-Z [DOI] [PMC free article] [PubMed] [Google Scholar]
- Barnett LM, Salmon J, & Hesketh KD (2016). More active pre-school children have better motor competence at school starting age: an observational cohort study. BMC Public Health, 16(1), 1–8. 10.1186/S12889-016-3742-1 [DOI] [PMC free article] [PubMed] [Google Scholar]
- Benson S, Bender AM, Wickenheiser H, Naylor A, Clarke M, Samuels CH, & Werthner P (2019). Differences in sleep patterns, sleepiness, and physical activity levels between young adults with autism spectrum disorder and typically developing controls. Dev Neurorehabil, 22(3), 164–173. 10.1080/17518423.2018.1501777 [DOI] [PubMed] [Google Scholar]
- Cabral MDI, Liu S, & Soares N (2020). Attention-deficit/hyperactivity disorder: diagnostic criteria, epidemiology, risk factors and evaluation in youth. Translational Pediatrics, 9(S1), S104–S113. 10.21037/tp.2019.09.08 [DOI] [PMC free article] [PubMed] [Google Scholar]
- Cairney J, Missiuna C, Veldhuizen S, & Wilson B (2008). Evaluation of the psychometric properties of the developmental coordination disorder questionnaire for parents (DCD-Q): Results from a community based study of school-aged children. Human Movement Science, 27(6), 932–940. 10.1016/j.humov.2008.04.002 [DOI] [PubMed] [Google Scholar]
- Chukoskie L, Townsend J, & Westerfield M (2013). Motor skill in autism spectrum disorders: A subcortical view. International Review of Neurobiology, 113, 207–249. 10.1016/B978-0-12-418700-9.00007-1 [DOI] [PubMed] [Google Scholar]
- Conners CK (2009). Conners Early Childhood. Multi-Health Systems. [Google Scholar]
- Constantino JN, Davis SA, Todd RD, Schindler MK, Gross MM, Brophy SL, Metzger LM, Shoushtari CS, Splinter R, & Reich W (2003). Validation of a brief quantitative measure of autistic traits: Comparison of the social responsiveness scale with the Autism Diagnostic Interview-Revised. Journal of Autism and Developmental Disorders, 33(4), 427–433. 10.1023/A:1025014929212 [DOI] [PubMed] [Google Scholar]
- Constantino JN, & Gruber CP (2012). The Social Responsiveness Scale, Second Edition (SRS-2). Western Psychological Services. [Google Scholar]
- De Lucena DS, Stoller O, Rowe JB, Chan V, & Reinkensmeyer DJ (2017). Wearable sensing for rehabilitation after stroke: Bimanual jerk asymmetry encodes unique information about the variability of upper extremity recovery. IEEE International Conference on Rehabilitation Robotics, 2017, 1603–1608. 10.1109/ICORR.2017.8009477 [DOI] [PubMed] [Google Scholar]
- De Meester A, Stodden D, Goodway J, True L, Brian A, Ferkel R, & Haerens L (2018). Identifying a motor proficiency barrier for meeting physical activity guidelines in children. Journal of Science and Medicine in Sport, 21(1), 58–62. 10.1016/J.JSAMS.2017.05.007 [DOI] [PubMed] [Google Scholar]
- Deffeyes JE, Harbourne RT, Dejong SL, Kyvelidou A, Stuberg WA, & Stergiou N (2009). Use of information entropy measures of sitting postural sway to quantify developmental delay in infants. Journal of NeuroEngineering and Rehabilitation, 6(1), 34. 10.1186/1743-0003-6-34 [DOI] [PMC free article] [PubMed] [Google Scholar]
- Faraone SV, & Larsson H (2019). Genetics of attention deficit hyperactivity disorder. Molecular Psychiatry, 24(4), 562–575. 10.1038/s41380-018-0070-0 [DOI] [PMC free article] [PubMed] [Google Scholar]
- Fioriello F, Maugeri A, D’Alvia L, Pittella E, Piuzzi E, Rizzuto E, Del Prete Z, Manti F, & Sogos C (2020). A wearable heart rate measurement device for children with autism spectrum disorder. Scientific Reports 2020 10:1, 10(1), 1–7. 10.1038/s41598-020-75768-1 [DOI] [PMC free article] [PubMed] [Google Scholar]
- Fournier KA, Hass CJ, Naik SK, Lodha N, & Cauraugh JH (2010). Motor coordination in autism spectrum disorders: A synthesis and meta-analysis. Journal of Autism and Developmental Disorders, 40(10), 1227–1240. 10.1007/s10803-010-0981-3 [DOI] [PubMed] [Google Scholar]
- Gehricke JG, Chan J, Farmer JG, Fenning RM, Steinberg-Epstein R, Misra M, Parker RA, & Neumeyer AM (2020). Physical activity rates in children and adolescents with autism spectrum disorder compared to the general population. Research in Autism Spectrum Disorders, 70. 10.1016/J.RASD.2019.101490 [DOI] [PMC free article] [PubMed] [Google Scholar]
- Gibbs J, Appleton J, & Appleton R (2007). Dyspraxia or developmental coordination disorder? Unravelling the enigma. Archives of Disease in Childhood, 92(6), 534. 10.1136/ADC.2005.088054 [DOI] [PMC free article] [PubMed] [Google Scholar]
- Glazebrook CM, Elliott D, & Lyons J (2006). A kinematic analysis of how young adults with and without autism plan and control goal-directed movements. Motor Control, 10(3), 244–264. 10.1123/mcj.10.3.244 [DOI] [PubMed] [Google Scholar]
- Goldman SE, Alder ML, Burgess HJ, Corbett BA, Hundley R, Wofford D, Fawkes DB, Wang L, Laudenslager ML, & Malow BA (2017). Characterizing Sleep in Adolescents and Adults with Autism Spectrum Disorders. J Autism Dev Disord, 47(6), 1682–1695. 10.1007/s10803-017-3089-1 [DOI] [PMC free article] [PubMed] [Google Scholar]
- Green D, Charman T, Pickles A, Chandler S, Loucas T, Simonoff E, & Baird G (2009). Impairment in movement skills of children with autistic spectrum disorders. Developmental Medicine and Child Neurology, 51(4), 311–316. 10.1111/j.1469-8749.2008.03242.x [DOI] [PubMed] [Google Scholar]
- Gulde P, & Hermsdörfer J (2018). Smoothness metrics in complex movement tasks. Frontiers in Neurology, 9(SEP), 615. 10.3389/fneur.2018.00615 [DOI] [PMC free article] [PubMed] [Google Scholar]
- Hadders-Algra M (2008). Reduced variability in motor behaviour: an indicator of impaired cerebral connectivity? Early Human Development, 84(12), 787–789. 10.1016/J.EARLHUMDEV.2008.09.002 [DOI] [PubMed] [Google Scholar]
- Harbourne RT, & Stergiou N (2009). Movement variability and the use of nonlinear tools: Principles to guide physical therapist practice. In Physical Therapy (Vol. 89, Issue 3, pp. 267–282). 10.2522/ptj.20080130 [DOI] [PMC free article] [PubMed] [Google Scholar]
- Hilton CL, Zhang Y, Whilte MR, Klohr CL, & Constantino J (2012). Motor impairment in sibling pairs concordant and discordant for autism spectrum disorders. Autism, 16(4), 430–441. 10.1177/1362361311423018 [DOI] [PMC free article] [PubMed] [Google Scholar]
- Hogan N, & Sternad D (2009). Sensitivity of smoothness measures to movement duration, amplitude, and arrests. Journal of Motor Behavior, 41(6), 529–534. 10.3200/35-09-004-RC [DOI] [PMC free article] [PubMed] [Google Scholar]
- Hoyt CR, Van AN, Ortega M, Koller JM, Everett EA, Nguyen AL, Lang CE, Schlaggar BL, & Dosenbach NUF (2019). Detection of Pediatric Upper Extremity Motor Activity and Deficits With Accelerometry. JAMA Netw Open, 2(4), e192970. 10.1001/jamanetworkopen.2019.2970 [DOI] [PMC free article] [PubMed] [Google Scholar]
- Ishii K, Shibata A, Adachi M, Nonoue K, & Oka K (2015). Gender and grade differences in objectively measured physical activity and sedentary behavior patterns among Japanese children and adolescents: A cross-sectional study. In BMC Public Health (Vol. 15, Issue 1, pp. 1–9). BioMed Central. 10.1186/s12889-015-2607-3 [DOI] [PMC free article] [PubMed] [Google Scholar]
- Kadesjö B, & Gillberg C (1998). Attention deficits and clumsiness in Swedish 7-year-old children. Developmental Medicine and Child Neurology, 40(12), 796–804. 10.1111/j.1469-8749.1998.tb12356.x [DOI] [PubMed] [Google Scholar]
- Ketcheson LR, Pitchford EA, & Wentz CF (2021). The Relationship Between Developmental Coordination Disorder and Concurrent Deficits in Social Communication and Repetitive Behaviors Among Children with Autism Spectrum Disorder. Autism Research, 14(4), 804–816. 10.1002/aur.2469 [DOI] [PubMed] [Google Scholar]
- Kind AJH, & Buckingham WR (2018). Making Neighborhood-Disadvantage Metrics Accessible — The Neighborhood Atlas. New England Journal of Medicine, 378(26). 10.1056/NEJMp1802313 [DOI] [PMC free article] [PubMed] [Google Scholar]
- Lang CE, Barth J, Holleran CL, Konrad JD, & Bland MD (2020). Implementation of Wearable Sensing Technology for Movement: Pushing Forward into the Routine Physical Rehabilitation Care Field. Sensors, 20(20), 5744. 10.3390/s20205744 [DOI] [PMC free article] [PubMed] [Google Scholar]
- Lang CE, Bland MD, Bailey RR, Schaefer SY, & Birkenmeier RL (2013). Assessment of upper extremity impairment, function, and activity after stroke: Foundations for clinical decision making. Journal of Hand Therapy, 26(2), 104–115. 10.1016/j.jht.2012.06.005 [DOI] [PMC free article] [PubMed] [Google Scholar]
- Lichtenstein P, Carlström E, Råstam M, Gillberg C, & Anckarsäter H (2010). The genetics of autism spectrum disorders and related neuropsychiatric disorders in childhood. American Journal of Psychiatry, 167(11), 1357–1363. 10.1176/appi.ajp.2010.10020223 [DOI] [PubMed] [Google Scholar]
- Lis S, Baer N, Stein-En-Nosse C, Gallhofer B, Sammer G, & Kirsch P (2010). Objective measurement of motor activity during cognitive performance in adults with attention-deficit/hyperactivity disorder. Acta Psychiatrica Scandinavica, 122(4), 285–294. 10.1111/j.1600-0447.2010.01549.x [DOI] [PubMed] [Google Scholar]
- Liu T, & Breslin CM (2013). Fine and gross motor performance of the MABC-2 by children with autism spectrum disorder and typically developing children. Research in Autism Spectrum Disorders, 7(10), 1244–1249. 10.1016/J.RASD.2013.07.002 [DOI] [Google Scholar]
- Loprinzi PD, Davis RE, & Fu YC (2015). Early motor skill competence as a mediator of child and adult physical activity. In Preventive Medicine Reports (Vol. 2, pp. 833–838). Prev Med Rep. 10.1016/j.pmedr.2015.09.015 [DOI] [PMC free article] [PubMed] [Google Scholar]
- MacDonald M, Lord C, & Ulrich DA (2013). The relationship of motor skills and social communicative skills in school-aged children with autism spectrum disorder. Adapted Physical Activity Quarterly, 30(3). 10.1123/apaq.30.3.271 [DOI] [PubMed] [Google Scholar]
- Maenner MJ, Shaw KA, Baio J, Washington A, Patrick M, DiRienzo M, Christensen DL, Wiggins LD, Pettygrove S, Andrews JG, Lopez M, Hudson A, Baroud T, Schwenk Y, White T, Rosenberg CR, Lee LC, Harrington RA, Huston M, … Dietz PM (2020). Prevalence of autism spectrum disorder among children aged 8 Years-Autism and developmental disabilities monitoring network, 11 Sites, United States, 2016. MMWR Surveillance Summaries, 69(4), 1–12. 10.15585/MMWR.SS6904A1 [DOI] [PMC free article] [PubMed] [Google Scholar]
- Magnus W, Nazir S, Anilkumar AC, & Shaban K (2021). Attention Deficit Hyperactivity Disorder. StatPearls. https://www.ncbi.nlm.nih.gov/books/NBK441838/ [PubMed] [Google Scholar]
- Montesinos L, Castaldo R, & Pecchia L (2018). On the use of approximate entropy and sample entropy with centre of pressure time-series. Journal of NeuroEngineering and Rehabilitation, 15(1), 116. 10.1186/s12984-018-0465-9 [DOI] [PMC free article] [PubMed] [Google Scholar]
- Morales-Hidalgo P, Hernández-Martínez C, Vera M, Voltas N, & Canals J (2017). Psychometric properties of the Conners-3 and Conners Early Childhood Indexes in a Spanish school population. International Journal of Clinical and Health Psychology, 17(1), 85–96. 10.1016/J.IJCHP.2016.07.003 [DOI] [PMC free article] [PubMed] [Google Scholar]
- Mosconi MW, & Sweeney JA (2015). Sensorimotor dysfunctions as primary features of autism spectrum disorders. In Science China Life Sciences (Vol. 58, Issue 10, pp. 1016–1023). Sci China Life Sci. 10.1007/s11427-015-4894-4 [DOI] [PMC free article] [PubMed] [Google Scholar]
- Mous SE, Jiang A, Agrawal A, & Constantino JN (2017). Attention and motor deficits index non-specific background liabilities that predict autism recurrence in siblings. Journal of Neurodevelopmental Disorders, 9(1), 32. 10.1186/s11689-017-9212-y [DOI] [PMC free article] [PubMed] [Google Scholar]
- Murray MJ (2010). Attention-deficit/hyperactivity disorder in the context of autism spectrum disorders. Current Psychiatry Reports, 12(5), 382–388. 10.1007/s11920-010-0145-3 [DOI] [PubMed] [Google Scholar]
- Pan CY, & Frey GC (2006). Physical activity patterns in youth with autism spectrum disorders. J Autism Dev Disord, 36(5), 597–606. 10.1007/s10803-006-0101-6 [DOI] [PubMed] [Google Scholar]
- Pan CY, Tsai CL, & Hsieh KW (2011). Physical activity correlates for children with autism spectrum disorders in middle school physical education. Res Q Exerc Sport, 82(3), 491–498. 10.1080/02701367.2011.10599782 [DOI] [PubMed] [Google Scholar]
- Peake JM, Kerr G, & Sullivan JP (2018). A critical review of consumer wearables, mobile applications, and equipment for providing biofeedback, monitoring stress, and sleep in physically active populations. Frontiers in Physiology, 9, 743. 10.3389/fphys.2018.00743 [DOI] [PMC free article] [PubMed] [Google Scholar]
- Pine E, Luby J, Abbacchi A, & Constantino JN (2006). Quantitative assessment of autistic symptomatology in preschoolers. Autism, 10(4), 344–352. 10.1177/1362361306064434 [DOI] [PubMed] [Google Scholar]
- Pohl A, Jones WR, Marrus N, Zhang Y, Klin A, & Constantino JN (2019). Behavioral predictors of autism recurrence are genetically independent and influence social reciprocity: evidence that polygenic ASD risk is mediated by separable elements of developmental liability. Translational Psychiatry, 9(1), 202. 10.1038/s41398-019-0545-z [DOI] [PMC free article] [PubMed] [Google Scholar]
- Purpura G, Fulceri F, Puglisi V, Masoni P, & Contaldo A (2020). Motor coordination impairment in children with autism spectrum disorder: a pilot study using Movement Assessment Battery for Children-2 Checklist. Minerva Pediatrica, 72(1), 22–29. 10.23736/S0026-4946.16.04633-8 [DOI] [PubMed] [Google Scholar]
- R Core Team. (2020). R: A Language and Environment for Statistical Computing. https://www.r-project.org/
- Reetzke R, Iosif AM, Hatch B, de la Paz L, Chuang A, Ozonoff S, & Miller M (2021). Patterns of objectively measured motor activity among infants developing ASD and concerns for ADHD. Journal of Child Psychology and Psychiatry and Allied Disciplines. 10.1111/jcpp.13504 [DOI] [PMC free article] [PubMed] [Google Scholar]
- Rice KR, Joschtel B, & Trost SG (2013). Validity of family child care providers’ proxy reports on children’s physical activity. Childhood Obesity, 9(5), 393–398. 10.1089/chi.2013.0035 [DOI] [PMC free article] [PubMed] [Google Scholar]
- Richman JS, & Moorman JR (2000). Physiological time-series analysis using approximate and sample entropy. American Journal of Physiology - Heart and Circulatory Physiology, 278(6 47–6). 10.1152/ajpheart.2000.278.6.h2039 [DOI] [PubMed] [Google Scholar]
- Rihtman T, Wilson BN, & Parush S (2011). Development of the Little Developmental Coordination Disorder Questionnaire for preschoolers and preliminary evidence of its psychometric properties in Israel. Research in Developmental Disabilities, 32(4), 1378–1387. 10.1016/j.ridd.2010.12.040 [DOI] [PubMed] [Google Scholar]
- Romano E, Tremblay RE, Farhat A, & Côté S (2006). Development and prediction of hyperactive symptoms from 2 to 7 years in a population-based sample. Pediatrics, 117(6), 2101–2110. 10.1542/peds.2005-0651 [DOI] [PubMed] [Google Scholar]
- Shafer RL, Newell KM, Lewis MH, & Bodfish JW (2017). A Cohesive Framework for Motor Stereotypy in Typical and Atypical Development: The Role of Sensorimotor Integration. Frontiers in Integrative Neuroscience, 11. 10.3389/FNINT.2017.00019 [DOI] [PMC free article] [PubMed] [Google Scholar]
- Smith BA, & Lang CE (2019). Sensor Measures of Symmetry Quantify Upper Limb Movement in the Natural Environment Across the Lifespan. Arch Phys Med Rehabil, 100(6), 1176–1183. 10.1016/j.apmr.2019.01.004 [DOI] [PMC free article] [PubMed] [Google Scholar]
- Smits-Engelsman BCM, Sugden D, & Duysens J (2006). Developmental trends in speed accuracy trade-off in 6–10-year-old children performing rapid reciprocal and discrete aiming movements. Human Movement Science, 25(1), 37–49. 10.1016/j.humov.2005.12.002 [DOI] [PubMed] [Google Scholar]
- Sokunbi MO (2014). Sample entropy reveals high discriminative power between young and elderly adults in short fMRI data sets. Frontiers in Neuroinformatics, 8(JULY), 69. 10.3389/FNINF.2014.00069/ABSTRACT [DOI] [PMC free article] [PubMed] [Google Scholar]
- Staples KL, & Reid G (2010). Fundamental movement skills and autism spectrum disorders. Journal of Autism and Developmental Disorders, 40(2), 209–217. 10.1007/s10803-009-0854-9 [DOI] [PubMed] [Google Scholar]
- Stergiou N, & Decker LM (2011). Human movement variability, nonlinear dynamics, and pathology: is there a connection? Hum Mov Sci, 30(5), 869–888. 10.1016/j.humov.2011.06.002 [DOI] [PMC free article] [PubMed] [Google Scholar]
- Stodden DF, Langendorfer SJ, Goodway JD, Roberton MA, Rudisill ME, Garcia C, & Garcia LE (2012). A Developmental Perspective on the Role of Motor Skill Competence in Physical Activity: An Emergent Relationship. 10.1080/00336297.2008.10483582, 60(2), 290–306. 10.1080/00336297.2008.10483582 [DOI] [Google Scholar]
- Stone MR, Faulkner GE, & Buliung RN (2013). How active are children in Toronto? A comparison with accelerometry data from the Canadian health measures survey. Chronic Diseases and Injuries in Canada, 33(2), 61–68. 10.24095/HPCDP.33.2.02 [DOI] [PubMed] [Google Scholar]
- Teitelbaum P, Teitelbaum O, Nye J, Fryman J, & Maurer RG (1998). Movement analysis in infancy may be useful for early diagnosis of autism. Proceedings of the National Academy of Sciences, 95(23), 13982–13987. 10.1073/PNAS.95.23.13982 [DOI] [PMC free article] [PubMed] [Google Scholar]
- Trost SG, Pate RR, Sallis JF, Freedson PS, Taylor WC, Dowda M, & Sirard J (2002). Age and gender differences in objectively measured physical activity in youth. Medicine and Science in Sports and Exercise, 34(2), 350–355. 10.1097/00005768-200202000-00025 [DOI] [PubMed] [Google Scholar]
- Urbin MA, Bailey RR, & Lang CE (2015). Validity of body-worn sensor acceleration metrics to index upper extremity function in hemiparetic stroke. J Neurol Phys Ther, 39(2), 111–118. 10.1097/NPT.0000000000000085 [DOI] [PMC free article] [PubMed] [Google Scholar]
- Vorwerg Y, Petroff D, Kiess W, & Blüher S (2013). Physical Activity in 3–6 Year Old Children Measured by SenseWear Pro®: Direct Accelerometry in the Course of the Week and Relation to Weight Status, Media Consumption, and Socioeconomic Factors. PLoS ONE, 8(4). 10.1371/journal.pone.0060619 [DOI] [PMC free article] [PubMed] [Google Scholar]
- Wilson BN, Crawford SG, Green D, Roberts G, Aylott A, & Kaplan BJ (2009). Psychometric properties of the revised developmental coordination disorder questionnaire. Physical and Occupational Therapy in Pediatrics, 29(2), 182–202. 10.1080/01942630902784761 [DOI] [PubMed] [Google Scholar]
- Wilson BN, Creighton D, Crawford SG, Heath JA, Semple L, Tan B, & Hansen S (2015). Psychometric properties of the canadian little developmental coordination disorder questionnaire for preschool children. Physical and Occupational Therapy in Pediatrics, 35(2), 116–131. 10.3109/01942638.2014.980928 [DOI] [PubMed] [Google Scholar]
- Wilson RB, Enticott PG, & Rinehart NJ (2018). Motor development and delay: Advances in assessment of motor skills in autism spectrum disorders. Current Opinion in Neurology, 31(2), 134–139. 10.1097/WCO.0000000000000541 [DOI] [PMC free article] [PubMed] [Google Scholar]
- Wilson RB, Vangala S, Elashoff D, Safari T, & Smith BA (2021). Using wearable sensor technology to measure motion complexity in infants at high familial risk for autism spectrum disorder. Sensors (Switzerland), 21(2), 1–13. 10.3390/s21020616 [DOI] [PMC free article] [PubMed] [Google Scholar]
- Wood AC, Asherson P, Rijsdijk F, & Kuntsi J (2009). Is Overactivity a Core Feature in ADHD? Familial and Receiver Operating Characteristic Curve Analysis of Mechanically Assessed Activity Level. Journal of the American Academy of Child and Adolescent Psychiatry, 48(10), 1023–1030. 10.1097/CHI.0b013e3181b54612 [DOI] [PubMed] [Google Scholar]
- Xavier J, Guedjou H, Anzalone SM, Boucenna S, Guigon E, Chetouani M, & Cohen D (2019). Toward a motor signature in autism: Studies from human-machine interaction. Encephale, 45(2), 182–187. 10.1016/j.encep.2018.08.002 [DOI] [PubMed] [Google Scholar]