

Abstract
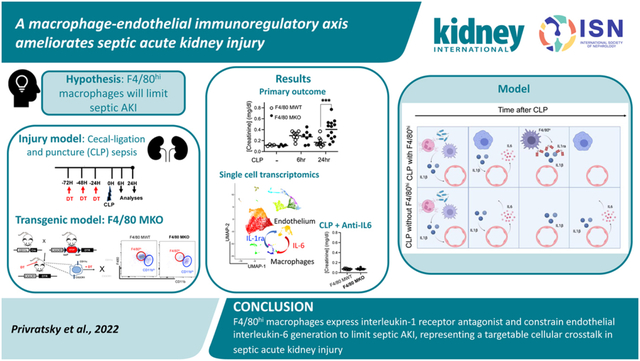
The most common cause of acute kidney injury (AKI) in critically ill patients is sepsis. Kidney macrophages consist of both F4/80hi and CD11bhi cells. The role of macrophage subpopulations in septic AKI pathogenesis remains unclear. As F4/80hi macrophages are reported to contribute to immunomodulation following injury, we hypothesized that selective depletion of F4/80hi macrophages would worsen septic AKI. F4/80hi macrophages were depleted via diphtheria toxin injection in CD11cCre(+)/CX3CR1dtr/wt (F4/80 MKO mice) compared to CD11cCre(− )/CX3CR1dtr/wt (F4/80 MWT) mice. F4/80 MWT and F4/80 MKO mice were subjected to sham or cecal ligation and puncture to induce sepsis. Compared to F4/80 MWT mice, F4/80 MKO mice displayed worsened septic AKI at 24 hours as measured by serum creatinine and histologic injury scoring. Kidneys from F4/80 MKO mice elaborated higher kidney interleukin-6 levels. Mechanistically, single cell RNA sequencing identified a macrophage-endothelial cell immunoregulatory axis that underlies interleukin-6 expression. F4/80hi macrophages expressed interleukin-1 receptor antagonist and limited interleukin-6 expression in endothelial cells. In turn, anti-interleukin-6 therapy ameliorated septic AKI in F4/80 MKO mice. Thus, F4/80hi macrophages express interleukin-1 receptor antagonist and constrain interleukin-6 generation from endothelial cells to limit septic AKI, representing a targetable cellular crosstalk in septic AKI. These findings are particularly relevant owing to the efficacy of anti-interleukin-6 therapies during COVID-19 infection, a disease associated with high rates of AKI and endothelial dysfunction.
Keywords: Acute kidney injury, sepsis, macrophages, endothelium, cytokines
Graphical Abstract
Introduction
Acute kidney injury (AKI) is one of the most pervasive forms of organ injury occurring in up to 5% of all hospitalized patients1 and 50% of critically ill patients.2, 3 In critical illness, sepsis is the most common cause of AKI.3 When AKI is a component of multi-organ dysfunction syndrome as a complication of sepsis, mortality climbs to greater than 50%.4, 5 Despite its significant morbidity, the pathophysiology of septic AKI is still poorly understood. One promising therapeutic modality could be immune modulation as studies in humans have identified deranged inflammation as one pathogenic mechanism of septic AKI.4
Among immune cells, kidney macrophages have received considerable recent scrutiny. In the murine kidney, macrophages are marked by CD64 expression and consist of two main subpopulations, F4/80hi macrophages and CD11bhi macrophages.6–9 Macrophages can have protective or detrimental effects on kidney injury depending on the disease model;7, 10–12 their location within the kidney;6, 9, 13–15 and the time after injury.16, 17 During septic AKI, macrophages have been shown to be protective;12, 18 however, it is unclear whether F4/80hi or CD11bhi macrophage populations mediate these protective effects. Depleting all CD64+ macrophages worsened BUN elevations and histologic injury following toxic AKI.19 To further delineate the roles of macrophage subpopulations in specific kidney diseases such as sepsis, additional genetic models that selectively target macrophage populations can be useful.
Interleukin 6 (IL-6) is a major pro-inflammatory cytokine that is released at sites of injury and at high levels following sepsis.20 During sepsis, IL-6 levels are higher in patients who have both severe sepsis and AKI,21, 22 implicating IL-6 as a possible pathogenic mediator of septic AKI. Moreover, therapies targeting IL-6 signaling have garnered significant interest due to their efficacy in COVID-19, a condition associated with high rates of AKI.23–26 However, the specific pathophysiologic effects of IL-6 signaling, and its inhibition, during septic AKI require elucidation.
One possible protective effect of macrophages could be to limit the hyperinflammatory immune response as some macrophage populations elaborate anti-inflammatory mediators.27 Based on the reported protective effect of F4/80hi macrophages in non-cystic kidney injury models,7, 19 we hypothesized that F4/80hi macrophages would be required to limit septic AKI. To address this hypothesis, we employ a genetic mouse model to specifically deplete F4/80hi macrophages. We find that F4/80hi macrophages limit septic AKI at least in part by curbing IL-6 expression in kidney endothelial cells.
Methods
Detailed methods can be found in the Supplementary Materials and Methods.
Generation of F4/80 MKO mice:
CD11cCre+ mice28 (Jackson Laboratories #008068, C57BL/6J congenic background) were bred with CX3CR1-STOP-diphtheria toxin receptor (DTR) mice (Strain #025629, C57BL/6NJ congenic background).29
Cecal ligation and puncture (CLP):
CLP was based on established protocol.30, 31 A 1.5cm segment from end of cecum was ligated and then punctured through and through with a 21g needle.
Kidney Biomarker Analyses:
Serum creatinine levels were measured by LC-mass spectrometry by the University of Alabama at Birmingham O’Brien Center for Acute Kidney Injury Research Bioanalytical Core. Serum BUN levels were measured by kit (ThermoFisher).
Flow Cytometry and Cell Sorting:
Kidneys and spleens were harvested and digested to single cell suspensions as previously described.32, 33
Single cell RNA sequencing:
Please see Supplementary Methods.
Statistics:
Statistical tests were performed with GraphPad Prism Software® (GraphPad Software, La Jolla, CA). P<0.05 was considered statistically significant.
Results
Kidney F4/80hi macrophages downregulate major histocompatibility complex II (MHCII) following sepsis.
We first wanted to examine the effect of sepsis on myeloid populations within the kidney. To this end, we employed a clinically relevant septic AKI model, cecal ligation and puncture with antibiotic treatment.30, 31, 34 MHCII+ myeloid cells can be parsed into four different populations based on cell surface marker expression.6, 19 To determine the overall changes in kidney leukocyte populations elicited by CLP, we used FACS-tSNE analyses of our flow cytometry data. We clustered all major myeloid cell types including F4/80hi and CD11bhi macrophages both in Sham and CLP mice. Interestingly, F4/80hi macrophages showed a shift in cluster location by CLP, suggesting a phenotypic change in cell surface markers (Figure 1a). To further explore and confirm this phenotypic change, we used a targeted gating approach (Supplementary Figure S1) and found that F4/80hi macrophages downregulated MHCII following sepsis, as in the case of ischemic and toxic injuries6, 7 (Figure 1b–e). These data support the contention that MHCII downregulation on F4/80hi macrophages represent a shared damage response following multiple forms of kidney injury (ischemic, toxic, and now here sepsis),6, 7 and provide evidence that kidney F4/80hi macrophages display changes in cell surface phenotype following sepsis.
Figure 1 – Kidney F4/80hi macrophages downregulate MHCII following sepsis.
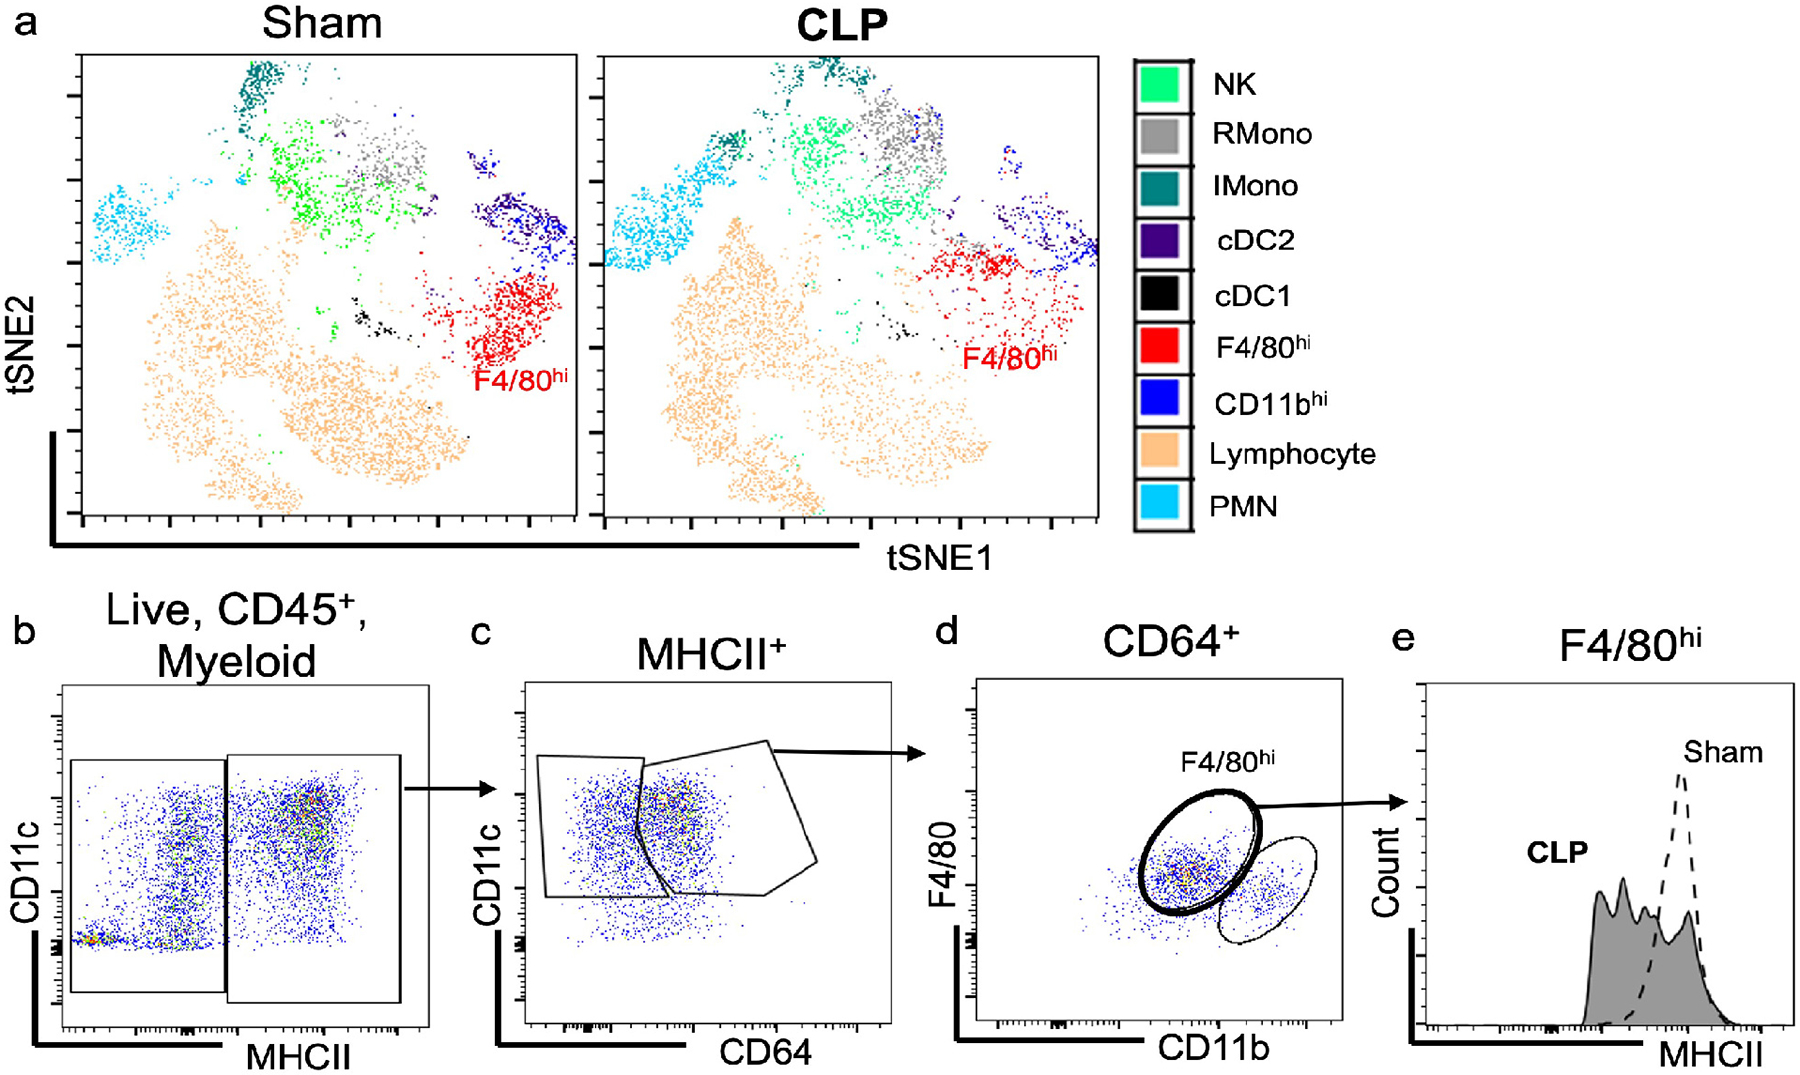
Mice were subjected to sham surgery or cecal ligation and puncture (CLP) surgery. At 24 hours after surgery, kidneys were harvested and flow cytometric analysis was performed on isolated kidneys. (a) FACS-tSNE plot of Live, CD45+ cells within the kidney. (b) Fluorescent dot plot of live, CD45+, myeloid cells (CD11b+ or CD11c+) within kidney based on CD11c and MHCII expression. (c) Fluorescent dot plot of MHCII+ cells within kidney based on CD11c and CD64 expression. (d) Fluorescent dot plot of CD64+ cells from (c) within kidney based on F4/80 and CD11b expression. (e) Histogram demonstrates reduced intensity of MHCII expression in F4/80hi macrophages after CLP.
Kidney F4/80hi macrophages display anti-inflammatory polarization after septic AKI in comparison to CD11bhi macrophages.
To determine how sepsis influenced gene expression in macrophage populations within the kidney, we subjected wildtype mice to either sham or CLP surgery and performed single cell RNA sequencing analysis on single cell digests of the whole kidney at 24 hours after surgery. A total of 18,055 cells from four mice were analyzed after strict quality control. The majority of kidney cell-types were recovered, and we were able to identify a prominent macrophage cell cluster in the kidney (Figure 2a). By differential expression analysis, we identified the top 50 upregulated genes within the macrophage cluster after CLP. Among these genes, we noticed that cells within the macrophage cluster upregulated a number of important anti-inflammatory antagonists of the IL1R / toll-like receptor (TLR) pathways (Il1rn, Il1r2, Nfkbia, and Tnfaip3) along with Socs3, an antagonist of the IL-6 signaling pathway35 after CLP (Figure 2b). To further examine this, we used gene ontology (GO) enrichment analysis of these top 50 upregulated genes and identified negative regulation of interleukin-1-mediated signaling as the top enriched pathway along with enrichment in multiple pathways associated with IL-1 and TLR (Supplementary Table 1). These data suggest that kidney macrophages upregulate anti-inflammatory genes, including regulators of IL-1R/TLR pathways, following sepsis and modulate the overall immune response.
Figure 2 – F4/80hi macrophages demonstrate anti-inflammatory polarization following CLP.
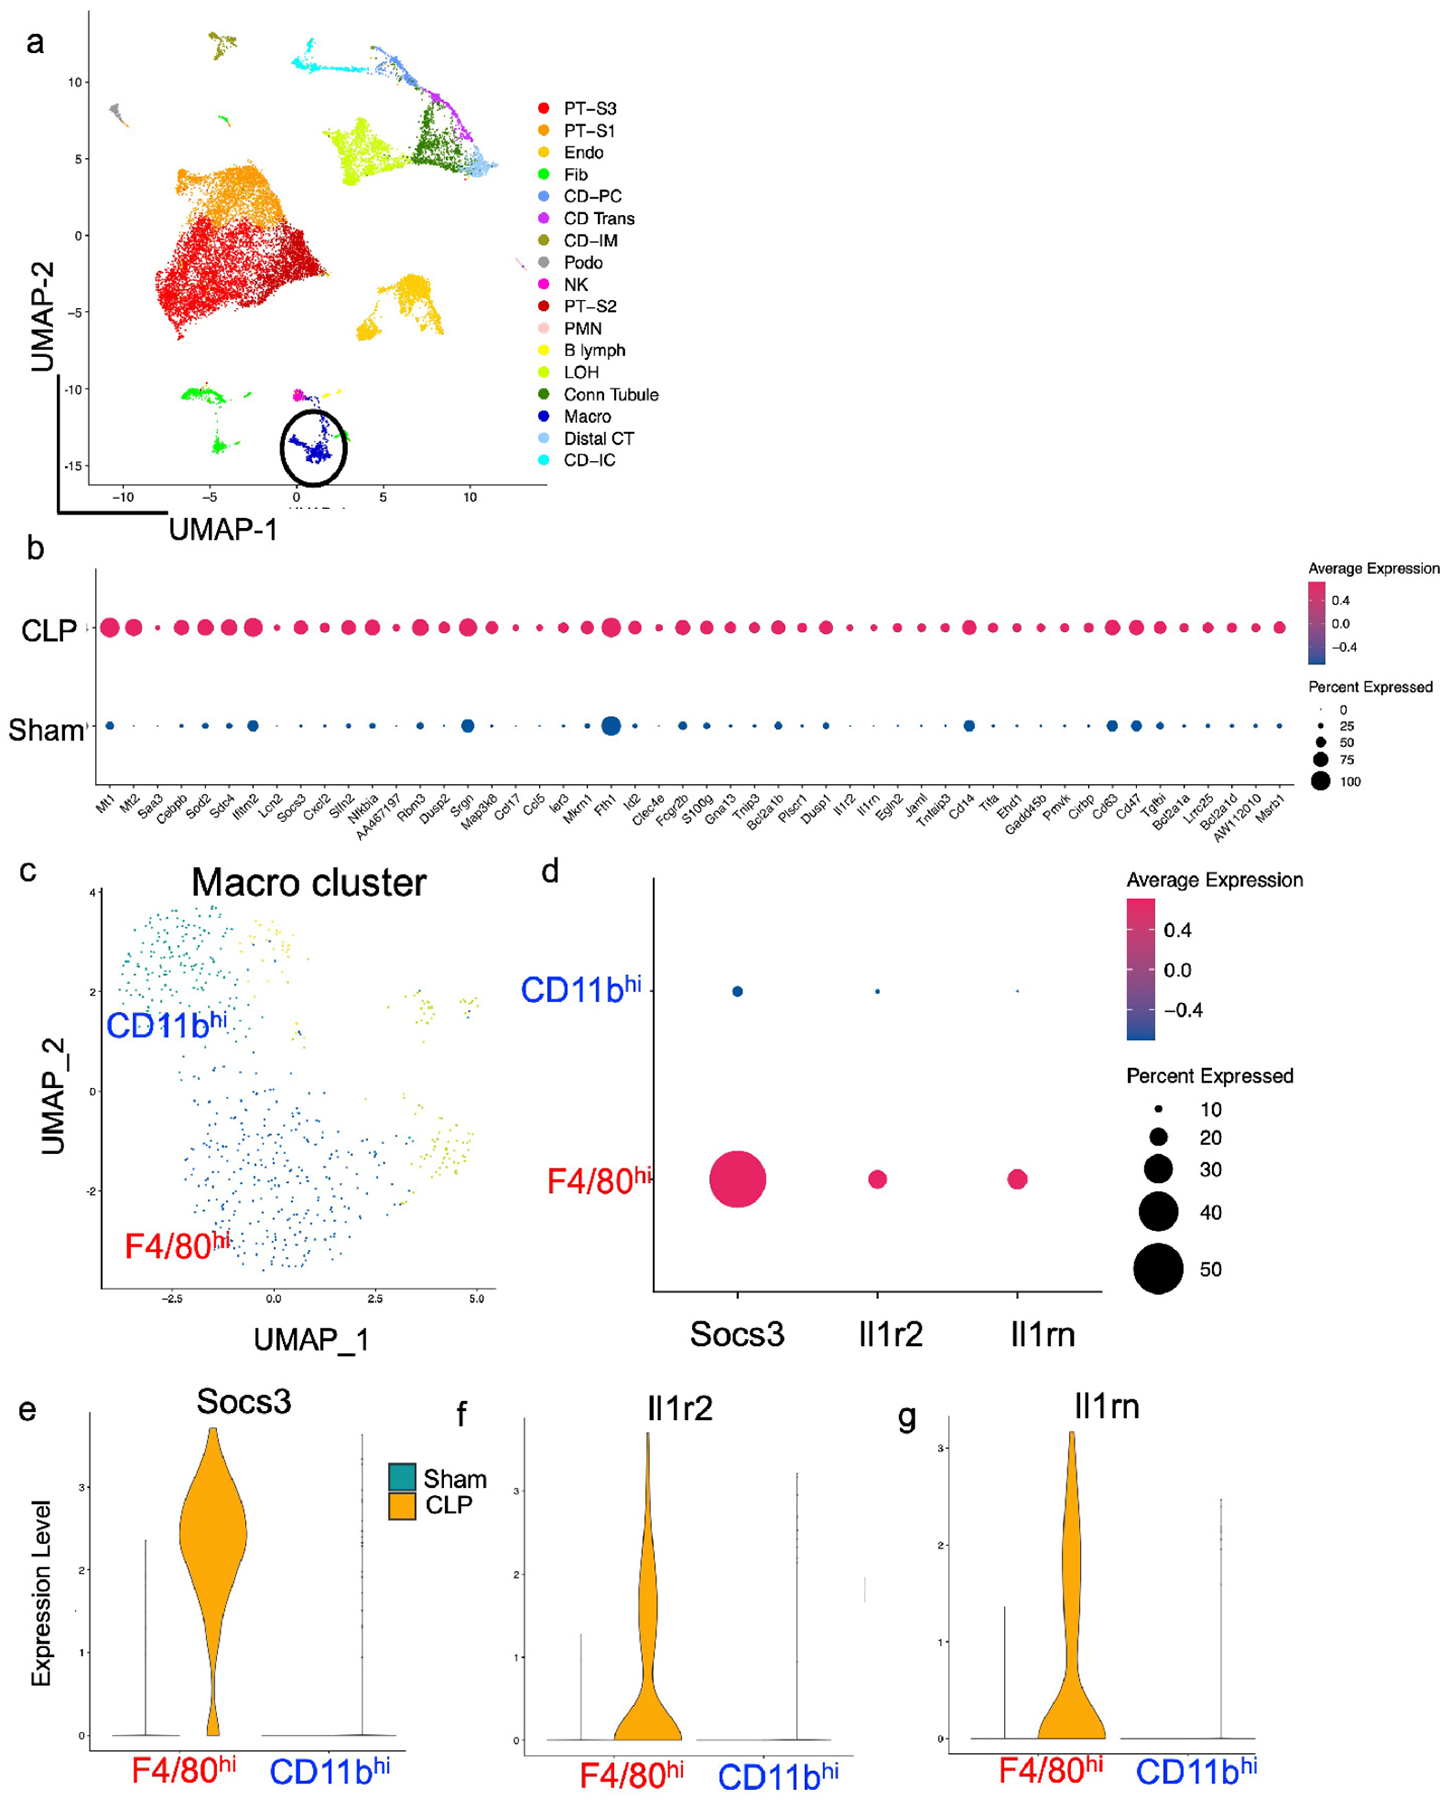
Wildtype mice were subjected to sham or CLP surgery. At 24 hrs after procedure, kidneys were harvested. Single cell RNA sequencing analysis was performed with (a) UMAP plot showing cell clusters in kidney (circle denotes macrophage cluster). (b) Top 50 upregulated genes following CLP in macrophage cluster by differential expression analysis. Note upregulation of anti-inflammatory genes including Socs3, Tnfaip3, and Il1-pathway antagonists Il1rn and Il1r2. (c) UMAP plot demonstrating 4 separate cell clusters within macrophage (Macro) cluster from (a). (d) Dot plot demonstrating higher expression of anti-inflammatory genes Socs3, Il1r2, and Il1rn in F4/80hi macrophages versus CD11bhi macrophages. (e-f) Violin plots displaying expression of (e) Socs3, (f) Il1r2, and (g) Il1rn in F4/80hi and CD11bhi macrophages based on sepsis state.
Macrophages expressing low levels of MHCII have been associated with a pro-reparative and immunomodulatory phenotype in the kidney and other tissues.6, 7, 36 Thus, given the prominent decrease in MHCII expression in F4/80hi macrophages, we hypothesized that these cells would also display a more prominent anti-inflammatory phenotype after CLP compared to CD11bhi macrophages. By scRNAseq, we separated macrophages into four separate clusters (Figure 2c, Supplementary Figure S2a,b). We then assigned the cellular identity of macrophage subclusters by expression of known macrophage and dendritic cell markers (Supplementary Figure S2c). We found that one subcluster displayed high expression of Adgre1 (F4/80), Itgax (CD11c), C1qc, and Cx3cr1 (Supplementary Figure S2c), indicating that this cluster corresponded to F4/80hi macrophages. We identified CD11bhi macrophages as the cluster that expressed C1qc, had lower expression of Adgre1, and limited expression of conventional dendritic cell markers Cd209a and Itgax (Supplementary Figure S2c). We compared expression of Socs3, Il1r2, and Il1rn between macrophage populations and found that F4/80hi macrophages displayed higher expression of these markers than did CD11bhi macrophages (Figure 2d), specifically after sepsis (Figure 2e–g). These results suggest that F4/80hi macrophages display an anti-inflammatory phenotype following CLP to a greater extent than CD11bhi macrophages at least in early sepsis.
Cortical F4/80hi macrophages limit septic AKI.
As F4/80hi macrophages express anti-inflammatory genes that could limit tissue damage following CLP, we reasoned that their depletion would result in worsened kidney inflammation and septic AKI. The CX3CL1-CX3CR1 ligand-receptor pairing plays a vital role in homing of myeloid cells to the kidney;14, 37, 38 and we show Cx3cr1 is only expressed in the Macro cluster with expression of Cx3cl1 in many intra-renal cell types (Supplementary Figure S2d). Of myeloid cells within the Macro cluster, F4/80hi macrophages express Cx3cr1 at high levels (Supplementary Figure S2c). F4/80hi macrophages also express CD11c (Supplementary Figure S2c). Thus, we crossed CD11cCre (+) mice to mice in which the diphtheria toxin receptor (DTR) is driven by the CX3CR1 promoter after a stop codon is excised by CD11cCre-mediated deletion29 (CD11cCre(+) / CX3CR1 dtr/wt – F4/80 MKO) (Figure 3a). In these mice, only cells that co-express CD11c and CX3CR1 express DTR and can be depleted by diphtheria toxin injection (Figure 3a).
Figure 3 – F4/80hi macrophages are selectively depleted from the cortex in F4/80hi macrophage knockout (F4/80 MKO) mice.
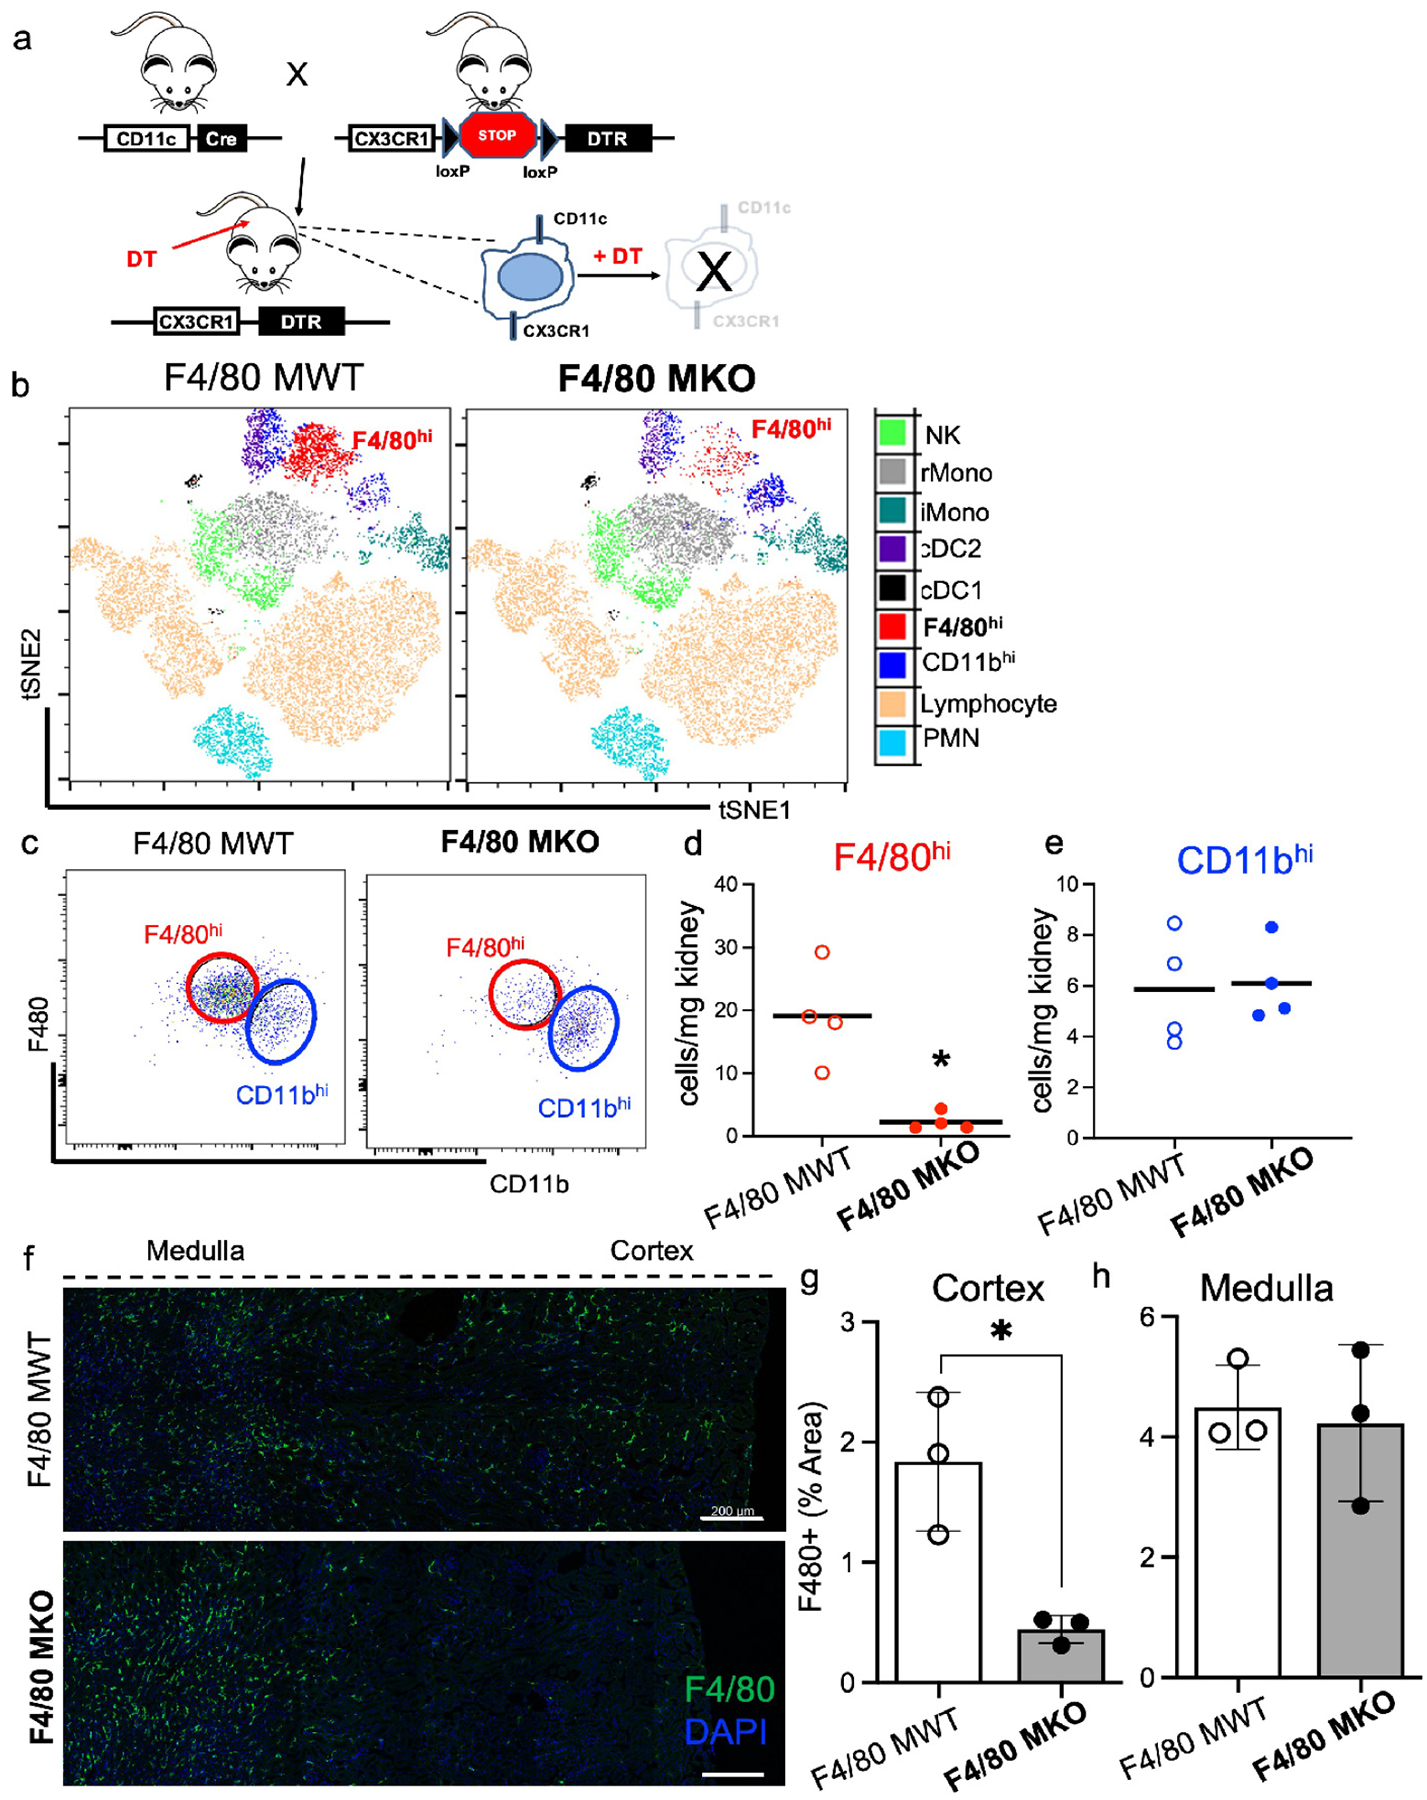
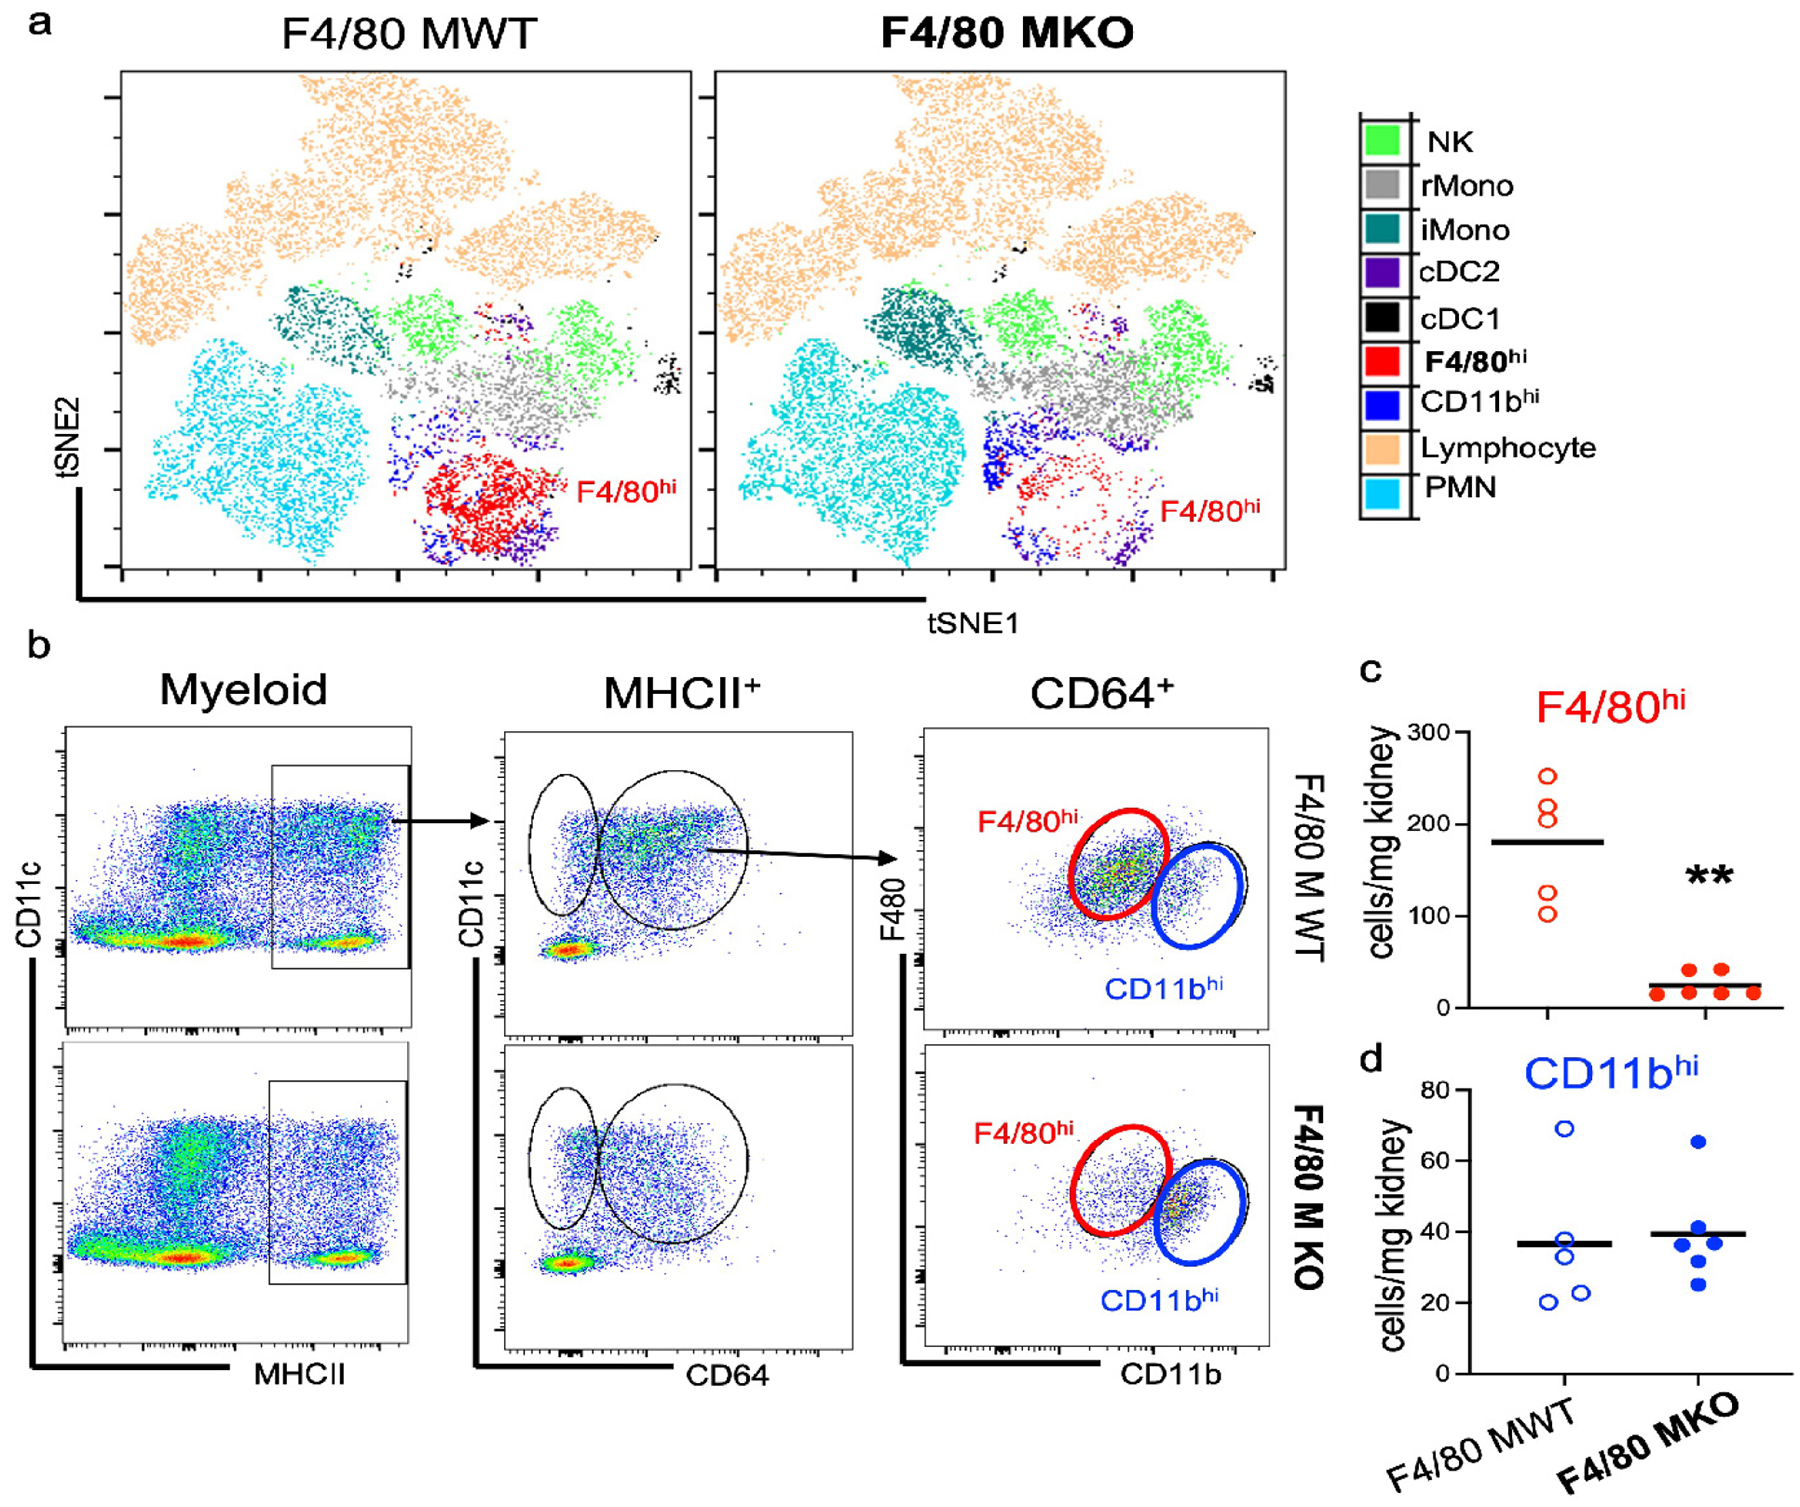
(a) Genetic strategy to deplete F4/80hi macrophages. (b-h) Mice were administered diphtheria toxin for three successive days and then flow cytometric analysis was performed one day later on kidney cell digests. (b) FACS-tSNE plot of myeloid populations within kidney demonstrating depletion of F4/80hi macrophage population in F4/80 MKO mice compared to littermate control F4/80 MWT mice. (c) Pseudocolor dot plots demonstrating gating strategy to identify F4/80hi (red) and CD11bhi (blue) macrophages in kidneys with enumeration of (d) F4/80hi and (e) CD11bhi macrophages. Graphs display line at mean, dots represent individual mice (n = 4/group) with significance determined by unpaired t test (*P<0.05). (f) Immunofluorescence staining of F4/80 (green) and DAPI (blue). Images display composite of 4 separate images taken in succession across one representative mouse kidney cross section for each genotype by confocal microscopy (scale bar – 200 μm). (g-h) Measurement of F4/80+ % area in each kidney region for (g) cortex and (h) medulla. Graph displays mean +/− SD of %F4/80+ area from 3 separate mice for each genotype (*P<0.05).
We determined the overall effect of genetic ablation using unbiased FACS-tSNE analyses of flow cytometry data and validated cell depletion using a targeted gating approach. After diphtheria toxin injection, compared to littermate F4/80 MWT (CD11cCre(−) / CX3CR1 dtr/wt) mice, F4/80 MKO mice had selective depletion of F4/80hi macrophages without effects on CD11bhi macrophages (Figure 3b–e), or significant changes in other myeloid populations within the kidney (Figure 3b; Supplementary Figure S3). We also did not detect significant differences in CD11b+ myeloid cells in the spleen implying that our genetic deletion did not induce major systemic changes in myeloid populations (Supplementary Figure S4). As kidneys have clear immune zonations,9, 13, 15 we further analyzed where in the kidney F4/80hi macrophages were depleted in F4/80 MKO mice. Via immunofluorescence confocal microscopy of frozen kidney sections, we confirmed that F4/80hi macrophages are selectively depleted from cortical regions in F4/80 MKO mice (Figure 3f–h), primarily due to higher expression of CD11c in cortical myeloid cells compared to medullary myeloid cells, which drives diphtheria toxin receptor expression (Supplementary Figure S5). Our transgenic model provided a unique opportunity to decipher a spatially distinct population of macrophages. We then subjected F4/80 MWT and F4/80 MKO mice to CLP surgery (Figure 4a). In control animals without CLP or diphtheria toxin injection, histologic injury scores (Supplementary Figure S6) and serum creatinine and BUN values are similar (Figure 4b,c), confirming there is no change at baseline in our genetically-modified mouse line. After CLP, we found that F4/80 MWT and F4/80 MKO mice had similar levels of serum creatinine and BUN at 6 hours (Figure 4b,c), indicating that induction of septic AKI is similar in both groups. However, compared to F4/80 MWT mice, F4/80 MKO mice displayed significantly higher levels of serum creatinine and BUN at 24 hours (Figure 4b,c); heightened histologic injury scores (Figure 4d–f); and increased expression of kidney injury molecule (KIM)-1 by immunofluorescence (Supplementary Figure S7). These results indicate that cortical F4/80hi macrophages curb AKI after sepsis induction.
Figure 4 – F4/80hi macrophage depletion worsens septic AKI.
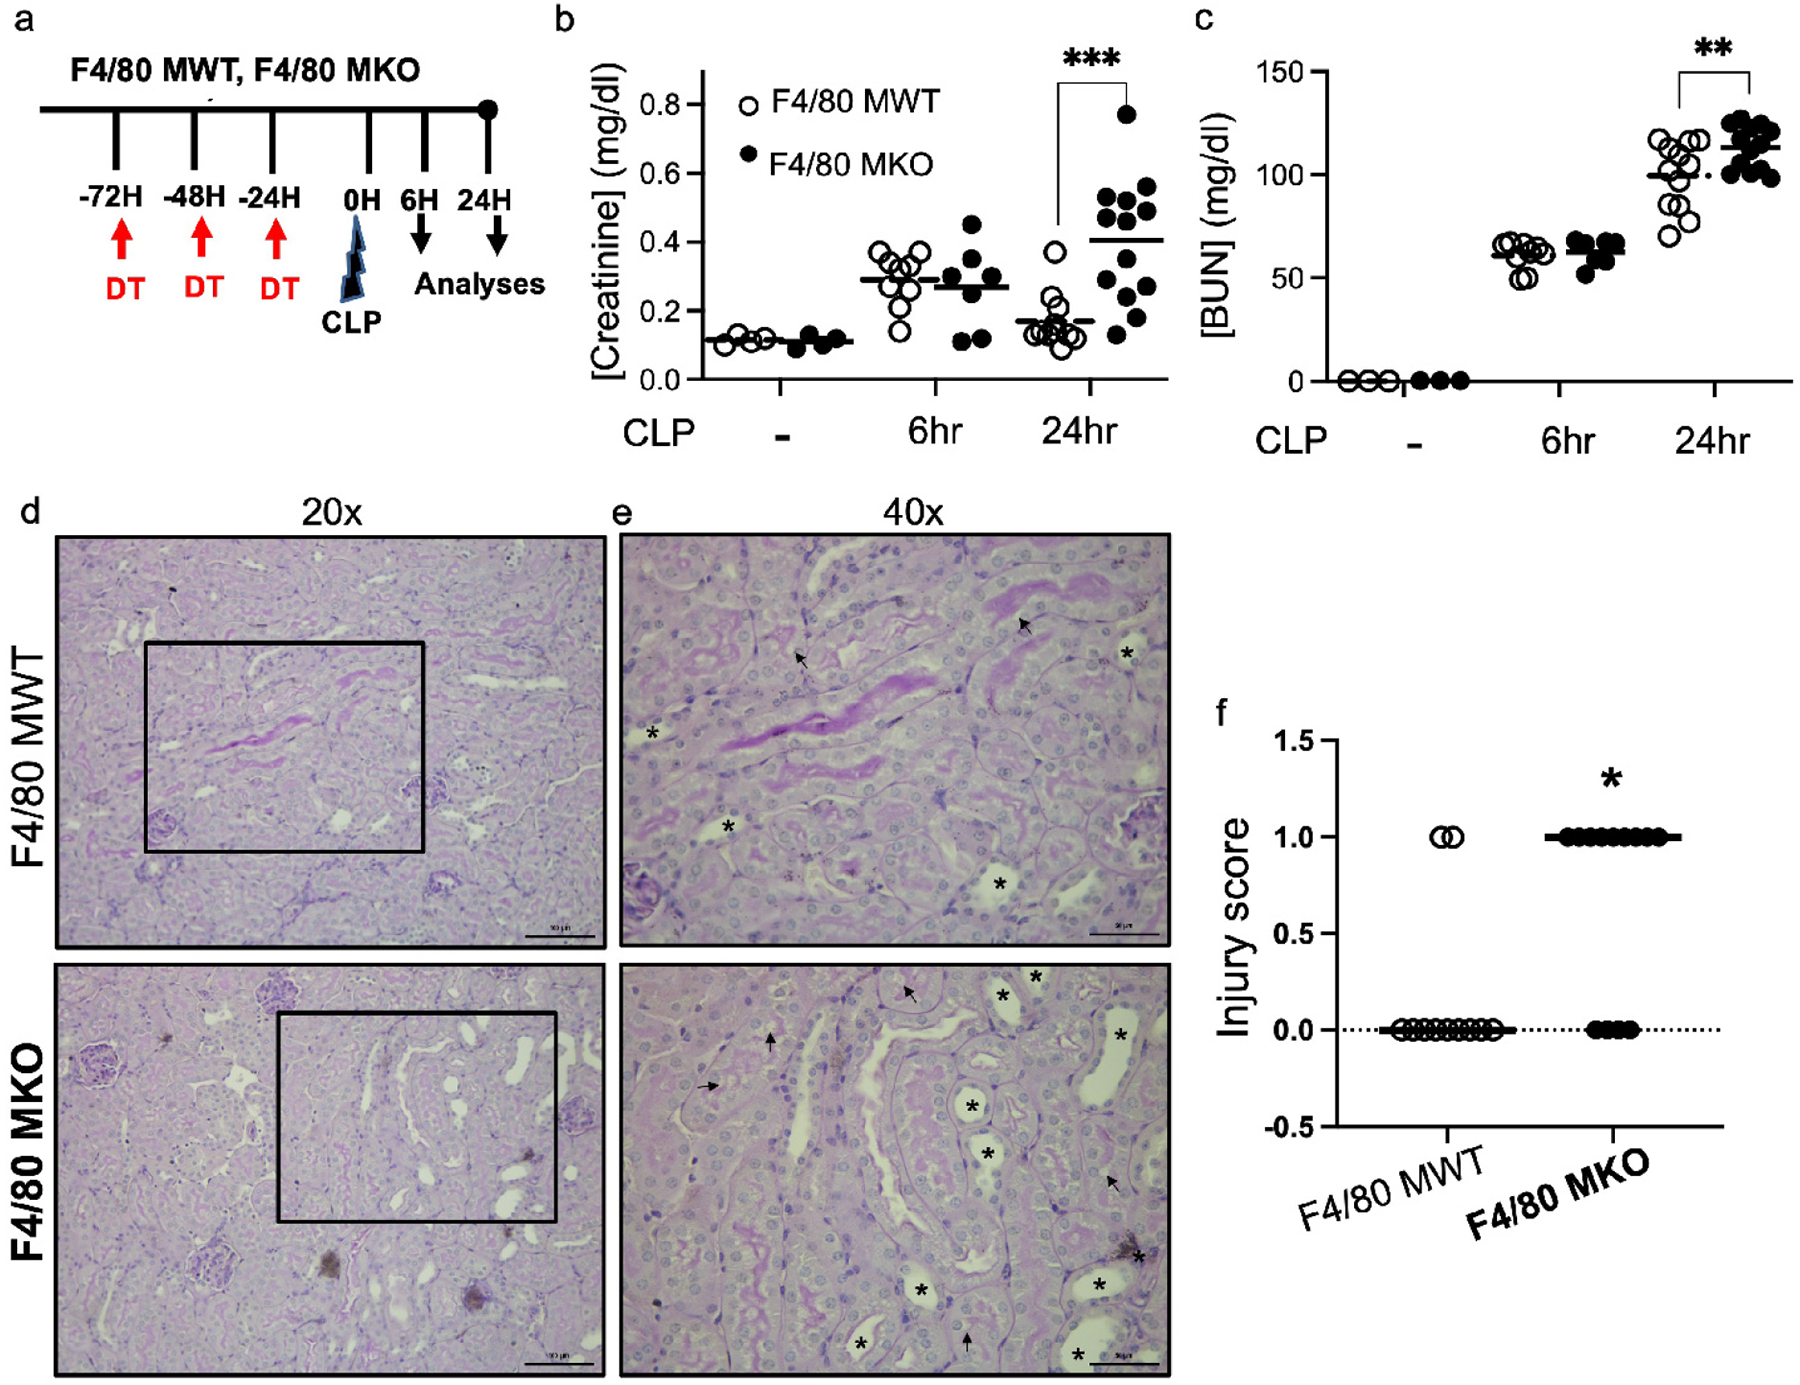
F4/80 MWT and F4/80 MKO mice were subjected to sham surgery or cecal-ligation and puncture (CLP) sepsis for 6 hours or 24 hours. (a) Experimental model. (b) Serum creatinine and (c) blood urea nitrogen (BUN) were measured at each indicated timepoint. Dots in graph show individual samples with line at mean of group. F4/80 MKO mice displayed higher levels of serum creatinine and BUN at 24 hours following procedure (n=4 for sham groups, n=7–9 mice for 6hr groups, n=11–13 for 24hr groups, **P<0.01, ***P<0.001 as determined by two-way ANOVA with post-hoc test). (d,e) Representative periodic-acid Schiff (PAS) stained kidney sections from mice subjected to 24 hours of CLP at (d) 20x (scale bar – 100 μm) with outlined box shown in (e) at 40x (scale bar - 50μm). (f) Injury scoring of kidney sections by blinded observer. Graph displays dots for individual mice (n = 11 RMac WT, n = 13 F4/80 MKO) with line at median (*P<0.05 by Mann Whitney test).
Depletion of F4/80hi macrophages does not modulate leukocyte accumulation following septic AKI.
We next reasoned that F4/80hi macrophage-mediated protection could be due to modulation of leukocyte accumulation in the septic kidney. We subjected F4/80 MWT and F4/80 MKO mice to CLP and performed flow cytometric analysis on injured kidneys. Although we did find continued selective depletion of F4/80hi macrophages after CLP (Figure 5a–c), we did not see differences in other myeloid and lymphocyte populations within the kidney, including monocytes and CD11bhi macrophages (Figure 5a,d; Supplementary Figure S8a). To test potential regional effects that might have not been detected by our whole kidney flow cytometry approach, we performed immunofluorescence microscopy for myeloperoxidase to assess neutrophil localization. We observed an accumulation of neutrophils selectively in the cortex of F4/80 MKO mice after CLP by immunofluorescence microscopy, indicating that F4/80hi macrophage depletion was having a regional effect on this cell population (Supplementary Figure S8b–d). Taken together, these data suggest that our genetic depletion strategy modulates neutrophil recruitment and immune responses in specific kidney locations.
Figure 5 – F4/80hi macrophage depletion does not significantly change leukocyte accumulation in the septic kidney.
(a) Mice were administered diphtheria toxin for three successive days and then subjected to sham or CLP surgery. At 24 hours after procedure, flow cytometric analysis was performed on kidney cell digests. (a) FACS-tSNE plot of myeloid populations within kidney demonstrating depletion of F4/80hi macrophages in F4/80 MKO mice compared to littermate control F4/80 MWT mice. (b) Pseudocolor dot plots demonstrating gating strategy to identify F4/80hi (red) and CD11bhi (blue) macrophages in kidneys with enumeration of (c) F4/80hi and (d) CD11bhi macrophages. Graphs display line at mean, dots represent individual mice (n = 5–6/group) with significance determined by unpaired t test (*P<0.05).
Kidney IL-6 production is augmented in endothelial cells following sepsis.
We posited that depletion of F4/80hi macrophages in F4/80 MKO mice could be changing the inflammatory cytokine milieu in kidneys following CLP to limit septic AKI. We first measured mRNA of pro-inflammatory mediators in whole kidney tissue by quantitative RT-PCR in wildtype mice after sham or CLP surgery. We found significant induction of mRNAs for several pro-inflammatory cytokines and chemokines following CLP, of which the highest expression was for IL-6 (Figure 6a). We also performed Ingenuity Pathway Analysis (IPA) on our scRNAseq dataset to determine overrepresented pathways. We found induction of genes associated with IL-6 signaling across all kidney cell types (Supplementary Figure S9), again implicating IL-6 as a prominent inflammatory mediator during polymicrobial septic AKI. After binding its receptor, IL-6 signals through the common gp130 receptor subunit via either membrane-bound IL-6 receptor (classic signaling) or soluble IL-6 receptor (trans signaling).39 Interestingly, scRNAseq showed many cell types express gp130 (encoded by Il6st) (Figure 6b, top row) that mediates trans-signaling of IL-6, while classical IL6 receptor (encoded by Il6ra) is highly expressed in the macrophage population (Figure 6b, middle row). We next determined which kidney cells generate IL-6 following sepsis. Through scRNAseq analysis of IL-6 expression, we found that of all cell types in the kidney, only endothelial cells and fibroblasts express IL-6 mRNA at a high level, and this expression is only evident after CLP (6b-bottom row, Figure 6c,d). To validate this finding we reviewed publicly available scRNAseq datasets in murine kidneys following endotoxic AKI40 and in kidneys of COVID-19 patients.41 We found that amongst cell populations in the kidney, IL-6 mRNA is expressed at highest levels in kidney endothelial cells (Supplementary Figure S10a,b,d), suggesting that kidney endothelial cells are the major cell type of IL6 production in sepsis in mice and humans.
Figure 6 – IL-6 is produced by endothelial cells after sepsis.
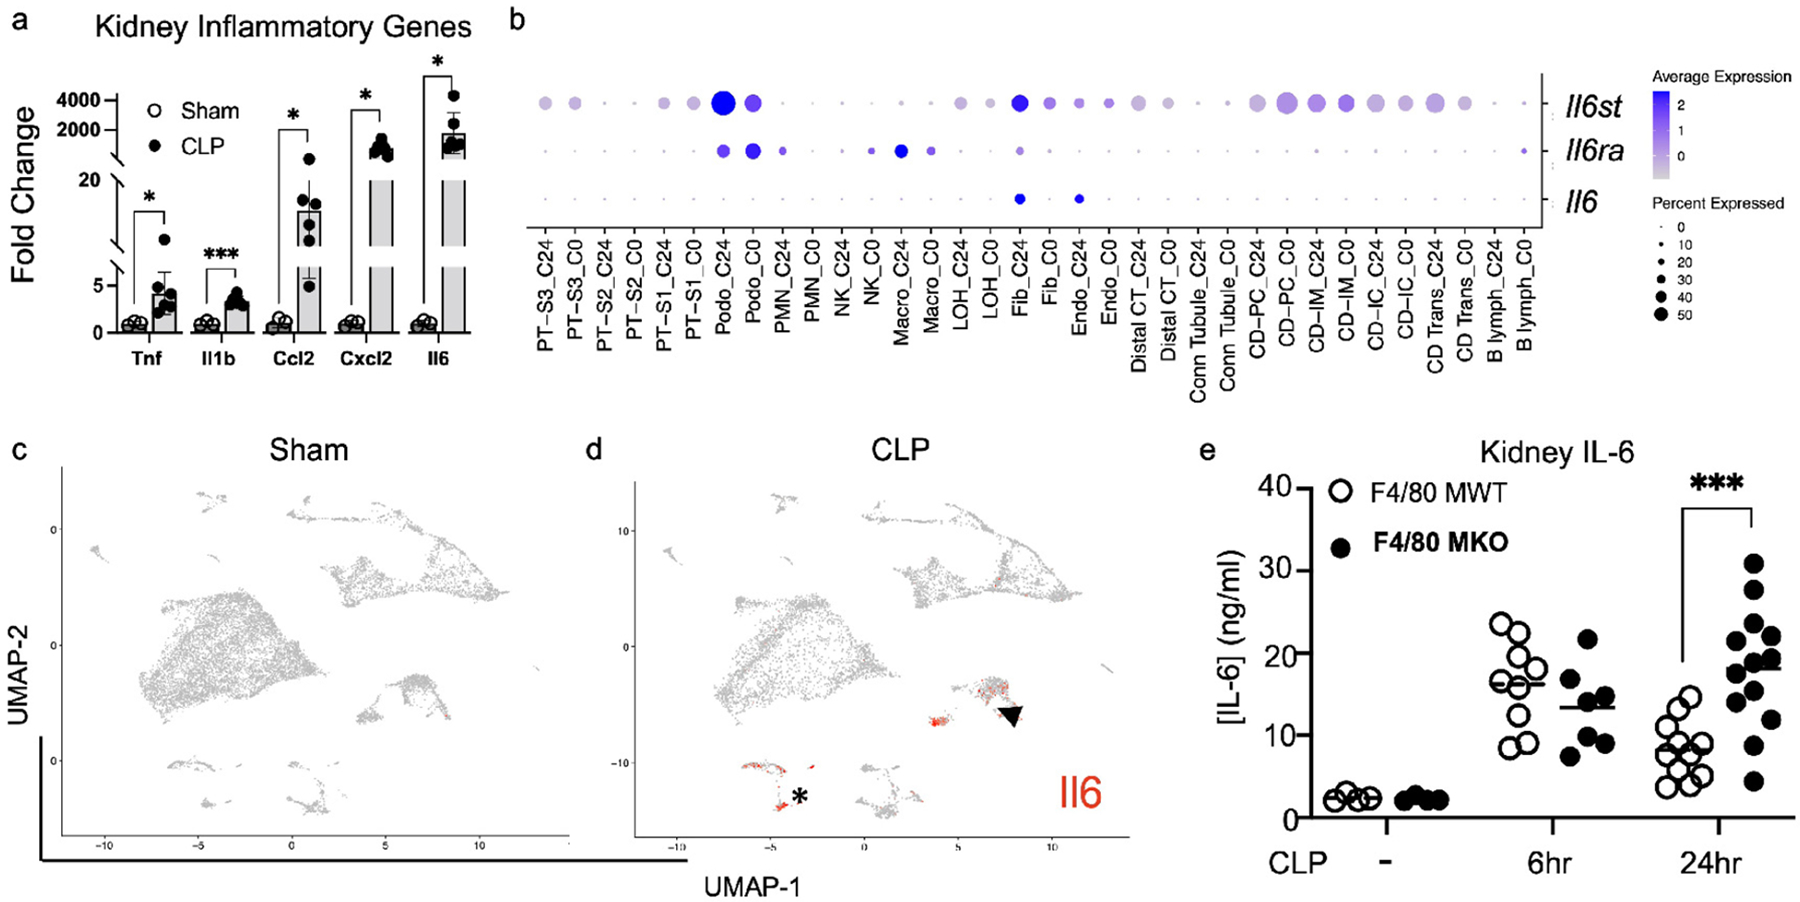
Wildtype mice were subjected to sham or CLP. At 24 hours after CLP, kidneys were harvested. (a) RT-PCR was performed for pro-inflammatory genes of interest. Shown in graph is fold change compared to sham mRNA expression for each gene (mean + SEM, n=3 for sham, n=6 for CLP). Multiple comparisons t-test was performed (*P<0.05, ***P<0.001). (b-d) scRNAseq analysis of kidney from sham or CLP mice. (b) Dot plot showing expression of gp130 (Il6st-top row), Il6 receptor (Il6ra-middle row), and Il6 (bottom row) between sham (C0) and CLP (C24) mice. (c-d) Feature plots showing expression of Il6 in each cell cluster between (c) sham and (d) CLP mice. Note the limited expression of Il6 in all cell types except endothelial cells (arrowhead) and fibroblasts (asterisk) after CLP. (e) Levels of IL-6 as measured by ELISA in whole kidney tissue in F4/80 MWT and F4/80 MKO mice after sham or CLP. Dots represent individual mice (n=4 for sham groups, n=7–9 mice for 6hr groups, n=11–13 for 24hr groups). Significance determined by two-way ANOVA with post-hoc test (***P<0.001).
Owing to the importance of IL-6 signaling during septic AKI, we next assessed whether F4/80hi macrophages limited IL-6 generation in the kidney. We found that early generation of IL-6 protein was similar between F4/80 MWT and F4/80 MKO kidneys (Figure 6e). However, similar to the trajectory of serum creatinine (Figure 4b), compared to F4/80 MWT mice, F4/80 MKO kidneys displayed significantly higher levels of IL-6 protein at 24 hours after CLP (Figure 6e). Thus, IL-6 is significantly upregulated following CLP, endothelial cells are a primary source of IL-6 during sepsis, and F4/80hi macrophages limit ongoing IL-6 generation in the kidney as a possible mechanism of kidney protection.
F4/80hi macrophages express the IL-1 antagonist, Il1rn, following sepsis.
IL-1 is known to induce IL-6.42 Inversely, anti-IL-1 therapy can limit IL-6 generation,42 and has been reported to be beneficial in COVID-19, potentially due to IL-6 inhibition.43 Accordingly, due to the enrichment of genes associated with IL-1 inhibition in macrophages following CLP (Supplementary Table 1), we reasoned that macrophages could antagonize the IL-1 pathway in endothelial cells to limit inflammation. We performed NicheNet analysis, examining macrophages as sender cells and endothelial cells as receiver cells (Figure 7a). NicheNet analysis predicted Il1rn encoding IL-1 receptor antagonist (IL1ra) to be the second most prioritized ligand from macrophages to act on endothelial cells (Figure 7b). We also found that macrophage Il1rn was predicted to regulate expression of endothelial Il6 (Figure 7b, arrowhead). Further analysis also determined that macrophages are a major kidney cell population which express Il1rn (Figure 7c), a finding validated in an external dataset of endotoxic AKI40 (Supplementary Figure S10c). We performed cell sorting to validate our scRNAseq findings and to examine whether Il1rn was expressed predominantly by F4/80hi macrophages or CD11bhi macrophages as our NicheNet analysis was not designed to discriminate between these two macrophage populations. We confirmed that compared to CD11bhi macrophages, F4/80hi macrophages displayed profound upregulation of Il1rn (>100-fold), selectively after CLP (Figure 7d,e). These concordant findings between scRNAseq and fluorescent cell sorting analysis suggest that F4/80hi macrophages express the IL-1 antagonist, Il1rn, as a possible mechanism to limit IL-6 generation and kidney inflammation following sepsis.
Figure 7 – F4/80hi macrophages express the IL-1 antagonist IL1rn.
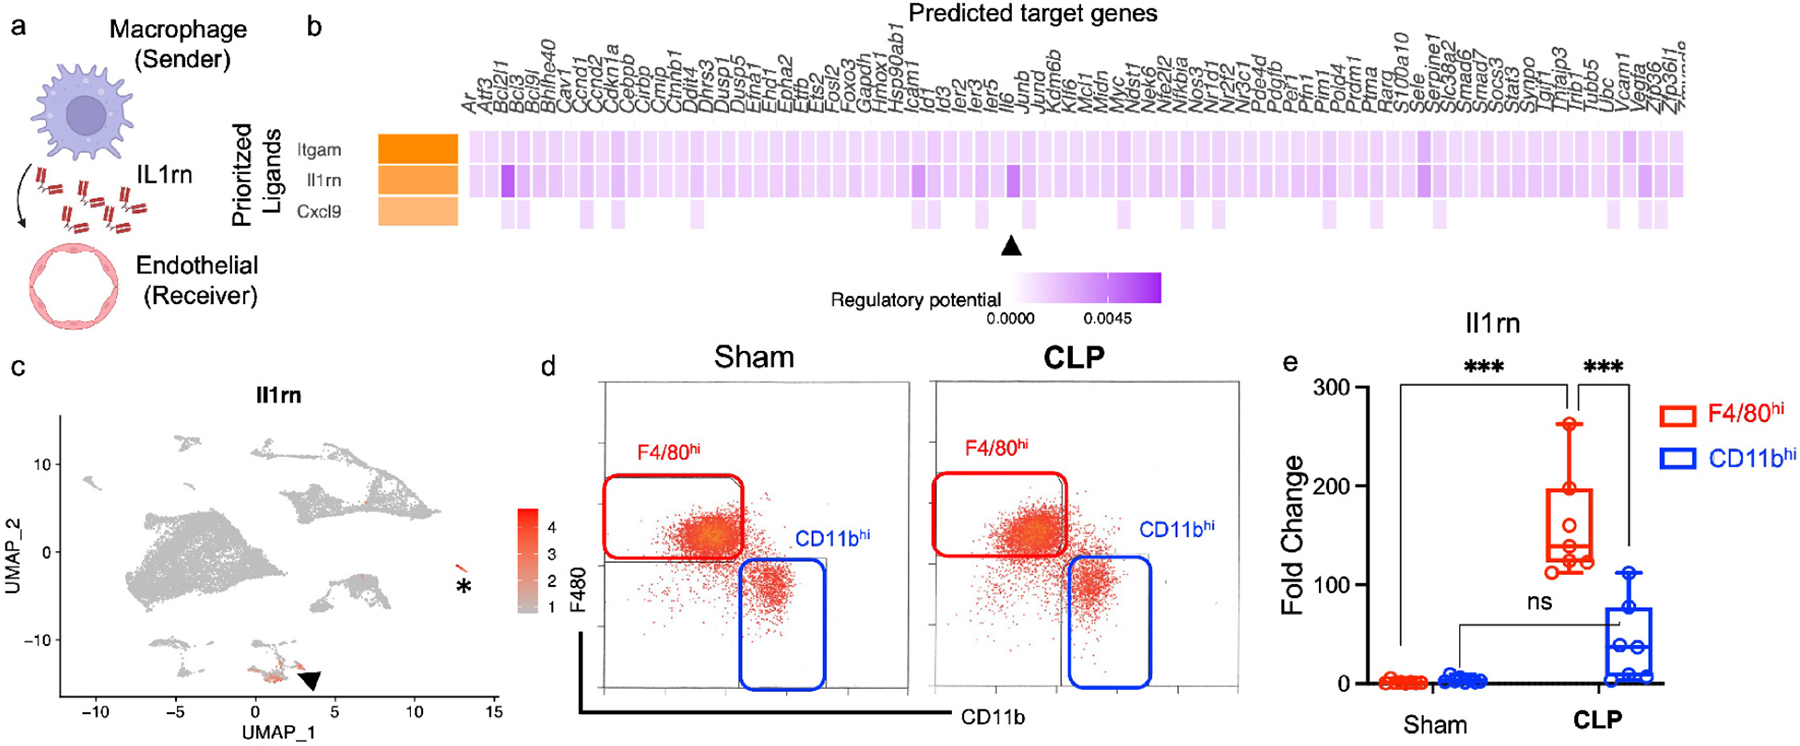
(a) Schematic of NicheNet analysis ligand-receptor interaction of single cell RNA sequencing demonstrating macrophages as sender and endothelial cells as receiver (figure created with BioRender.com). (b) NicheNet analysis of top 3 prioritized ligands secreted from macrophages and downstream target genes in endothelial cells. Arrowheads point to Il6 as target gene in endothelial cells modulated by macrophage Il1rn. (c) Feature plot demonstrating expression of Il1rn in various kidney cell clusters with arrowhead pointing at macrophage cell cluster and asterisk at neutrophil cluster. (d-e) Kidneys were harvested and fluorescent cell sorting was performed. (d) Gating strategy used to sort F4/80hi (red) or CD11bhi (blue) macrophages based on CD11b and F4/80 expression. RT-PCR was performed on sorted cell populations. (e) Boxplot shows fold change in mRNA expression of Il1rn for each group compared to Sham F4/80 MWT (Line at median, error bars show minimum and maximum values for each group). Dots represent individual samples for each group (n = 8 for sham, n = 7 for CLP). Statistical analysis performed by two-way ANOVA with post-hoc test (ns-not significant, ***P<0.001).
F4/80hi macrophages limit IL-6 expression in kidney endothelial cells.
To determine if F4/80hi macrophages limit IL-6 generation from endothelial cells, we sorted endothelial cells (Figure 8a) from F4/80 MWT and F4/80 MKO mice after CLP and measured IL-6 mRNA expression of the sorted endothelial cells. We additionally sorted fibroblasts (Figure 8b,c, Supplementary Figure S11) as they express high levels of Il6 (Figure 6c,d) and F4/80hi macrophages could also be acting on fibroblasts to limit IL-6 generation. We found that depletion of F4/80hi macrophages augmented IL-6 mRNA expression selectively in endothelial cells but not fibroblasts (Figure 8c,d).
Figure 8 – F4/80hi macrophages limit IL-6 generation in endothelial cells via IL1ra, and anti-IL-6 therapy attenuates septic AKI in F4/80 MKO mice.
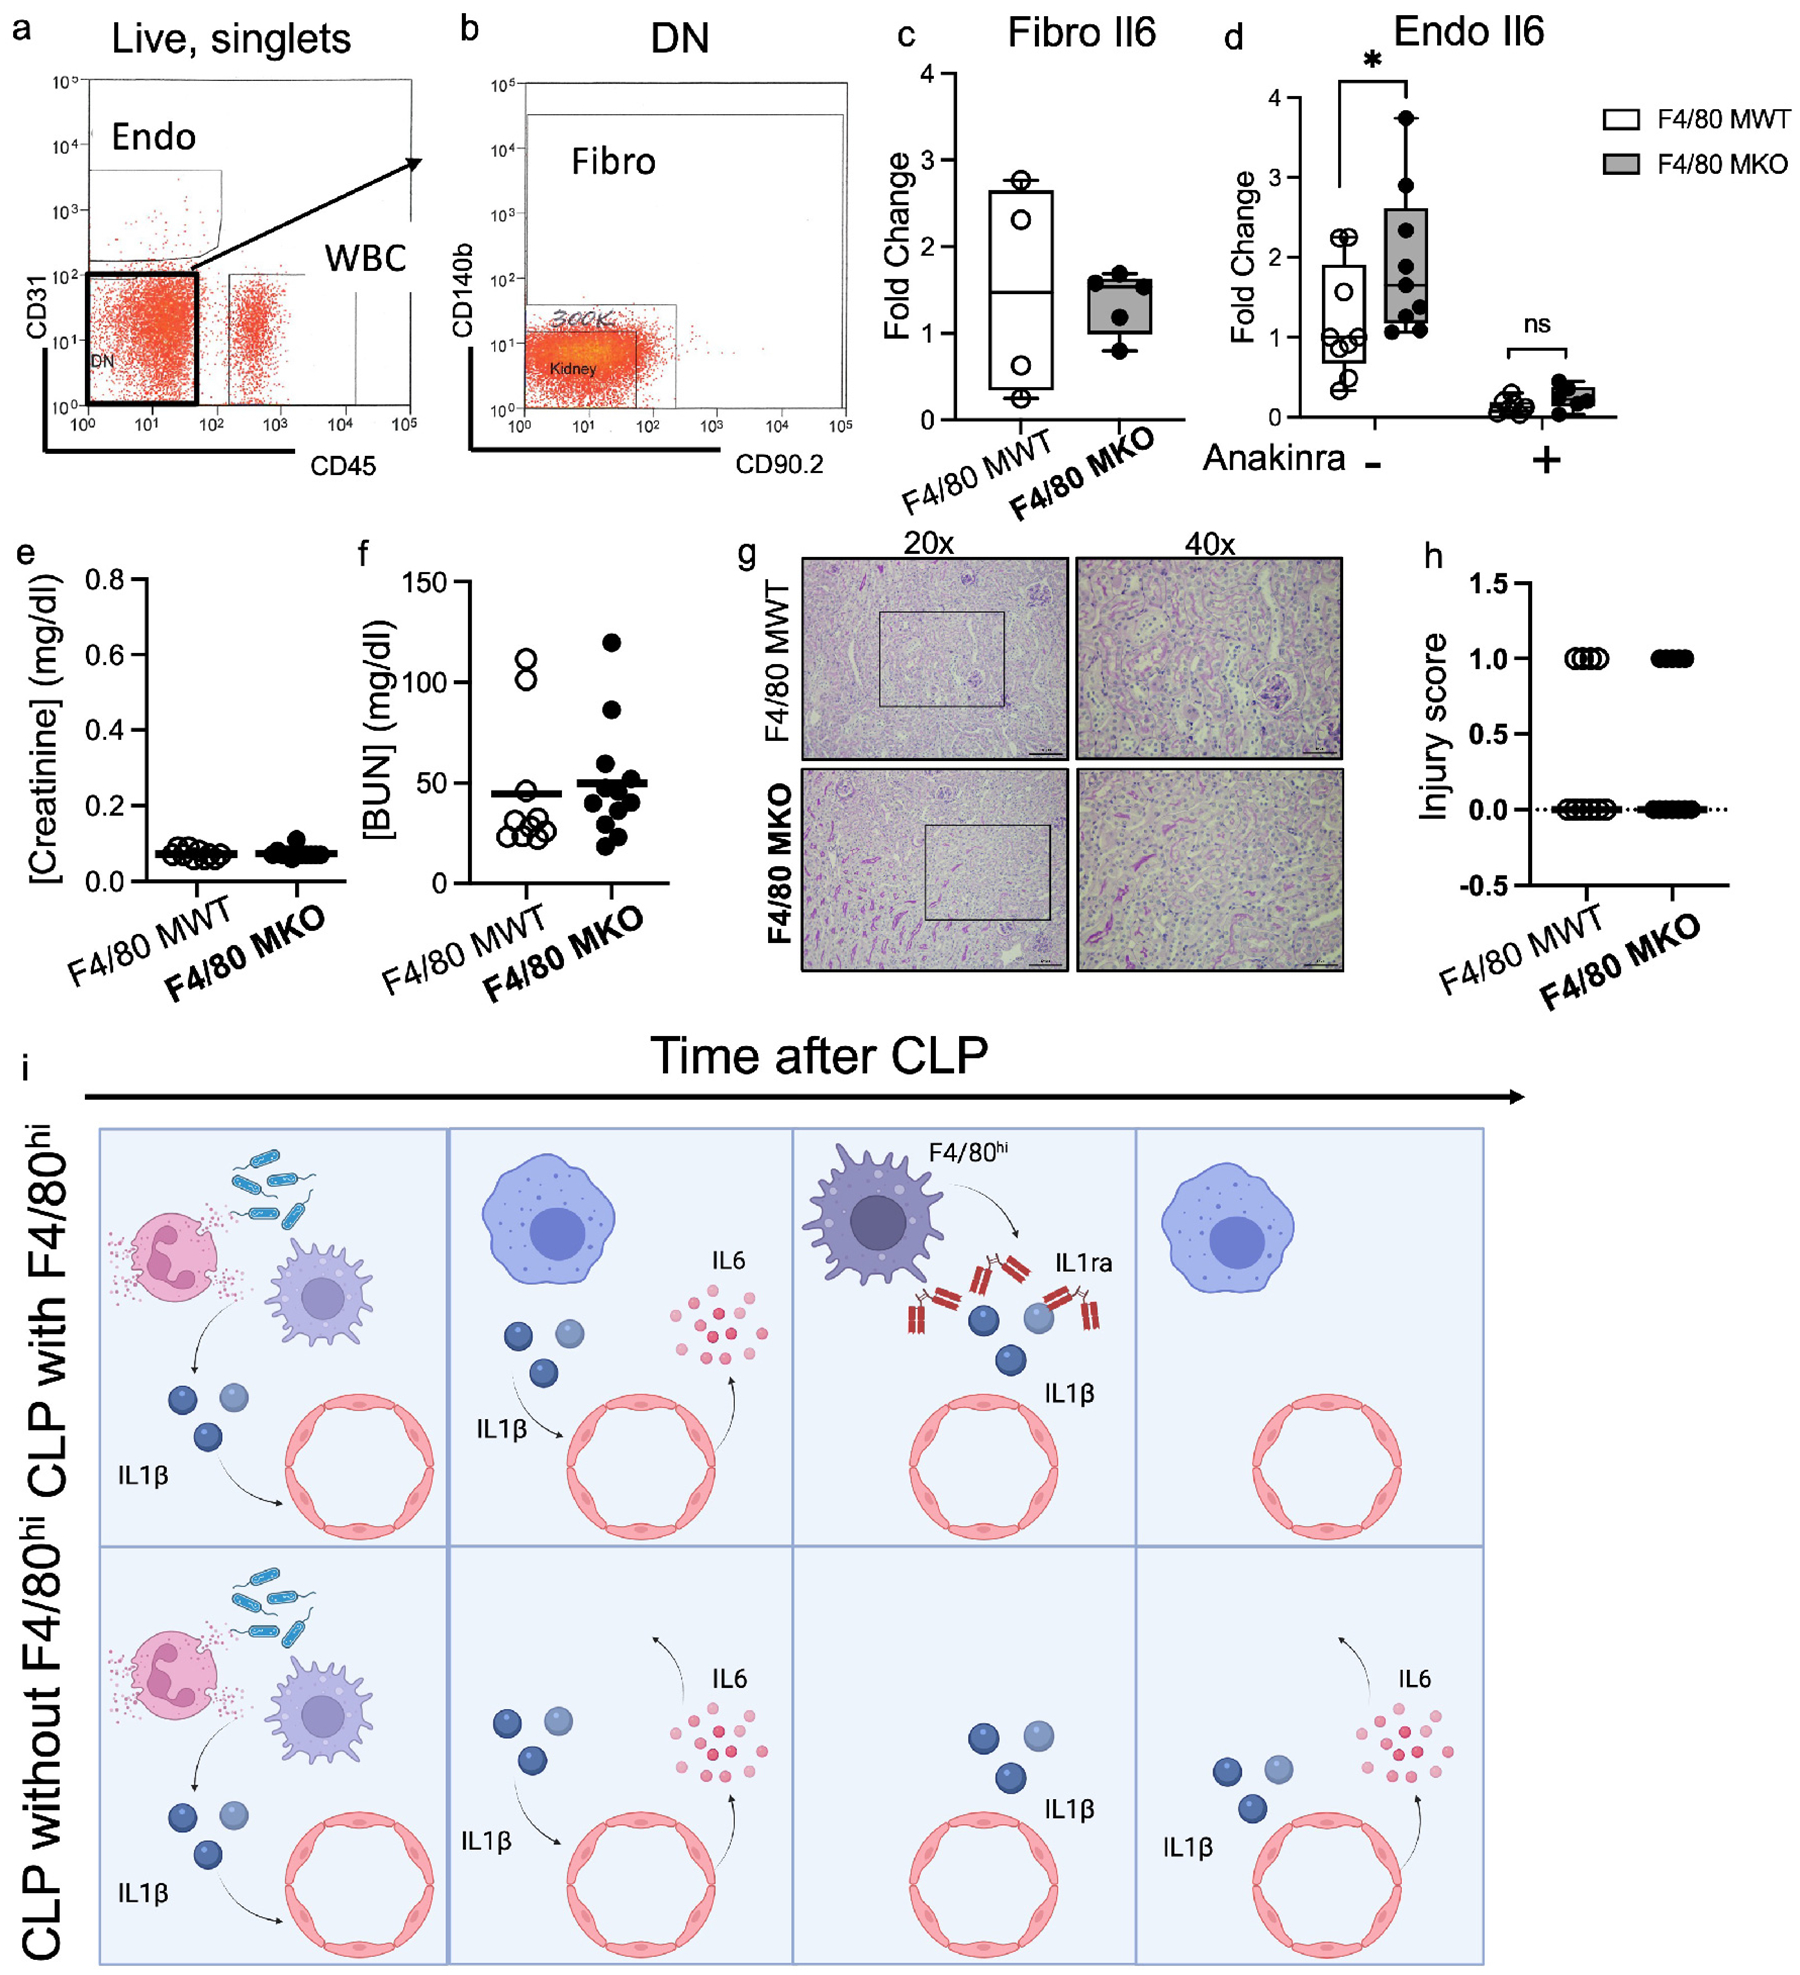
(a-d) RT-PCR was performed on sorted endothelial cells and fibroblasts from F4/80 MWT and F4/80 MKO mice after CLP in the absence or presence of recombinant human IL1ra (Anakinra, 50mg/kg). (a) Fluorescent dot plot demonstrating expression of CD31 and CD45 in Live singlets. Endo gate denotes endothelial cells. WBC denotes white blood cells (CD45+). (b) Dot plot showing expression of CD140b and CD90.2 from double negative (DN) cells from (a). Fibro gate denotes fibroblast cells. (c) RT-PCR for IL-6 mRNA expression was performed on sorted cells from Fibro gate in (b). Each dot within boxplot denotes individual sample. (d) RT-PCR for IL-6 mRNA expression was performed on sorted cells from Endo gate in (a). Each dot within boxplot denotes an individual sample (n=9 for non-Anakinra groups, n=6–7 for Anakinra groups, normalized to F4/80 MWT non-Anakinra sample). Statistical significance determined by two-way ANOVA with post-hoc test (*P<0.05). (e-h) F4/80 MWT and F4/80 MKO mice were subjected to CLP. Immediately after CLP, mice were injected with anti-IL-6 antibody (1.33 mg/kg). At 24 hours, mice were sacrificed. Serum (e) creatinine and (f) blood urea nitrogen (BUN) were measured. (g-h) Representative periodic-acid Schiff (PAS) stained kidney sections from mice at (left) 20x (scale bar – 100μm) with outlined box shown in (right) at 40x (scale bar - 50μm). (h) Sections were graded by blinded observer for histologic injury score. Dots in graph display injury score for each animal with line at median. (i) Schematic of working model postulating that kidney F4/80hi macrophages secrete the IL-1 antagonist (IL1ra), to limit IL-6 generation from kidney endothelial cells during septic AKI. Created with BioRender.com.
To further determine whether elaboration of Il1ra is the mechanism through which F4/80 macrophages limit endothelial IL-6 to protect against septic AKI, we treated F4/80 MWT and F4/80 MKO mice with anakinra (recombinant human IL1ra) after CLP. We found that anakinra treatment reversed the heightened AKI in F4/80 MKO mice compared to F4/80 MWT mice (Supplementary Figure S12a,b). Moreover, anakinra ameliorated increases in endothelial IL6 expression in F4/80 MKO mice in vivo (Figure 8d) and in IL1β-treated endothelial cells in vitro (Supplementary Figure S12c). To rule out an effect of F4/80 macrophage depletion to modulate Il1rn expression in other kidney cell populations, we measured Il1rn expression in sorted kidney endothelial cells, epithelial cells, and neutrophils following CLP. We were unable to detect Il1rn expression in sorted endothelial cells (not shown); and F4/80 macrophage depletion did not significantly alter expression of Il1rn in epithelial cells or neutrophils (Supplementary Figure S13). Taken together, we concluded that F4/80 macrophages elaborate IL1ra to constrain endothelial IL6 and limit septic AKI.
Anti-IL-6 treatment ameliorates AKI following F4/80hi macrophage depletion.
We next posited that the exaggerated IL-6 generation permitted by F4/80hi macrophage depletion could lead to worsening septic AKI. We therefore tested the capacity of anti-IL-6 therapy to limit septic AKI in F4/80 F4/80 MKO mice. We injected F4/80 MKO and MWT mice with anti-IL-6 after CLP. As hypothesized, we found that F4/80 MWT and F4/80 MKO mice treated with anti-IL-6 had similar levels of serum creatinine and BUN at 24 hours after CLP (Figure 8e,f). Compared to F4/80 MKO mice who did not receive anti-IL-6 therapy (Figure 4b), F4/80 MKO mice who received anti-IL-6 therapy had significantly lower levels of serum creatinine at 24 hours after CLP (mean difference 0.33 mg/dl, 95% CI 0.21–0.46, P<0.001 by two-way ANOVA). We also found that anti-IL-6 abrogated differences in histologic injury between F4/80 MWT and F4/80 MKO mice (Figure 8g,h) and reduced kidney tissue IL6 levels (Supplementary Figure S14) after CLP. Thus, anti-IL-6 treatment can reverse the detrimental effects accruing from F4/80hi macrophage depletion during septic AKI.
Discussion.
In this study, we define an axis through which macrophages limit endothelial cell-dependent kidney injury during sepsis. Using a murine model of septic AKI, we find that F4/80hi kidney macrophages are necessary to attenuate the severity of septic AKI through elaboration of anti-inflammatory mediators, namely Il1rn/IL1ra, which curbs IL-6 expression in endothelial cells (Figure 8e). Using external datasets of murine endotoxemia40 and human COVID-19,41 other conditions associated with inflammatory kidney injury, we validated the high expression of IL1rn in macrophages and IL6 in endothelial cells. A kidney macrophage-endothelial unit has been previously proposed wherein macrophages lie in close proximity to endothelial cells and monitor proteins and immune complexes that are filtered at the glomerulus.9 Our results provide further evidence of a macrophage-endothelial immunoregulatory axis where within cortical regions of the kidney, macrophages and endothelial cells are primed to form a paracrine regulatory feedback loop to limit inflammatory injury in the kidney in the septic state. These studies provide further rationale to target macrophage-endothelial interactions to protect the kidney during sepsis.
Our study supports a key role for F4/80hi macrophages in protecting the kidney. F4/80hi macrophages clearly play prominent but complex roles in kidney disease as they have been shown to promote cyst formation10 but conversely to constrain AKI and promote healing pathways following toxins and ischemia.7, 19 Our results would lend further evidence to an anti-inflammatory function for F4/80hi macrophages. However, the specific effect of F4/80hi macrophages likely depends on the disease context. Indeed, although inflammation does play a role in cyst formation,10, 11 it is plausible that the heightened pro-inflammatory cytokine levels seen after an acute insult (ischemia, toxins, sepsis) amplify the protective role of F4/80hi macrophages to curb inflammation and attenuate injury.
Regarding macrophage populations, studying the effects of macrophage subpopulations has been hampered by limited genetic models or reagents that non-specifically target kidney myeloid populations, such as liposomal clondronate. Kidney myeloid cells rely highly on the CX3CL1-CX3CR1 ligand receptor pair for homing to the kidney compared to other organs.14, 38 In our genetic model, we took advantage of the prominent expression of both CX3CR1 and CD11c on F4/80hi macrophages and were able to demonstrate selective depletion of F4/80hi macrophages in the kidney, without significant effects on other kidney myeloid populations including monocytes. We further showed that selective depletion of F4/80hi macrophage occurred in the cortex due to higher intensity of CD11c expression. Our data uniquely identify spatial heterogeneity of macrophage subpopulations, which may explain their distinct role in immune surveillance for autoantigens in the cortex and urinary tract infections in the medulla in mice and humans.9, 15, 44
Another important finding of our study is the significant role of IL-6 in septic AKI pathogenesis. IL-6 plays a complex and pleiotropic role in inflammation and sepsis. Chronic, sustained elevation of IL-6 is thought to exacerbate lupus nephritis and atherosclerotic vascular disease, and its levels are commonly elevated in CKD patients.39, 45–47 In contrast, IL-6 trans-signaling was protective in HgCl2-induced and ischemic AKI models.48, 49 In our study, IL-6 was produced at high levels by endothelial cells after sepsis, findings that were validated in external datasets.40, 41 Thus, the ability of macrophages to limit activation of endothelial cells and suppress IL-6 production, as we show here, likely plays a significant role in ameliorating septic AKI. Indeed, antagonists of IL-6 signaling have become quite important in the fight against COVID-19, another state of excessive inflammation, as IL-6 antagonists are some of the few agents with verified efficacy to improve outcomes.23–26 As in our sepsis study, many COVID-19 related complications are the result of endothelial-mediated injury.50, 51 As such, antagonizing IL-6 during COVID-19 may limit those complications accruing from endothelial dysfunction.
One limitation of our study is that we used an acute sepsis model, wherein the long-term effect of IL-6 antagonism is not known. Indeed, anti-IL-6 therapy may make sepsis harder to control and pre-dispose to opportunistic infections as has been seen with tocilizumab,52 a monoclonal antibody directed against the IL6 receptor. In our study, we used a monoclonal antibody directed against IL-6, similar to the human drug siltuximab. It remains to be determined whether anti-IL6R, anti-IL-6, or kinase inhibitors (e.g., baricitinib) are more efficacious to dampen inflammation while preserving host response to opportunistic infections. We acknowledge survivorship bias as a potential limitation in our severe sepsis model, although it should be noted that only one animal was lost in each genotype prior to 24 hours. Lastly, histologic kidney injury is milder in this rodent CLP model compared to ischemic or toxic AKI,30, 31, 53 which is consistent with human AKI pathology.30, 34 It should be noted that a few studies54 have demonstrated higher histologic injury scores than we found. We did use a CLP model where fluids and antibiotics were administered to animals to mimic therapies provided to humans with sepsis, which could account for histologic injury differences. Thus, caution should be taken to extrapolate our findings to other CLP studies unless model parameters are directly compared.
In conclusion, we report that F4/80hi macrophages constrain sepsis-induced AKI through IL-6 suppression. In turn, we present evidence that antagonizing IL-6 signaling can protect against septic AKI. Our studies provide a rationale to target macrophage-endothelial cell interactions and IL-6 to limit septic AKI.
Supplementary Material
Supplementary Materials and Methods
Supplementary Table 1: Top 25 enriched GO terms in macrophage cluster between sham and CLP
Supplementary Table 2: Fluorescent cell sorting antibodies
Supplementary Table 3: Primers used for RT-PCR analysis
Supplementary Figure S1 – Gating strategy used to analyze myeloid cells and lymphoid cells within the kidney. (a) Myeloid gating strategy. (b) Lymphocyte gating strategy starting from Live, single cell population in (a). Label on top of plot corresponds to gate from previous plot. Abbreviations: PMN-polymorphonuclear cell (neutrophil), cDC-conventional dendritic cell, MHC-major histocompatibility complex, iMono-inflammatory monocyte, rMono-resident monocyte, Mono-monocyte.
Supplementary Figure S2 – Characterization of macrophage populations and CX3CR1/CX3CL1 by scRNAseq. (a) UMAP plot showing macrophage subclusters. (b) Macrophage clusters based on experimental group. (c) Dot plot demonstrating expression of known myeloid cell genes within each cell cluster. Note that Macro1 cluster expresses high levels of C1qc, Cx3cr1, and Adgre1 (F480) indicating they are F4/80hi. Macro 2 expresses C1qc indicating it is macrophage population, but lower levels of Adgre1, Cx3cr1 indicating they are CD11bhi. Macro 3 expresses higher levels of Itgax (CD11c) along with Cd209 indicating they correspond to the convention dendritic cell 2 (cDC2) population. Macro 4 is small population that likely is transitioning population. (d) Dot plot demonstrating expression Cx3cr1 and Cx3cl1 in kidney cell clusters. Cx3cr1 is expressed at high levels only in Macro cluster, Cx3cl1 is expressed in multiple cell lineages.
Supplementary Figure S3 – F4/80 MWT and F4/80 MKO mice do not exhibit differences in myeloid populations in the kidney at baseline. Mice were administered diphtheria toxin for three successive days and then flow cytometric analysis was performed one day later on whole kidney digests based on gating strategy in Supplementary Figure 1. Graphs display line at mean, dots represent individual mice. Differences were not significant as determined by unpaired T test. Abbreviations: PMN-polymorphonuclear cell (neutrophil), cDC-conventional dendritic cell, iMono-inflammatory monocyte, rMono-resident monocyte, Mono-monocyte.
Supplementary Figure S4 – F4/80 MWT and F4/80 MKO mice do not exhibit differences in myeloid populations in the spleen at baseline. Mice were administered diphtheria toxin for three successive days and then flow cytometric analysis was performed one day later on splenocytes. (a) Pseudocolor dot plots demonstrating gating strategy to identify MHCII+ and monocyte populations in the spleen in Ly6G-/CD11b+ cells. (b-d) Percent (%) of cells parent plots above for (b) MHCII+, (c) Ly6C− monocytes and (d) Ly6C+ monocytes. (e-g) Cells/spleen for (e) MHCII+, (f) Ly6C− monocytes and (g) Ly6C+ monocytes. Graphs display line at mean, dots represent individual mice (n = 4/group). Differences were not significant as determined by unpaired T test.
Supplementary Figure S5 – Cortical myeloid cells express CD11c at high levels to drive diphtheria toxin receptor expression. Cortical and medullary portions from kidneys of F4/80 MKO mice were dissected and digested, and flow cytometry was performed on digests. (a,b) Histograms and (c,d) graphs display median fluorescence intensity (MFI) of (a,c) CX3CR1 and (b,d) CD11c in kidney myeloid cells (Live / CD45+ / CD11b+ or CD11c+) (n = 3/group with significance determined by unpaired t test (*p<0.05, **p<0.01). (e) Frozen sections were obtained from F4/80 MWT and F4/80 MKO mice and immunofluorescence confocal microscopy was performed. Representative images display expression of F4/80, diphtheria toxin receptor (DTR), and DAPI in cortex and inner medulla for both genotypes. Arrowheads point to co-localization of F4/80 and DTR in F4/80 MKO cortex, which was not visualized in inner medulla of F4/80 MKO mice or F4/80 MWT sections (scale bar – 10 μm).
Supplementary Figure S6: F4/80 MWT and F4/80 MKO kidney histology at baseline. Non-treated F4/80 MWT and F4/80 MKO kidneys were harvested. (a) Representative periodic-acid Schiff (PAS) stained kidney sections at (left) 20x (scale bar – 100 μm) with outlined box shown in (right) at 40x (scale bar – 50μm) (b) Injury scoring of kidney sections by blinded observer. Graph displays dots for individual mice (n = 3 for both groups) with line at median.
Supplementary Figure S7: F4/80 MKO express KIM-1 at higher levels than F4/80 MWT mice after CLP. F4/80 MWT and F4/80 MKO kidney were subjected to CLP, kidneys harvested at 24 hours, and frozen histologic kidney sections were obtained. (a) Representative immunofluorescence confocal images display expression of KIM-1 and DAPI (scale bar = 100μm) with (b) high magnification of outlined box (arrowheads-positive KIM-1 staining, scale bar = 50μm). (c) The amount of KIM-1 positive area (as % of DAPI) was quantified by blinded observer. Graph displays dots for individual mice (n = 3 for both groups) with significance determined by unpaired T test.
Supplemental Figure S8 – F4/80 MWT and F4/80 MKO mice do not exhibit differences in myeloid or lymphocyte populations in the kidney at 24 hours after CLP. Mice were administered diphtheria toxin for three successive days, then subjected to CLP, and kidneys were harvested at 24 hours. (a) Flow cytometric analysis was performed on whole kidney digests and immune population were parsed per Supplementary Figure S1. Graphs display cells/mg kidney with line at mean, dots represent individual mice. Differences were not significant as determined by unpaired T test. (PMN-polymorphonuclear cell (neutrophil), cDC-conventional dendritic cell, iMono-inflammatory monocyte, rMono-resident monocyte, Mono-monocyte). (b) Frozen kidney sections from F4/80 MWT and F4/80 MKO mice were stained for phalloidin to mark actin cytoskeleton, myeloperoxidase (MPO) to mark neutrophils, and DAPI to mark nuclei. Shown are representative cortical and medullary images for each genotype (scale bar = 50μm) with magnified region of outlined box shown in (c) (scale bar = 100μm, arrowheads = MPO staining). (d) The percent of MPO staining was quantified in multiple images of each region by blinded observer and then averaged for each mouse (represented by dots). Significance was determined by two-way ANOVA with post-hoc test (**p<0.01, ns-not significant).
Supplementary Figure S9: Importance of IL6-signaling during septic AKI. Ingenuity pathway analysis was performed on cell clusters to identify inflammatory pathways that were significantly modulated after CLP. Heatmap shows z-scores for indicated pathways for cell clusters with magnitude of z-score shown in legend (gray boxes indicate z-score could not be determined). Note induction of genes associated with IL6-signaling in all cell types compared to other inflammatory pathways.
Supplementary Figure S10: Validation of endothelial cell Il6 and macrophage Il1rn expression in external datasets. (a-c) scRNAseq data from external dataset examining effect on gene expression in kidney cells following lipopolysaccharide endotoxemia (GEO GSE151658). UMAP plots generated from gene expression tool on laboratory website (https://connect.rstudio.iu.edu/content/18/) for (a) cell cluster identity, (b) feature plot of Il6, (c) feature plot of Il1rn. Note expression of Il6 mainly in endothelial cells in (b) and Il1rn in macrophages in (c) as indicated by arrowhead. (d) scRNAseq data from kidneys of COVID-19 patients (https://singlecell.broadinstitute.org/single_cell/study/SCP868/hca-lungmap-covid-19-kidney?genes=IL6&tab=scatter#study-summary). UMAP plots generated from tool on website with left plot showing expression of IL6 (arrowhead) mainly in endothelial cells based on cell cluster identify shown in right plot.
Supplementary Figure S11 – Validation of fibroblast markers in sorted kidney fibroblasts. Kidneys were harvested and fluorescent cell sorting was performed. (a) Live, singlets were sorted based on CD31 and CD45 expression to exclude endothelial cells and leukocytes. (b) Of remaining double negative cells, cells were deemed to be fibroblasts based on expression of either CD90.2 or CD140b. Remaining cells were deemed kidney cells. (c-d) RT-PCR was performed on sorted populations and expression of (c) Cdh16 was used to validate kidney tubular cells, and (d) collagen 1a (Col1a) and (e) Vimentin (Vim) were used as fibroblast validation markers. Graphs show fold change compared to kidney cells. Each dot represents individual sample with line at mean.
Supplemental Figure S12 – IL1ra (Anakinra) therapy attenuates exaggerated septic AKI in vivo and endothelial Il6 expression in vitro. (a,b) F4/80 MWT and F4/80 MKO mice were subjected to CLP. Immediately after CLP, mice were injected with IL1ra (Anakinra) therapy (50 mg/kg). At 24 hours, mice were sacrificed. Serum (a) creatinine and (b) blood urea nitrogen (BUN) were measured. Means were not different between groups as determined by Mann-Whitney test. (c) A mouse endothelioma cell line, b.End3, were grown to confluence. Cell were treated with vehicle (−) or IL1β (100 ng/ml) in the presence of Anakinra. Shown in graph is fold change in Il6 mRNA from b.End3 cells. Significance determined by one-way ANOVA with Tukey’s multiple comparisons post-hoc test (*p<0.05, ****p<0.0001).
Supplemental Figure S13 – Depletion of F4/80 macrophages does not significantly modulate expression of Il1rn in epithelial cells or neutrophils after CLP. F4/80 MWT and F4/80 MKO mice were subjected to CLP. Kidneys were harvested at 24 hours and fluorescent cell sorting was performed. (a) Live, singlets were sorted based on CD31 and CD45 expression to exclude endothelial cells and leukocytes to obtain double negative Epithelial population. (b) Ly6G+/CD11b+ neutrophil (PMN) population from CD45+ cells in (a). (c-d) RT-PCR was performed on sorted populations and expression of Il1rn was measured in (c) epithelial cells and (d) PMN. Graphs show fold change compared to F4/80 MWT cells for each cell type. Each dot represents individual sample with line at mean. Statistical significance determined by unpaired T test (ns-not significant).
Supplemental Figure S14 – Anti-IL6 treatment decreases kidney IL6 levels following CLP. F4/80 MWT and F4/80 MKO mice were subjected to CLP with or without anti-IL6 given immediately after CLP surgery. First three columns/groups in graph show data from Figure 6e in primary manuscript for comparison of IL6 levels in presence or absence of anti-IL6 therapy. Data in last column/group shows data from mice treated with anti-IL6 therapy (n=10 for F4/80 MKO, n=12 for F4/80 MKO). Significance determined by two-way ANOVA with Sidak post-hoc test (**p<0.01, ****p<0.0001).
Supplementary References
Translational Statement.
In the current study, we find that depleting kidney F4/80hi macrophages in a transgenic mouse model worsens the severity of septic acute kidney injury. F4/80hi macrophages express anti-inflammatory mediators, including Il1rn/IL1ra, to limit interleukin-6 (IL-6) expression within endothelial cells. These results identify a macrophage-endothelial cell immunoregulatory axis to limit inflammation and AKI. These findings are particularly relevant owing to the efficacy of anti-IL-6 therapies during COVID-19 infection, a disease associated with high rates of AKI and endothelial dysfunction. Anti-IL-6 therapies may hold promise to limit septic acute kidney injury beyond COVID-19 related AKI.
Acknowledgements
The authors would like to acknowledge Dr. Aleksandra Tata (Duke University Department of Cell Biology) for technical assistance with imaging studies.
Funding:
This work was supported by National Institutes of Health grants K08 GM132689 to JRP and R01 DK118019 to SDC, and US Veterans Health Administration, Office of Research and Development, Biomedical Laboratory Research and Development grant BX000893 to SDC.
Footnotes
Publisher's Disclaimer: This is a PDF file of an unedited manuscript that has been accepted for publication. As a service to our customers we are providing this early version of the manuscript. The manuscript will undergo copyediting, typesetting, and review of the resulting proof before it is published in its final form. Please note that during the production process errors may be discovered which could affect the content, and all legal disclaimers that apply to the journal pertain.
Supplementary Material
Supplementary information is available on Kidney International’s website.
Privratsky-Supplementary-File.pdf
The authors declare no other relevant or material financial interests that relate to the research described in this paper.
Data availability statement
The data supporting the findings of this study are available in repository Github at https://github.com/jprivratsky/Mac-endo-septicAKI.git.
References
- 1.Zarbock A, Koyner JL, Hoste EAJ, et al. Update on Perioperative Acute Kidney Injury. Anesth Analg 2018; 127: 1236–1245. [DOI] [PubMed] [Google Scholar]
- 2.Thadhani R, Pascual M, Bonventre JV. Acute renal failure. N Engl J Med 1996; 334: 1448–1460. [DOI] [PubMed] [Google Scholar]
- 3.Hoste EA, Bagshaw SM, Bellomo R, et al. Epidemiology of acute kidney injury in critically ill patients: the multinational AKI-EPI study. Intensive Care Med 2015; 41: 1411–1423. [DOI] [PubMed] [Google Scholar]
- 4.Zarbock A, Gomez H, Kellum JA. Sepsis-induced acute kidney injury revisited: pathophysiology, prevention and future therapies. Cur Opin Crit Care 2014; 20: 588. [DOI] [PMC free article] [PubMed] [Google Scholar]
- 5.Singbartl K, Kellum JA. AKI in the ICU: definition, epidemiology, risk stratification, and outcomes. Kidney Int 2012; 81: 819–825. [DOI] [PubMed] [Google Scholar]
- 6.Salei N, Rambichler S, Salvermoser J, et al. The Kidney Contains Ontogenetically Distinct Dendritic Cell and Macrophage Subtypes throughout Development That Differ in Their Inflammatory Properties. J Am Soc Nephrol 2020; 31: 257–278. [DOI] [PMC free article] [PubMed] [Google Scholar]
- 7.Lever JM, Hull TD, Boddu R, et al. Resident macrophages reprogram toward a developmental state after acute kidney injury. JCI Insight 2019; 4. [DOI] [PMC free article] [PubMed] [Google Scholar]
- 8.Zimmerman KA, Bentley MR, Lever JM, et al. Single-Cell RNA Sequencing Identifies Candidate Renal Resident Macrophage Gene Expression Signatures across Species. J Am Soc Nephrol 2019; 30: 767–781. [DOI] [PMC free article] [PubMed] [Google Scholar]
- 9.Stamatiades EG, Tremblay ME, Bohm M, et al. Immune Monitoring of Trans-endothelial Transport by Kidney-Resident Macrophages. Cell 2016; 166: 991–1003. [DOI] [PMC free article] [PubMed] [Google Scholar]
- 10.Zimmerman KA, Song CJ, Li Z, et al. Tissue-Resident Macrophages Promote Renal Cystic Disease. J Am Soc Nephrol 2019; 30: 1841–1856. [DOI] [PMC free article] [PubMed] [Google Scholar]
- 11.Zimmerman KA, Huang J, He L, et al. Interferon Regulatory Factor-5 in Resident Macrophage Promotes Polycystic Kidney Disease. Kidney360 2020; 1: 179–190. [DOI] [PMC free article] [PubMed] [Google Scholar]
- 12.Hato T, Winfree S, Kalakeche R, et al. The macrophage mediates the renoprotective effects of endotoxin preconditioning. J Am Soc Nephrol 2015; 26: 1347–1362. [DOI] [PMC free article] [PubMed] [Google Scholar]
- 13.Ide S, Yahara Y, Kobayashi Y, et al. Yolk-sac-derived macrophages progressively expand in the mouse kidney with age. eLife 2020; 9: e51756. [DOI] [PMC free article] [PubMed] [Google Scholar]
- 14.Hochheiser K, Heuser C, Krause TA, et al. Exclusive CX3CR1 dependence of kidney DCs impacts glomerulonephritis progression. J Clin Invest 2013; 123: 4242–4254. [DOI] [PMC free article] [PubMed] [Google Scholar]
- 15.Stewart BJ, Ferdinand JR, Young MD, et al. Spatiotemporal immune zonation of the human kidney. Science 2019; 365: 1461–1466. [DOI] [PMC free article] [PubMed] [Google Scholar]
- 16.Huen SC, Cantley LG. Macrophages in Renal Injury and Repair. Annu Rev Physiol 2017; 79: 449–469. [DOI] [PubMed] [Google Scholar]
- 17.Lee S, Huen S, Nishio H, et al. Distinct macrophage phenotypes contribute to kidney injury and repair. J Am Soc Nephrol 2011; 22: 317–326. [DOI] [PMC free article] [PubMed] [Google Scholar]
- 18.Hato T, Zollman A, Plotkin Z, et al. Endotoxin Preconditioning Reprograms S1 Tubules and Macrophages to Protect the Kidney. J Am Soc Nephrol 2018; 29: 104–117. [DOI] [PMC free article] [PubMed] [Google Scholar]
- 19.Salei N, Ji X, Pakalniskyte D, et al. Selective depletion of a CD64-expressing phagocyte subset mediates protection against toxic kidney injury and failure. Proc Natl Acad Sci U S A 2021; 118. [DOI] [PMC free article] [PubMed] [Google Scholar]
- 20.Interleukin Hirano T. 6 and its receptor: ten years later. Int Rev Immunol 1998; 16: 249–284. [DOI] [PubMed] [Google Scholar]
- 21.Murugan R, Karajala-Subramanyam V, Lee M, et al. Acute kidney injury in non-severe pneumonia is associated with an increased immune response and lower survival. Kidney Int 2010; 77: 527–535. [DOI] [PMC free article] [PubMed] [Google Scholar]
- 22.Payen D, Lukaszewicz AC, Legrand M, et al. A multicentre study of acute kidney injury in severe sepsis and septic shock: association with inflammatory phenotype and HLA genotype. PLoS One 2012; 7: e35838. [DOI] [PMC free article] [PubMed] [Google Scholar]
- 23.Kalil AC, Patterson TF, Mehta AK, et al. Baricitinib plus Remdesivir for Hospitalized Adults with Covid-19. N Engl J Med 2021; 384: 795–807. [DOI] [PMC free article] [PubMed] [Google Scholar]
- 24.Marconi VC, Ramanan AV, de Bono S, et al. Efficacy and safety of baricitinib for the treatment of hospitalised adults with COVID-19 (COV-BARRIER): a randomised, double-blind, parallel-group, placebo-controlled phase 3 trial. Lancet Respir Med 2021; 9:1407–1418. [DOI] [PMC free article] [PubMed] [Google Scholar]
- 25.Rosas IO, Brau N, Waters M, et al. Tocilizumab in Hospitalized Patients with Severe Covid-19 Pneumonia. N Engl J Med 2021; 384: 1503–1516. [DOI] [PMC free article] [PubMed] [Google Scholar]
- 26.Salama C, Han J, Yau L, et al. Tocilizumab in Patients Hospitalized with Covid-19 Pneumonia. N Engl J Med 2021; 384: 20–30. [DOI] [PMC free article] [PubMed] [Google Scholar]
- 27.Kawakami T, Lichtnekert J, Thompson LJ, et al. Resident renal mononuclear phagocytes comprise five discrete populations with distinct phenotypes and functions. J Immunol 2013; 191: 3358–3372. [DOI] [PMC free article] [PubMed] [Google Scholar]
- 28.Caton ML, Smith-Raska MR, Reizis B. Notch-RBP-J signaling controls the homeostasis of CD8-dendritic cells in the spleen. J Exp Med 2007; 204: 1653–1664. [DOI] [PMC free article] [PubMed] [Google Scholar]
- 29.Diehl GE, Longman RS, Zhang J-X, et al. Microbiota restricts trafficking of bacteria to mesenteric lymph nodes by CX3CR1hi cells. Nature 2013; 494: 116–120. [DOI] [PMC free article] [PubMed] [Google Scholar]
- 30.Street JM, Koritzinsky EH, Bellomo TR, et al. The role of adenosine 1a receptor signaling on GFR early after the induction of sepsis. Am J Physiol Renal Physiol 2018; 314: F788–F797. [DOI] [PMC free article] [PubMed] [Google Scholar]
- 31.Miyaji T, Hu X, Yuen PS, et al. Ethyl pyruvate decreases sepsis-induced acute renal failure and multiple organ damage in aged mice. Kidney Int 2003; 64: 1620–1631. [DOI] [PubMed] [Google Scholar]
- 32.Privratsky JR, Zhang J, Lu X, et al. Interleukin 1 Receptor (IL-1R1) Activation Exacerbates Toxin-Induced Acute Kidney Injury. Am J Physiol Renal Physiol 2018; 315: F682–F691. [DOI] [PMC free article] [PubMed] [Google Scholar]
- 33.Zhang J-dD, Patel MB, Griffiths R, et al. Type 1 angiotensin receptors on macrophages ameliorate IL-1 receptor-mediated kidney fibrosis. J Clin Invest 2014; 124: 2198–2203. [DOI] [PMC free article] [PubMed] [Google Scholar]
- 34.Doi K, Leelahavanichkul A, Yuen PS, et al. Animal models of sepsis and sepsis-induced kidney injury. J Clin Invest 2009; 119: 2868–2878. [DOI] [PMC free article] [PubMed] [Google Scholar]
- 35.Carow B, Rottenberg ME. SOCS3, a Major Regulator of Infection and Inflammation. Front Immunol 2014; 5: 58. [DOI] [PMC free article] [PubMed] [Google Scholar]
- 36.Chakarov S, Lim HY, Tan L, et al. Two distinct interstitial macrophage populations coexist across tissues in specific subtissular niches. Science 2019; 363: eaau0964. [DOI] [PubMed] [Google Scholar]
- 37.Chousterman BG, Boissonnas A, Poupel L, et al. Ly6Chigh Monocytes Protect against Kidney Damage during Sepsis via a CX3CR1-Dependent Adhesion Mechanism. J Am Soc Nephrol 2016; 27: 792–803. [DOI] [PMC free article] [PubMed] [Google Scholar]
- 38.Hamdan D, Robinson LA. Role of the CX3CL1-CX3CR1 axis in renal disease. Am J Physiol Renal Physiol 2021; 321: F121–F134. [DOI] [PubMed] [Google Scholar]
- 39.Su H, Lei CT, Zhang C. Interleukin-6 Signaling Pathway and Its Role in Kidney Disease: An Update. Front Immunol 2017; 8: 405. [DOI] [PMC free article] [PubMed] [Google Scholar]
- 40.Janosevic D, Myslinski J, McCarthy TW, et al. The orchestrated cellular and molecular responses of the kidney to endotoxin define a precise sepsis timeline. Elife 2021; 10: e62270. [DOI] [PMC free article] [PubMed] [Google Scholar]
- 41.Muus C, Luecken MD, Eraslan G, et al. Integrated analyses of single-cell atlases reveal age, gender, and smoking status associations with cell type-specific expression of mediators of SARS-CoV-2 viral entry and highlights inflammatory programs in putative target cells. bioRxiv 2020: 2020.2004.2019.049254. [Google Scholar]
- 42.Cavalli G, Dinarello CA. Anakinra Therapy for Non-cancer Inflammatory Diseases. Front Pharmacol 2018; 9: 1157. [DOI] [PMC free article] [PubMed] [Google Scholar]
- 43.Cauchois R, Koubi M, Delarbre D, et al. Early IL-1 receptor blockade in severe inflammatory respiratory failure complicating COVID-19. Proc Natl Acad Sci U S A 2020; 117: 18951–18953. [DOI] [PMC free article] [PubMed] [Google Scholar]
- 44.Berry MR, Mathews RJ, Ferdinand JR, et al. Renal Sodium Gradient Orchestrates a Dynamic Antibacterial Defense Zone. Cell 2017; 170: 860–874 e819. [DOI] [PubMed] [Google Scholar]
- 45.Bruun JM, Lihn AS, Verdich C, et al. Regulation of adiponectin by adipose tissue-derived cytokines: in vivo and in vitro investigations in humans. Am J Physiol Endocrinol Metab 2003; 285: E527–533. [DOI] [PubMed] [Google Scholar]
- 46.Cash H, Relle M, Menke J, et al. Interleukin 6 (IL-6) deficiency delays lupus nephritis in MRL-Faslpr mice: the IL-6 pathway as a new therapeutic target in treatment of autoimmune kidney disease in systemic lupus erythematosus. J Rheumatol 2010; 37: 60–70. [DOI] [PubMed] [Google Scholar]
- 47.Linker-Israeli M, Deans RJ, Wallace DJ, et al. Elevated levels of endogenous IL-6 in systemic lupus erythematosus. A putative role in pathogenesis. J Immunol 1991; 147: 117–123. [PubMed] [Google Scholar]
- 48.Lemay S, Rabb H, Postler G, et al. Prominent and sustained up-regulation of gp130-signaling cytokines and the chemokine MIP-2 in murine renal ischemia-reperfusion injury. Transplantation 2000; 69: 959–963. [DOI] [PubMed] [Google Scholar]
- 49.Nechemia-Arbely Y, Barkan D, Pizov G, et al. IL-6/IL-6R axis plays a critical role in acute kidney injury. J Am Soc Nephrol 2008; 19: 1106–1115. [DOI] [PMC free article] [PubMed] [Google Scholar]
- 50.Goshua G, Pine AB, Meizlish ML, et al. Endotheliopathy in COVID-19-associated coagulopathy: evidence from a single-centre, cross-sectional study. Lancet Haematol 2020; 7: e575–e582. [DOI] [PMC free article] [PubMed] [Google Scholar]
- 51.Jin Y, Ji W, Yang H, et al. Endothelial activation and dysfunction in COVID-19: from basic mechanisms to potential therapeutic approaches. Signal Transduct Target Ther 2020; 5: 293. [DOI] [PMC free article] [PubMed] [Google Scholar]
- 52.Strand V, Ahadieh S, French J, et al. Systematic review and meta-analysis of serious infections with tofacitinib and biologic disease-modifying antirheumatic drug treatment in rheumatoid arthritis clinical trials. Arthritis Res Ther 2015; 17: 362. [DOI] [PMC free article] [PubMed] [Google Scholar]
- 53.Leelahavanichkul A, Huang Y, Hu X, et al. Chronic kidney disease worsens sepsis and sepsis-induced acute kidney injury by releasing High Mobility Group Box Protein-1. Kidney Int 2011; 80: 1198–1211. [DOI] [PMC free article] [PubMed] [Google Scholar]
- 54.Sureshbabu A, Patino E, Ma KC, et al. RIPK3 promotes sepsis-induced acute kidney injury via mitochondrial dysfunction. JCI Insight 2018; 3. [DOI] [PMC free article] [PubMed] [Google Scholar]
Associated Data
This section collects any data citations, data availability statements, or supplementary materials included in this article.
Supplementary Materials
Supplementary Materials and Methods
Supplementary Table 1: Top 25 enriched GO terms in macrophage cluster between sham and CLP
Supplementary Table 2: Fluorescent cell sorting antibodies
Supplementary Table 3: Primers used for RT-PCR analysis
Supplementary Figure S1 – Gating strategy used to analyze myeloid cells and lymphoid cells within the kidney. (a) Myeloid gating strategy. (b) Lymphocyte gating strategy starting from Live, single cell population in (a). Label on top of plot corresponds to gate from previous plot. Abbreviations: PMN-polymorphonuclear cell (neutrophil), cDC-conventional dendritic cell, MHC-major histocompatibility complex, iMono-inflammatory monocyte, rMono-resident monocyte, Mono-monocyte.
Supplementary Figure S2 – Characterization of macrophage populations and CX3CR1/CX3CL1 by scRNAseq. (a) UMAP plot showing macrophage subclusters. (b) Macrophage clusters based on experimental group. (c) Dot plot demonstrating expression of known myeloid cell genes within each cell cluster. Note that Macro1 cluster expresses high levels of C1qc, Cx3cr1, and Adgre1 (F480) indicating they are F4/80hi. Macro 2 expresses C1qc indicating it is macrophage population, but lower levels of Adgre1, Cx3cr1 indicating they are CD11bhi. Macro 3 expresses higher levels of Itgax (CD11c) along with Cd209 indicating they correspond to the convention dendritic cell 2 (cDC2) population. Macro 4 is small population that likely is transitioning population. (d) Dot plot demonstrating expression Cx3cr1 and Cx3cl1 in kidney cell clusters. Cx3cr1 is expressed at high levels only in Macro cluster, Cx3cl1 is expressed in multiple cell lineages.
Supplementary Figure S3 – F4/80 MWT and F4/80 MKO mice do not exhibit differences in myeloid populations in the kidney at baseline. Mice were administered diphtheria toxin for three successive days and then flow cytometric analysis was performed one day later on whole kidney digests based on gating strategy in Supplementary Figure 1. Graphs display line at mean, dots represent individual mice. Differences were not significant as determined by unpaired T test. Abbreviations: PMN-polymorphonuclear cell (neutrophil), cDC-conventional dendritic cell, iMono-inflammatory monocyte, rMono-resident monocyte, Mono-monocyte.
Supplementary Figure S4 – F4/80 MWT and F4/80 MKO mice do not exhibit differences in myeloid populations in the spleen at baseline. Mice were administered diphtheria toxin for three successive days and then flow cytometric analysis was performed one day later on splenocytes. (a) Pseudocolor dot plots demonstrating gating strategy to identify MHCII+ and monocyte populations in the spleen in Ly6G-/CD11b+ cells. (b-d) Percent (%) of cells parent plots above for (b) MHCII+, (c) Ly6C− monocytes and (d) Ly6C+ monocytes. (e-g) Cells/spleen for (e) MHCII+, (f) Ly6C− monocytes and (g) Ly6C+ monocytes. Graphs display line at mean, dots represent individual mice (n = 4/group). Differences were not significant as determined by unpaired T test.
Supplementary Figure S5 – Cortical myeloid cells express CD11c at high levels to drive diphtheria toxin receptor expression. Cortical and medullary portions from kidneys of F4/80 MKO mice were dissected and digested, and flow cytometry was performed on digests. (a,b) Histograms and (c,d) graphs display median fluorescence intensity (MFI) of (a,c) CX3CR1 and (b,d) CD11c in kidney myeloid cells (Live / CD45+ / CD11b+ or CD11c+) (n = 3/group with significance determined by unpaired t test (*p<0.05, **p<0.01). (e) Frozen sections were obtained from F4/80 MWT and F4/80 MKO mice and immunofluorescence confocal microscopy was performed. Representative images display expression of F4/80, diphtheria toxin receptor (DTR), and DAPI in cortex and inner medulla for both genotypes. Arrowheads point to co-localization of F4/80 and DTR in F4/80 MKO cortex, which was not visualized in inner medulla of F4/80 MKO mice or F4/80 MWT sections (scale bar – 10 μm).
Supplementary Figure S6: F4/80 MWT and F4/80 MKO kidney histology at baseline. Non-treated F4/80 MWT and F4/80 MKO kidneys were harvested. (a) Representative periodic-acid Schiff (PAS) stained kidney sections at (left) 20x (scale bar – 100 μm) with outlined box shown in (right) at 40x (scale bar – 50μm) (b) Injury scoring of kidney sections by blinded observer. Graph displays dots for individual mice (n = 3 for both groups) with line at median.
Supplementary Figure S7: F4/80 MKO express KIM-1 at higher levels than F4/80 MWT mice after CLP. F4/80 MWT and F4/80 MKO kidney were subjected to CLP, kidneys harvested at 24 hours, and frozen histologic kidney sections were obtained. (a) Representative immunofluorescence confocal images display expression of KIM-1 and DAPI (scale bar = 100μm) with (b) high magnification of outlined box (arrowheads-positive KIM-1 staining, scale bar = 50μm). (c) The amount of KIM-1 positive area (as % of DAPI) was quantified by blinded observer. Graph displays dots for individual mice (n = 3 for both groups) with significance determined by unpaired T test.
Supplemental Figure S8 – F4/80 MWT and F4/80 MKO mice do not exhibit differences in myeloid or lymphocyte populations in the kidney at 24 hours after CLP. Mice were administered diphtheria toxin for three successive days, then subjected to CLP, and kidneys were harvested at 24 hours. (a) Flow cytometric analysis was performed on whole kidney digests and immune population were parsed per Supplementary Figure S1. Graphs display cells/mg kidney with line at mean, dots represent individual mice. Differences were not significant as determined by unpaired T test. (PMN-polymorphonuclear cell (neutrophil), cDC-conventional dendritic cell, iMono-inflammatory monocyte, rMono-resident monocyte, Mono-monocyte). (b) Frozen kidney sections from F4/80 MWT and F4/80 MKO mice were stained for phalloidin to mark actin cytoskeleton, myeloperoxidase (MPO) to mark neutrophils, and DAPI to mark nuclei. Shown are representative cortical and medullary images for each genotype (scale bar = 50μm) with magnified region of outlined box shown in (c) (scale bar = 100μm, arrowheads = MPO staining). (d) The percent of MPO staining was quantified in multiple images of each region by blinded observer and then averaged for each mouse (represented by dots). Significance was determined by two-way ANOVA with post-hoc test (**p<0.01, ns-not significant).
Supplementary Figure S9: Importance of IL6-signaling during septic AKI. Ingenuity pathway analysis was performed on cell clusters to identify inflammatory pathways that were significantly modulated after CLP. Heatmap shows z-scores for indicated pathways for cell clusters with magnitude of z-score shown in legend (gray boxes indicate z-score could not be determined). Note induction of genes associated with IL6-signaling in all cell types compared to other inflammatory pathways.
Supplementary Figure S10: Validation of endothelial cell Il6 and macrophage Il1rn expression in external datasets. (a-c) scRNAseq data from external dataset examining effect on gene expression in kidney cells following lipopolysaccharide endotoxemia (GEO GSE151658). UMAP plots generated from gene expression tool on laboratory website (https://connect.rstudio.iu.edu/content/18/) for (a) cell cluster identity, (b) feature plot of Il6, (c) feature plot of Il1rn. Note expression of Il6 mainly in endothelial cells in (b) and Il1rn in macrophages in (c) as indicated by arrowhead. (d) scRNAseq data from kidneys of COVID-19 patients (https://singlecell.broadinstitute.org/single_cell/study/SCP868/hca-lungmap-covid-19-kidney?genes=IL6&tab=scatter#study-summary). UMAP plots generated from tool on website with left plot showing expression of IL6 (arrowhead) mainly in endothelial cells based on cell cluster identify shown in right plot.
Supplementary Figure S11 – Validation of fibroblast markers in sorted kidney fibroblasts. Kidneys were harvested and fluorescent cell sorting was performed. (a) Live, singlets were sorted based on CD31 and CD45 expression to exclude endothelial cells and leukocytes. (b) Of remaining double negative cells, cells were deemed to be fibroblasts based on expression of either CD90.2 or CD140b. Remaining cells were deemed kidney cells. (c-d) RT-PCR was performed on sorted populations and expression of (c) Cdh16 was used to validate kidney tubular cells, and (d) collagen 1a (Col1a) and (e) Vimentin (Vim) were used as fibroblast validation markers. Graphs show fold change compared to kidney cells. Each dot represents individual sample with line at mean.
Supplemental Figure S12 – IL1ra (Anakinra) therapy attenuates exaggerated septic AKI in vivo and endothelial Il6 expression in vitro. (a,b) F4/80 MWT and F4/80 MKO mice were subjected to CLP. Immediately after CLP, mice were injected with IL1ra (Anakinra) therapy (50 mg/kg). At 24 hours, mice were sacrificed. Serum (a) creatinine and (b) blood urea nitrogen (BUN) were measured. Means were not different between groups as determined by Mann-Whitney test. (c) A mouse endothelioma cell line, b.End3, were grown to confluence. Cell were treated with vehicle (−) or IL1β (100 ng/ml) in the presence of Anakinra. Shown in graph is fold change in Il6 mRNA from b.End3 cells. Significance determined by one-way ANOVA with Tukey’s multiple comparisons post-hoc test (*p<0.05, ****p<0.0001).
Supplemental Figure S13 – Depletion of F4/80 macrophages does not significantly modulate expression of Il1rn in epithelial cells or neutrophils after CLP. F4/80 MWT and F4/80 MKO mice were subjected to CLP. Kidneys were harvested at 24 hours and fluorescent cell sorting was performed. (a) Live, singlets were sorted based on CD31 and CD45 expression to exclude endothelial cells and leukocytes to obtain double negative Epithelial population. (b) Ly6G+/CD11b+ neutrophil (PMN) population from CD45+ cells in (a). (c-d) RT-PCR was performed on sorted populations and expression of Il1rn was measured in (c) epithelial cells and (d) PMN. Graphs show fold change compared to F4/80 MWT cells for each cell type. Each dot represents individual sample with line at mean. Statistical significance determined by unpaired T test (ns-not significant).
Supplemental Figure S14 – Anti-IL6 treatment decreases kidney IL6 levels following CLP. F4/80 MWT and F4/80 MKO mice were subjected to CLP with or without anti-IL6 given immediately after CLP surgery. First three columns/groups in graph show data from Figure 6e in primary manuscript for comparison of IL6 levels in presence or absence of anti-IL6 therapy. Data in last column/group shows data from mice treated with anti-IL6 therapy (n=10 for F4/80 MKO, n=12 for F4/80 MKO). Significance determined by two-way ANOVA with Sidak post-hoc test (**p<0.01, ****p<0.0001).
Supplementary References
Data Availability Statement
The data supporting the findings of this study are available in repository Github at https://github.com/jprivratsky/Mac-endo-septicAKI.git.