

Abstract
INTRODUCTION:
The mechanisms linking motor function to Alzheimer’s disease (AD) progression have not been well studied, despite evidence of AD pathology within motor brain regions. Thus, there is a need for new motor measure that are sensitive and specific to AD.
METHODS:
In a sample of 121 older adults (54 cognitive unimpaired [CU], 35 amnestic Mild Cognitive Impairment [aMCI], and 32 probable mild AD), intrasubject standard deviation (ISD) across six trials of a novel upper-extremity motor task was predicted with volumetric regional gray matter and neuropsychological scores using classification and regression tree (CART) analyses.
RESULTS:
Both gray matter and neuropsychological CART models indicated that motor task ISD (our measure of motor learning) was related to cortical regions and cognitive test scores associated with memory, executive function, and visuospatial skills. CART models also accurately distinguished motor task ISD of MCI and probable mild AD from CU.
DISCUSSION:
Variability in motor task performance across practice trials may be valuable for understanding preclinical and early-stage AD.
Keywords: motor learning, regression tree, gray matter, neuropsychological tests
1. Introduction
Just as global cognitive function is frequently reported as a single test score on a screening measure (e.g., the Montreal Cognitive Assessment), motor function is typically (but incompletely) characterized with measures that reflect mean or overall performance on a motor task. For example, grip strength is calculated as the average maximal force production across three trials (Mathiowetz, 1990; Mathiowetz et al., 1985), or several measures of gait speed and balance are combined to a single factor (Beeri et al., 2021; Buchman & Bennett, 2011; Buchman et al., 2016; Fleischman et al., 2015). As such, most clinical motor measures do not capture aspects of performance variability and motor learning across multiple trials, which may in part explain why motor measures have lacked sensitivity and/or specificity to early brain changes associated with Alzheimer’s disease (AD), despite AD pathology being present in motor regions of the brain (Orta-Salazar et al., 2019; Suvà et al., 1999). For example, grip strength and gait speed do not appear to related to amyloid (Adams et al., 2020; Jacob et al., 2020; Tomas et al., 2010) and are not specific to AD (i.e., low grip strength or gait speed are related to normal aging, as well as a number of other dementias and motor diagnoses like stroke). However, we have developed a novel motor task that involves several practice trials, and have shown that the learning of this task (measured as the variability in performance across six trials) is significantly associated with hippocampal volume, such that higher variability reflects more hippocampal atrophy (Schaefer, Malek-Ahmadi, et al., 2022). Compared to the average performance across trials, variability was also more sensitive to cognitive status (cognitively unimpaired [CU], Mild Cognitive Impairment [MCI], or AD). Additionally, the learning of the same motor task has been shown to improve the prediction of cortical amyloid (Schaefer, Duff, et al., 2022) and functional decline (Schaefer et al., 2020) in patients with MCI. These prior results support the premise that our novel motor task that considers within-subject variability as an indicator of learning may capture motor deficits that are relevant to AD, particularly in the preclinical stages. Such a measure will help clinicians better identify older adults who are biomarker-positive and are more likely to develop AD in the future, thereby helping to connect patients with treatment options, ongoing clinical trials, or other resources. This would also further advance AD research by providing a way to monitor motor changes in advance of, or concurrent with, cognitive changes and disease pathology.
Volumetric magnetic resonance imaging data can help us better understand the link between our motor task and the brain changes associated with AD. Historically, the most common neuroimaging approaches for studying motor function focus on regions of interest (ROIs) that are analyzed for p-value-based statistical associations with a given motor task outcome (Gryga et al., 2012; Kodama et al., 2018; Steele et al., 2012). However, these approaches do not necessarily consider cognitive processes that are often recruited during the learning and adaptation of functional movement in daily life that in turn dictate whether a motor task (such as the one proposed here) becomes less variable with practice (i.e., learned) (Ranganathan et al., 2020; Sternad, 2018). A more analytic approach that conceptualizes motor learning in terms of cognitive mechanisms (e.g., executive function, memory, visuospatial abilities) may provide additional context to previous studies that have identified ROIs and white matter pathways involved in motor function.
While there are numerous network-based analytic approaches that can be employed to address this question, classification and regression tree (CART) analysis is among the most rational and intuitive while yielding results that are easy to interpret (Krzywinski & Altman, 2017). CART analysis has been used in a number of disciplines and therapeutic areas previously (e.g, dermatology, cardiology, oncology) (Barlin et al., 2013; Cheraghlou et al., 2021; Ghiasi et al., 2020). It is rarely used, however, in studies of aging, neurodegenerative disease, and cognition even though it has tremendous utility for studies of neuroimaging and cognition that analyze a large number of independent variables (≥20) to identify those that best characterize the outcome of interest.
CART analysis is one of several machine learning (ML) approaches that can be used to predict a given dependent variable. The random forest algorithm is also a popular approach that is used in biomedical research (Huang et al., 2022; Lathouwers et al., 2022; Shin et al., 2022), and utilizes several different regression or classification trees to arrive at a final set of predictor variables that are evaluated based on their relative importance in the model. An important distinction between CART and random forest approaches is that the former provides a more intuitive visually-based output for interpretation, while the latter relies primarily on numeric quantification of variable importance. In cases where clinical interpretations are emphasized, CART analyses may be preferred because the graphical representations they can produce may allow for easier conceptual understanding of how a group of predictor variables relate to a dependent variable.
Given these advantages of CART, the aim of this study was to use CART analysis to characterize the association of regional gray matter volume measures and neuropsychological test scores with the learning of our novel motor task (measured as the intrasubject standard deviation across six practice trials). Based on our previous studies (Hooyman et al., 2022; Lingo VanGilder et al., 2018; Lingo VanGilder et al., 2021; Schaefer & Duff, 2017; Wang et al., 2020), we hypothesize that cortical regions and neuropsychological test scores associated with visuospatial and executive function will be the best predictors of motor learning. The resulting models may provide insight into possible neural and cognitive mechanisms that underlie AD-related changes in motor function in the preclinical phase.
2. Materials and Methods
2.1. Participants
One hundred twenty-one older adults were recruited from a cognitive disorders clinic or through the community between 2018 and 2022 to participate in a study of brain imaging and neuropsychological testing across the AD spectrum. Mean age was 74.2±5.7 (range=65–91) years and mean education was 16.1±2.4 (range=12–20) years. Most were Caucasian (98.3%) and 58.7% were female. Mean premorbid intellectual functioning (Reading subtest of the Wide Range Achievement Test – 4) (WRAT-4) (Wilkinson & Robertson, 2006) was in the normal range (M=109.7±8.5), and self-rating of depression symptoms were minimal on the 15-item Geriatric Depression Scale (M=1.2±SD=1.2) (Yesavage et al., 1982). Neuroimaging data were not available for 17 participants because there was too much artifact or brain atrophy for processing with FreeSurfer; thus, CART analyses with neuroimaging data only included 104 participants. For the analyses with neuropsychological data, 120 subjects were used as one individual did not complete all practice trials of the motor task, preventing the ability to derive their intrasubject standard deviation accordingly (see 2.3).
Participants were identified in the cognitive disorders’ clinic via a medical records review, especially focused on any prior neuropsychological testing, to see they would likely fit into the ADNI criteria for Mild Cognitive Impairment (MCI) or probable mild AD. Results of a neurological exam and brain imaging were also considered. Community presentations on memory and aging were conducted to solicit research volunteers, which were more likely to be cognitively unimpaired (CU). However, ~15% of amnestic MCI cases were identified in the community. Confirmation of group assignment was made with the ADNI (ADNI2, 2020) classification battery, which included the Mini Mental Status Examination (Folstein et al., 1975) (CU and MCI = 24–30; AD = 20 26), the Clinical Dementia Rating Scale (Morris, 1993) (CU = 0; MCI = 0.5; AD = 0.5–1), and the Wechsler Memory Scale – Revised (Wechsler, 1987) Logical Memory II (CU: ≥9 if education ≥16 years, ≥5 if education 8–15 years, ≥3 if education 0–7 years; MCI and AD: ≤8 if education ≥ 16 years, ≤4 if education 8–15 years, ≤2 if education 0–7 years). Participants were classified by one of the authors, a board-certified neuropsychologist (KD).
Participants were included if they were 65 years of age or older and had a knowledgeable informant who would comment on their cognition and daily functioning. Participants were excluded for medical comorbidities likely to affect cognition (e.g., neurological conditions, current severe depression, substance abuse, major psychiatric conditions), inability to complete MRI, inability to complete cognitive assessments, and being enrolled in an anti-amyloid clinical drug trial. Additional exclusion criteria included a score of >5 on the 15-item Geriatric Depression Scale, a Clinical Dementia Rating score of ≥2, or a Mini Mental State Examination score of <20. Sixty-seven individuals were excluded for a variety of reasons (e.g., neurological condition = 10, unable to complete MRI = 10, did not fit into any group = 9, clinical results did not indicate AD = 9, medical condition = 8, elevated Geriatric Depression Scale = 7, psychiatric condition = 3, Mini Mental State Examination score of <20 = 3, Clinical Dementia Rating score of ≥2 = 3, under 65 years of age = 2, allergic reaction that might interfere with imaging = 2, no study partner = 1). Reported use of some psychotropic medication at the time of participation in this study was 22% among the cognitively unimpaired group, 51% among the MCI group, and 56% among the probable mild AD group.
2.2. Procedure
Procedures were approved by the local Institutional Review Board. Following informed consent/assent, participants underwent neuropsychological testing and the timed motor task at a baseline visit. All cognitively unimpaired participants and those with MCI provided their own consent for the current study. All participants with probable mild AD provided assent, with a collateral person (e.g., spouse, adult child) providing consent. Participants returned an average of 10.7 days (SD=19.2) later to receive an MRI of the brain.
2.3. Timed Motor Task
Visual demonstration of the motor task can be viewed on Open Science Framework (https://osf.io/phs57/wiki/Functional_reaching_task/), and its methods have been published previously (Schaefer, Malek-Ahmadi, et al., 2022). This task has also been validated against clinical activities of daily living measures in amnestic MCI patients (Schaefer et al., 2020). To summarize, participants use a standard plastic spoon to acquire two raw kidney beans at a time from a central cup (all cups 9.5cm diameter and 5.8cm deep) to one of three distal cups arranged at a radius of 16 cm at −40°, 0°, and 40° relative to the central cup. Participants used their nondominant hand (to avoid ceiling effects), and started by moving first to the cup ipsilateral (same side) of the hand used, then returned to the central cup to acquire two more beans at a time to transport to the middle cup, then the contralateral cup, and then repeated this sequence four more times for a total of 15 out-and-back movements. Task performance was recorded as trial time (in seconds, via stopwatch); lower values indicate better performance. Participants completed 6 trials of the task. This amount of practice was based on a) previous work demonstrating that cognitively unimpaired older adults typically reach stable performance after 5 trials (Lingo VanGilder et al., 2018; Schaefer & Duff, 2015), and b) clinical pragmatism to minimize participant burden (~5–7 minutes to administer). Intra-subject standard deviation (ISD) in performance across the practice trials was used as a measure of motor function, as we have previously shown that this measure differs significantly between CU, MCI, and AD subjects and is significantly associated with hippocampal volume, more so than average performance or change in performance from the beginning to end of practice (Schaefer, Malek-Ahmadi, et al., 2022).
2.4. MRI Procedure
Acquisition of imaging data was performed at the Utah Center for Advanced Imaging Research (UCAIR) using a 3.0-T Siemens Prisma scanner with a 64-channel head coil. Structural data was acquired using an MP2RAGE pulse sequence (TR=5000, TE=2.93, acquired sagittally, resolution=1 × 1 × 1 mm) to obtain high quality whole-brain 1mm isotropic T1w images with improved signal homogeneity in ~7 minutes. Structural MRI scans were processed using FreeSurfer image analysis suite v6.0 (http://surfer.nmr.mgh.harvard.edu/). Technical details are described previously (Fischl & Dale, 2000; Fischl et al., 2002; Fischl et al., 2004). Gray and white matter region volumes were adjusted by estimated total intracranial volume (eTIV, cm3) to account for differences in head size, and then summed to yield bilateral volumes for each region.
2.5. Neuropsychological Tests
Raw, unadjusted subtest scores from the Repeatable Battery for Assessment of Neuropsychological Status (RBANS) were used, as well as the following tests: Trail Making Test Parts A and B (Trails A and Trails B), Symbol Digit Modalities Test (SDMT), Total and Delayed Recall trials of the Hopkins Verbal Learning Test – Revised (HVLT-R), Total and Delayed Recall trials of the Brief Visuospatial Memory Test – Revised (BVMT-R), and Immediate and Delayed Recall trials of Story A from the Logical Memory subtest of the Wechsler Memory Scale - Revised.
2.6. Statistical Analysis
CART analyses were used to derive constellations of volumetric gray matter and neuropsychological variables that best predicted age-adjusted motor task ISD. Regression tree analyses are advantageous by allowing for the empirical assessment of a large number of predictor variables (≥20) to arrive at a final predictive model. In addition, regression tree analyses do not impose any distributional assumptions on the dependent variable (Henrard et al., 2015), eliminating the need for transformations to be performed and allowing for the data to be interpreted on its original scale of measurement.
In general, the empirical assessment employed by regression trees begins with an evaluation of each predictor variable’s ability to optimally split the sample at a particular value. Each split results in two branches with nodes representing the subgroups created by a split. The splitting process is continued iteratively for each node until the sample can no longer be optimally divided by any of the predictor variables. The resulting plot contains nodes and branches that show which independent variables and cutoff values were used at a particular split. Within each node, the number of participants included from the split as well as the predicted value for the dependent variable are also shown. After all variable splitting is completed, the remaining nodes are referred to as the terminal nodes, which contain the final predicted values for the dependent variable. For these analyses, we opted to use an agnostic unsupervised approach when building the CART models where no a priori associations were specified among the variables that were to be included the models. All of the available neuropsychological and volumetric MRI measures were entered into their respective models (i.e., one model for neuropsychological measures, and one model for volumetric MRI measures) in order to arrive at an empirically-based subset of predictor variables that could be used to conceptualize the cognitive and neural mechanisms associated with motor task ISD.
For this study, two separate regression tree models were used to predict motor task ISD, one with volumetric MRI data and one with neuropsychological variables. The primary set of CART models included CU, MCI, and probable mild AD subjects while a second set used only CU and MCI subjects. For each regression tree, the minimum terminal node size was set to seven in order to optimize the estimated ISD. Thirty cross-validations were performed on each model in order to arrive at an optimal complexity parameter that would represent the most reliable model. The mean squared error (MSE) values for each terminal node were used to provide an estimate of overall model fit. While there is no defined MSE cutoff for interpreting model fit, the general convention is that MSE values approaching zero indicate better model fit (Boulesteix et al., 2015). All regression tree analyses were carried out using R 4.0.3 with the ‘rpart 4.1.16’ and ‘rattle 5.5.1’ packages. The ‘rattle’ package was used to generate regression tree plots from the models; however, due to issues with image quality the plots were replicated using Microsoft Publisher. For comparative purposes, we also carried out random forest regression models for the neuropsychological and volumetric measures using the ‘randomForest’ function in ‘randomForest 4.7–1.1’ package. R code for the regression tree and random forest analyses with comments are provided as a Supplemental File.
Prior to running the regression tree models, age-adjusted ISD values were derived from a generalized linear model that used the gamma distribution with a logarithmic link, as the raw ISD values were significantly right-skewed. Spearman correlation was used to assess the degree of association between the neuropsychological variables and age-adjusted ISD prior to running the CART models. Spearman correlation was also used to determine whether age and years of education correlated with age-adjusted motor task ISD. The Mann-Whitney test was used to test for sex differences in motor task ISD.
Receiver operator characteristic (ROC) analyses using the raw and age-adjusted ISD values from each of the four models were also used to determine how well the MCI and probable mild AD cases could be differentiated from the CU cases. To do so, four ROC analyses were carried out: CU vs. MCI+AD; CU vs. MCI, CU vs. AD, and MCI vs. AD. ROC analyses were performed using MedCalc 20.109. The diagnostic accuracy of the derived area under the curve (AUC) values were interpreted using the following scheme: 0.70 – 0.79 = acceptable, 0.80 – 0.89 = excellent, ≥0.90 = outstanding (Mandrekar, 2010).
3. Results
Demographic and neuropsychological characteristics of the CU, MCI, and AD groups are shown in Table 1. The AD group was significantly older than both the CU and MCI groups (p<0.001) and educational attainment for the CU group was significantly higher than that of the MCI group (p=0.005). There were no significant differences in sex frequency between the groups (p=0.93). Neuropsychological test scores between the groups were in the expected direction for all tests, with the CU group having better scores than both MCI and AD groups while the MCI group scores were intermediate to the CU and AD groups. A weak correlation between age and motor task ISD was noted (r=0.21, p=0.03), while ISD did not correlate with years of education (r=−0.01, p=0.91) and there was no difference on the ISD between males and females (p=0.21). Correlations between neuropsychological variables and age-adjusted ISD are shown in Table 2, where all tests were significant except for the Line Orientation, Digit Span, and Picture Naming subtests of the RBANS. The correlations that were statistically significant ranged in value from −0.41 to 0.24.
Table 1.
Demographic, neuropsychological, and motor task characteristics stratified by clinical status.
| CU n = 54 |
MCI n = 35 |
AD n = 32 |
p-value | |
|---|---|---|---|---|
| Age | 72.48±4.79 | 73.43±5.14 | 77.75±6.22 | <0.001‡ |
| Education (years) | 16.74±2.08 | 15.11±2.64 | 16.19±2.29 | 0.005⁑ |
| Sex (M/F) | 21/33 | 15/20 | 14/18 | |
| MMSE | 29.43±0.82 | 26.51±1.90 | 23.03±2.68 | <0.001† |
| RBANS List Learning | 28.50±4.79 | 20.74±5.38 | 16.66±3.28 | <0.001† |
| RBANS Story Memory | 18.69±3.16 | 11.89±3.76 | 8.34±3.82 | <0.001† |
| RBANS Figure Copy | 18.28±1.69 | 17.34±1.76 | 16.00±2.65 | <0.001† |
| RBANS Line Orientation | 17.63±2.27 | 15.74±3.18 | 15.06±4.71 | <0.001* |
| RBANS Coding | 46.78±8.39 | 39.54±8.90 | 30.47±11.54 | <0.001† |
| RBANS Digit Span | 10.74±2.09 | 9.89±2.36 | 9.03±2.33 | <0.001⸸ |
| RBANS Semantic Fluency | 21.69±5.37 | 15.91±4.60 | 11.25±3.72 | <0.001† |
| RBANS Picture Naming | 9.74±0.52 | 9.57±0.70 | 9.38±0.91 | 0.12 |
| RBANS List Recall | 6.07±2.91 | 1.40±2.00 | 0.59±1.78 | <0.001† |
| RBANS Story Recall | 10.32±1.63 | 3.43±3.00 | 1.50±1.30 | <0.001† |
| RBANS Figure Recall | 14.48±3.37 | 5.23±5.81 | 1.63±2.28 | <0.001† |
| HVLT-R Total Recall | 26.17±4.66 | 16.71±5.84 | 11.22±4.68 | <0.001† |
| HVLT-R Delayed Recall | 9.46±2.01 | 2.57±2.87 | 0.56±1.70 | <0.001† |
| BVMT-R Total Recall | 24.44±5.15 | 11.54±6.28 | 6.47±2.93 | <0.001† |
| BVMT-R Delayed Recall | 9.63±1.84 | 4.00±2.95 | 0.88±0.91 | <0.001† |
| Trails A | 31.11±8.05 | 38.20±19.98 | 63.38±40.05 | <0.001§ |
| Trails B | 76.96±32.14 | 121.29±62.34 | 206.81±85.85 | <0.001§ |
| Symbol Digit Modalities Test | 46.02±7.79 | 36.71±8.69 | 27.47±11.29 | <0.001† |
| Motor Task ISD | 8.73±6.92 | 10.60±3.89 | 12.77±6.79 | <0.001ȹ |
mean±standard deviation;
CU>MCI>AD;
CU, MCI<AD;
MCI<CU, AD;
CU>MCI, AD;
CU>AD;
CU<MCI<AD;
CU>MCI, AD
Table 2.
Correlations Between Age-Adjusted Motor Task ISD and Raw Neuropsychological Test Scores.
| Neuropsychological Test | Correlation with Age-Adjusted ISD |
|---|---|
| MMSE | r = −0.31, p<0.001 |
| RBANS List Learning | r = −0.37, p<0.001 |
| RBANS Story Memory | r = −0.29, p = 0.001 |
| RBANS Figure Copy | r = −0.41, p<0.001 |
| RBANS Line Orientation | r = −0.13, p = 0.15 |
| RBANS Coding | r = −0.26, p = 0.005 |
| RBANS Digit Span | r = −0.08, p = 0.39 |
| RBANS Semantic Fluency | r = −0.41, p<0.001 |
| RBANS Picture Naming | r = −0.05, p = 0.58 |
| RBANS List Recall | r = −0.34, p<0.001 |
| RBANS Story Recall | r = −0.29, p = 0.001 |
| RBANS Figure Recall | r = −0.33, p<0.001 |
| HVLT-R Total Recall | r = −0.33, p<0.001 |
| HVLT-R Delayed Recall | r = −0.30, p<0.001 |
| BVMT-R Total Recall | r = −0.35, p<0.001 |
| BVMT-R Delayed Recall | r = −0.35, p<0.001 |
| Trails A | r = 0.24, p = 0.008 |
| Trails B | r = 0.24, p = 0.008 |
| Symbol Digit Modalities Test | r = −0.36, p<0.001 |
The regression tree plot for motor task ISD and gray matter regions is shown in Figure 1. For this analysis, volumetric measures of temporal (inferior temporal cortex, hippocampus, fusiform gyrus), parietal (midcentral lobule, supramarginal gyrus), frontal (precuneus), and occipital (cuneus) regions best predicted motor task ISD. Examination of the terminal nodes found a pattern of increasing motor task ISD going from left to right where higher volume in each of the regions corresponded with better motor learning (lower ISD). The gray matter regions in this model suggest that motor task variability is associated with memory (inferior temporal cortex, hippocampus), visual processing (cuneus), and executive function (precuneus) systems.
Figure 1.
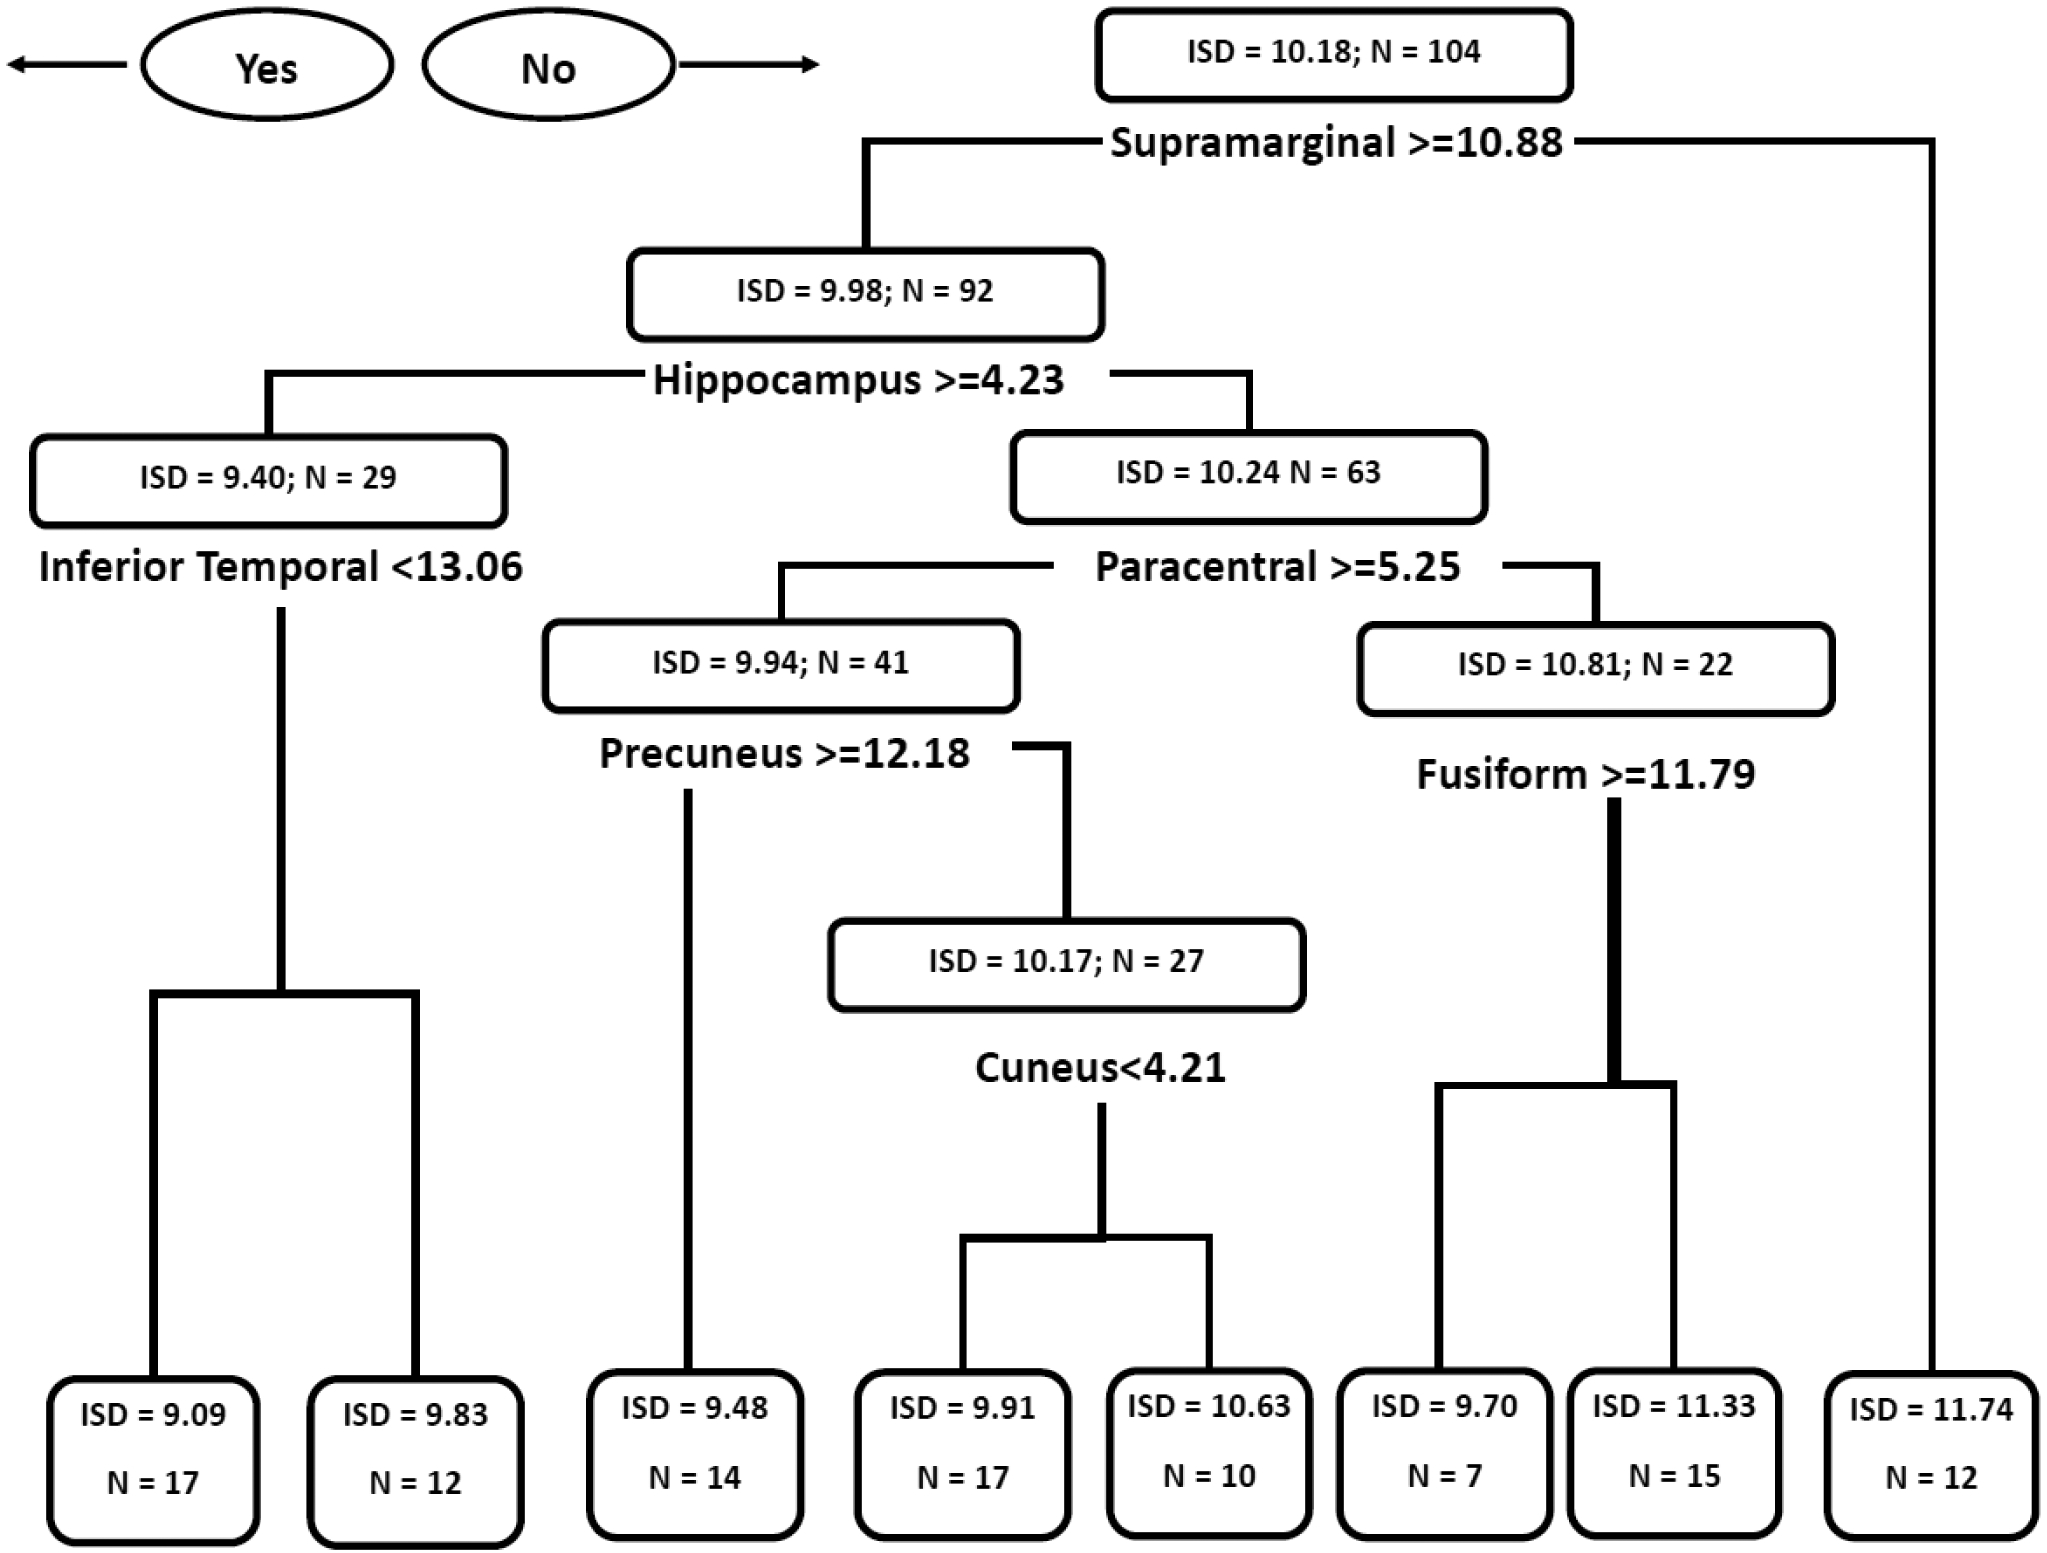
Regression Tree Diagram for Gray Matter Volumetric Predictors of Age-Adjusted Motor Task Intrasubject Standard Deviation.
Figure 2 shows the regression tree model for neuropsychological predictors of age-adjusted motor task ISD. This model included tests of incidental learning (RBANS List Learning), executive function (RBANS Semantic Fluency), processing speed (Trails A), and visuospatial function (RBANS Line Orientation). Of note, RBANS List Learning and Trails A were both used twice in the model, indicating their relative importance in predicting ISD. Overall, this model indicates that cognitive process associated with incidental learning, processing speed, executive function, and visuospatial function are associated with learning the motor task.
Figure 2.
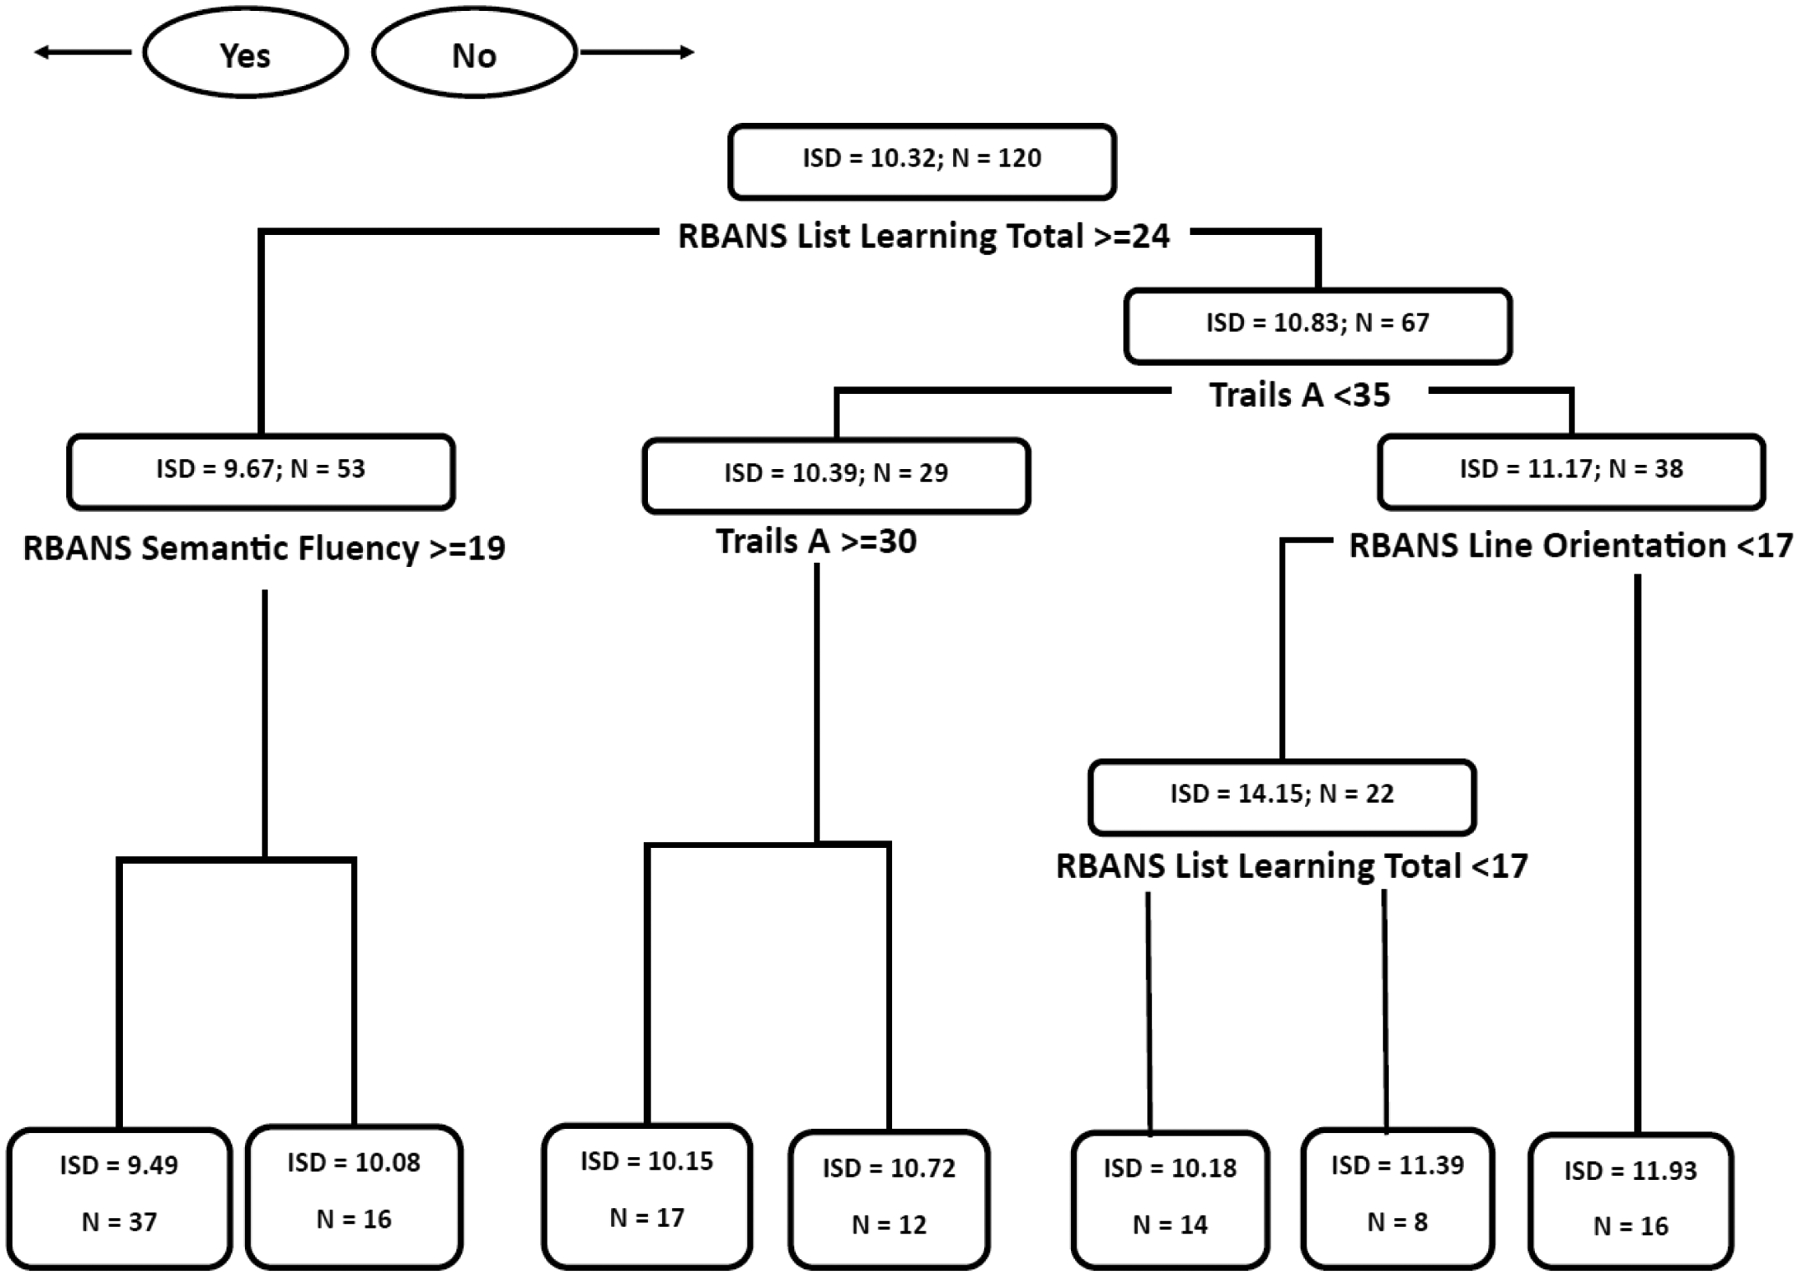
Regression Tree Diagram for Neuropsychological Predictors of Age-Adjusted Motor Task Intrasubject Standard Deviation.
Regression trees for the CU and MCI volumetric and neuropsychological analyses are shown in Supplement Figures 1 and 2, respectively. The volumetric CART for CU and MCI included some of the same regions from the primary analysis (supramarginal and precuneus), but also included additional temporal (banks of the superior temporal sulcus, transverse temporal) and frontal (posterior cingulate, superior frontal, pars opercularis) regions as well as the cuneus. The neuropsychological CART for CU and MCI also shared several tests with that of the primary analysis (RBANS List Learning Total, RBANS Semantic Fluency, Trails A), but also included additional tests from memory (RBANS Figure Recall) and executive (Trails B, RBANS Coding) domains.
A summary of the MSE values for the terminal nodes in each CART model is shown in Supplementary Table 1. For both volumetric models, the terminal node for the supramarginal gyrus was the only region to have a MSE value larger than one while all other terminal nodes had MSE values less than 0.69. The neuropsychological models each had two terminal nodes with MSE values greater than one with all others ranging from 0.32 to 0.96. These findings indicate the CART models provided stable estimates of the ISD.
The random forest model for volumetric gray matter regions yielded similar results to that of the CART model, where the supramarginal gyrus and hippocampus had the highest importance values (15.87 and 10.32, respectively) followed by the middle temporal gyrus (7.76) and the fusiform gyrus (7.14). The precuneus, inferior parietal, inferior temporal, and paracentral regions also yielded importance values greater than five while the cuneus’ importance value was relatively low (2.52). The random forest model for the neuropsychological variables also closely paralleled the CART model results with RBANS List Learning (20.91) and RBANS Semantic Fluency (15.64) having the highest importance values followed by the Symbol Digit Modalities Test (13.59), Hopkins Verbal Learning Test Total Recall (12.34), and Trails A (11.22). The RBANS Line Orientation subtest had an importance value 8.02 while the RBANS Figure Copy (8.62) and RBANS Coding (8.33) also figured prominently in the model. Overall, the CART and random forest models were congruent in the predictor variables used, indicating that incidental learning, processing speed, executive function, and visuospatial function are cognitive mechanisms that may underlie the learning of the motor task.
Results of the ROC analyses for raw and age-adjusted motor task ISD on clinical status (CU, MCI, and probable mild AD) are shown in Table 3. The raw ISD values showed acceptable diagnostic accuracy MCI and AD both separately and combined with good sensitivity (89%) for MCI. When age-adjusted ISD values were used, only the CU vs AD analysis yielded acceptable diagnostic accuracy where there was an incremental increase in the AUC value between raw ISD (0.72) and age-adjusted ISD (0.77).
Table 3.
ROC analyses for raw (A) and age-adjusted (B) ISD values and clinical status.
| A. | |||
|---|---|---|---|
| AUC (95% CI) |
Sensitivity (95% CI) |
Specificity (95% CI) |
|
| CU vs MCI+AD | 0.71 (0.62, 0.79) | 70% (57%, 80%) | 68% (54%, 81%) |
| CU vs MCI | 0.71 (0.60, 0.80) | 89% (73%, 97%) | 52% (38%, 66%) |
| CU vs AD | 0.72 (0.61, 0.81) | 71% (52%, 86%) | 69% (54%, 81%) |
| MCI vs AD | 0.57 (0.44, 0.69) | 55% (36%, 73%) | 69% (51%, 83%) |
| B. | |||
| AUC (95% CI) |
Sensitivity (95% CI) |
Specificity (95% CI) |
|
| CU vs MCI+AD | 0.66 (0.57, 0.74) | 53% (40%, 65%) | 76% (62%, 87%) |
| CU vs MCI | 0.56 (0.45, 0.66) | 34% (19%, 52%) | 80% (67%, 89%) |
| CU vs AD | 0.77 (0.67, 0.86) | 71% (52%, 86%) | 76% (62%, 87%) |
| MCI vs AD | 0.72 (0.60, 0.82) | 52% (33%, 70%) | 86% (70%, 95%) |
4. Discussion
This study characterized volumetric and cognitive predictors of motor learning (measured as intrasubject standard deviation) using CART analyses, identifying constellations of volumetric gray matter measures and neuropsychological test scores that are associated with participants’ variability across six trials of a functional upper extremity motor task. Using regression tree models from CART analysis in this manner is novel and allows for straight-forward interpretations of which neuroimaging and neuropsychological variables were associated with motor task variability. As such, these models provide new insight into the neural and cognitive mechanisms that may underlie motor task variability. Memory, visuospatial, and executive function processes appeared most prominently in the gray matter and neuropsychological test models, as evidenced by the specific regions and tests that were included in the respective models. Of note, a neuropsychological test thats involve learning (RBANS List Learning) was prominent in the model predicting motor task ISD. Other neuropsychological tests associated with motor task ISD were Trails A, RBANS Semantic Fluency, and RBANS Coding, which suggest the involvement of executive and visuospatial functioning in the learning of the motor task (motor task ISD).
The gray matter regions that were included in the model suggest involvement of the supramarginal gyrus, hippocampus, paracentral gyrus, inferior temporal, precuneus, cuneus, and fusiform gyrus in motor task ISD. However, the extent to which these regions mediate motor task variability cannot be deduced at this time, as this study used volumetric MRI measures rather than functional MRI. Although direct involvement of these regions in motor task variability is speculative, these same regions have been implicated in relation to other motor tasks (Berghuis et al., 2019; Danielmeier et al., 2011). Studies using functional MRI measures, such as diffusion tensor imaging (DTI), can provide more direct characterization of specific regions and fiber tracts that underlie the improvements in motor task performance (or lack thereof), with results consistent with the visuospatial and memory findings of this study (Regan et al., 2021). To date, most DTI analyses of motor function have used average measures of performance (Holtrop et al., 2014; Kim et al., 2016; Michels et al., 2018) rather than motor task learning/acquisition over numerous practice trials. This distinction is important as motor measures that consider average or single-trial performance (e.g., grip strength, gait speed) may not accurately differentiate the prodromal stages of pathological cognitive decline associated with AD from other non-cognitive diagnoses (Chen, 2015; Ishihara et al., 2020; Leong et al., 2015), or from normal aging (König et al., 2017).
The CART models that included only CU and MCI subjects included regions and tests that appeared in the first models (Supramarginal, Precuneus, RBANS List Learning, RBANS Semantic Fluency, Trails A), however both the volumetric and neuropsychological models for CU+MCI had greater emphasis on frontal regions and executive function measures (Superior Frontal, Posterior Cingulate, Pars Opercularis, RBANS Coding, Trails B). This is supported by other findings which report that declines in executive function are often observed in those with MCI (Malek-Ahmadi, Raj, et al., 2011; Malek-Ahmadi, Small, et al., 2011).
The regression tree models complement each other well in terms of the cognitive domains/mechanisms that are represented. The neuropsychological test model provides a performance-based interpretation that aligns with regions included in the gray matter regression tree model. Taken together, the models indicate that episodic memory, executive functioning, and visuospatial skills (and the brain regions that are commonly associated with these cognitive processes) are key components of variability (and learning) of the motor task, consistent with previous work (Lingo VanGilder et al., 2018; Lingo VanGilder et al., 2021; Schaefer & Duff, 2017). Since these cognitive deficits often occur earliest in the clinical trajectory of AD (Caselli et al., 2020), these findings show that motor task variability may tap into the same neural mechanisms that are susceptible to AD-related degradation.
The ROC analyses for age-adjusted ISD values in their ability accurately differentiate the groups, where the AUC and sensitivity values confirmed that motor task ISD can accurately identify MCI. This result represents a major advantage relative to other motor measures (namely, grip strength and gait speed) that are sensitive to MCI or AD but not specific, which has limited their utility in clinical settings and as research targets. As such, we have previously advocated for the use of the motor task paradigm used in this study as a supplemental screening measure to enrich samples for AD prevention trials (Schaefer, Duff, et al., 2022), which is further supported by the results presented here. As noted above, administering six trials of the motor task takes ~5–7 minutes and requires no additional set-up time; the task also has no technology requirements, making it as easy to administer as grip strength or gait speed tests. Although the use of between-trial variability (ISD) as a measure of motor task acquisition is a novel motor task metric, the diagnostic accuracy data for the ISD provide compelling support for its wider use in preclinical AD studies.
We acknowledge several limitations to this study. First is the lack of racial/ethnic diversity among the cohort from which these data were derived, as the majority of participants were White. This limits the generalizability of the current findings to more diverse populations that are at higher risk for developing AD. Additionally, only a single neuropsychological test used in the current study is a classic measure of executive functioning (Trails B). Future studies will examine other executive skills beyond set shifting (e.g., reasoning, planning, problem solving). Third, the volumetric MRI measurements were limited to gray matter regions. Since MRI studies have shown that white matter tracts and regions play integral roles in motor function (Koppelmans et al., 2015; Oschwald et al., 2021; Riaz et al., 2021), using only gray matter regions may be a somewhat limited approach to determining the brain-behavior relationships in this study.
There are several future directions informed by this study. Although the use of volumetric MRI data does not allow for functional interpretations of these findings, these data now provide a foundation for developing a priori hypotheses about which brain regions are involved in motor learning and are also affected in the early stages of AD, which could be directly tested via ROI-based functional MRI studies of motor skill acquisition in the future. Second, future studies (using CART) will identify whether motor task intrasubject variability is predicted by structural connectivity (diffusion tensor imaging), to further understand the relationship between motor changes and AD. In short, our findings support using the learning of our motor task as a potential clinical measure to screen for preclinical AD, or as an outcome measure for future clinical trials of MCI or dementia.
Supplementary Material
HIGHLIGHTS.
Our motor learning test may help screen for Alzheimer’s Disease (AD).
Data justify studying variability of a motor assessment across multiple attempts.
Classification and regression tree (CART) analyses are valuable for aging research.
Future research will validate motor task variability against AD biomarkers.
Funding:
This work was supported by the National Institutes of Health [grant number R01AG055428].
Footnotes
Publisher's Disclaimer: This is a PDF file of an unedited manuscript that has been accepted for publication. As a service to our customers we are providing this early version of the manuscript. The manuscript will undergo copyediting, typesetting, and review of the resulting proof before it is published in its final form. Please note that during the production process errors may be discovered which could affect the content, and all legal disclaimers that apply to the journal pertain.
Conflicts of interest statement: Sydney Schaefer and Kevin Duff are members of Neurosessments LLC. All other authors declare no conflicts of interest.
Author CRediT statement
Michael Malek-Ahmadi: Conceptualization, Methodology, Software, Formal analyses, Writing – Original Draft, Writing – Review & Editing. Kevin Duff: Funding acquisition, Formal analysis, Investigation, Resources, Data curation, Writing- Original draft, Project administration. Kewei Chen: Validation, Writing – Original Draft. Yi Su: Validation, Writing – Original Draft. Jace King: Software, Validation, Formal analyses: Vincent Koppelmans: Validation, Writing – Original Draft. Sydney Schaefer: Methodology, Validation, Investigation, Resources, Writing – Original Draft, Writing – Review & Editing, Supervision.
References
- Adams D, Ando Y, Beirao JM, Coelho T, Gertz MA, Gillmore JD, … Merlini G (2020). Expert consensus recommendations to improve diagnosis of ATTR amyloidosis with polyneuropathy. J Neurol. 10.1007/s00415-019-09688-0 [DOI] [PMC free article] [PubMed] [Google Scholar]
- ADNI2. (2020). Alzheimer’s Disease Neuroimaging Initiative: ADNI2 Procedures Manual. Retrieved May 21 from https://adni.loni.usc.edu/wp-content/uploads/2008/07/adni2-procedures-manual.pdf
- Barlin JN, Zhou Q, St Clair CM, Iasonos A, Soslow RA, Alektiar KM, … Abu-Rustum NR (2013). Classification and regression tree (CART) analysis of endometrial carcinoma: Seeing the forest for the trees. Gynecol Oncol, 130(3), 452–456. 10.1016/j.ygyno.2013.06.009 [DOI] [PMC free article] [PubMed] [Google Scholar]
- Beeri MS, Leurgans SE, Bennett DA, Barnes LL, & Buchman AS (2021). Diverse Motor Performances Are Related to Incident Cognitive Impairment in Community-Dwelling Older Adults. Front Aging Neurosci, 13, 717139. 10.3389/fnagi.2021.717139 [DOI] [PMC free article] [PubMed] [Google Scholar]
- Berghuis KMM, Fagioli S, Maurits NM, Zijdewind I, Marsman JBC, Hortobagyi T, … Bozzali M (2019). Age-related changes in brain deactivation but not in activation after motor learning. Neuroimage, 186, 358–368. 10.1016/j.neuroimage.2018.11.010 [DOI] [PubMed] [Google Scholar]
- Boulesteix A-L, Hable R, Lauer S, & Eugster MJA (2015). A Statistical Framework for Hypothesis Testing in Real Data Comparison Studies. The American Statistician, 69(3), 201–212. 10.1080/00031305.2015.1005128 [DOI] [Google Scholar]
- Buchman AS, & Bennett DA (2011). Loss of motor function in preclinical Alzheimer’s disease. Expert Rev Neurother, 11(5), 665–676. 10.1586/ern.11.57 [DOI] [PMC free article] [PubMed] [Google Scholar]
- Buchman AS, Wilson RS, Yu L, Boyle PA, Bennett DA, & Barnes LL (2016). Motor Function Is Associated With Incident Disability in Older African Americans. J Gerontol A Biol Sci Med Sci, 71(5), 696–702. 10.1093/gerona/glv186 [DOI] [PMC free article] [PubMed] [Google Scholar]
- Caselli RJ, Langlais BT, Dueck AC, Chen Y, Su Y, Locke DEC, … Reiman EM (2020). Neuropsychological decline up to 20 years before incident mild cognitive impairment. Alzheimers Dement, 16(3), 512–523. 10.1016/j.jalz.2019.09.085 [DOI] [PMC free article] [PubMed] [Google Scholar]
- Chen MA (2015). Frailty and cardiovascular disease: potential role of gait speed in surgical risk stratification in older adults. J Geriatr Cardiol, 12(1), 44–56. 10.11909/j.issn.1671-5411.2015.01.006 [DOI] [PMC free article] [PubMed] [Google Scholar]
- Cheraghlou S, Sadda P, Agogo GO, & Girardi M (2021). A machine-learning modified CART algorithm informs Merkel cell carcinoma prognosis. Australas J Dermatol, 62(3), 323–330. 10.1111/ajd.13624 [DOI] [PubMed] [Google Scholar]
- Danielmeier C, Eichele T, Forstmann BU, Tittgemeyer M, & Ullsperger M (2011). Posterior medial frontal cortex activity predicts post-error adaptations in task-related visual and motor areas. J Neurosci, 31(5), 1780–1789. 10.1523/JNEUROSCI.4299-10.2011 [DOI] [PMC free article] [PubMed] [Google Scholar]
- Fischl B, & Dale AM (2000). Measuring the thickness of the human cerebral cortex from magnetic resonance images. Proc Natl Acad Sci U S A, 97(20), 11050–11055. 10.1073/pnas.200033797 [DOI] [PMC free article] [PubMed] [Google Scholar]
- Fischl B, Salat DH, Busa E, Albert M, Dieterich M, Haselgrove C, … Dale AM (2002). Whole brain segmentation: automated labeling of neuroanatomical structures in the human brain. Neuron, 33(3), 341–355. 10.1016/s0896-6273(02)00569-x [DOI] [PubMed] [Google Scholar]
- Fischl B, Salat DH, van der Kouwe AJ, Makris N, Segonne F, Quinn BT, & Dale AM (2004). Sequence-independent segmentation of magnetic resonance images. Neuroimage, 23 Suppl 1, S69–84. 10.1016/j.neuroimage.2004.07.016 [DOI] [PubMed] [Google Scholar]
- Fleischman DA, Yang J, Arfanakis K, Arvanitakis Z, Leurgans SE, Turner AD, … Buchman AS (2015). Physical activity, motor function, and white matter hyperintensity burden in healthy older adults. Neurology, 84(13), 1294–1300. 10.1212/WNL.0000000000001417 [DOI] [PMC free article] [PubMed] [Google Scholar]
- Folstein MF, Folstein SE, & McHugh PR (1975). “Mini-mental state”. A practical method for grading the cognitive state of patients for the clinician. J Psychiatr Res, 12(3), 189–198. [DOI] [PubMed] [Google Scholar]
- Ghiasi MM, Zendehboudi S, & Mohsenipour AA (2020). Decision tree-based diagnosis of coronary artery disease: CART model. Comput Methods Programs Biomed, 192, 105400. 10.1016/j.cmpb.2020.105400 [DOI] [PubMed] [Google Scholar]
- Gryga M, Taubert M, Dukart J, Vollmann H, Conde V, Sehm B, … Ragert P (2012). Bidirectional gray matter changes after complex motor skill learning. Front Syst Neurosci, 6, 37. 10.3389/fnsys.2012.00037 [DOI] [PMC free article] [PubMed] [Google Scholar]
- Henrard S, Speybroeck N, & Hermans C (2015). Classification and regression tree analysis vs. multivariable linear and logistic regression methods as statistical tools for studying haemophilia. Haemophilia, 21(6), 715–722. 10.1111/hae.12778 [DOI] [PubMed] [Google Scholar]
- Holtrop JL, Loucks TM, Sosnoff JJ, & Sutton BP (2014). Investigating Age-related changes in fine motor control across different effectors and the impact of white matter integrity. Neuroimage, 96, 81–87. 10.1016/j.neuroimage.2014.03.045 [DOI] [PMC free article] [PubMed] [Google Scholar]
- Hooyman A, Lingo VanGilder J, & Schaefer SY (2022). Mediation Analysis of the Effect of Visuospatial Memory on Motor Skill Learning in Older Adults. J Mot Behav, 1–10. 10.1080/00222895.2022.2105793 [DOI] [PMC free article] [PubMed] [Google Scholar]
- Huang C, Tan K, Wu Z, & Yang L (2022). Application of machine learning model to predict lacunar cerebral infarction in elderly patients with femoral neck fracture before surgery. BMC Geriatr, 22(1), 912. 10.1186/s12877-022-03631-1 [DOI] [PMC free article] [PubMed] [Google Scholar]
- Ishihara K, Izawa KP, Kitamura M, Shimogai T, Kanejima Y, Morisawa T, & Shimizu I (2020). Pinch strength is associated with the prevalence of mild cognitive impairment in patients with cardiovascular disease. Journal of Cardiology, 75(6), 594–599. https://doi.org/ 10.1016/j.jjcc.2019.12.009 [DOI] [PubMed] [Google Scholar]
- Jacob ME, Terbojevich T, O’Donnell A, Gonzales MM, Satizabal CL, Beiser AS, … Seshadri S (2020). Grip strength and gait speed as early biomarkers of brain amyloid and tau deposition. Alzheimer’s Dement, 16, e041178. [Google Scholar]
- Kim GH, Seo SW, Jung K, Kwon O, Kwon H, Kim JH, … Na DL (2016). The neural correlates of motor intentional disorders in patients with subcortical vascular cognitive impairment. Journal of Neurology, 263(1), 89–99. 10.1007/s00415-015-7946-6 [DOI] [PubMed] [Google Scholar]
- Kodama M, Ono T, Yamashita F, Ebata H, Liu M, Kasuga S, & Ushiba J (2018). Structural Gray Matter Changes in the Hippocampus and the Primary Motor Cortex on An-Hour-to-One- Day Scale Can Predict Arm-Reaching Performance Improvement. Front Hum Neurosci, 12, 209. 10.3389/fnhum.2018.00209 [DOI] [PMC free article] [PubMed] [Google Scholar]
- Koppelmans V, Hirsiger S, Merillat S, Jancke L, & Seidler RD (2015). Cerebellar gray and white matter volume and their relation with age and manual motor performance in healthy older adults. Hum Brain Mapp, 36(6), 2352–2363. 10.1002/hbm.22775 [DOI] [PMC free article] [PubMed] [Google Scholar]
- Krzywinski M, & Altman N (2017). Classification and regression trees. Nature Methods,14(8), 757–758. 10.1038/nmeth.4370 [DOI] [Google Scholar]
- König A, Klaming L, Pijl M, Demeurraux A, David R, & Robert P (2017). Objective measurement of gait parameters in healthy and cognitively impaired elderly using the dual-task paradigm. Aging Clin Exp Res, 29(6), 1181–1189. 10.1007/s40520-016-0703-6 [DOI] [PMC free article] [PubMed] [Google Scholar]
- Lathouwers E, Dillen A, Díaz MA, Tassignon B, Verschueren J, Verté D, … De Pauw K (2022). Characterizing fall risk factors in Belgian older adults through machine learning: a data-driven approach. BMC Public Health, 22(1), 2210. 10.1186/s12889-022-14694-5 [DOI] [PMC free article] [PubMed] [Google Scholar]
- Leong DP, Teo KK, Rangarajan S, Lopez-Jaramillo P, Avezum A Jr., Orlandini A, … Prospective Urban Rural Epidemiology Study, i. (2015). Prognostic value of grip strength: findings from the Prospective Urban Rural Epidemiology (PURE) study. Lancet, 386(9990), 266–273. 10.1016/S0140-6736(14)62000-6 [DOI] [PubMed] [Google Scholar]
- Lingo VanGilder J, Hengge CR, Duff K, & Schaefer SY (2018). Visuospatial function predicts one-week motor skill retention in cognitively intact older adults. Neurosci Lett, 664, 139–143. 10.1016/j.neulet.2017.11.032 [DOI] [PMC free article] [PubMed] [Google Scholar]
- Lingo VanGilder J, Lohse KR, Duff K, Wang P, & Schaefer SY (2021). Evidence for associations between Rey-Osterrieth Complex Figure test and motor skill learning in older adults. Acta Psychol (Amst), 214, 103261. 10.1016/j.actpsy.2021.103261 [DOI] [PMC free article] [PubMed] [Google Scholar]
- Malek-Ahmadi M, Raj A, & Small BJ (2011). Semantic clustering as a neuropsychological predictor for amnestic-MCI. Aging, Neuropsychology, and Cognition, 18(3), 280–292. 10.1080/13825585.2010.540642 [DOI] [PMC free article] [PubMed] [Google Scholar]
- Malek-Ahmadi M, Small BJ, & Raj A (2011). The diagnostic value of controlled oral word association test-FAS and category fluency in single-domain amnestic mild cognitive impairment. Dement Geriatr Cogn Disord, 32(4), 235–240. 10.1159/000334525 [DOI] [PMC free article] [PubMed] [Google Scholar]
- Mandrekar JN (2010). Receiver operating characteristic curve in diagnostic test assessment. J Thorac Oncol, 5(9), 1315–1316. 10.1097/JTO.0b013e3181ec173d [DOI] [PubMed] [Google Scholar]
- Mathiowetz V (1990). Effects of three trials on grip and pinch strength measurements. Journal of Hand Therapy, 3(4), 195–198. https://doi.org/ 10.1016/S0894-1130(12)80377-2 [DOI] [Google Scholar]
- Mathiowetz V, Kashman N, Volland G, Weber K, Dowe M, & Rogers S (1985). Grip and pinch strength: normative data for adults. Arch Phys Med Rehabil, 66(2), 69–74. [PubMed] [Google Scholar]
- Michels L, Dietz V, Schattin A, & Schrafl-Altermatt M (2018). Neuroplastic Changes in Older Adults Performing Cooperative Hand Movements. Front Hum Neurosci, 12, 488. 10.3389/fnhum.2018.00488 [DOI] [PMC free article] [PubMed] [Google Scholar]
- Morris JC (1993). The Clinical Dementia Rating (CDR): current version and scoring rules. Neurology, 43(11), 2412–2414. 10.1212/wnl.43.11.2412-a [DOI] [PubMed] [Google Scholar]
- Orta-Salazar E, Feria-Velasco AI, & Díaz-Cintra S (2019). Primary motor cortex alterations in Alzheimer disease: a study in the 3xTg-AD model. Neurología (English Edition),34(7), 429–436. https://doi.org/ 10.1016/j.nrleng.2019.02.001 [DOI] [PubMed] [Google Scholar]
- Oschwald J, Mérillat S, Jäncke L, & Seidler RD (2021). Fractional Anisotropy in Selected,Motor-Related White Matter Tracts and Its Cross-Sectional and Longitudinal Associations With Motor Function in Healthy Older Adults [Original Research]. Front Hum Neurosci, 15. 10.3389/fnhum.2021.621263 [DOI] [PMC free article] [PubMed] [Google Scholar]
- Ranganathan R, Lee MH, & Newell KM (2020). Repetition Without Repetition: Challenges in Understanding Behavioral Flexibility in Motor Skill. Front Psychol, 11, 2018. 10.3389/fpsyg.2020.02018 [DOI] [PMC free article] [PubMed] [Google Scholar]
- Regan E, Fridriksson J, Schaefer SY, Rorden C, Bonilha L, Lingo VanGilder J, & Stewart JC (2021). Neural correlates of within-session practice effects in mild motor impairment after stroke: a preliminary investigation. Exp Brain Res, 239(1), 151–160. 10.1007/s00221-020-05964-y [DOI] [PMC free article] [PubMed] [Google Scholar]
- Riaz M, Vangberg TR, Vasylenko O, Castro-Chavira S, Gorecka MM, Waterloo K, & Rodríguez-Aranda C (2021). What does hand motor function tell us about our aging brain in association with WMH? Aging Clin Exp Res, 33(6), 1577–1584. 10.1007/s40520-020-01683-0 [DOI] [PMC free article] [PubMed] [Google Scholar]
- Schaefer SY, & Duff K (2015). Rapid Responsiveness to Practice Predicts Longer-Term Retention of Upper Extremity Motor Skill in Non-Demented Older Adults. Front Aging Neurosci, 7, 214. 10.3389/fnagi.2015.00214 [DOI] [PMC free article] [PubMed] [Google Scholar]
- Schaefer SY, & Duff K (2017). Within-session and one-week practice effects on a motor task in amnestic mild cognitive impairment. J Clin Exp Neuropsychol, 39(5), 473–484. 10.1080/13803395.2016.1236905 [DOI] [PMC free article] [PubMed] [Google Scholar]
- Schaefer SY, Duff K, Hooyman A, & Hoffman JM (2022). Improving prediction of amyloid deposition in Mild Cognitive Impairment with a timed motor task. Am J Alzheimers Dis Other Demen, 37, 15333175211048262. 10.1177/15333175211048262 [DOI] [PMC free article] [PubMed] [Google Scholar]
- Schaefer SY, Hooyman A, & Duff K (2020). Using a Timed Motor Task to Predict One-Year Functional Decline in Amnestic Mild Cognitive Impairment. J Alzheimers Dis, 77(1), 53–58. 10.3233/JAD-200518 [DOI] [PMC free article] [PubMed] [Google Scholar]
- Schaefer SY, Malek-Ahmadi M, Hooyman A, King JB, & Duff K (2022). Association Between Motor Task Performance and Hippocampal Atrophy Across Cognitively Unimpaired, Amnestic Mild Cognitive Impairment, and Alzheimer’s Disease Individuals. J Alzheimers Dis, 85(4), 1411–1417. 10.3233/JAD-210665 [DOI] [PMC free article] [PubMed] [Google Scholar]
- Shin Y, Cho KJ, Lee Y, Choi YH, Jung JH, Kim SY, … Jhang WK (2022). Multicenter validation of a deep-learning-based pediatric early-warning system for prediction of deterioration events. Acute Crit Care. 10.4266/acc.2022.00976 [DOI] [PMC free article] [PubMed] [Google Scholar]
- Steele CJ, Scholz J, Douaud G, Johansen-Berg H, & Penhune VB (2012). Structural correlates of skilled performance on a motor sequence task. Front Hum Neurosci, 6, 289. 10.3389/fnhum.2012.00289 [DOI] [PMC free article] [PubMed] [Google Scholar]
- Sternad D (2018). It’s Not (Only) the Mean that Matters: Variability, Noise and Exploration in Skill Learning. Curr Opin Behav Sci, 20, 183–195. 10.1016/j.cobeha.2018.01.004 [DOI] [PMC free article] [PubMed] [Google Scholar]
- Suvà D, Favre I, Kraftsik R, Esteban M, Lobrinus A, & Miklossy J (1999). Primary motor cortex involvement in Alzheimer disease. J Neuropathol Exp Neurol, 58(11), 1125–1134. 10.1097/00005072-199911000-00002 [DOI] [PubMed] [Google Scholar]
- Tomas MT, Santa-Clara H, Monteiro E, Carolino E, Freire A, & Barroso E (2010). [Grip strength changes in familial amyloidotic polyneuropathy]. Acta Med Port, 23(5), 803–810. (Alteracoes da forca de preensao em portadores de polineuropatia amiloidotica familiar.) [PubMed] [Google Scholar]
- Wang P, Infurna FJ, & Schaefer SY (2020). Predicting motor skill learning in older adults using visuospatial performance. Journal of Motor Learning and Development, 8(1), 38–51. [DOI] [PMC free article] [PubMed] [Google Scholar]
- Wechsler D (1987). Manual for the Weschler Memory Scale - Revised. The Psychological Corporation. [Google Scholar]
- Wilkinson GS, & Robertson GJ (2006). WRAT 4: Wide Range Achievement Test, professional manual. Psychological Assessment Resources, Inc. [Google Scholar]
- Yesavage JA, Brink TL, Rose TL, Lum O, Huang V, Adey M, & Leirer VO (1982). Development and validation of a geriatric depression screening scale: a preliminary report. J Psychiatr Res, 17(1), 37–49. 10.1016/0022-3956(82)90033-4 [DOI] [PubMed] [Google Scholar]
Associated Data
This section collects any data citations, data availability statements, or supplementary materials included in this article.