Correction to: Scientific Reports 10.1038/s41598-018-20465-3, published online 31 January 2018
This Article contains errors.
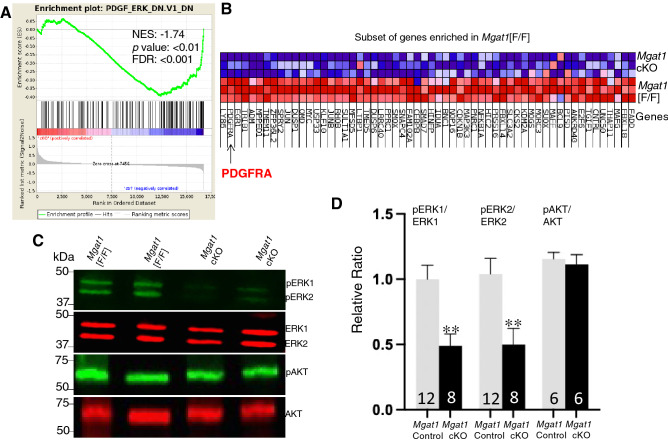
The image in Figure 6D shows an incorrect number of independent germ cell samples analyzed in western blots for ERK and pERK. In the revised Figure 6D, the results from the gel shown in Figure 6C, and 3 additional western blots of germ cell lysates from Control (Mgat1[F/F], Mgat1[F/+]:Stra8-iCre or Mgat1[+/+]) and Mgat1 cKO males are included.
Figure 6.
Signaling pathways in Mgat1 cKO germ cells at 22 dpp. (A) GSEA analysis showing enrichment of a PDGF_ERK signature in control germ cells. (B) Heat map shows the cluster of DEGs in the PDGF_ERK signaling pathway positively-enriched in control versus Mgat1 cKO germ cells. Arrow identifies PDGFRA as down-regulated in Mgat1 cKO germ cells. (C) Western blot analysis of phosphorylated and unphosphorylated ERK1, ERK2 and AKT in germ cells of Mgat1 cKO compared to control. The gels from which these data were obtained are shown in Supplementary Fig. S7. (D) Histogram of the relative ratio of ERK and AKT signaling determined from western blot analyses of germ cell lysates prepared from the number of mice noted in each bar (mean ± SEM; **p < 0.01). Control mice included Mgat1[F/F], Mgat1[F/+]:Stra8-iCre and Mgat1[+ /+] 22-day males.
As a result, the Figure legend for Figure 6D should read:
“(D) Histogram of the relative ratio of ERK and AKT signaling determined from western blot analyses of germ cell lysates prepared from the number of mice noted in each bar (mean ± SEM; **p < 0.01). Control mice included Mgat1[F/F], Mgat1[F/+]:Stra8-iCre and Mgat1[+/+] 22-day males.”
The correct Figure 6 and its corrected accompanying legend appear below.
Furthermore, some primer sequences are not included in the Methods section, under the subheading ‘Quantitative PCR’. Primer sequences are given in Supplementary Table S4 and as follows:
Acrv, (For) TGAAGTTTCGGGTGACGAAGCAGGT: (Rev) GCTGGGAGTTTTGAGTGGTGCATAC;
Dbil5, (For) GTACAGCTTTTACAAACAGGCCACCC: (Rev) CCACTTTAGCAATGTAGATCCTCATGGC;
Cyp11a1, (For) GTGGACCCCAAGGATGCGTCGATACTCTTC: (Rev) ACCTCTTGGTTTAGGACGATTCGGTC;
Rhox5, (For) TCAAGGAAGACTCGGAAGAACAGCAT: (Rev) CACTATCCTTGTCCCCATCACCCATA;
Actb, (For) CGGTTCCGATGCCCTGAGGCTC: (Rev) TGTCAGCAATGCCTGGGTACATGGTGGT.”


