

Abstract
Background:
Prevention of mother-to-child transmission (PMTCT) is critical for halting the HIV epidemic. However, innovative approaches to improve PMTCT uptake may be resource-intensive. We examined the economic costs and cost-effectiveness of conditional cash transfers (CCTs) for the uptake of PMTCT services in the Democratic Republic of Congo.
Methods:
We leveraged data from a randomized controlled trial of CCTs (n=216) versus standard PMTCT care alone (standard of care (SOC), n=217). Economic cost data came from multiple sources, with costs analyzed from the societal perspective and reported in 2016 international dollars (I$). Effectiveness outcomes included PMTCT uptake (i.e., accepting all PMTCT visits and services) and retention (i.e., in HIV care at six weeks post-partum). Generalized estimating equations estimated effectiveness (relative risk) and incremental costs, with incremental effectiveness reported as the number of women needing CCTs for an additional PMTCT uptake or retention. We evaluated the cost-effectiveness of the CCTs at various levels of willingness-to-pay and assessed uncertainty using deterministic sensitivity analysis and cost-effectiveness acceptability curves.
Results:
Mean costs per participant were I$516 (CCTs) and I$431 (SOC), representing an incremental cost of I$85 (95% CI: 59, 111). PMTCT uptake was more likely for CCTs vs SOC (68% vs 53%, p<0.05), with seven women needing CCTs for each additional PMTCT service uptake; twelve women needed CCTs for an additional PMTCT retention. The incremental cost-effectiveness of CCTs vs SOC was I$595 (95% CI: I$550, I$638) for PMTCT uptake and I$1028 (95% CI: I$931, I$1125) for PMTCT retention. CCTs would be an efficient use of resources if society’s willingness-to-pay for an additional woman who takes up PMTCT services is at least I$640. In the worst-case scenario, the findings remained relatively robust.
Conclusions:
Given the relatively low cost of the CCTs, policies supporting CCTs may decrease onward HIV transmission and expedite progress toward ending the epidemic.
Keywords: PMTCT, HIV, uptake, retention, economic costs, cost-effectiveness, conditional cash transfers, the Democratic Republic of the Congo
Introduction
Despite global progress in reducing the number of new HIV infections, vertical transmission of HIV remains a critical challenge. Over half of new pediatric HIV infections globally occur in sub-Saharan Africa (SSA), where an estimated 100,000 children acquire HIV annually, primarily through vertical transmission (1). In some parts of SSA, the number of children infected with HIV as a percent of new HIV infections has not declined over time. In the Democratic of the Congo (DRC), for example, 29.5% (13,000/44,000) of all new HIV infections were among children in the year 2000 compared with 28% (8,100/29,000) in 2014 and 31% (6,500/21,000) in 2021 (2, 3). The new infections continue to occur despite the availability of antiretroviral therapy (ART)—an evidence-based treatment critical for the prevention of mother-to-child transmission of HIV (PMTCT) (4). Without ART, the risk of acquiring HIV among babies born to mothers living with HIV is as high as 40%. This risk, however, is reduced to less than 5% if the mother is adherent to ART—a prerequisite to achieving viral suppression and enjoying all ART health benefits, including reduced risk of vertical HIV transmission (4, 5). However, before ART adherence or viral suppression can happen, access to the health care system to take up ART services must happen first. Unfortunately, despite the benefits of ART and availability of ART within the SSA region, uptake of ART services among pregnant and breastfeeding women living with HIV (PWLHIV) remains suboptimal (6), with countries such as the DRC having about 40% (11,300/29,000) of pregnant women with HIV not on ART in 2021 (2). Thus, identifying innovative approaches to address barriers to the demand and uptake of these services in the DRC and most parts of SSA remains key to global ambitions to halt the HIV epidemic.
Conditional cash transfers to increase the uptake of services, including PMTCT services, have generated interest as a policy mechanism to reduce HIV transmission. Conditional cash transfers (CCTs)—another evidence-based intervention—have previously been used to modify individual and household behaviors in health and other sectors like education (7, 8). In the context of PMTCT, this approach involves paying cash to PWLHIV, with the condition that the women initiate PMTCT services and remain in PMTCT care. The expectation is that CCTs would help to pay for transport costs to and from health centers and the opportunity cost of time seeking care—some of the major demand-side barriers to the uptake of PMTCT services in SSA (9). Indeed, a recent randomized controlled trial implemented in the Democratic of the Congo (DRC) found that PMTCT plus CCTs increased both the uptake of PMTCT services and retention of women in PMTCT care compared to PMTCT alone (10).
While the trial in the DRC reported that CCTs improved PMTCT uptake and retention, the economic costs and cost-effectiveness of the intervention have not been examined until now. To fill this gap, we analyzed the costs and cost-effectiveness of PMTCT plus CCTs (henceforth intervention) compared to PMTCT alone (the standard of care or SOC). Our understanding of the value of CCTs in resource-limited settings endemic to HIV is particularly important as major gaps in domestic and international HIV-related funding have reinvigorated interest in implementing scalable interventions that are not only effective but also an efficient use of scarce resources. In addition, as the supply of PMTCT services is no longer a major challenge given the progressive scale-up of PMTCT services in the DRC (11), establishing whether the cash incentives represent an efficient use of resources and a value for money to increase PMTCT coverage is critical.
Overview of the trial
Between 2013 and 2015, a randomized controlled trial tested the effectiveness of paying cash incentives to pregnant women with HIV to overcome demand-side barriers to taking up PMTCT services such as transport costs and the opportunity cost of time seeking care (trial registration # NCT01838005). The trial was conducted in Kinshasa, the capital of the Democratic Republic of the Congo (DRC) in 89 clinics already offering PMTCT services as part of maternal and child health services. The trial included women that were newly diagnosed with HIV, 28 to 32 weeks of gestation, and registered for antenatal care at any of the study clinics. Potential participants were excluded if they were severely ill, did not speak one of the two languages commonly spoken in Kinshasa (French or Lingala), were less likely to stay in Kinshasa during the entire study period, and did not return to the clinic after being diagnosed with HIV. A study nurse, not part of the team providing clinical care, obtained written informed consent from all participants. Participants were assigned (1:1) to the intervention or control group using block randomization. The intervention group (n=216) received PMTCT care plus US$5 on the first visit which increased by US$1 at every scheduled visit thereafter, but was reset to US$5 for missing a scheduled visit; the control group (n=217) received PMTCT care alone. At the time of the trial (2013–2015), standard PMTCT care included the attendance of scheduled clinic visits (for antenatal care and ART refills, at a minimum), delivery of the baby in a health facility, and testing the HIV-exposed infant at three milestones—6 weeks, 9 months, and soon after the infant is weaned from breastfeeding (18–24 months). Thus, all study participants were eligible to receive this standard PMTCT care, with those in the intervention group also receiving cash incentives.
The trial had two primary health outcomes. The first outcome was the uptake of PMTCT services, defined as timely attendance (i.e., within 5 days) of all scheduled clinic visits from randomization through 6 weeks postpartum, and acceptance of all proposed services for PMTCT. The second outcome was retention in PMTCT care, defined as being in HIV care at 6 weeks postpartum regardless of missing any intervening scheduled visits. With these definitions, PMTCT uptake was a subset and a much more strict definition of PMTCT retention as all women who took up PMCT services were also retained in PMTCT care. This difference in definitions is reflected in the results reported in the original published article from the trial. The article reported that the CCTs significantly increased PMTCT uptake, with 68% (146/216) of participants in the intervention group taking up PMTCT services compared with 53% (116/217) in the control group (risk ratio=1.31; 95% CI: 1.12–1.54). In terms of PMTCT retention, 81% of participants in the intervention group were retained in PMTCT care compared with 72% in the control group (risk ratio=1.13; 95% CI: 1.02–1.26). Details of the trial and its findings are published elsewhere (10).
Materials and methods
Overview
We analyzed the economic costs and cost-effectiveness of CCTs aimed to increase PMTCT uptake and retention in the DRC. We adopted a societal perspective, which included formal healthcare sector costs (e.g., drugs), informal costs (e.g., patient transport costs), and productivity losses captured using the opportunity cost of time spent seeking healthcare services by the participant and her guardian. Data on the cost of cash transfers, patient transport, and health outcomes came from the trial while the rest of the data, including daily wages to capture productivity losses, came from the literature. Transport cost data were obtained from surveys with trial participants. Using micro- and gross-costing approaches, each participant was assigned costs based on resources utilized on each visit. Multivariable regressions were used to estimate incremental costs and effectiveness, with these estimates then used to calculate incremental cost-effectiveness ratios. Sensitivity analyses were performed to identify cost drivers and examine the robustness of study findings. This study was designated as exempt by the Virginia Commonwealth University Institutional Review Board (IRB# HM20009283). Additional methodological detail is available in the supplementary content.
Economic costing approach
Apart from cash transfers and patient transportation, the economic costing of the rest of the cost elements involved three steps. In the first step, we identified candidate cost sources and selected base unit costs in the second step. In the third and final step, we adjusted the base unit costs to a constant year and currency.
In Step 1, we used peer-reviewed and grey literature to identify candidate sources of cost data (Table S1), with the sources restricted to those contextually relevant to the DRC in terms of time, income, and geography. Specifically, cost studies were restricted to publications from 2005 to 2017 to capture PMTCT approaches and ART costs contemporaneous with the trial. The search was also restricted to World Bank-designated low-income countries in SSA (12), reflecting the country-level income and geography of the DRC.
In Step 2, we selected base unit costs for goods and services (Table S2). Base unit costs were selected from studies that met the following criteria: clearly stated data source(s), the process for cost assignment, cost estimation approach, and presentation of costs in disaggregated form (e.g., cost per visit). International negotiated price lists were used for the costs of antiretroviral therapy (13).
In Step 3, we adjusted the base unit costs to report costs in a common year and currency. Goods and services were valued in 2016 international dollars (I$)—a hypothetical currency with the same purchasing power as the US$ in the United States. We used the I$ since it more accurately values non-tradable goods and services, which can be undervalued in countries with higher purchasing power due to differences in local prices (14). To report base unit costs in a common currency, we used nominal exchange rates to convert unit cost estimates for tradable goods (e.g., medications) and purchasing power parity exchange rates for non-tradable goods (e.g., labor) (14, 15). To adjust for inflation and report in 2016 I$, we used the implicit gross domestic product (GDP) deflator (16). For the DRC, the purchasing power exchange rate was US$1=I$2.03 in 2016. Economic costs (and health effects) were not discounted since participant follow-up was less than 1 year.
Analysis
All analyses were performed as intention-to-treat. We analyzed costs and effects using multivariable regression and then estimated the incremental costs, incremental effectiveness, and incremental cost-effectiveness ratios. Those who received PMTCT care alone, the control group in the trial, were the comparison group.
A general statistical model for analyzing costs and effectiveness
We modeled the costs and effectiveness associated with the intervention using generalized estimating equations (GEE), to adjust for potential clustering of subjects at the clinic level. The following was the generalized linear model:
| (1) |
where:
Outcomeij was either the cost or health outcome (PMTCT uptake or PMTCT retention) for the ith participant at the jth clinic;
Intervention=1 if the participant received the CCTs and 0 otherwise; β1 was the coefficient of interest.
Xij is a vector of participant characteristics (age, marital status, education, wealth, and transport mode) and A is a corresponding vector of coefficients.
We specified an exchangeable within-group correlation structure for both costs and effectiveness, but the links and distributions varied according to the outcome of interest as described below (17). We implemented the models in Stata 14.2.
Economic costs and incremental costs
We calculated total economic costs for each arm as the sum of the product of participant resource use and the unit resource costs. We summarized economic costs, by arm, using the mean and standard deviation since policy decisions are made based on expectation; however, we also reported the median and interquartile range given that cost data are usually positively skewed. We tested differences in means and medians using t-tests and rank-sum tests, respectively (18).
Incremental costs were estimated using equation 1 with cost as the outcome. We specified a gamma distribution and an identity link. The specifications were based on the results of testing different correlation structures and cost distributions using the quasi-likelihood under the independence model criterion (QIC) (19). Given the identity link, β1 represented the difference in per-participant costs between the intervention and control arms—or the incremental cost of the intervention.
Effectiveness and incremental effectiveness
We reported the effectiveness of the CCTs using relative risks—the ratio of the probability of PMTCT uptake (or PMTCT retention) among women who received the intervention to the probability among those who did not receive the intervention. The relative risks were estimated directly from equation 1 by specifying a Poisson distribution and a logarithmic link. We specified a Poisson distribution because a log-binomial model could not converge within the GEE environment in Stata. However, to make the standard errors comparable to those from a log-binomial model, we estimated the Poisson model with robust error variances (20). Thus, for PMTCT uptake, participants who received the CCTs had β1 times the risk of taking up PMTCT services compared with participants who did not receive the CCTs.
We expressed the incremental effectiveness of the CCTs using the mean participant absolute risk difference between the two groups. For this study, the absolute risk difference represents the difference in the observed probability of PMTCT uptake (or PMTCT retention) between the women who received CCTs and those who did not receive the CCTs. To facilitate interpretation, we reported the results as the reciprocal of this measure, or the number needed to treat (NNT). NNT quantifies the number of participants needed to receive an intervention to achieve a given outcome (21), with a higher NNT suggesting that the intervention is less effective in achieving the desired outcome. For the current study, we interpreted NNT as the number of participants needed to receive the PMTCT plus cash incentives for one more participant to take up PMTCT services, compared to PMTCT care alone. We made a similar interpretation for PMTCT retention. We used the NNT for the intermediate health outcomes (PMTCT uptake and PMTCT retention) to report the incremental effectiveness because the trial was too short (2013–2015) to assess final health outcomes such as the number of HIV infections.
Incremental cost-effectiveness ratio
We calculated incremental cost-effectiveness ratios by taking the product of incremental costs and incremental effectiveness. We calculated the product since NNT represents the reciprocal of the incremental effectiveness measure. Bootstrapping with 1000 replications was used to generate the 95% confidence intervals for the incremental cost-effectiveness ratio (22). See supplementary content for detailed steps on this.
Missing data
Approximately 40% of the participants had missing transport costs, which we replaced using multiple imputations as the data were not missing systematically (23). The imputations were performed using predictive mean matching, which enabled us to not make any assumptions about the distribution of the data (24). The imputation included the dependent variable and all explanatory variables.
Sensitivity analysis
We performed one-way and multi-way sensitivity analyses to identify key cost drivers and examine the robustness of the incremental cost-effectiveness ratio. In one-way sensitivity analysis, we varied the base cost variables one at a time across a plausible range, holding other cost variables at their base values (25).
We used the limits of the 95% confidence intervals of the base case unit costs as the upper and lower bounds in the sensitivity analyses. If the base unit cost did not have a 95% confidence interval, we decreased and increased the base case estimate by 50% to derive the lower and upper bound estimates (26). In each one-way sensitivity analysis, we calculated new ICERs and report the results using tornado diagrams (27). As multiple variables may be uncertain, we examined the effect of simultaneously varying key variables in multi-way sensitivity analyses using best- and worst-case scenarios (25). We combined the most optimistic unit costs (lower bound unit costs) in Table S2 to create the best case and the most pessimistic unit costs (upper bound unit costs) to create the worst case. In each scenario, we calculated new ICERs and the associated 95% confidence intervals.
We examined uncertainty in the incremental cost-effectiveness ratio using cost-effectiveness acceptability curves, which represented the probability that CCTs were cost-effective compared to standard PMTCT services alone for a given willingness-to-pay threshold. To generate the curves, we used non-parametric bootstrap to evaluate the joint distribution of mean incremental costs and mean incremental effects (28).
Results
Costs and effects of PMTCT plus CCTs compared to standard PMTCT care
The mean per participant total cost was significantly higher in the CCT arm compared to the standard PMTCT care arm (I$516 (standard deviation (SD) 116) versus I$431(SD 132), p<0.001) (Table 1). Median total costs per participant were also higher in the intervention group (CCT: I$540 (IQR 105) versus standard PMTCT care alone: I$468 (IQR 120), p<0.001). As a share of total costs, the cost of delivering in a health facility was highest in either arm (52% in the intervention arm and 58% in the SOC arm). In the intervention arm, the cost of the cash incentives, along with the cost of antiretroviral therapy, represented the next highest share of total costs (10%). Overall, participants who received the intervention made 35 more clinic visits (934 vs. 899, p>0.05), with a mean cost per visit of I$119 (vs. I$104 in the SOC group). The incremental cost of PMTCT plus CCTs compared to PMTCT alone was I$85 (95% CI: 59, 111) (Table S3). The incremental cost was the same for either outcome as intervention cost did not vary by outcome.
Table 1.
Mean cost per participant, by trial arm (2016 I$)
| CCTs (Intervention) | Standard PMTCT Care† | ||||
|---|---|---|---|---|---|
|
|
|||||
| Component | Mean | 95% CI | Mean | 95% CI | p-value‡ |
|
| |||||
| Cash Incentives | 51.10 | [48.56, 53.64] | 0.31§ | [0.00, 0.93] | <0.001 |
| Medications | |||||
| AZT (mother) | 18.27 | [16.19, 20.34] | 17.40 | [15.33, 19.47] | >0.1 |
| ART (mother) | 13.45 | [11.18, 15.73] | 11.96 | [9.81, 14.1] | >0.1 |
| Cotrimoxazole (mother) | 5.04 | [4.79, 5.29] | 4.86 | [4.58, 5.13] | >0.1 |
| Nevirapine (infant) | 10.12 | [9.6, 10.65] | 9.43 | [8.82, 10.05] | <0.1 |
| Cotrimoxazole (infant) | 3.91 | [3.78, 4.04] | 3.68 | [3.51, 3.86] | <0.05 |
| Laboratory tests | |||||
| CD4 | 35.99 | [33.98, 38] | 31.66 | [29.65, 33.67] | >0.1 |
| DNA PCR (infant) | 30.61 | [27.75, 33.46] | 24.21 | [21.17, 27.24] | <0.01 |
| Transportation of dry blood sample | 1.57 | [1.43, 1.72] | 1.24 | [1.09, 1.40] | <0.01 |
| Health facility deliveries | 265.68 | [257, 274.36] | 250.19 | [238.33, 262.05] | <0.05 |
| Post-delivery counseling | 0.44 | [0.43, 0.46] | 0.42 | [0.4, 0.44] | <0.05 |
| Labor | |||||
| Wages for clinical staff | 11.21 | [10.63, 11.8] | 10.80 | [10.18, 11.41] | >0.1 |
| Wages for support staff | 4.97 | [4.71, 5.23] | 4.79 | [4.52, 5.06] | >0.1 |
| Capital and overhead costs | |||||
| Equipment | 5.74 | [5.44, 6.04] | 5.52 | [5.21, 5.84] | >0.1 |
| Utilities | 3.04 | [2.88, 3.20] | 2.93 | [2.76, 3.10] | >0.1 |
| Patient and peer/family support costs | |||||
| Patient and family support time | 35.96 | [34.74, 37.18] | 34.02 | [32.73, 35.31] | <0.05 |
| Transportation (varies by patient) | 18.83 | [17.22, 20.43] | 18.00 | [16.28, 19.73] | >0.1 |
| Total cost (Societal perspective) | 515.94 | [500.37, 531.51] | 431.43 | [413.75, 449.11] | <0.001 |
Abbreviations: CCT, conditional cash transfers; PMTCT, prevention of mother-to-child transmission
The intervention group received standard PMTCT care plus the CCTs—US$5 on the first visit and increasing to US$1 at each scheduled visit thereafter, with the CCT reset to US$5 after a missed scheduled visit.
Standard PMTCT care comprised regular clinic visits (for antenatal care and ART refills), delivery in a health facility, and testing the HIV-exposed infant at three milestones—6 weeks, 9 months, and soon after the infant is weaned from breastfeeding (18–24 months).
The p-values were from tests of medians based on the Wilcoxon rank sum tests.
The mean cost of cash incentives in the control group is not zero because one randomly selected participant in the control group received an incentive of I$82 (or US$45). We thus truncated the confidence interval for the cash incentives in the control group at zero; the actual confidence interval was [−0.31, 0.93].
In line with the originally published findings (10), we confirmed that the CCTs significantly increased the uptake of PMTCT services and retention in PMTCT care. Sixty-eight percent (146/216) of women in the intervention group took up PMTCT services compared to 53% (116/217) in the control group, with an adjusted relative risk of 1.28 (95% CI: 1.09, 1.5) (Table S4). Similarly, the proportion of women retained in PMTCT care was higher in the intervention group than in the control group (81% (174/216) vs. 72% (157/217)), with an adjusted relative risk of 1.12 (95% CI: 1.01, 1.23). The incremental effectiveness of PMTCT uptake was 7.0 (95% CI: 6.7, 7.6). That is, 7 participants needed to receive the cash incentives for one more participant to take up PMTCT services, compared to the control group. For PMTCT retention, the incremental effectiveness was 12.1 (95% CI: 11.6, 12.8).
Incremental cost-effectiveness ratios
For PMTCT uptake, the incremental cost-effectiveness associated with the CCTs was I$595 (95% CI: 550, 638) for each additional woman taking up PMTCT services, compared to the standard of care. For PMTCT retention, the incremental cost-effectiveness associated with the CCTs was I$1028 (95% CI: 931, 1125) for each additional woman retained in PMTCT care, compared to the standard of care.
Sensitivity analysis
The sensitivity analyses suggested that CCTs and health facility delivery costs were the main cost drivers, and in the worst-case scenario, the findings were relatively robust. In one-way sensitivity analysis (Figure 1), paying a cash transfer as large as I$20, while holding other variables as their base values, resulted in an incremental cost of I$910 for an additional woman taking up PMTCT services and I$1550 for an additional woman retained in PMTCT care. Similarly, increasing the cost of healthcare deliveries, while holding other variables as their base values, resulted in higher cost-effectiveness incremental ratios but not as high as was observed when the size of the cash transfer was increased. And in the worst-case scenario (i.e., where all costs are valued at their upper bound), the incremental cost-effectiveness ratio was I$1175 (95% CI: 1118, 1235) for PMTCT uptake and I$2027 (95% CI: 1893, 2178) for PMTCT retention. In the best-case economic cost scenario (i.e., where all costs are valued at their lower bound), the incremental cost-effectiveness ratio was I$220 (95% CI: 210, 230) for PMTCT uptake and I$379 (95% CI: 355, 407) for PMTCT retention, both of which are less than half the point estimates in the base case.
Figure 1:
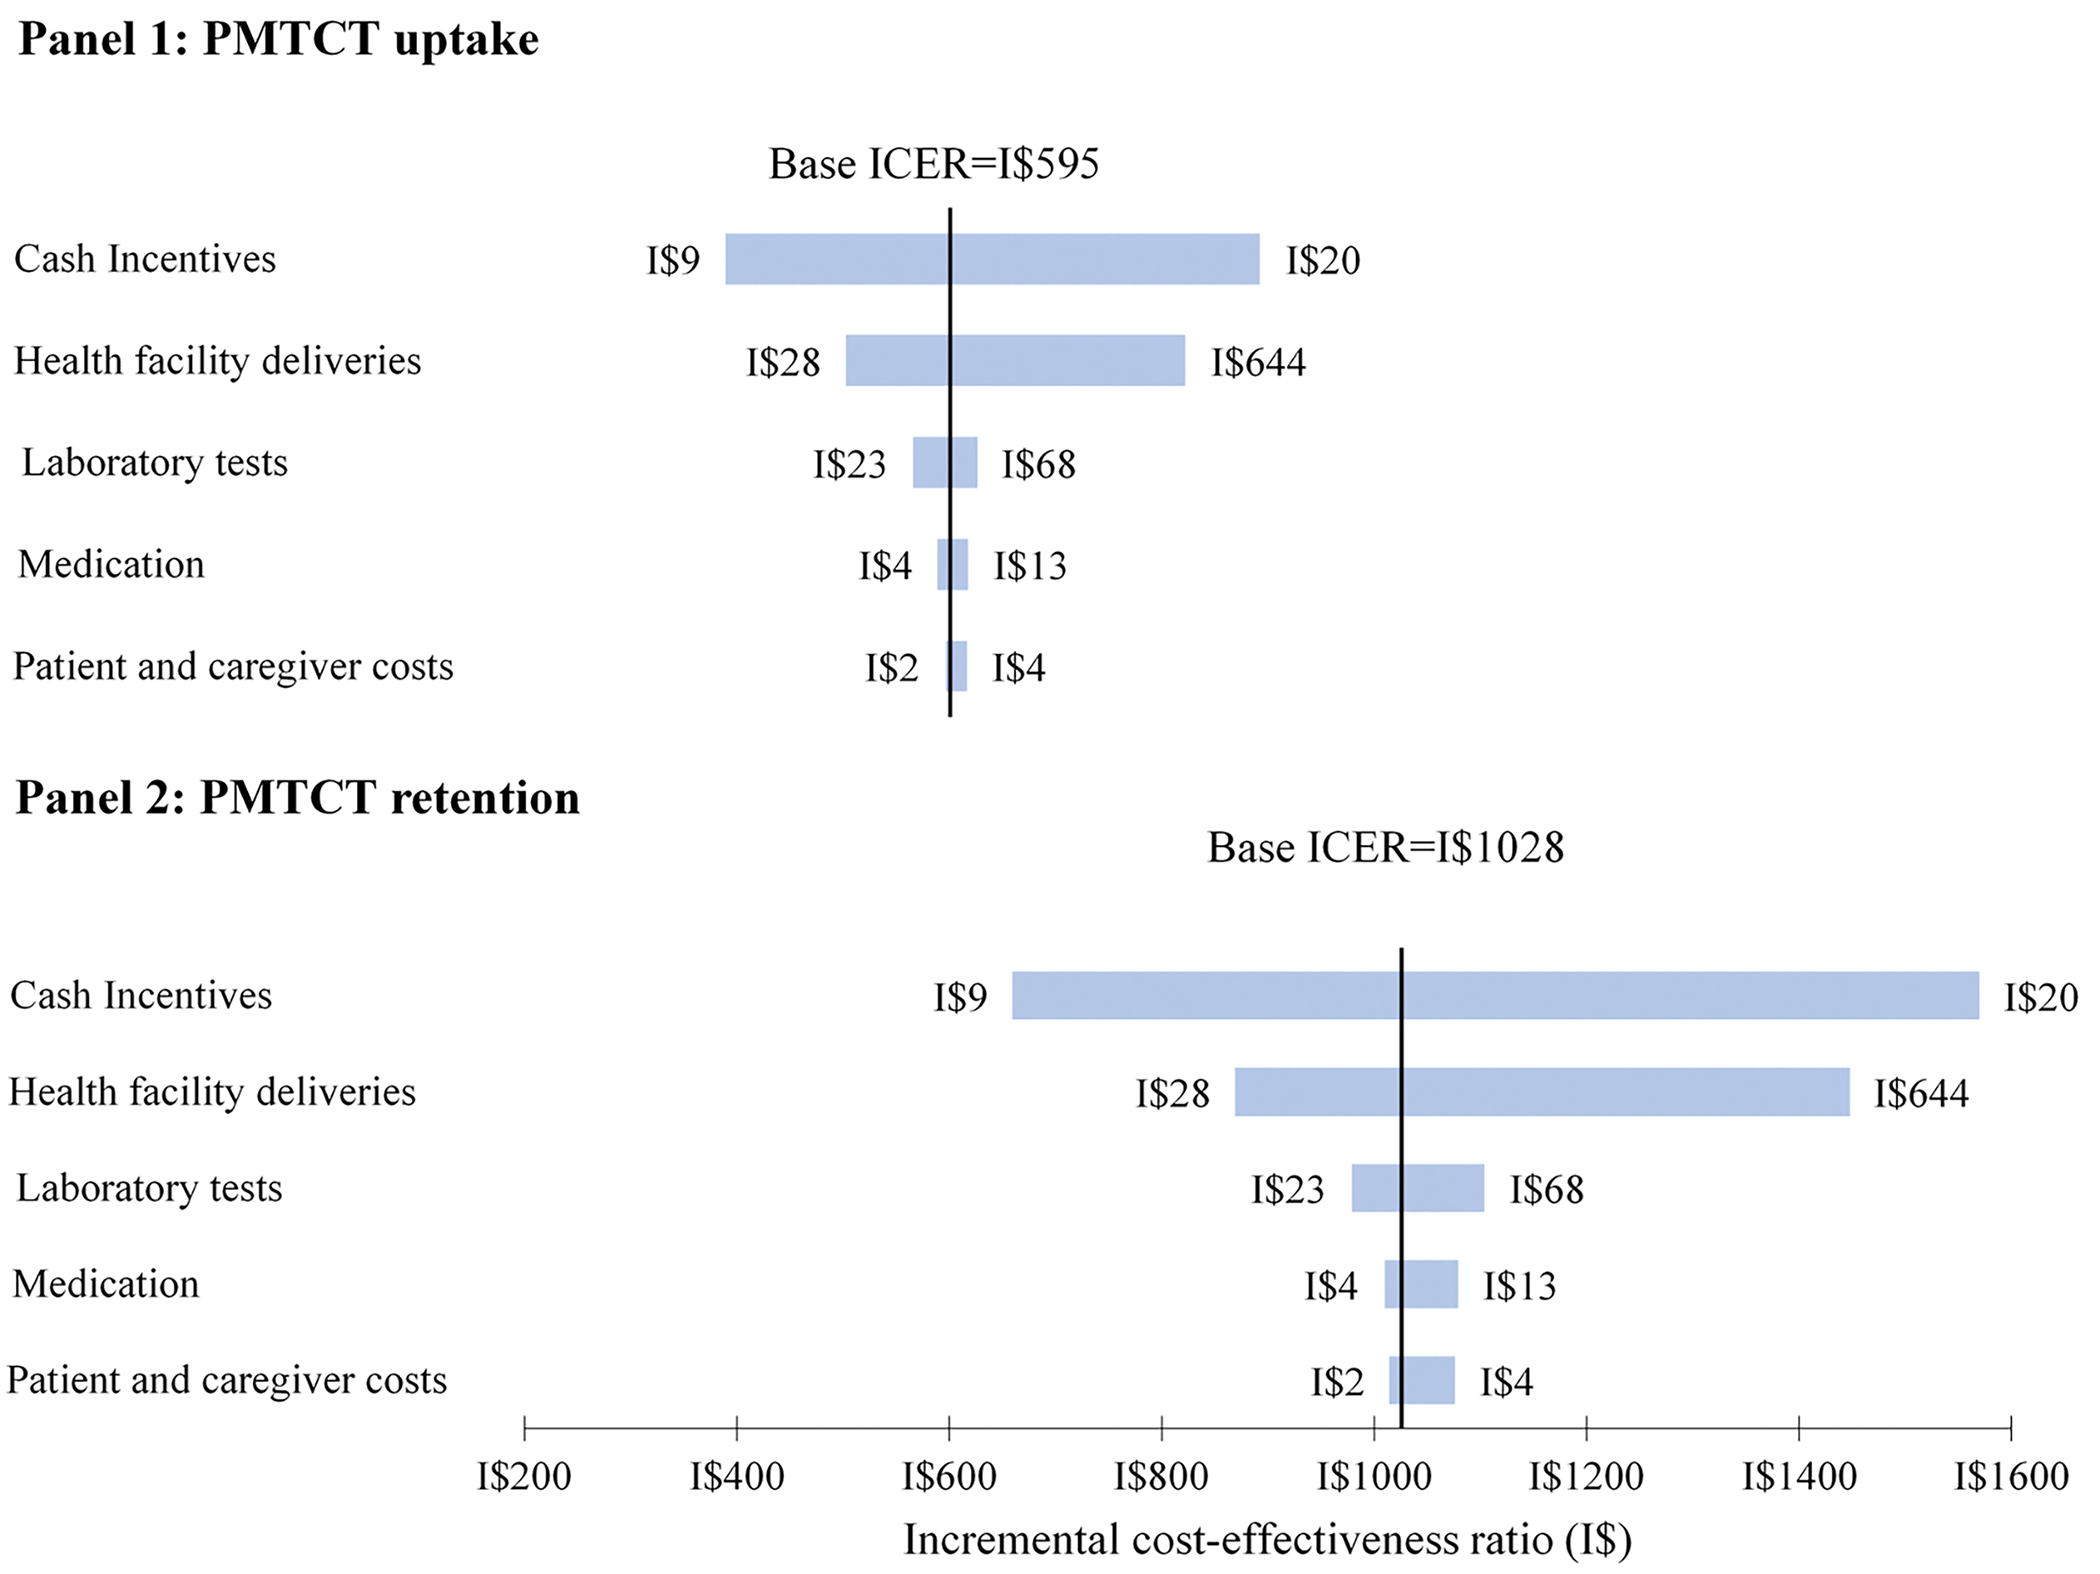
One-way sensitivity analysis of unit costs
This figure shows how the incremental cost-effectiveness ratio responds to changes in unit costs for PMTCT uptake (Panel 1) and PMTCT retention (Panel 2). The x-axis shows the change in the incremental cost-effectiveness ratio due to variations in unit costs, with the labels on either end of each bar representing the lower and upper bound values. The y-axis shows the individual unit costs varied. In each panel, the thick vertical line corresponds to the incremental cost-effectiveness ratios calculated using the base case unit costs. For both outcomes, the incremental cost-effectiveness ratio was sensitive to the value of the cash incentives followed by the cost of health facility deliveries. Abbreviations: ICER, incremental cost-effectiveness ratio; PMTCT, prevention of mother-to-child transmission of HIV.
Cost-effectiveness acceptability curves suggested that the incremental cost-effectiveness estimates for the CCT intervention were associated with a high degree of certainty (Figure 2). The curves are steep and rise rapidly (points A to C and E to G), indicating that the incremental cost-effectiveness ratios from the resampled datasets had limited deviation from the baseline incremental cost-effectiveness ratio. The probability that CCTs were cost-effective compared to standard PMTCT care approached 1 at a willingness-to-pay threshold of I$650 (PMTCT uptake) (point C) and I$1140 (PMTCT retention) (point G). Points B and F correspond to the incremental cost-effectiveness ratios in the main analysis and represent a 0.5 probability that the intervention (compared to the standard of care) is cost-effective.
Figure 2:
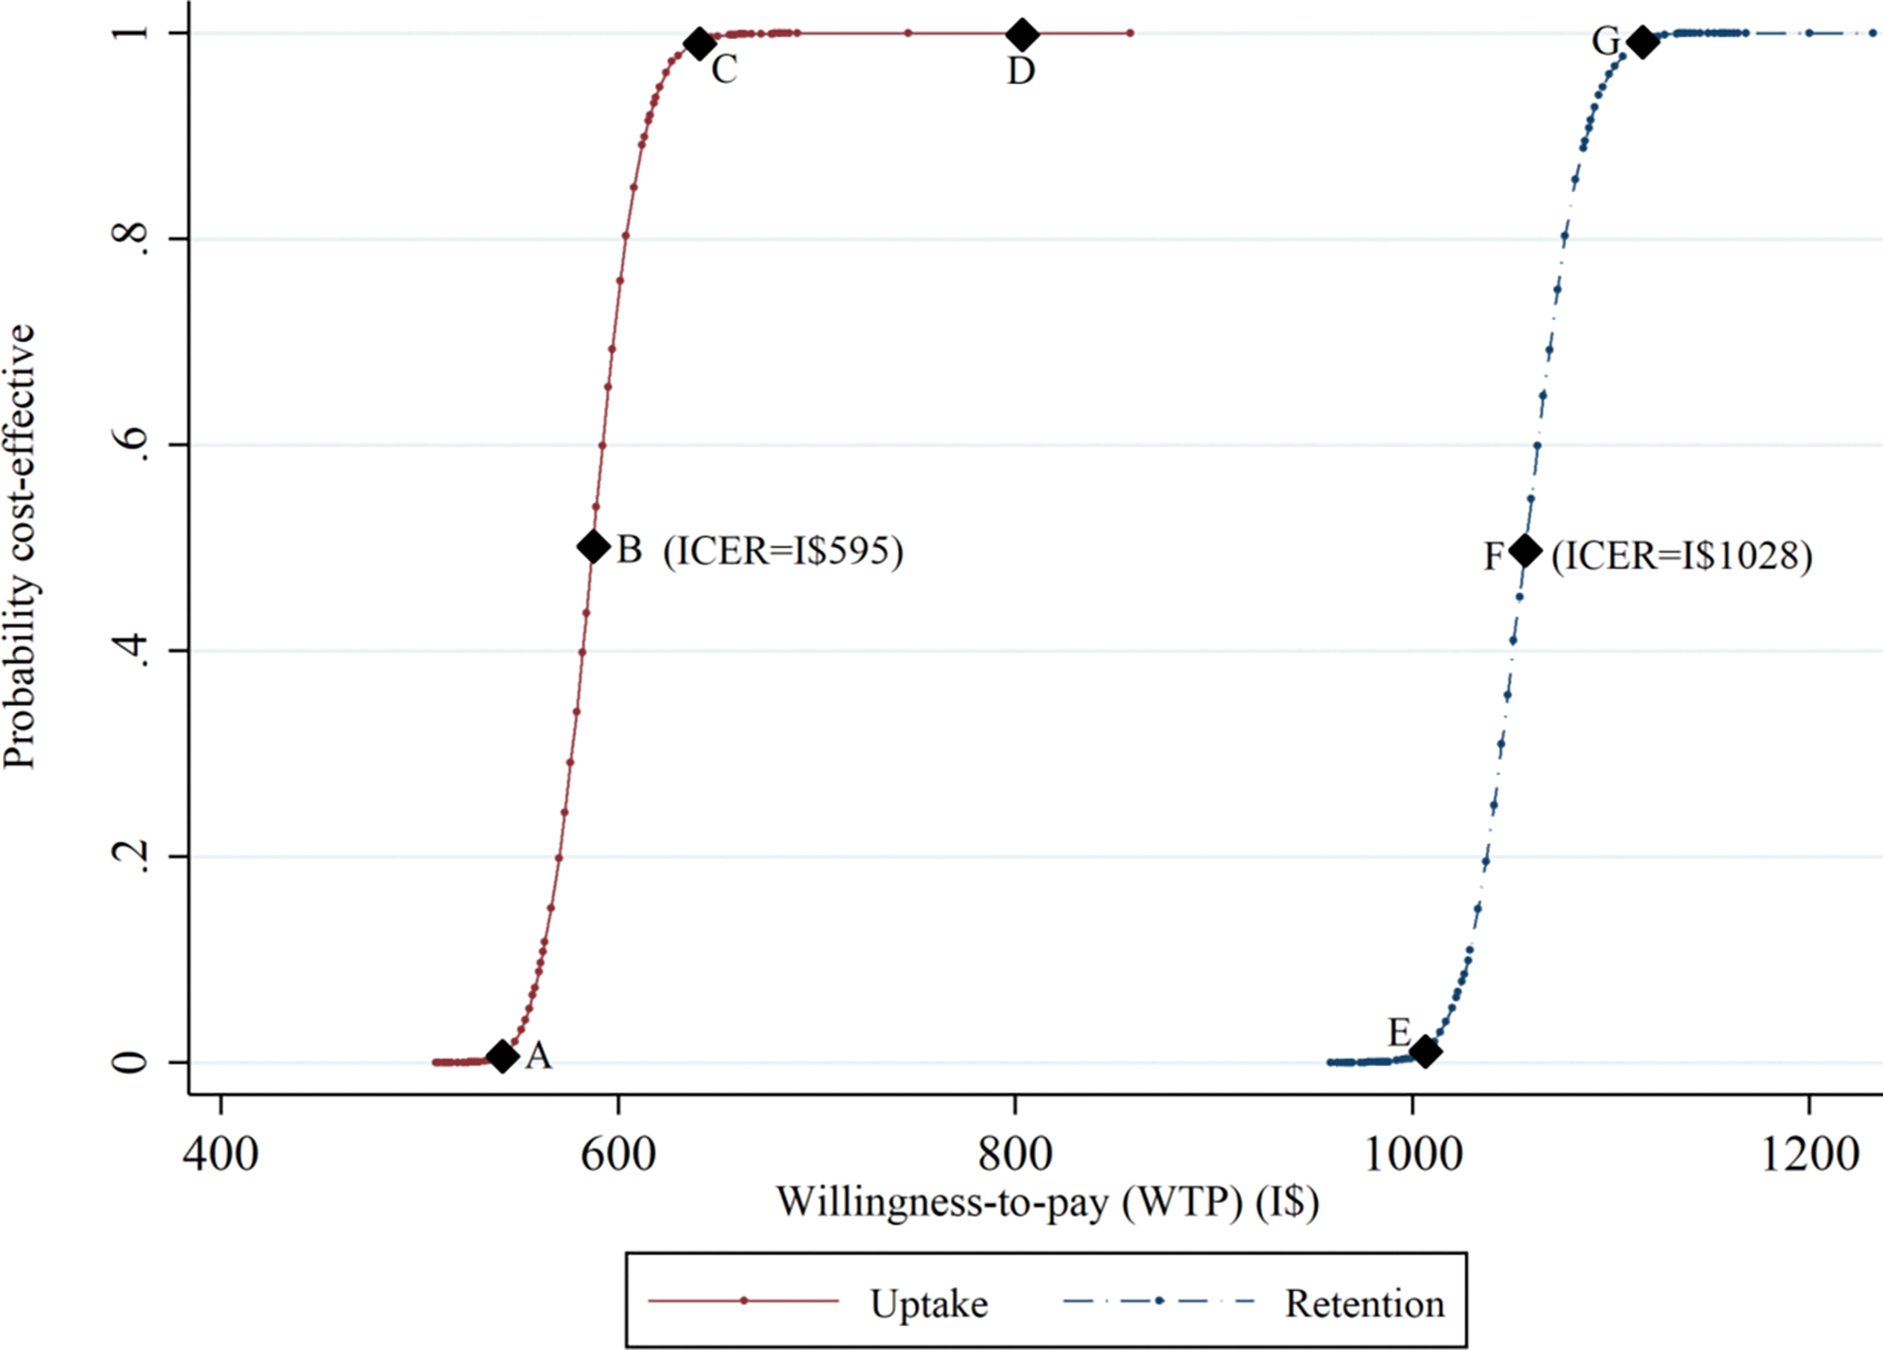
Cost-effectiveness acceptability curve for conditional cash transfers compared to standard PMTCT care.
This figure shows the probability that conditional cash transfers plus standard PMTCT are cost-effective compared to standard PMTCT care alone. The x-axis represents society’s maximum willingness-to-pay for the intervention, while the y-axis shows the probability the intervention is cost-effective at a given willingness-to-pay value. Points B and F correspond to the incremental cost-effectiveness ratio point estimates and have a 0.5 probability of being cost-effective. Given the data and a maximum willingness-to-pay of I$1100 per additional participant taking up PMTCT services or being retained in PMTCT care, the intervention has a 100% chance of being cost-effective. Abbreviations: ICER, incremental cost-effectiveness ratio; PMTCT, prevention of maternal-to-child transmission.
Discussion
The gap in both domestic and international financing for a comprehensive HIV/AIDS response and the need to increase PMTCT coverage call for effective and cost-effective strategies that can halt further transmission of HIV (29, 30). We examined the costs and cost-effectiveness of an innovative intervention—small but increasing cash incentives aimed at increasing PMTCT uptake and retention. The mean total cost per participant was I$516 among women in the intervention group (PMTCT plus cash transfers) compared to I$431 in the standard of care group (PMTCT alone) for an incremental cost of I$85 (95% CI: 59, 111). The incremental cost-effectiveness associated with the intervention was I$594 (95% CI: 550, 638) for an additional woman taking PMTCT services and I$1028 (95% CI: 931, 1125) for an additional woman retained in PMTCT care, compared to the standard of care. The CCTs, which appear to be relatively low cost and not prohibitive, are a certain cost-effective intervention if the society’s willingness-to-pay for an additional woman taking up PMTCT services is at least I$640. In sensitivity analyses, these findings were relatively robust across a variety of assumptions and scenarios.
The current study contributes to a very limited literature on the cost and cost-effectiveness of interventions aimed to improve adherence to ART or retention in HIV care in SSA, and our estimates compare favorably against those found in prior research studies. In Uganda, a family economic empowerment intervention that created savings accounts for adolescents with HIV, deposited money into those accounts, and trained the adolescents and their families in the management of small family businesses increased ART adherence/viral suppression by 9 percentage points for US$970 per additional adolescent virally suppressed (31, 32). Similarly, in Zimbabwe, a peer-supported differentiated service delivery intervention for adolescents with HIV increased the proportion of adolescents virally suppressed by 13.7 percentage points and had an average cost of $1,340 per suppressed adolescent (33), which translated into a cost of $6,485 per additional adolescent virally suppressed in that study. In the current study, the cash incentives increased PMTCT uptake and PMTCT retention by 15 percentage points at a cost of I$594 (US$293) per additional woman taking up PMTCT services and by 9 percentage points at a cost of I$1028 or US$506 per additional woman retained in PMTCT care, respectively. Thus in the context of these closely related studies which also used intermediate outcomes, the cash incentives compare much more favorably in terms of both costs and cost-effectiveness and represent one more important option for decision-makers, particularly in scale-up considerations.
In addition, the current study contributes to an emerging literature on the economic costs and cost-effectiveness of strategies aimed to promote PMTCT uptake beyond the availability of antiretroviral therapy in SSA. This literature has examined the costs and cost-effectiveness of different HIV testing and counseling strategies, alternative infant feeding approaches to prevent postpartum HIV transmission, as well as integration of PMTCT services with other services (34–36). For example, universal HIV testing of all pregnant mothers presenting to antenatal care clinics was cost-effective in multiple countries (37), as were HIV rescreening late in pregnancy in South Africa (38), couple counseling in Kenya (39), and alternative breastfeeding approaches in Zambia (40). Furthermore, a study in Malawi, Uganda, and Mozambique reported that the integration of PMTCT services with maternal, neonatal, and child health at antenatal care clinics was cost-effective in averting pediatric HIV infections (41). Similarly, a study in Kenya reported that the delivery of PMTCT services by civil society organizations was cost-effective compared to PMTCT service delivery in public health facilities (42). While the current study contributes to this literature on the cost and cost-effectiveness of PMTCT interventions, we emphasize that our use of intermediate health outcomes (PMTCT uptake and retention) and short analytic time horizon makes direct comparability with this literature limited. Often, cost-effectiveness studies in the HIV literature use longer analytic time horizons and health outcomes such as HIV infections averted or disability-adjusted life years (DALYs) averted. These outcomes were not used because the trial was too short to assess such outcomes and deriving long-term outcomes for the current study would have required extensive simplifying assumptions (10). For example, we would have to assume that retention observed during the study persisted over a longer period of time, those retained in care were also virally suppressed, and 98% of children born to mothers retained in care were HIV-free vs. 60% among those not retained in care (43–45). However, when applying these simplifying assumptions and related estimates from modeling studies (46, 47) to the current study, by retaining an additional 17 women in HIV care the cash incentives would avert seven (7) infant HIV infections. This translates to a total of 366 DALYs averted (205 among children and 160 among participants due to ART) for an incremental cost-effectiveness ratio of I$49 (US$24) per DALY averted, which compares favorably to the literature (48) and is considered very cost-effective when using widely accepted willingness-to-pay thresholds based on per capita GDP. For the present study, however, we opted to focus on the intermediate outcomes which we believe still serve as an important foundation for future studies that can rigorously evaluate the cost-effectiveness of cash incentives over a longer analytic time horizon and incorporate final, versus intermediate, health outcomes.
Further, this study contributes to a broader, although limited, literature suggesting that cash incentives may be a cost-effective approach for promoting social well-being beyond health. While this literature has generated mixed findings across all income settings, evidence suggests that cash incentives are generally cost-effective in resource-limited settings (7), where the size of the incentive relative to household/individual income is typically high. In these settings, cash incentives were cost-effective in increasing school enrollment and attendance, improving secondary school outcomes (49, 50), increasing household food security, enhancing child development (51), and preventing undernutrition in emergencies (26). Given that the current study did not include all possible benefits of the cash incentive program—such as increases in uptake of family planning services and improvements in overall health-seeking behaviors—it is likely that the current study underestimates the effectiveness of the CCTs, and thus the associated cost-effectiveness ratios reported are conservative.
While the cash incentives compare favorably against closely related initiatives, questions about their affordability or budget impact if scaled-up remain, but overall, they appear to be relatively low cost. These questions about affordability are important as the DRC is a low-income country that heavily relies on development partners for health financing. For example, in 2019 external resources accounted for almost all of DRC’s spending on PMTCT programming and 40% of the country’s US$21 (or I$42) per capita spending on health overall (52). Critically, therefore, with the DRC reporting 29,000 pregnancies among women living with HIV each year (2), giving cash incentives to each of these women at levels implemented in the trial would add to the healthcare budget approximately US$8.5 million or US$0.08 per capita per year. So, in the context of current healthcare spending in the DRC, this back-of-the-envelope analysis suggests that the cost of the cash incentives if added to the existing PMTCT program may not be prohibitive.
This study has several limitations. The primary limitation is that we used intermediate outcomes, versus a more traditional final health outcome measure (e.g., DALYs), for incremental effectiveness analysis, which limits the comparability of the study’s findings with other cost-effectiveness analysis studies. We chose intermediate outcomes that aligned with study outcomes of the original trial, given the short participant follow-up time and therefore numerous, highly uncertain assumptions that would be required to derive final outcomes such as DALYs averted. Notwithstanding, these findings can be incorporated in future studies evaluating the cost-effectiveness of cash incentives over a longer analytic time horizon and using final health outcomes. Moreover, the use of intermediate outcomes in economic evaluations is not uncommon. A randomized controlled trial in the USA used intermediate outcomes (cost per follow-up) to report the costs and effects of an outreach intervention for low-income women with abnormal cervical Pap smears (53). Similarly, in Kenya, an ongoing trial of the cost-effectiveness of CCTs to retain pregnant women in maternal care has proposed to use the proportion of women attending ANC visits and the proportion of women delivering in a health facility as some of the outcome measures (54). Thus, our findings are useful for the DRC and countries in the region that have committed to eliminating vertical HIV transmissions and continue to seek evidence-based strategies that are both effective and cost-effective. We also note that if per capita GDP thresholds were to be used to evaluate the willingness-to-pay for the CCTs, the CCTs would still be cost-effective even at 1x per capita GDP of the DRC which was I$803 in 2016 (55), and would compare favorably against currently implemented interventions, such as Option B+, in the DRC and similar settings (56, 57). However, we chose not to use the base performance of the CCTs on per capita GDP since the threshold is intended for performance assessments with final outcomes (55), and because these thresholds continue to be debated, particularly the ability (or lack of it) to account for the opportunity cost of local resources for implementing interventions in these settings (58–60).
A second limitation is that the trial did not collect detailed cost data, and therefore, we had to rely on external sources, made a series of assumptions, and imputed missing data to estimate the costs which might have biased our findings. Notwithstanding this limitation, extensive sensitivity analyses suggested that our findings were relatively robust, with the cost-effectiveness ratio only about doubling in the worst-case scenario of cost estimates and aligning with other commonly implemented interventions.
A third limitation is that we were unable to assess the cost of implementing the cash incentives during the trial, an aspect that would be important in budget impact analyses and scale-up considerations. These implementation costs may include staff time and wages paying out the cash incentives, technology for maintaining cash transfer records, keeping and moving money to and from banks, as well as additional program supervision and monitoring. Data on implementation costs were also not available from the trial, but we acknowledge that implementation costs are important and would vary by the mode of delivering the cash transfers (in person at the facility vs mobile money platforms), as well as the number of beneficiaries. That said, our experience providing the cash incentives during the trial did not appear to put extra pressure on health system resources, particularly at the implementing sites. If anything, a lack of these estimates may only be critical at the national level where an additional administrative layer would have to be created at the headquarters of the Ministry of Health or Ministry of Finance to coordinate and disburse funds for the cash incentives. In all, findings from the current study still make a valuable contribution to our understanding of adding cash incentives to an existing PMTCT program in an HIV-endemic resource-limited setting despite the lack of estimates of implementation costs. Moreover, intervention and implementation costs can be modeled separately as these provide different pieces of information (61).
Conclusions
Given the low uptake of PMTCT services and the gap in financing for the HIV response, effective and cost-effective strategies to increase the uptake of PMTCT services are critical. CCTs plus PMTCT are more costly and more effective than PMTCT alone. Our findings suggest that cash incentives could be a cost-effective strategy for increasing the uptake of PMTCT services and retention of women in PMTCT care in resource-limited settings, even at a low societal willingness-to-pay threshold. The incremental cost per additional woman taking up PMTCT services could be smaller or bigger depending on the size of the cash incentive provided and the proportion of women already using PMTCT services in a specific setting. With suboptimal uptake of PMTCT services across many settings in SSA, the CCTs would likely be cost-effective in many parts of the region. While further research is needed to understand the cost-effectiveness of the cash incentives in the long term and how to package them with other HIV prevention options, the relatively low cost of the cash transfers and the associated incremental costs suggest the implementation of cash incentives as a clinical and policy response should be an immediate policy priority and will likely accelerate progress toward an AIDS-free generation.
Supplementary Material
Table 2.
Incremental cost-effectiveness of conditional cash transfers compared to standard PMTCT care
| PMTCT Uptake | PMTCT Retention | |||
|---|---|---|---|---|
|
|
||||
| Estimate | 95% CI* | Estimate | 95% CI* | |
|
| ||||
| Incremental effectiveness (NNT) | 7.01 | [6.69, 7.57] | 12.11 | [11.55, 12.81] |
| Incremental cost (2016 I$) | 84.77 | [58.72, 110.82] | 84.77 | [58.72, 110.82] |
| Incremental cost-effectiveness† | 594.54 | [550.04, 638.26] | 1028.23 | [930.99, 1125.26] |
Abbreviations: NNT, number-needed-to-treat; PMTCT, prevention of mother-to-child transmission of HIV.
Confidence intervals were generated using bootstrapping methods, with the exception of incremental costs, which were estimated using regression analysis.
Incremental cost-effectiveness ratios are interpreted as the I$ amount for each additional woman taking up PMTCT services (PMTCT Uptake outcome) and I$ for each additional woman retained in PMTCT care (PMTCT Retention outcome).
Highlights:
Low PMTCT coverage calls for effective, efficient, and scalable interventions
Evaluated costs and cost-effectiveness of cash incentives for PMTCT in the DRC
Cost of cash incentives was I$595 for an additional woman taking up PMTCT services
If scaled, cash incentives add US$0.08 to DRC annual per capita healthcare spending
Acknowledgments
The research reported in this publication was supported by the National Institutes of Health’s National Institute of Allergy and Infectious Diseases (NIAID), the Eunice Kennedy Shriver National Institute of Child Health & Human Development (NICHD), the National Cancer Institute (NCI), the National Institute on Drug Abuse (NIDA), the National Heart, Lung, and Blood Institute (NHLBI), the National Institute on Alcohol Abuse and Alcoholism (NIAAA), the National Institute of Diabetes and Digestive and Kidney Diseases (NIDDK), the Fogarty International Center (FIC), the National Library of Medicine (NLM), the Office of the Director (OD) under Award Number U01AI096299 (Central Africa-IeDEA), and internal funds at Virginia Commonwealth University (VCU) for SPM’s doctoral research. The content is solely the responsibility of the authors and does not necessarily represent the official views of the National Institutes of Health or VCU.
Footnotes
Competing Interests
The authors have no competing interests to declare.
Publisher's Disclaimer: This is a PDF file of an unedited manuscript that has been accepted for publication. As a service to our customers we are providing this early version of the manuscript. The manuscript will undergo copyediting, typesetting, and review of the resulting proof before it is published in its final form. Please note that during the production process errors may be discovered which could affect the content, and all legal disclaimers that apply to the journal pertain.
References
- 1.UNAIDS . Start Free Stay Free AIDS Free — 2017 progress report 2018. [Available from: http://www.unaids.org/en/resources/documents/2018/start-free-stay-free-aids-free-2017-progress-report]. Accessed 14 April 2018.
- 2.UNAIDS. How AIDS changed everything 2015. [updated 2015. Available from: http://www.unaids.org/sites/default/files/media_asset/MDG6Report_en.pdf]. Accessed.
- 3.UNAIDS. Country factsheets: Democratic Republic of the Congo, 2021 2021. [cited 2022 17 November]. Available from: https://aidsinfo.unaids.org/]. Accessed 15 November 2022.
- 4.World Health Organization. Treat all people living with HIV, offer antiretrovirals as additional prevention choice for people at “substantial” risk 2015. [Available from: https://www.who.int/mediacentre/news/releases/2015/hiv-treat-all-recommendation/en/]. Accessed 18 March 2017.
- 5.Maartens G, Celum C, Lewin SR. HIV infection: epidemiology, pathogenesis, treatment, and prevention. Lancet (London, England). 2014;384(9939):258–71. [DOI] [PubMed] [Google Scholar]
- 6.UNAIDS. Fact sheet: Latest statistics on the status of the AIDS epidemic 2018. [Available from: http://www.unaids.org/en/resources/fact-sheet]. Accessed 11 December 2018.
- 7.Diepeveen S, Stolk Cv. How effective are CCTs in low income settings? 2012. [Available from: https://www.rand.org/content/dam/rand/pubs/working_papers/2012/RAND_WR960.pdf]. Accessed 30 September 2017.
- 8.Fizbein A, Schady N. Conditional Cash Transfers: Reducing Present and Future Poverty. Washington: World Bank; 2009. https://openknowledge.worldbank.org/bitstream/handle/10986/2597/476030PUB0Cond101Official0Use0Only1.pdf?sequence=1&isAllowed=y. Accessed. [Google Scholar]
- 9.Gourlay A, Birdthistle I, Mburu G, Iorpenda K, Wringe A. Barriers and facilitating factors to the uptake of antiretroviral drugs for prevention of mother-to-child transmission of HIV in sub-Saharan Africa: a systematic review. J Int AIDS Soc. 2013;16(1). [DOI] [PMC free article] [PubMed] [Google Scholar]
- 10.Yotebieng M, Thirumurthy H, Moracco KE, Kawende B, Chalachala JL, Wenzi LK, et al. Conditional cash transfers and uptake of and retention in prevention of mother-to-child HIV transmission care: a randomised controlled trial. The Lancet HIV. 2016;3(2):e85–e93. [DOI] [PMC free article] [PubMed] [Google Scholar]
- 11.PEPFAR. Democratic Republic of the Congo Country Operational Plan (COP) 2020: Strategic Direction Summary 2020. [cited 2022 22 Ocotber 2022]. Available from: https://www.state.gov/wp-content/uploads/2020/07/COP-2020-DRC-SDS-FINAL.pdf]. Accessed 22 October 2022.
- 12.The World Bank. World Bank Country and Lending Groups: Country classification 2016. [Available from: https://datahelpdesk.worldbank.org/knowledgebase/articles/906519-world-bank-country-and-lending-groups]. Accessed 19 November 2017.
- 13.Clinton Health Access I. 2015 antiretroviral (ARV) CHAI reference price list. 2016. [Google Scholar]
- 14.Hutton G, Baltussen R. Cost valuation in resource-poor settings. Health Policy Plan. 2005;20(4):252–9. [DOI] [PubMed] [Google Scholar]
- 15.The World Bank. Price level ratio of PPP conversion factor (GDP) to market exchange rate 2017. [Available from: https://data.worldbank.org/indicator/PA.NUS.PPPC.RF]. Accessed 17 November 2017.
- 16.The World Bank. GDP deflator: Linked series (base year varies by country) 2017. [Available from: https://data.worldbank.org/indicator/NY.GDP.DEFL.ZS.AD]. Accessed 14 August 2018.
- 17.Hardin JW. Generalized estimating equations. Second edition.. ed: Boca Raton, FL: : CRC Press; 2013. 2013. [Google Scholar]
- 18.Barber JA, Thompson SG. Analysis of cost data in randomized trials: an application of the non-parametric bootstrap. Stat Med. 2000;19(23):3219–36. [DOI] [PubMed] [Google Scholar]
- 19.Cui J QIC program and model selection in GEE analyses. Stata journal. 2007;7(2):209. [Google Scholar]
- 20.Zou G A modified Poisson regression approach to prospective studies with binary data. Am J Epidemiol. 2004;159(7):702–6. [DOI] [PubMed] [Google Scholar]
- 21.Laupacis A, Sackett DL, Roberts RS. An assessment of clinically useful measures of the consequences of treatment. N Engl J Med. 1988;318(26):1728–33. [DOI] [PubMed] [Google Scholar]
- 22.Chaudhary MA, Stearns SC. Estimating confidence intervals for cost-effectiveness ratios: an example from a randomized trial. Stat Med. 1996;15(13):1447–58. [DOI] [PubMed] [Google Scholar]
- 23.Ramsey S, Willke R, Briggs A, Brown R, Buxton M, Chawla A, et al. Good research practices for cost-effectiveness analysis alongside clinical trials: the ISPOR RCT-CEA task force report. Value Health. 2005;8(5):521–33. [DOI] [PubMed] [Google Scholar]
- 24.Morris TP, White IR, Royston P. Tuning multiple imputation by predictive mean matching and local residual draws. BMC Med Res Methodol. 2014;14(1):75. [DOI] [PMC free article] [PubMed] [Google Scholar]
- 25.Andronis L, Barton P, Bryan S. Sensitivity analysis in economic evaluation: an audit of NICE current practice and a review of its use and value in decision-making. Health TechnolAssess. 2009;13(29):iii,-ix-xi, 1–61. [DOI] [PubMed] [Google Scholar]
- 26.Trenouth L, Colbourn T, Fenn B, Pietzsch S, Myatt M, Puett C. The cost of preventing undernutrition: cost, cost-efficiency and cost-effectiveness of three cash-based interventions on nutrition outcomes in Dadu, Pakistan. Health Policy Plan. 2018;33(6):743–54. [DOI] [PMC free article] [PubMed] [Google Scholar]
- 27.Briggs A Handling uncertainty in cost-effectiveness models. Pharmacoeconomics. 2000;17(5):479–500. [DOI] [PubMed] [Google Scholar]
- 28.Fenwick E, Byford S. A guide to cost-effectiveness acceptability curves. Br J Psychiatry. 2005;187:106–8. [DOI] [PubMed] [Google Scholar]
- 29.Resch S, Ryckman T, Hecht R. Funding AIDS programmes in the era of shared responsibility: an analysis of domestic spending in 12 low-income and middle-income countries. The Lancet Global Health. 2015;3(1):e52–e61. [DOI] [PubMed] [Google Scholar]
- 30.Schneider MT, Birger M, Haakenstad A, Singh L, Hamavid H, Chapin A, et al. Tracking development assistance for HIV/AIDS: the international response to a global epidemic. AIDS (London, England). 2016;30(9):1475–9. [DOI] [PMC free article] [PubMed] [Google Scholar]
- 31.Tozan Y, Capasso A, Sun S, Neilands TB, Damulira C, Namuwonge F, et al. The efficacy and cost-effectiveness of a family-based economic empowerment intervention (Suubi + Adherence) on suppression of HIV viral loads among adolescents living with HIV: results from a Cluster Randomized Controlled Trial in southern Uganda. J Int AIDS Soc. 2021;24(6):e25752. [DOI] [PMC free article] [PubMed] [Google Scholar]
- 32.Ssewamala FM, Byansi W, Bahar OS, Nabunya P, Neilands TB, Mellins C, et al. Suubi+Adherence study protocol: A family economic empowerment intervention addressing HIV treatment adherence for perinatally infected adolescents. Contemporary clinical trials communications. 2019;16:100463. [DOI] [PMC free article] [PubMed] [Google Scholar]
- 33.Mavhu W, Willis N, Mufuka J, Bernays S, Tshuma M, Mangenah C, et al. Effect of a differentiated service delivery model on virological failure in adolescents with HIV in Zimbabwe (Zvandiri): a cluster-randomised controlled trial. The Lancet Global Health. 2020;8(2):e264–e75. [DOI] [PubMed] [Google Scholar]
- 34.Binagwaho A, Pegurri E, Drobac PC, Mugwaneza P, Stulac SN, Wagner CM, et al. Prevention of mother-to-child transmission of HIV: cost-effectiveness of antiretroviral regimens and feeding options in Rwanda. PLoS One. 2013;8(2):e54180. [DOI] [PMC free article] [PubMed] [Google Scholar]
- 35.Johri M, Ako-Arrey D. The cost-effectiveness of preventing mother-to-child transmission of HIV in low-and middle-income countries: systematic review. Cost Effectiveness and Resource Allocation. 2011;9(1):1–16. [DOI] [PMC free article] [PubMed] [Google Scholar]
- 36.Kuznik A, Lamorde M, Hermans S, Castelnuovo B, Auerbach B, Semeere A, et al. Evaluating the cost-effectiveness of combination antiretroviral therapy for the prevention of mother-to-child transmission of HIV in Uganda. Bull World Health Organ. 2012;90(8):595–603. [DOI] [PMC free article] [PubMed] [Google Scholar]
- 37.Ishikawa N, Dalal S, Johnson C, Hogan DR, Shimbo T, Shaffer N, et al. Should HIV testing for all pregnant women continue? Cost-effectiveness of universal antenatal testing compared to focused approaches across high to very low HIV prevalence settings. J Int AIDS Soc. 2016;19(1). [DOI] [PMC free article] [PubMed] [Google Scholar]
- 38.Soorapanth S, Sansom S, Bulterys M, Besser M, Theron G, Fowler MG. Cost-effectiveness of HIV rescreening during late pregnancy to prevent mother-to-child HIV transmission in South Africa and other resource-limited settings. JAcquirImmune DeficSyndr. 2006;42(2):213–21. [DOI] [PubMed] [Google Scholar]
- 39.John FN, Farquhar C, Kiarie JN, Kabura MN, John-Stewart GC. Cost effectiveness of couple counselling to enhance infant HIV-1 prevention. Int J STD AIDS. 2008;19(6):406–9. [DOI] [PMC free article] [PubMed] [Google Scholar]
- 40.Maclean CC, Stringer JSA. Potential cost-effectiveness of maternal and infant antiretroviral interventions to prevent mother-to-child transmission during breast-feeding. JAIDS Journal of Acquired Immune Deficiency Syndromes. 2005;38(5):570–7. [DOI] [PubMed] [Google Scholar]
- 41.Bollinger L, Adesina A. Cost-effectiveness of integrating PMTCT and MNCH services: an application of the LiST model for Malawi Mozambique and Uganda: DHS; 2013. [Available from: https://dhsprogram.com/pubs/pdf/OP7/OP7.pdf]. Accessed 16 March 2017.
- 42.Avila C, Cali J, Cico A, Yemaneberhan A. Evaluating service delivery models for prevention of mother-to-child transmission of HIV: Cost and effectiveness of providing PMTCT services in public private and civil society organizations. Arlington, VA, USA: Strengthening High Impact Interventions for an AIDSfree Generation (AIDSFree) Project; 2016; 2016. https://pdfs.semanticscholar.org/9043/8291631a139e8a526dac18caa848b9f39922.pdf?_ga=2.116543750.1811187543.1592129229-808058917.1591633652. Accessed 2016 Accessed. [Google Scholar]
- 43.Agabu A, Baughman AL, Fischer-Walker C, de Klerk M, Mutenda N, Rusberg F, et al. National-level effectiveness of ART to prevent early mother to child transmission of HIV in Namibia. PLoS One. 2020;15(11):e0233341. [DOI] [PMC free article] [PubMed] [Google Scholar]
- 44.Shapiro RL, Hughes MD, Ogwu A, Kitch D, Lockman S, Moffat C, et al. Antiretroviral regimens in pregnancy and breast-feeding in Botswana. N Engl J Med. 2010;362(24):2282–94. [DOI] [PMC free article] [PubMed] [Google Scholar]
- 45.Centers for Disease Control and Prevention. Impact of an Innovative Approach to Prevent Mother-to-Child Transmission of HIV — Malawi, July 2011–September 2012 2013 [cited 2022 03 November]. Available from: https://www.cdc.gov/mmwr/preview/mmwrhtml/mm6208a3.htm]. Accessed 03 November 2022. [PMC free article] [PubMed]
- 46.Bershteyn A, Jamieson L, Kim H-Y, Platais I, Milali MP, Mudimu E, et al. Transmission reduction, health benefits, and upper-bound costs of interventions to improve retention on antiretroviral therapy: a combined analysis of three mathematical models. The Lancet Global Health. 2022;10(9):e1298–e306. [DOI] [PMC free article] [PubMed] [Google Scholar]
- 47.Emerson J, Kim D. Disability-Adjusted Life Year conversion [cited 2022 24 November]. Available from: http://ghcearegistry.org/ghcearegistry/2018_10_09_TUFTSMC_CaseStudy_HIV_DALY.pdf]. Accessed 18 November 2022. [Google Scholar]
- 48.Sarkar S, Corso P, Ebrahim-Zadeh S, Kim P, Charania S, Wall K. Cost-effectiveness of HIV Prevention Interventions in Sub-Saharan Africa: A Systematic Review. eClinicalMedicine. 2019;10:10–31. [DOI] [PMC free article] [PubMed] [Google Scholar]
- 49.Coady DP, Parker SW. Cost-effectiveness analysis of demand-and supply-side education interventions: the case of PROGRESA in Mexico. Review of Development Economics. 2004;8(3):440–51. [Google Scholar]
- 50.García S, Saavedra JE. Educational impacts and cost-effectiveness of conditional cash transfer programs in developing countries. Review of Educational Research. 2017;87(5):921–65. [Google Scholar]
- 51.Gilligan D, Margolies A, Quiñones E, Roy S. Impact evaluation of cash and food transfers at early childhood development centers in Karamoja, Uganda. 2013 19 February 2018. https://documents.wfp.org/stellent/groups/public/documents/resources/wfp257677.pdf. Accessed 19 February 2018 Accessed. [Google Scholar]
- 52.WHO. Global Health Expenditure Database 2021. [cited 2022 10 October]. Available from: https://apps.who.int/nha/database/ViewData/Indicators/en]. Accessed 10 October 2022.
- 53.Wagner TH, Engelstad LP, McPhee SJ, Pasick RJ. The Costs of an Outreach Intervention for Low-Income Women With Abnormal Pap Smears. Prev Chronic Dis. 2006;4(1):A11. [PMC free article] [PubMed] [Google Scholar]
- 54.Batura N, Skordis J, Palmer T, Odiambo A, Copas A, Vanhuyse F, et al. Cost-effectiveness of conditional cash transfers to retain women in the continuum of care during pregnancy, birth and the postnatal period: protocol for an economic evaluation of the Afya trial in Kenya. BMJ Open. 2019;9(11):e032161. [DOI] [PMC free article] [PubMed] [Google Scholar]
- 55.Edejer T-T, Baltussen R, Adam T, Hutubessy R, Acharya A, Evans DB, et al. Making choices in health: WHO guide to cost-effectiveness analysis. Geneva, Switzerland: WHO; 2003 12 April 2017. https://www.who.int/choice/publications/p_2003_generalised_cea.pdf?ua=1. Accessed 12 April 2017 Accessed. [Google Scholar]
- 56.Fasawe O, Avila C, Shaffer N, Schouten E, Chimbwandira F, Hoos D, et al. Cost-effectiveness analysis of option B for HIV prevention and treatment of mothers and children in Malawi. PLoS One. 2013;8(3):e57778. [DOI] [PMC free article] [PubMed] [Google Scholar]
- 57.VanDeusen A, Paintsil E, Agyarko-Poku T, Long EF. Cost effectiveness of Option B plus for prevention of mother-to-child transmission of HIV in resource-limited countries: evidence from Kumasi, Ghana. BMC Infect Dis. 2015;15(1):130. [DOI] [PMC free article] [PubMed] [Google Scholar]
- 58.Jamison DT, Summers LH, Alleyne G, Arrow KJ, Berkley S, Binagwaho A, et al. Global health 2035: a world converging within a generation. Lancet (London, England). 2013;382(9908):1898–955. [DOI] [PubMed] [Google Scholar]
- 59.Marseille E, Larson B, Kazi DS, Kahn JG, Rosen S. Thresholds for the cost–effectiveness of interventions: alternative approaches. Bull World Health Organ. 2014;93(2):118–24. [DOI] [PMC free article] [PubMed] [Google Scholar]
- 60.Woods B, Revill P, Sculpher M, Claxton K. Country-level cost-effectiveness thresholds: initial estimates and the need for further research. Value Health. 2016;19(8):929–35. [DOI] [PMC free article] [PubMed] [Google Scholar]
- 61.Wagner TH, Yoon J, Jacobs JC, So A, Kilbourne AM, Yu W, et al. Estimating Costs of an Implementation Intervention. Medical Decision Making: An International Journal of the Society for Medical Decision Making. 2020;40(8):959–67. [DOI] [PubMed] [Google Scholar]
Associated Data
This section collects any data citations, data availability statements, or supplementary materials included in this article.