

Abstract
Castration-resistant prostate cancer (CRPC) is the main driving force of mortality in prostate cancer patients. Among the parameters contributing to the progression of CRPC and treatment failure, elevation of the steroidogenic enzyme AKR1C3 and androgen receptor variant 7 (AR-V7) are frequently reported. The AKR1C3/AR-V7 complex has been recognized as a major driver for drug resistance in advanced prostate cancer. Herein we report that the level of AKR1C3 is reciprocally regulated by the full-length androgen receptor (AR-FL) through binding to the distal enhancer region of the AKR1C3 gene. A novel function of PTUPB in AKR1C3 inhibition was discovered and PTUPB showed more effectiveness than indomethacin and celecoxib in suppressing AKR1C3 activity and CRPC cell growth. PTUPB synergizes with enzalutamide treatment in tumor suppression and gene signature regulation. Combination treatments with PTUPB and enzalutamide provide benefits by blocking AR/AR-V7 signaling, which inhibits the growth of castration relapsed VCaP xenograft tumors and patient-derived xenograft organoids. Targeting of the ARK1C3/AR/AR-V7 axis with PTUPB and enzalutamide may overcome drug resistance to AR signaling inhibitors in advanced prostate cancer.
INTRODUCTION
Intracrine androgen biosynthesis has been suggested to contribute to the rise in castration-resistant prostate cancer (CRPC) after androgen deprivation therapy (ADT) [1–3]. Whether through the canonical, alternative, or backdoor pathway, tumor cells convert cholesterol into steroids with the final step of ketone reduction being the reductase activity of Aldo-keto Reductase 1C3 (AKR1C3 or 17β-Hydroxysteroid dehydrogenase type 5), specifically catalyzing the conversion of androstenedione (Δ4-dione) and 5α-androstanedione to testosterone and 5α-dihydrotestosterone (DHT), respectively. Multiple reports have shown the upregulation of AKR1C3 in CRPC patient tumors, and the level of this biosynthetic enzyme is promoted upon the administration of androgen receptor signaling inhibitors (ARSI) such as abiraterone, enzalutamide, and apalutamide [2, 4–8]. A feedback loop under androgen deprivation releases the androgen receptor (AR) from suppressing and enhancing TMPRSS2-ERG to promote AKR1C3 expression [9]. AKR1C3 also has the moonlighting function of binding to AR/AR-V7 and stabilizing its expression [10]. Therefore, it has been suggested that a combination of ARSI and AKR1C3 inhibitors is essential for managing CRPC.
Numerous AKR1C3 inhibitors have been developed, many of which are derived from natural products, modified from nonsteroidal anti-inflammatory drug analogs (NSAID), or specifically synthesized to target the active site [11]. Although they have shown good specificity and efficacy in vitro and in mouse xenograft tumor models, very few AKR1C3 inhibitors have been investigated in clinical settings. One AKR1C3 inhibitor, ASP9521, which was tested in a clinical trial for CRPC, was terminated due to a lack of clinical therapeutic activity (NCT01352208). Another ongoing trial is to use a combination of indomethacin and enzalutamide for the treatment of CRPC [12]. To date, none of the AKR1C3 inhibitors have shown promising results in the clinical setting. Thus, there is an unmet need to develop superior AKR1C3 inhibitors for clinical testing.
Celecoxib, a selective cyclooxygenase-2 (COX-2) inhibitor, is used worldwide to treat pain and inflammation in adults. A previous study showed that it can suppress AKR1C3 activity at physiological concentrations [13]. Dual inhibition of COX-2 and soluble epoxide hydrolase (sEH) in lipid metabolism pathways exhibited more enhanced antiallodynic activity than either a combination treatment or an inhibitor alone for the respective pathway. Moreover, dual inhibition synergistically reduces tumor angiogenesis, resulting in the suppression of primary tumor growth and metastasis. The dual COX-2/sEH inhibitor, 4-(5-phenyl-3-{3-[3-(4-trifluoromethyl-phenyl)-ureido]-propyl}-pyrazol-1-yl)-benzenesulfonamide (PTUPB) [14, 15], synthesized by linking two pharmacophores from celecoxib and 1-trifluoromethoxyphe-nyl-3-(1-propionylpiperidin-4-yl)urea (TPPU, a selective sEH inhibitor), has demonstrated significant therapeutic advantages in liver, bladder, and ovarian cancers [15–18]. Surprisingly, PTUPB displayed superior AKR1C3 binding in computer simulation and inhibited AKR1C3 enzymatic activity. Therefore, we tested the effects of PTUPB alone and in combination with enzalutamide in drug resistant AKR1C3 elevated prostate cancer cells and novel patient-derived cell and organoid models.
Here we found that full-length AR binds to the AKR1C3 enhancer region and suppresses its expression; thus, targeting AR signaling inevitably increases AKR1C3 expression. PTUPB significantly inhibits prostate cancer growth and intracrine androgen synthesis by binding to AKR1C3 and blocking its activity. Furthermore, PTUPB inhibits CRPC proliferation by suppressing the AKR1C3/AR/AR-V7 axis and is more effective and superior to indomethacin. Notably, PTUPB showed much better efficacy than indomethacin in castration-relapsed VCaP xenograft, patient-derived xenograft (PDX) organoid, and cell models generated from advanced prostate cancer patients. Our study provides a strong rationale for targeting AKR1C3/AR/AR-V7 using PTUPB as a potential therapeutic strategy to overcome resistance to ARSI treatment in patients with CRPC.
RESULTS
The AR-FL negatively regulates AKR1C3 and AR-V7 expression in advanced prostate cancer
Our previous study showed that chronic ARSI treatment significantly upregulates AKR1C3 and AR-V7 expression [19]. Although both AR-FL and AKR1C3 were upregulated in patients with mCRPC, the correlation between AR-FL and AKR1C3 is unknown. As such, we interrogated TCGA datasets and discovered a negative correlation between AR signaling and AKR1C3 expression. As shown in Fig. 1A, AKR1C3 mRNA levels were negatively correlated with the AR, KLK3, NKX3–1, and TMPRSS2 mRNA levels. Similar results were found in the Stand Up to Cancer/Prostate Cancer Foundation (SU2C/PCF) patient cohort (Supplementary Fig. S1A). Additionally, AKR1C3 expression significantly stratified overall survival and progression-free survival in prostate cancer patients; higher expression correlated with worse outcome (Supplementary Fig. S1B) [20]. To determine whether AR pathway inhibition affected AKR1C3 expression, ARSI-resistant C4–2B MDVR and C4–2B AbiR cells were treated with different concentrations of enzalutamide. As shown in Fig. 1B, enzalutamide significantly increased AKR1C3 mRNA expression in both the drug-resistant cell lines. The results were further confirmed by measuring protein levels using western blotting. AKR1C3 protein expression was increased by enzalutamide or abiraterone treatment in a dose-dependent manner (Fig. 1C). To further determine whether the AR protein affects AKR1C3 expression, AR-FL or AR-V7 was knocked down in C4–2B MDVR cells. The data show only knockdown of AR-FL, but not AR-V7, significantly increased AKR1C3 mRNA expression (Fig. 1D). Western blotting data confirmed that AR-FL knockdown significantly increased AKR1C3 and AR-V7 protein expression; however, AR-V7 knockdown did not affect AKR1C3 or AR-FL protein expression (Fig. 1E). The results were also confirmed in VCaP cells. As shown in Supplementary Fig. S1C, knockdown of AR-FL significantly increased expression of AKR1C3 in the charcoal-stripped FBS (CS-FBS) condition. DHT significantly suppressed both AR-FL and AKR1C3 expression. However, DHT cannot decrease the expression of AKR1C3 when AR-FL was knocked down. Further chromatin immunoprecipitation sequencing (ChIP-Seq) data analysis revealed that DHT treatment significantly enhanced AR binding to the AKR1C3 enhancer region in VCaP cells (−50 kb of the transcription start site); however, this binding was diminished by enzalutamide treatment (Fig. 1F) [21, 22]. Next, we treated VCaP cells, with DHT with or without enzalutamide in CS-FBS condition. As shown in Fig. 1G, H and Supplementary Fig. S1D, DHT significantly suppressed the expression of AKR1C3, AR, and AR variants (AR-V1, AR-V3, AR-V4, AR-V5, and AR-V7) but activated KLK3 expression in VCaP cells; however, these inhibitory effects were reversed by enzalutamide. ChIP-qPCR results confirmed AR occupancy in the AKR1C3 enhancer region upon DHT stimulation (Fig. 1I and Supplementary Fig. S1E). Collectively, these data suggested that AR-FL negatively regulates AKR1C3 transcription in advanced prostate cancer cells. Targeting AR-FL inevitably increases AKR1C3 and AR-V7 expression and promotes therapeutic resistance.
Fig. 1. AR negatively regulates AKR1C3 expression in CRPC.

A The gene expression data from TCGA database was extracted, and AR, KLK3, NKX3–1, TMPRSS2, and AKR1C3 correlations were determined by Spearman correlation. B C4–2B MDVR and C4–2B AbiR cells were treated at 10 and 20 μM concentrations of enzalutamide for 3 days. The levels of AKR1C3 mRNA were determined. C C4–2B MDVR and C4–2B AbiR cells were treated enzalutamide or abiraterone for 3 days. The protein levels of AKR1C3 were determined. D, E AR-FL or AR-V7 was knocked down in C4–2B MDVR cells, mRNA and protein levels of AR-FL, AR-V7, and AKR1C3 were determined. F Genome browser view showing DHT treatment increased AR binding on the AKR1C3 enhancer at different time points. However, enzalutamide treatment blocked the DHT induced AR binding on the AKR1C3 enhancer in VCaP AR ChIP-Seq data. G VCaP cells were treated with 10 nM DHT with or without 20 μM enzalutamide for 5 days, mRNA expression of AKR1C3, AR-FL and AR-V7 were examined by qRT-PCR. H VCaP cells were treated with different concentrations of DHT with or without enzalutamide for 5 days. AKR1C3, AR-FL, and AR-V7 were examined by western blot. I ChIP-qPCR of the AR occupancy at the AKR1C3 enhancer by DHT treatment (10 nM, 24 h) in VCaP cells. Enza: enzalutamide, Abi: abirateorne. *p < 0.05. Results are the mean of three independent experiments (±SD).
PTUPB is a novel AKR1C3 inhibitor which blocks intracrine androgen biosynthesis
Targeting the AKR1C3/AR/AR-V7 axis is an ideal strategy to suppress prostate cancer progression and reverse enzalutamide or abiraterone resistance [4–6]. The dual COX-2/sEH inhibitor PTUPB was developed by linking the non-cleavable three-methylene chains between pyrazole ring of celecoxib and the urea group of TPPU (Fig. 2A). Based on our previous studies, we initially anticipated the transcriptional downregulation of predominantly inflammatory prostaglandins and the preservation of inflammation-resolving epoxy fatty acids in prostate cancer. However, through AutoDock computational simulation, we found PTUPB bound to the active site pocket of AKR1C3 with a binding affinity (the more negative of the free binding energy, the stronger the formation of the binding complexes) of −10.2 kcal/mol: superior to celecoxib (−8.7 kcal/mol), TPPU (−6.2 kcal/mol), and indomethacin (−8.1 kcal/mol). Docking simulations of the AKR1C3/NADP+/PTUPB ternary structure suggested that PTUPB has a more favorable position in the AKR1C3 binding pocket. Specifically, PTUPB was anchored by forming H-bonds with Tyr216 and Phe306 (2.9 Å and 2.6 Å respectively) (Fig. 2B). In the AKR1C3 enzyme activity assay, AKR1C3 activity was significantly inhibited, which was more potent than that of celecoxib, TPPU, indomethacin, or enzalutamide (Fig. 2C). The IC50 of PTUPB in AKR1C3 inhibition is around 65 nM. To further determine the role of PTUPB in AKR1C3 enzyme inhibition, we measured Δ4-dione mediated steroid metabolite levels in C4–2B parental and C4–2B MDVR cells using liquid chromatography-mass spectrometry (LC/MS). As shown in Fig. 2D–F, Δ4-dione significantly induced higher testosterone and DHT levels in C4–2B MDVR cells than in C4–2B parental cells (18-fold and 3.5-fold, respectively), suggesting that AKR1C3 is overexpressed and functionally active in C4–2B MDVR cells. However, both testosterone and DHT levels induced by Δ4-dione in C4–2B MDVR cells were significantly decreased by PTUPB treatment. Levels of other steroid metabolites were also assessed. Intracellular 5α-Dione levels were significantly lower in C4–2B MDVR cells than in C4–2B parental cells after Δ4-dione stimulation, indicating that testosterone synthesis mediated by Δ4-dione in C4–2B MDVR cells was mainly through the canonical pathway. Δ4-dione levels were significantly lower in C4–2B MDVR cells than in C4–2B parental cells after Δ4-dione stimulation, suggesting a higher substrate metabolism activity of AKR1C3 in C4–2B MDVR cells (Supplementary Fig. S2A). The backdoor pathway metabolite androsterone, induced by Δ4-dione, was higher in C4–2B MDVR cells and suppressed by PTUPB treatment (Supplementary Fig. S2B). Δ4-dione induced pregnenolone levels were similar in C4–2B parental and C4–2B MDVR cells (Supplementary Fig. S2C). However, Δ4-dione induced progesterone, 5-pregnan-3,20-dione and pregnan-3-ol-20-one levels were significantly lower in C4–2B MDVR cells and the levels were not affected by PTUPB (Supplementary Fig. S2D–2F), implying that the alternative pregnenolone metabolism pathway in cardenolide biosynthesis was significantly blocked in C4–2B MDVR cells. Taken together, we identified a novel function of PTUPB, demonstrating promising results for AKR1C3 inhibition and androgen synthesis blockage.
Fig. 2. A novel AKR1C3 inhibitor-PTUPB suppresses the AKR1C3 activity and intracrine androgen synthesis.
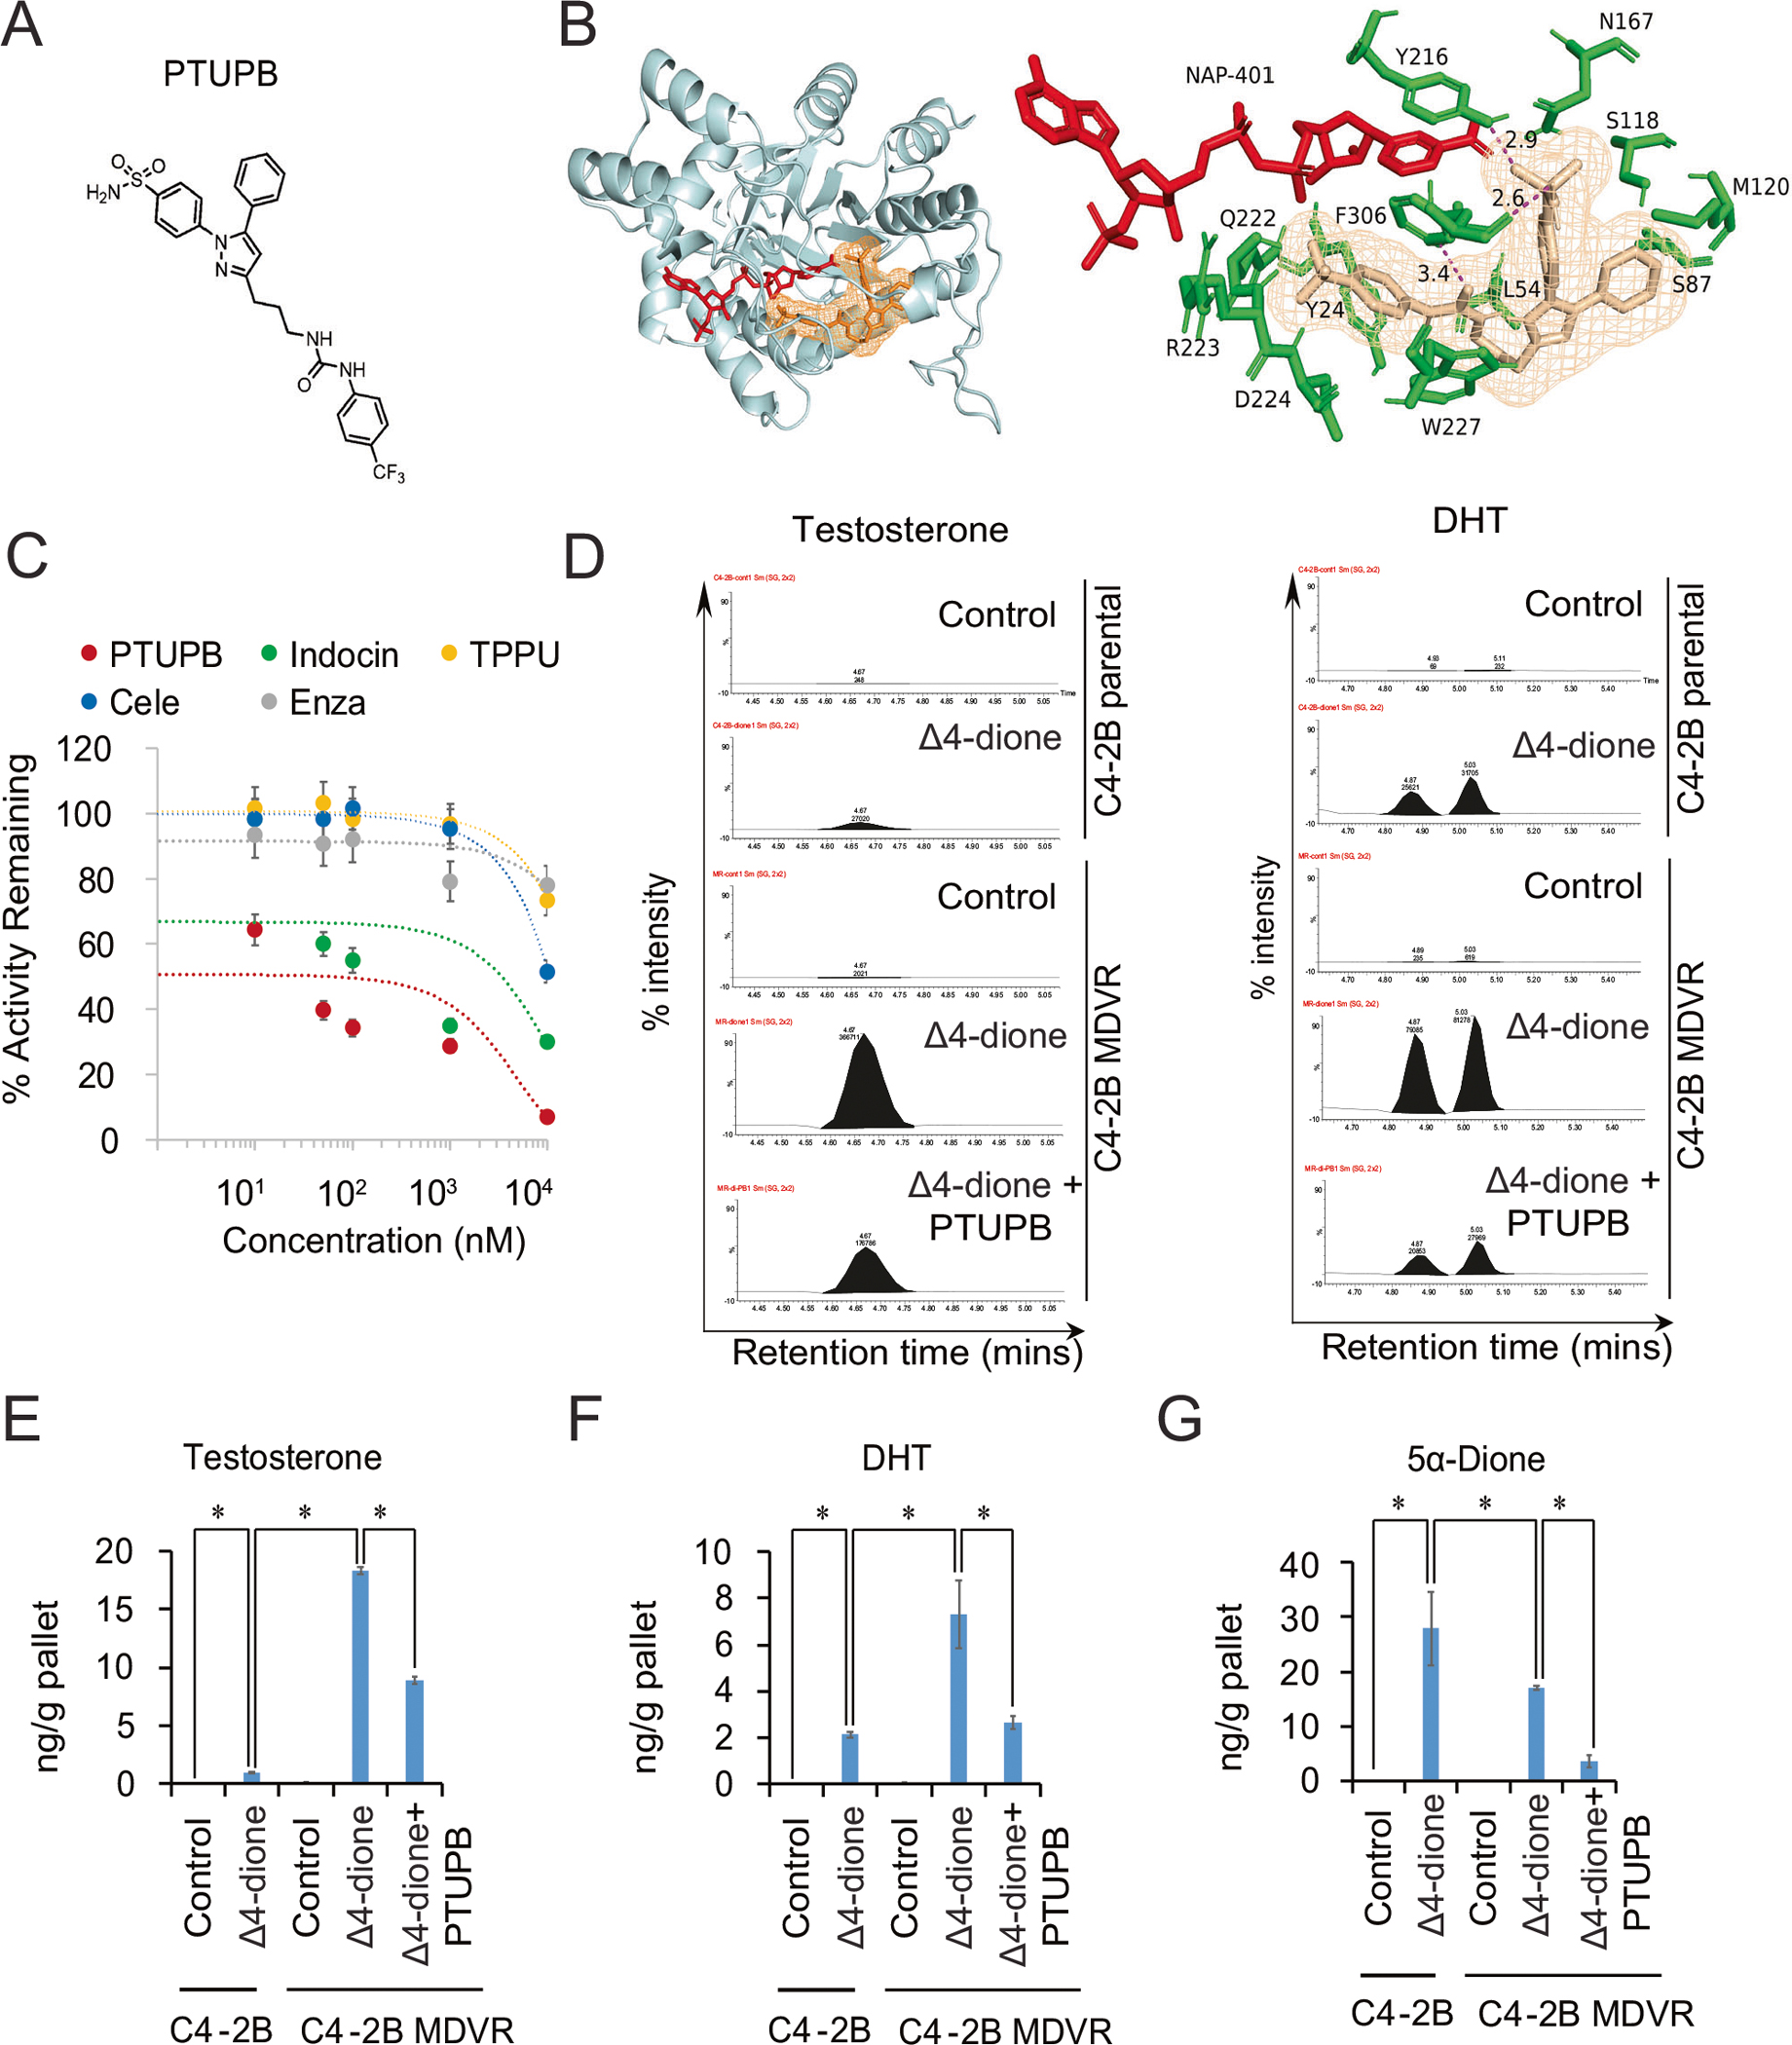
A The chemical structure of PTUPB. B The docking model of PTUPB and the previously published AKR1C3/NADP+ crystal structure (PDB 7C7F), the lowest binding energy was −10.2 Kcal/mol through AutoDock vina and PyMOL. PTUPB bound site of the ternary complex, showing the surrounding residues (green) and NADP+ (red). Close-up view of the H-bond network between PTUPB and F306, Y216 in the ternary complex. C The AKR1C3 activity was determined by oxidation of S-tetralol. Different concentrations of PTUPB, indomethacin, and enzalutamide were mixed with S-tetralol, NADP+, and AKR1C3 recombinant protein; then, the initial velocity and the AKR1C3 activity inhibition were determined. D C4–2B parental and C4–2B MDVR cells were cultured in phenol red free RPMI1640 charcoal-stripped serum medium for 5 days and treated with 100 nM Δ4-dione. C4–2B MDVR cells were treated with or without PTUPB for 2 days. Levels of steroids in the cell extracts were analyzed by LC-MS. Representative testosterone and DHT chromatograms were viewed by the chromatogram viewer. E–G The represented steroid metabolites (testosterone, DHT and 5α-Dione) between C4–2B parental and C4–2B MDVR cells were quantified by Quanlynx. *p < 0.05. Results are the mean of three independent experiments (±SD).
PTUPB suppresses AR/AR-V7 signaling and synergizes enzalutamide in vitro
To further characterize the anticancer effects of PTUPB, we found PTUPB displayed superior potential in suppressing enzalutamide-resistant prostate cancer growth. We first compared its inhibitory activity with that of celecoxib, TPPU, indomethacin, and enzalutamide on cell growth. At the same dose, PTUPB suppressed C4–2B MDVR cell growth significantly more than celecoxib, TPPU, indomethacin, or enzalutamide did (Fig. 3A). However, PTUPB, TPPU, celecoxib, and indomethacin showed much less effects on primary normal fibroblast cells IMR90 and immortalized normal prostate epithelial cell line RWPE-1. As shown in Supplementary Fig. S3A–3B, 10 and 20 μM treatment only had a marginal change on the cell growth. To test whether PTUPB improves enzalutamide treatment, combination experiments with PTUPB and enzalutamide were explored in three resistant cell lines. The combination treatment with PTUPB and enzalutamide synergistically inhibited cell growth compared to PTUPB or enzalutamide alone in C4–2B MDVR, C4–2B AbiR, and CWR22Rv1 cells (Fig. 3B, Supplementary Fig. S3C–3D and Supplementary Table S1). The coefficient of drug interaction (CDI) [23] and combination index (CI) [24] were analyzed using the CompuSyn software to determine synergism (CI or CDI value <1, =1 or >1 indicates that the drugs are synergistic, additive, or antagonistic). PTUPB synergized with enzalutamide treatment in a time-dependent manner in both C4–2B MDVR and CWR22Rv1 cells. Importantly, the effect was stronger when enzalutamide was combined with PTUPB than indomethacin in terms of cell growth and colony formation inhibition (Fig. 3C, D, Supplementary Fig. S3E–3G). The levels of AR/AR-V7 and c-Myc protein levels were decreased when the two drug-resistant cell lines (C4–2B MDVR and CRW22Rv1) were treated with a combination of PTUPB and enzalutamide (Fig. 3E and Supplementary Fig. S3H). Importantly, the combination treatment significantly suppressed CDK2 and CDK4 expression and their related cyclins, such as Cyclin A, Cyclin E, and Cyclin D1. Cleaved-Caspases 3 and 7 were only induced by the combination treatment, suggesting the synergistic effects (Supplementary Fig. S3I). We previously discovered that AKR1C3 promotes AR/AR-V7 protein stabilization by regulating the ubiquitin-proteasome system (UPS) [10]. To further dissect the underlying mechanisms of PTUPB in AR-V7 inhibition, we used the proteasome inhibitor MG132 to treat CWR22Rv1 cells in the absence and presence of PTUPB. MG132 significantly restored AR-V7 protein levels, confirming PTUPB induced proteasomal degradation of AR-V7 (Fig. 3F). AR-V7 ubiquitination was intensified in PTUPB treated CWR22Rv1 cells treated with MG132; however, the AR-V7 protein was preserved (Fig. 3G). This observation was validated in HEK293 cells transfected with AKR1C3 and AR-V7 plasmids and treated with PTUPB and MG132 (Supplementary Fig. S3J). These data suggest that PTUPB synergizes with enzalutamide by targeting the AKR1C3/AR-V7 axis in resistant cells.
Fig. 3. PTUPB synergizes with the enzalutamide treatment and degrades AR/AR-V7 in vitro.
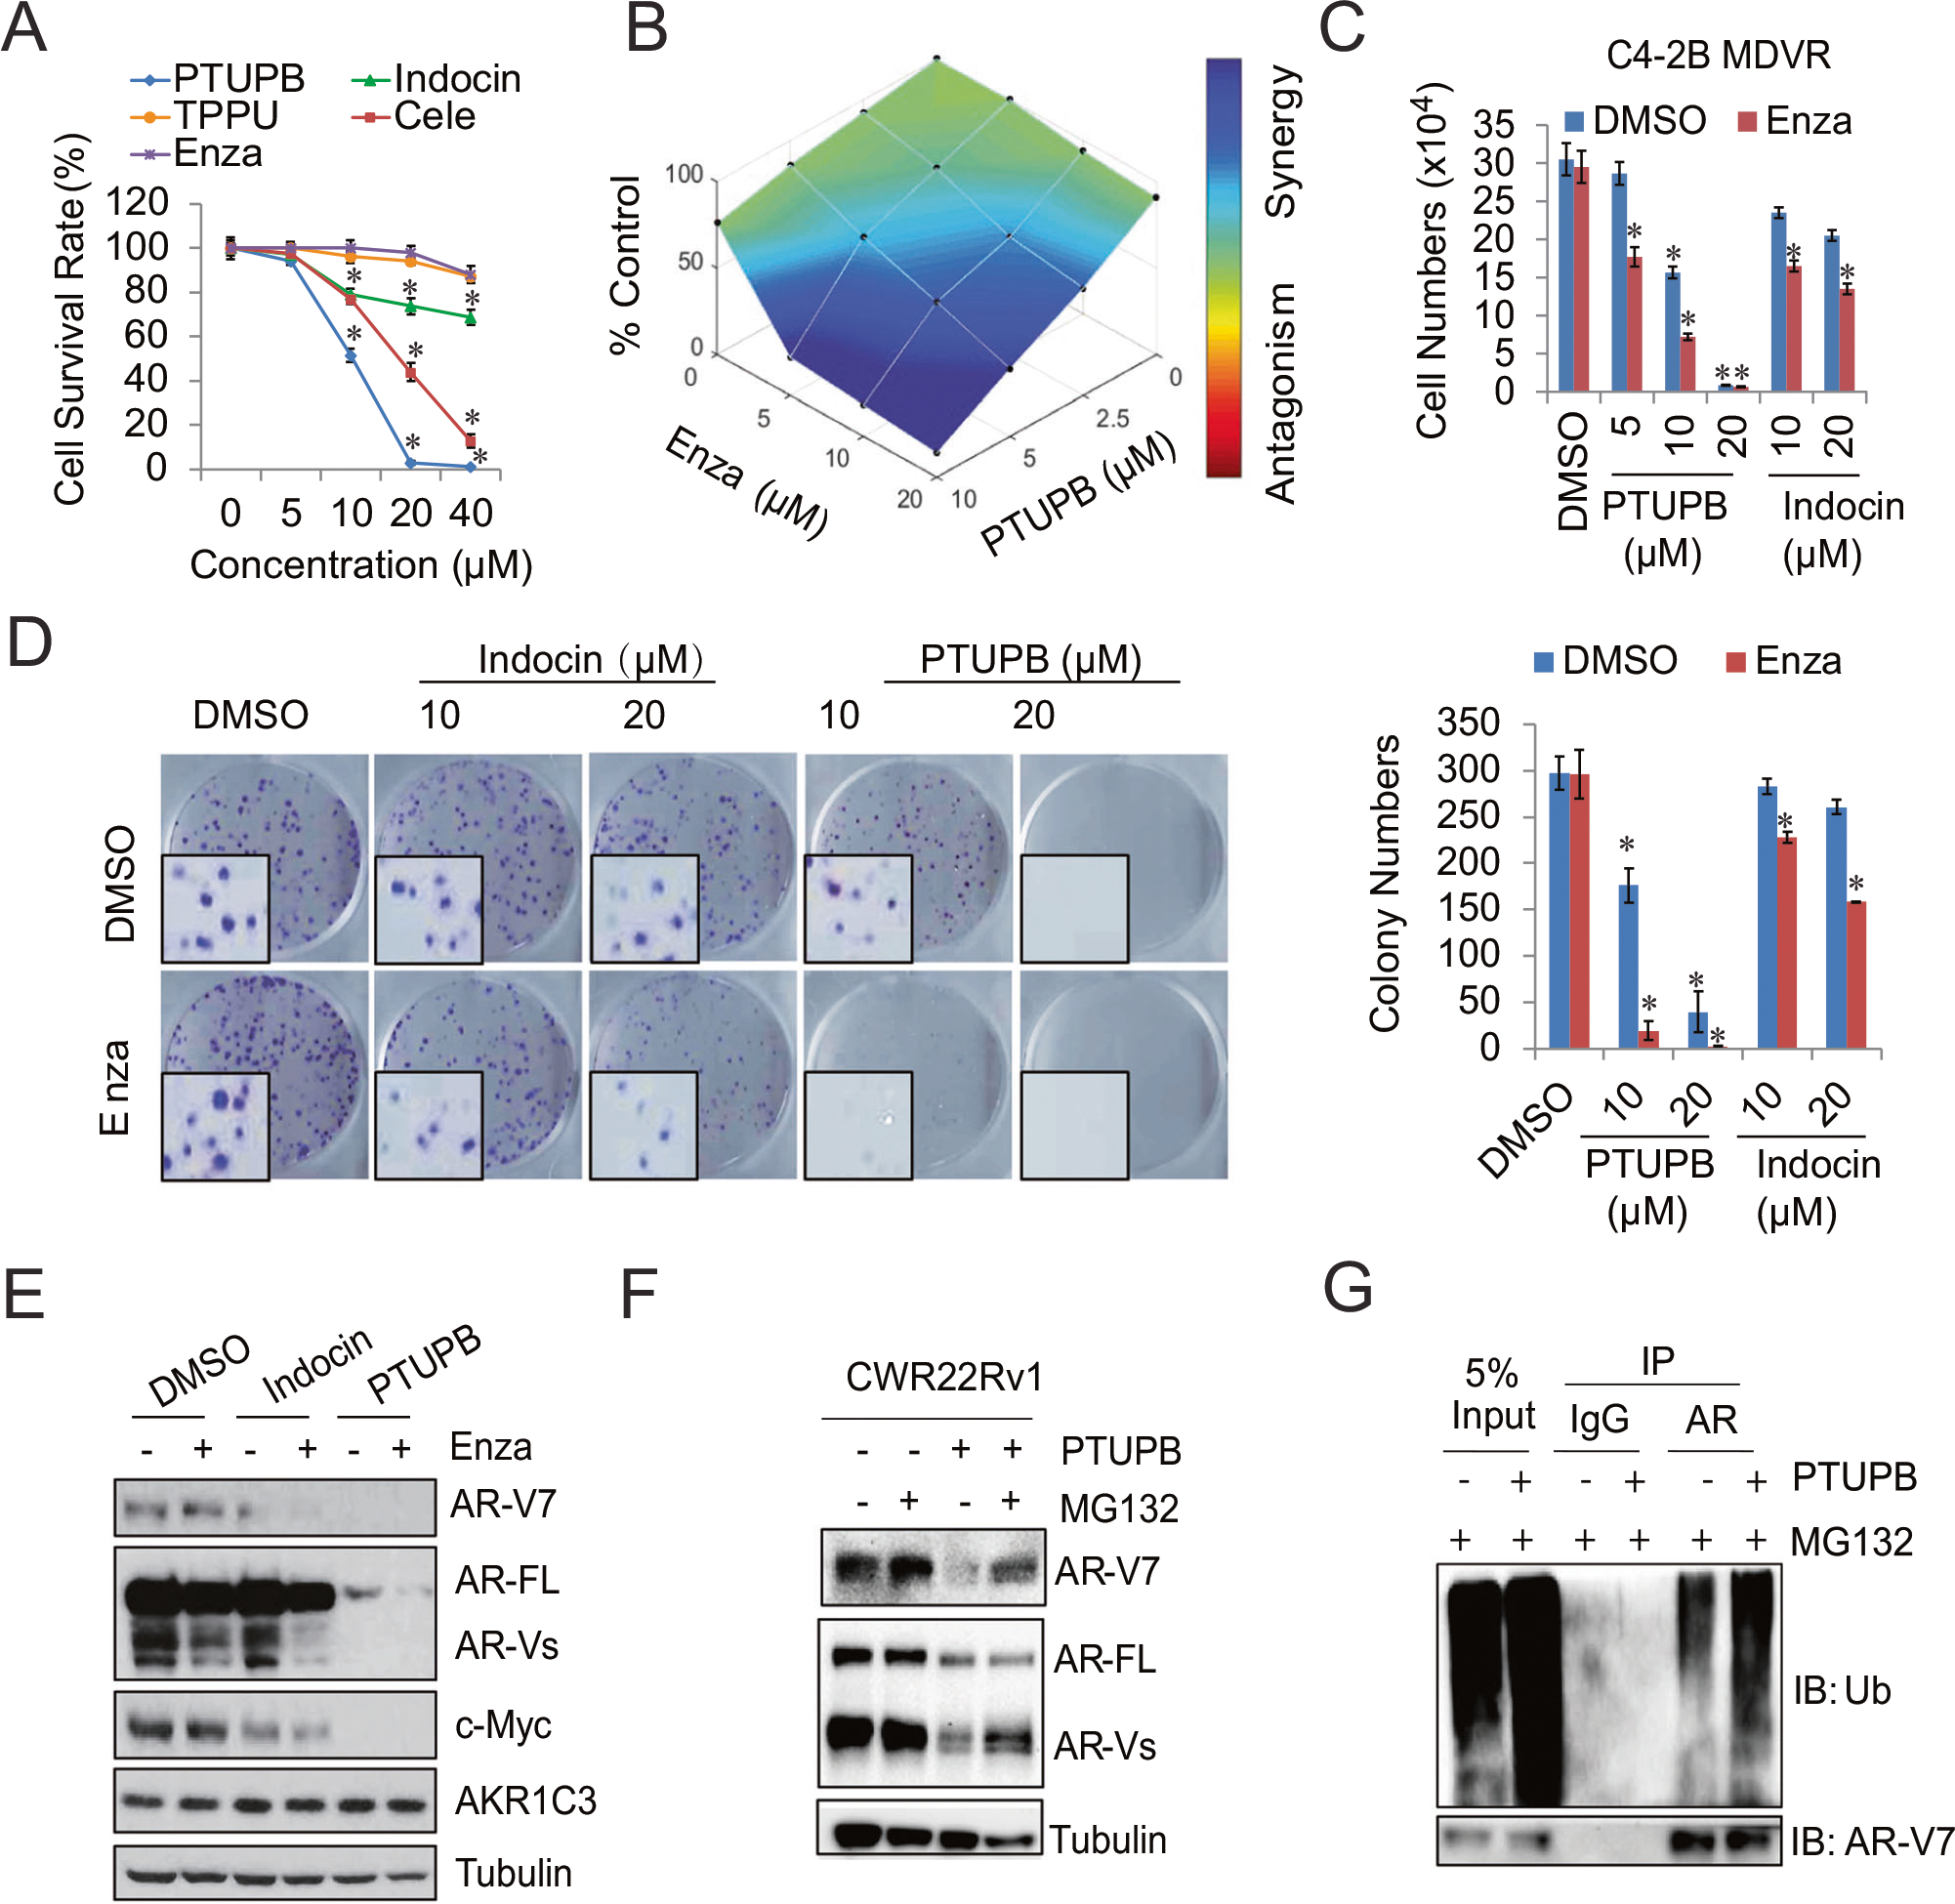
A C4–2B MDVR cells were treated with different concentrations of PTUPB, Celecoxib (Cele), TPPU, indomethacin (Indocin), and enzalutamide (Enza) for 3 days, total cell numbers were determined, and cell survival rate was calculated. B C4–2B MDVR cells were treated with different concentrations of PTUPB with or without different concentrations of enzalutamide. The drug synergy distribution map was generated by Combenefit. C C4–2B MDVR cells were treated with different concentrations of PTUPB or Indocin, with/without enzalutamide for 3 days. Total cell numbers were determined. D C4–2B MDVR cells were treated with DMSO, PTUPB (10 and 20 μM), or Indocin (10 and 20 μM) with/without 20 μM enzalutamide, then the colony formation ability was examined by the clonogenic assay, and the colony numbers were determined. E C4–2B MDVR cells were treated with DMSO, Indocin (20 μM), or PTUPB (20 μM) with/without 20 μM enzalutamide; the whole cell lysates were collected, and protein expression was determined by western blot. F CWR22Rv1 cells were treated with PTUPB (20 μM) for 3 days, followed with MG132 (5 μM) overnight, and the AR and AR-V7 protein levels were determined by western blot. G CWR22Rv1 cells were treated with or without PTUPB (20 μM) for 3 days in the presence of MG132 (5 μM) overnight. Total cell lysates were immunoprecipitated with anti-AR antibody and immunoblotted with anti-Ub. *p < 0.05. Results are the mean of three independent experiments (±SD).
Synergism of PTUPB and enzalutamide treatment reprograms gene signature and suppresses AR/AR-V7 signaling pathways in resistant prostate cancer
To further explore the gene regulatory mechanisms underlying PTUPB treatment in drug-resistant prostate cancer cells, we performed RNA sequencing analyses using PTUPB-treated C4–2B MDVR cells with or without enzalutamide treatment to identify the gene programs affected by the treatments. There were 15,770 genes that were differentially expressed in enzalutamide, PTUPB, or their combination-treated C4–2B MDVR cells (FPKM > 1, fold change>1.2). Venn diagram analysis revealed significant overlapping gene shifts from PTUPB 10 μM to PTUPB 20 μM in combination with 20 μM enzalutamide treatment, where 1059 upregulated genes overlapped between PTUPB 10 μM and PTUPB + enzalutamide, but 3102 genes overlapped between PTUPB 20 μM and PTUPB + enzalutamide treatment. Similar trends were observed for the downregulated genes. Notably, over 2000 genes were regulated by PTUPB + enzalutamide, but not by PTUPB or enzalutamide monotherapy, suggesting that the unique gene programs were regulated by combination treatment (Fig. 4A and Supplementary Fig. S4A). GSEA revealed that the top gene sets upregulated by PTUPB treatment included the unfolded protein response (UPR), interferon response, and protein export pathways. The downregulated gene sets included cell cycle, androgen response, E2F targets, and Myc targets (Fig. 4B and Supplementary Fig. S4B). PTUPB 20 μM and PTUPB 20 μM + enzalutamide-regulated genes were mainly clustered into two major groups, as plotted by a heatmap using hierarchical clustering, indicating a regulatory shift in the gene expression changes induced by PTUPB and PTUPB + enzalutamide treatments (Fig. 4C left). Specifically, PTUPB 10 μM synergized with enzalutamide to regulate several gene sets, including the androgen response, Myc targets, and UPR (Supplementary Fig. S4C). At the individual gene level, we observed that AR and AR-V7 regulated genes (for example, KLK3, TMPRSS2, FKBP5, and UBE2C) were suppressed by PTUPB and PTUPB + enzalutamide treatments (Fig. 4C right). GSEA revealed that AR-V7 specific pathways were significantly blocked by PTUPB treatment in C4–2B MDVR cells. As shown in Fig. 4D, PTUPB robustly disrupted AR-V7 associated gene programs and cancer cell growth and survival pathways. PTUPB also inhibited AR transcriptional activity in a dose-dependent manner in C4–2B MDVR cells (Fig. 4E). qRT-PCR verified that AR and AR-V7 target genes, such as KLK2, KLK3, NKX3–1, FKBP5, and UBE2C, were suppressed by both PTUPB and PTUPB + enzalutamide (Fig. 4F). These promising data warrant further investigation of this novel compound in combination with enzalutamide in vivo and highlight its ability to overcome drug resistance in advanced prostate cancer.
Fig. 4. Synergism of the PTUPB and enzalutamide combination treatment reprograms gene signature regulation and suppresses AR/AR-V7 signaling pathways in resistant prostate cancer.

A Venn diagram of up-regulated and down-regulated gene numbers analyzed from RNA sequence data by three comparisons: PTUPB (10 μM or 20 μM) vs. DMSO, enzalutamide vs. DMSO, and PTUPB + enzalutamide vs. DMSO in C4–2B MDVR cells (FPKM > 1 and fold change>1.2). B GSEA of top enriched gene sets in C4–2B MDVR cells treated by PTUPB. The upregulated and down-regulated gene sets from the Hallmark and KEGG platforms were output by GSEA. C Heatmap and hierarchical clustering of the differentially expressed genes (DEGs) between treatments (PTUPB, enzalutamide, and combination) in C4–2B MDVR cells with FPKM > 1 and fold change >1.2, as compared to vehicle (DMSO). The genes were displayed in rows and the normalized counts per sample were displayed in columns. Red indicates up-regulated, and blue designates down-regulated expression levels. Right: AR-FL/AR-V7 targeted genes and cell growth/survival genes that were altered in expression are displayed. D GSEA of the AR-V7 associated gene signature in C4–2B MDVR cells treated with PTUPB, as compared to DMSO (left). GSEA of the AR-V7 up-regulated gene signatures in C4–2B MDVR cells treated with PTUPB (middle). The signature was defined by genes that are preferentially upregulated by AR-V7 [44]. GSEA of the cancer cell growth/survival gene signatures in C4–2B MDVR cells treated with PTUPB (right). E C4–2B MDVR cells were transiently transfected with PSA E/P-luciferase plasmid, treated with different concentrations of PTUPB overnight, and the PSA luciferase activity was examined. F qRT-PCR analysis of the indicated genes in C4–2B MDVR cells treated with DMSO or PTUPB (10 μM or 20 μM) alone or with 20 μM enzalutamide for 48 h. Enza enzalutamide, PB PTUPB. *p < 0.05. Results are the mean of three independent experiments (±SD).
PTUPB improves enzalutamide activity in LuCaP35CR organoid and relapsed VCaP xenograft tumor models
To further translate the PTUPB effect in vivo, we first tested the suppressive effects of PTUPB in combination with enzalutamide in LuCaP35CR tumor organoids. GSEA revealed that the steroid hormone biosynthesis pathway was activated in LuCaP23.1CR and LuCaP35CR tumors (Supplementary Fig. S5A). AKR1C3 was also highly overexpressed in LuCaP35CR tumors (Supplementary Fig. S5B–5C). We generated LuCaP35CR organoids from tumors and tested the efficacy of PTUPB in combination with enzalutamide. As shown in Fig. 5A, B, a single treatment with PTUPB inhibited LuCaP35CR organoid growth in a dose-dependent manner, whereas enzalutamide slightly suppressed organoid growth, and PTUPB effectively enhanced enzalutamide treatment in a dose-dependent manner. We next tested PTUPB in combination with enzalutamide in a relapsed VCaP xenograft tumor model. As shown in Fig. 5C, D, enzalutamide treatment alone slightly inhibited tumor growth compared with the vehicle control. In contrast, PTUPB (30 mg/kg orally) alone significantly reduced tumor volume. The combination of PTUPB and enzalutamide further suppressed tumor growth and tumor weight in vivo. Importantly, these treatments did not affect mouse body weight (Supplementary Fig. S5D). The toxicity panel data showed either single treatment of PTUPB and combination treatment did not alter the kidney and liver function (Supplementary Fig. S5E–5O). The PTUPB and combination treatment groups showed significantly lower testosterone levels (Fig. 5E). Interestingly, enzalutamide treatment decreased tumor testosterone levels but marginally affected tumor growth, suggesting that single-targeted AR-FL is not sufficient to suppress tumor growth in relapsed VCaP tumors. Further IHC staining revealed that enzalutamide did not affect tumor proliferation (Ki67) or AR-V7 expression. PTUPB suppressed Ki67 and AR-V7 expression, and this suppression was further enhanced by combination treatment (Fig. 5F). These results suggest that PTUPB improves enzalutamide treatment in vivo and provides critical data for further investigation of PTUPB at the pre-clinical stage.
Fig. 5. PTUPB improves enzalutamide treatment in LuCaP35CR organoid and relapsed VCaP xenograft tumor models.

A, B LuCaP35CR organoids were seeded in a 96 well plate in a format of the 3D Matrigel and then treated with PTUPB, enzalutamide, or combination and cultured for 14 days. The viability of the organoids was visualized by LIVE/DEAD™ Cell Imaging Kit staining and analyzed by CellTiter Glo. Green (live cells), Red (dead cells). C Mice bearing VCaP xenografts were castrated, and relapsed tumors were treated with vehicle control, enzalutamide (25 mg/Kg, p.o.), PTUPB (30 mg/Kg, p.o.), or the combination for 21 days (n = 6). Tumor volumes were measured twice weekly. Tumor pictures were taken. D Tumor weight was calculated. E Tumors were processed, and the testosterone level was determined by LC/MS. F IHC staining and quantification of Ki67 and AR-V7 in representative tumors. *p < 0.05.
PTUPB suppresses the growth of patient-derived xenograft tumor cells and organoids
To further investigate the effect of PTUPB in PDX-derived models and potentially develop personalized treatment plans for patients with advanced prostate cancer, we established PDX models from patients with high Gleason scores and/or at castration-resistant stages. Some PDX tumors were generated in conditional reprogrammed cell cultures (CRCs) or organoids for drug testing (Fig. 6A). A spontaneously indefinite cell line, UCD1172 (from a Gleason 10 patient), was established. Early passage CRCs showed epithelial morphology pertaining to AR-positive and weak AKR1C3 expression. Staining for human mitochondrial antigens confirmed the human lineage (Fig. 6B). Through passaging five times in castrated SCID mice, the castration-resistant line UCD1172CR was established. UCD1172CR cells expressed higher levels of AR-V5, AR-V7, and AR-V9 than the parental cells (Fig. 6C). Importantly, UCD1172CR cells expressed notably higher levels of AKR1C3 than UCD1172 cells (150-fold higher), and enzalutamide further enhanced its expression (Fig. 6D left). Upregulation of AR-V7 and AKR1C3 was confirmed by western blotting (Fig. 6D right). Knockdown of AKR1C3 in UCD1172CR cells significantly suppressed cell growth and AR/AR-V7 expression (Fig. 6E). We tested PTUPB in combination with enzalutamide in a UCD1172CR cell model. At the same dose, PTUPB significantly suppressed UCD1172CR cell growth and colony formation compared to indomethacin and enzalutamide (Fig. 6F, G). PTUPB also significantly suppressed AR/AR-V7 protein expression compared with enzalutamide (Fig. 6H). We successfully established additional CRCs/organoids from PDX tumors and tested the efficacy of PTUPB. As shown in Fig. 6I and Supplementary Fig. S6A–B, PTUPB significantly suppressed UCD1173 and UCD1178 (both generated from enzalutamide-treated prostate cancer patients) CRCs and organoid growth in a dose-dependent manner. In the other two CRC models, we confirmed that PTUPB showed better efficacy in combination with enzalutamide than indomethacin (Supplementary Fig. S6C–D). These results confirm the efficacy of PTUPB in patient-derived tumor models and provide clinical relevance for further drug development and translation.
Fig. 6. PTUPB suppresses the growth of patient-derived xenograft tumor cells and organoids.

A Scheme of the CRCs/PDX/Organoid model establishment. B Tumor tissues from UCD1172 patient were processed and CRCs were established. AKR1C3, AR, human mitochondria (Mito) and DAPI were stained. C The UCD1172 PDX castration-resistant (CR) model establishment and the expression of AR variants were determined by qRT-PCR. D UCD1172 and UCD1172CR cells were treated with enzalutamide for 3 days, AKR1C3 mRNA expression was determined (left). The AR, AR-V7, and AKR1C3 protein expression in UCD1172 and UCD1172CR cells were determined by western blot (right). E UCD1172CR cells were infected with lenti-shControl or lenti-shAKR1C3 for 5 days. The cell growth and AR/AR-V7 expression were determined. F UCD1172CR cells were treated with different concentrations of PTUPB or indomethacin with/without enzalutamide for 3 days. Total cell numbers were determined. G UCD1172CR cells were treated with DMSO, PTUPB (5 μM, 10 μM and 20 μM), indomethacin (10 and 20 μM) with/without 20 μM enzalutamide, and the colony formation ability was examined by the clonogenic assay. H UCD1172CR cells were treated with DMSO, indomethacin (20 μM), PTUPB (20 μM) with/without 20 μM enzalutamide, then the whole cell lysates were collected, and protein expression was determined by western blot. I UCD1173 and UCD1178 organoids generated from PDX tumors were seeded in a 96 well plate in a format of the 3D Matrigel, and then treated with different concentrations of PTUPB and cultured for 14 days. The viability of the organoids was visualized by LIVE/DEAD™ Cell Imaging Kit staining. Green (live cells), Red (dead cells). *p < 0.05. Results are the mean of three independent experiments (±SD).
DISCUSSION
We have previously reported that chronic exposure to ARSIs, such as abiraterone, enzalutamide, and apalutamide, significantly increases the levels of AKR1C3 and AR-V7 in prostate cancer cell lines [8]. AR is a nuclear receptor essential for the normal development, maintenance, and progression of prostate cancer. The transcription factor function of the AR regulates genes responsible for differentiation of the prostate epithelium through ligand activation. The mRNA and protein levels of the AR are balanced through feedback loop regulation; an increase in ligands (DHT) not only decreases the AR but also other genes [25]. In this study, we demonstrated that the AR signaling reciprocally regulates AKR1C3 expression through transcriptional regulation. AR-FL, but not the variant AR-V7, is involved in AKR1C3 repression. ChIP-seq data revealed binding of the AR to a distant site from the transcription start site (TSS) of the AKR1C3 gene (−50 kb upstream) and ChIP qPCR data confirmed that DHT induced AR binding to this region and suppressed AKR1C3 expression. Previous study revealed that DHT promotes AR-FL binding to the intron 2 region of AR gene and suppress AR expression in VCaP cells. The DHT induced AKR1C3 repression is likely through the recruitment of lysine-specific demethylase 1 (LSD1), which is further coupled with demethylation of H3K4me1,2 [26]. This recruitment facilitates the complexation of AR, REST, and coREST to form the repression machinery that blocks the transactivation of the respective genes. The presence of ARSIs, such as enzalutamide, counteracted with DHT to diminish the AR binding. Another molecule, ERG, has also been speculated to regulate AKR1C3 expression by directly binding to its gene [9]. ERG has been reported to have overlapping binding sites with AR [27], and the two may harbor autoregulatory mechanisms to tightly control the levels of each other. The two separate ChIP-sequencing analyses with anti-AR and anti-ERG antibody pulldowns showed binding enrichment peaks at a similar location: −50 kb from the TSS. These observations suggest that ERG and AR may co-occupy AKR1C3 and regulate its expression through transcriptional regulation. Elevation of AKR1C3 not only enhances intracrine androgen synthesis, as multiple moonlighting functions of AKR1C3 have been reported, including the AR co-activator [28], stabilizing Siah-2 to enhance prostate cancer cell growth [29], modulating the level of histone deacetylase [30] and protecting AR-V7 from degradation [10]. All these special features of AKR1C3 make it as an ideal target for treating advanced prostate cancer.
Functionally, AKR1C3 executes its enzymatic activity with the cofactor NADPH to transfer protons and reduce the ketone groups. In addition to the catalytic tetrad composing of four amino residue distances apart, a domain encompassing peptide residues 171–237 (with three α-helices and one β-sheet) may be responsible for its AR co-activator activity. Various AKR1C3 inhibitors have been developed and tested, including nonsteroidal anti-inflammatory (NSAIDs) analogs, natural product analogs based on baccharin [31], Amaryllidaceae alkaloids [32], and steroidal analogs. In the past two decades, when intracrine androgen synthesis was associated with the progression of CRPC, new inhibitors with biological efficacy in inhibiting prostate cancer cell growth have been developed [11, 33]. Among these, ASP9521 showed promising preclinical inhibitory effects on prostate cancer cell growth [34]. The drug was tested in a phase I/Ib clinical trial for CRPC but showed no activity, possibly due to improper patient selection. The other inhibitor, BAY1128688 (a steroid-based analog), went into a phase 2 clinical trial for endometriosis, but the trial was terminated owing to liver toxicity [33]. A few dual AKR1C3 and AR inhibitors have recently been developed, including GTx-560, which inhibits AKR1C3 enzyme activity and its AR co-activator function [28], and BMT4–158, which are both AKR1C3 inhibitors and AR antagonists [35]. However, most of these inhibitors, either alone or in combination with enzalutamide, have never been tested for tumor growth inhibition. These compounds are unlikely to be suitable for translational studies in patients with advanced prostate cancer in the near future.
PTUPB is synthesized by linking pharmacophores from the COX-2 inhibitor celecoxib and sEH inhibitor TPPU. Therefore, the benefit of dual treatment of these two lipid metabolism pathways for pain and inflammation might overcome any adverse effects of toxicity caused by drug interactions. PTUPB effectively suppresses primary tumor growth and metastasis by inhibiting angiogenesis [15]. When combined with platinum-related reagents, PTUPB did not increase DNA adducts in bladder PDX models but reduced the activation of growth-related signaling pathways such as MAPK, AKT, and tumor angiogenesis [18]. It has potential as an adjuvant in cisplatin-based treatments of bladder cancer. In other cancer types, the anti-inflammatory effect of PTUPB blocks the debris-induced cytokine storm in macrophages caused by chemotherapeutic drugs or carcinogens [16, 17]. In all cases, the detailed mechanism of the synergistic interaction between the COX and sEH pathways in cancer remains unknown. Compared with celecoxib, PTUPB showed 100-fold lower COX-2 inhibitory activity [15]. However, computational simulations revealed increased binding affinity to the AKR1C3 active site. In our study, PTUPB was more effective than indomethacin in inhibiting AKR1C3 activity in vitro in the NADPH oxidation assay and in steroid biosynthesis measured by LC/MS. PTUPB synergizes with enzalutamide in preventing drug-resistant CRPC cell growth by disrupting AKR1C3-mediated stabilization of AR-V7. In the presence of PTUPB, AR-V7 undergoes ubiquitination degradation and drug-resistant prostate cancer cells are resensitized to enzalutamide. Gene analysis of C4–2B cells treated with PTUPB alone or in combination with enzalutamide further confirmed that PTUPB treatment promoted the UPR and protein secretion/exporting pathways and downregulated AR and AR-V7 associated gene programs. The application of PTUPB in combination with enzalutamide to treat castration-relapsed VCaP tumors demonstrated the feasibility of targeting CRPC using ARSI and AKR1C3 inhibitors. PTUPB alone significantly inhibited relapsed tumor growth along with AR-V7 protein levels and further enhanced the efficacy of enzalutamide to nearly completely inhibit tumor progression.
The benefits of this AKR1C3 inhibitor were further demonstrated in a novel PDX model of treatment-induced, highly elevated AKR1C3 levels. Prostate cancer is a highly heterogeneous cancer with distinct genomic and phenotypic characteristics that drive tumorigenesis and differential responses to drug therapies. The limited number of prostate cancer cell lines and PDX models hinders research on improving disease outcome. A recent report showed that CRCs establish primary prostate cancer cell cultures from biopsies or prostatectomies [36]. Importantly, CRCs can be used to establish xenografts in immunocompromised animals [37, 38], PDX cell lines [39], and organoid cultures [40]. In addition, CRCs cells retain cell lineage commitment and maintain cancer cell heterogeneity identified in the initial biopsy [37, 38, 41, 42]. Thus, patient-derived CRCs and organoid models provide the opportunity for high-throughput drug testing and rapid identification of effective treatments for patients with prostate cancer. In the current study, UCD1172CR cells were derived from UCD1172 cells after the castration-relapse cycle and after repeated passaging of castrated SCID mice. The increased AKR1C3 level associated with higher AR-V7 expression reflects what has been clinically observed in patient biopsy samples [43]. PTUPB was superior to indomethacin in effectively inhibiting UCD1172CR cell growth and showed synergism with enzalutamide. The ability to kill organoids established from old and new PDXs is encouraging for the development of personalized treatment plans for advanced prostate cancer. In the future, patients with disease progression may undergo biopsies for culturing into CRC or organoids to support rapid drug screening, including PTUPB, as AKR1C3 is often upregulated upon ADT and ARSI treatment failure.
In conclusion, the AKR1C3 inhibitor PTUPB is an ideal reagent to complement ARSI treatment in patients with CRPC. It directly targets elevated AKR1C3 and not only blocks intracrine androgen biosynthesis but also reduces AR-V7 levels through ubiquitination degradation. Further optimization of this drug to enhance its oral availability will be the immediate focus of bench-to-bedside translation for advanced prostate cancer treatment.
MATERIALS AND METHODS
Reagents and cell culture
C4–2B and CWR22Rv1 cells were maintained in RPMI1640 supplemented with 10% fetal bovine serum (FBS), 100 units/ml penicillin and 0.1 mg/ml streptomycin. HEK293, HEK293T, IMR90, and VCaP cells were maintained in DMEM supplemented with 10% FBS, 100 units/ml penicillin and 0.1 mg/ml streptomycin. RWPE-1 cells were maintained in keratinocyte serum-free medium (K-SFM) with the required supplements (Invitrogen). All cell line experiments were performed within six months of receipt from the ATCC or resuscitation after cryopreservation. C4–2B cells were kindly provided and authenticated by Dr. Leland Chung Lab at Cedars-Sinai Medical Center (Los Angeles, CA, USA). Resistant cells were isolated and referred to as C4–2B MDVR (C4–2B enzalutamide-resistant) and C4–2B AbiR (C4–2B abiraterone-resistant), as previously described [6, 19]. C4–2B MDVR and C4–2B AbiR were maintained in medium containing 20 μM enzalutamide or 10 μM abiraterone acetate, respectively. Parental C4–2B cells were passaged alongside the resistant cells as an appropriate control. All cell lines were routinely tested as mycoplasma-free by PCR and authenticated using the short tandem repeat (STR) method. All cells were maintained at 37°C in a humidified incubator with 5% carbon dioxide. Δ4-dione and DHT were purchased from Sigma-Aldrich. Enzalutamide and abiraterone acetate were purchased from Selleck Chemical.
Plasmids and cell transfection
For small interfering RNA (siRNA) transfection, cells were seeded at a density of 0.5 × 10⁵ cells per well in 12-well plates or 2 × 10⁵ cells per well in 6-well plates and transfected with 20 nM nM siRNA targeting the AR exon 7 sequence (UCAAGGAACUCGAUCGUAU), AR-V7 sequence (GUAGUUGUGAGUAUCAUGA) [44] or siControl (Invitrogen, Catalog# 12935300) using Lipofectamine-iMAX (Invitrogen). The effect of siRNA-mediated gene silencing was examined using qRT-PCR and western blot 2–3 days after transfection. Cells were transiently transfected with plasmids expressing AKR1C3, AR-V7, and HA-ubiquitin using Lipofectamine 2000 (Invitrogen). Lentiviral plasmids encoding shRNA targeting AKR1C3 (TRCN0000026561) were purchased from Sigma-Aldrich. The pLenti-GFP lentiviral vector was used as the control. Lentiviral particles were produced in HEK293T cells after co-transfection of the lentivirus vectors psPAX2 and pMD2.G. The lentivirus-containing medium was collected and the cells were infected.
Western blot analysis
Whole cell protein extracts were resolved on SDS-PAGE and proteins were transferred to nitrocellulose membranes. After blocking for 1 h at room temperature in 5% milk in PBS/0.1% Tween-20, membranes were incubated overnight at 4 °C with the following primary antibodies: AR (441, 1:1000 dilution, Santa Cruz Biotechnology, Inc.), AR (N-20, 1:1000 dilution, Santa Cruz Biotechnology, Inc.), Ubiquitin (P4D1 and FL76, 1:1000 dilution, Santa Cruz Biotechnology, Inc.), AR-V7 (AG10008, mouse monoclonal antibody, 1:1000 dilution, Precision antibody), c-Myc antibody (N262, 1:1000 dilution, Santa Cruz Biotechnology, Inc.), AKR1C3 antibody (A6229, 1:1000 dilution, Sigma-Aldrich, St. Louis, MO), CDK2 (#2546, 1:1000, Cell Signaling Technology), CDK4 (#12790, 1:1000, Cell Signaling Technology), Cyclin A (#4654, 1:1000, Cell Signaling Technology), Cyclin D1 (#2978, 1:1000, Cell Signaling Technology), Cyclin E (#4132, 1:1000, Cell Signaling Technology), Cleaved-Caspase 3 (#9661, 1:1000, Cell Signaling Technology), Cleaved-Caspase 7 (#9491, 1:1000, Cell Signaling Technology), and tubulin (T5168, Monoclonal Anti-α-Tubulin antibody, 1:5000 dilution, Sigma-Aldrich, St. Louis, MO). Tubulin was used as a loading control. Following incubation with secondary antibody, immunoreactive proteins were visualized using an enhanced chemiluminescence detection system (Millipore, Billerica, MA, USA).
Luciferase assay
C4–2B MDVR cells were transfected with pGL3-PSA6.0-Luc reporters and different concentrations of PTUPB in FBS condition. Cell lysates were subjected to luciferase assays using the Luciferase Assay System (Promega) as described previously [6].
Cell growth assay
CWR22Rv1 cells, C4–2B AbiR, and C4–2B MDVR cells were seeded on 12-well plates at a density of 0.5 × 10⁵ cells/well in RPMI 1640 media containing 10% FBS and treated using PTUPB with or without enzalutamide Total cell numbers were counted, and the UCD1172CR, UCD1173, UCD1178, UCD1177, UCD3009 cell viabilities were determined with the cell counting kit-8 (CCK-8) system. The optical density (OD) value per well was measured at 450 nm (BioTek, USA). The coefficient of drug interaction (CDI) [23] was calculated as: CDI= AB/(A × B). where A is the growth inhibition effect of PTUPB treatment, B is the growth inhibition effect of enzalutamide treatment, and AB is the growth inhibition effect of combination treatment. CDI was analyzed to determine the synergism of the two drug combination treatments (CDI value <1, =1, or >1 indicates that the drugs are synergistic, additive, or antagonistic, respectively). Synergy distribution maps were constructed using the Combenefit software [45].
Clonogenic assay
CWR22Rv1, C4–2B MDVR, or UCD1172CR cells were treated with PTUPB with or without 20 μM enzalutamide. Cells were plated at an equal density (800 cells/dish for CWR22Rv1 and C4–2B MDVR cells and 50,000 cells for UCD1172CR cells) in 60 mm dishes for 2–3 weeks; the medium was changed every 7 days. The colonies were rinsed with PBS before staining with 0.5% crystal violet/4% formaldehyde for 30 min, and the number of colonies was counted as previously described [46].
Real-time quantitative RT-PCR
Total RNA was extracted using the TRIzol reagent (Invitrogen). cDNA was prepared after digestion with RNase-free RQ1 DNase (Promega) and subjected to real-time reverse transcription-PCR (RT-PCR) using Sso Fast Eva Green Supermix (Bio-Rad) according to the manufacturer’s instructions and as previously described [47]. Each reaction was normalized to the co-amplification of actin. Triplicate samples were run using the default settings of the Bio-Rad CFX-96 real-time cycler. The primer sequences are in Table S2.
Co-immunoprecipitation assay
Equal amounts of cell lysates (1500 μg) were immunoprecipitated overnight using 1 μg of the AR antibody (441) with 50 μL of protein A/G agarose with constant rotation. The immunoprecipitants were washed twice with 1 mL 10 mM HEPES (pH 7.9), 1 mM EDTA, 150 mM NaCl, and 1% Nonidet P-40. The precipitated proteins were eluted with 30 μL of SDS-PAGE sample buffer by boiling for 10 min. Eluted proteins were electrophoresed on an 8% SDS-PAGE gel, transferred to nitrocellulose membranes, and probed with the indicated antibodies.
Chromatin immunoprecipitation assay
DNA-AR protein complexes were cross-linked inside cells by addition of 1% formaldehyde. Whole-cell extracts were prepared by sonication and an aliquot of the cross-linked DNA-protein complexes was immunoprecipitated by incubation with an AR-specific antibody (AR-441; Santa Cruz Biotechnology) overnight at 4 °C with rotation. Chromatin-antibody complexes were isolated from solution by incubation with protein A/G agarose beads for 1 h at 4 °C with rotation. The bound DNA-protein complexes were washed and eluted from beads with elution buffer (1% SDS and 0.1 mol/L NaHCO3), crosslinking was reversed, and DNA was extracted. The resulting chromatin preparations were analyzed by PCR, using primers spanning the enhancer region of the AKR1C3 promoter (Table S2). Isotype-matched IgG was used as a control.
RNA-seq data analysis
C4–2B MDVR cells were treated with vehicle or PTUPB (10 and 20 μM) with or without 20 μM enzalutamide for 48 h before RNA extraction. RNA-seq libraries from 1 μg of total RNA were prepared using the Illumina TruSeq RNA sample, according to the manufacturer’s instructions. An mRNA-Seq paired-end library was prepared using Illumina NovaSeq 6000:2 × 150 cycles/bases (150 bp, PE). Around 30 M reads/sample were obtained. Data analysis was performed using a Top Hat-Cufflinks pipeline and sequence read mapping/alignment using HISAT. StringTie data were mapped and quantified for 58,735 unique genes/transcripts. Gene and transcript expression was quantified as FPKM (fragments per kilobase of transcript per million mapped reads). Principal component analysis (PCA) was conducted on the FPKM gene-level data for all genes/transcripts that passed the filter (filtered on expression > 0.1) in the raw data. The relatedness of the differentially expressed genes from PTUPB ± enzalutamide treatments is depicted in a Venn diagram. The genes commonly regulated by PTUPB ± enzalutamide treatment were clustered using the hierarchical clustering algorithm in StrandNGS software.
Gene set enrichment analysis (GSEA)
GSEA was performed using Java desktop software (http://software.broadinstitute.org/gsea/index.jsp) as described previously [48]. Genes were ranked according to the shrunken limma log2 fold change, and the GSEA tool was used in ‘pre-ranked’ mode with all default parameters. The KEGG-ubiquitin-mediated proteolytic pathway was used for GSEA analysis.
Datasets and patient cohorts
The Cancer Genome Atlas (TCGA) and Stand Up 2 Cancer/Prostate Cancer Foundation-funded West Coast Prostate Cancer Dream Team (SU2C/PCF) datasets were downloaded from cBioPortal for Cancer Genomics (www.cbioportal.org). The expression levels of AR, KLK3, NKX3–1, TMPRSS2, and AKR1C3 were examined and correlated with each other. AKR1C3 clinical information from the Memorial Sloan-Kettering Cancer Center (MSKCC) was downloaded from cBioPortal (https://www.cbioportal.org/study/summary?id=prad_mskcc); AKR1C3 expression and clinical information from TCGA Research Network were downloaded from cBioPortal (https://www.cbioportal.org/study/summary?cancer_study_id=prad_tcga_pub), and AKR1C3 clinical information from SU2C/PCF was downloaded from cBioPortal (https://www.cbioportal.org/study/summary?id=prad_su2c_2019).
Docking and binding analysis with Autodock/Vina and PyMOL
The X-ray crystallographic structure of AKR1C3 enzyme domain was retrieved from the RCSB database (PDB code:7C7F). The ligand (PTUPB, celecoxib, TPPU, and indomethacin) preparation and grid box creation were completed using the graphical user interface program AutoDock Tools. AutoDock saves the prepared file in the PDBQT format. AutoGrid was used to prepare the grid map using a grid box. AutoDock/Vina was employed for docking using protein and ligand information along with the grid box properties in the configuration file. During the docking procedure, both the protein and ligand were considered rigid. The results with less than 1.0 Å in positional root-mean-square deviation (RMSD) were clustered together and represented by the result with the most favorable free energy of binding. The pose with the lowest binding energy or affinity was extracted and aligned with the receptor structure. The docked poses obtained were analyzed using AutoDock Tools and PyMOL.
AKR1C3 activity assay (S-Tetralol Oxidation Assay)
AKR1C3 activity was determined by monitoring the NADP+-dependent oxidation of (S)-(+)-1,2,3,4-tetrahydro-1-naphthol (S-tetralol) catalyzed by the AKR1C3 enzyme. Briefly, reaction systems (total 200 μL) containing 100 mM potassium phosphate buffer (pH 7.0), 4% DMSO, 440 μM NADP+ and 1.1 mM S-tetralol (Santa Cruz, sc-253491) were mixed and incubated at 37 °C for 10 min. Next, 5 μL of AKR1C3 recombinant protein (Novus, NBC1-21051) and different concentrations of enzalutamide, celecoxib, TPPU, indomethacin, and PTUPB were added to initiate the reaction and the absorbance was monitored at 340 nm until a constant value was obtained using a spectrophotometer. This was continuously monitored for 20 min (kinetic mode), recording the increase in UV absorption to calculate the velocity, which was used to determine the activity of the AKR1C3 enzyme.
PDX, CRCs, and organoid cultures
All human sample collection has been complied with all relevant ethical regulations for work with human participants at UC Davis. The Institutional Review Board (IRB) approved protocol (protocol number is GU-001) covered the patient specimen acquisition. All the patient provided permission to access residual tissue through the consent process. Primary cells from malignant human prostate tissue were isolated according to a previously described protocol [36]. Briefly, human prostate tissue was minced and digested with collagenase/hyaluronidase/dispase at 37 °C for 1–3 h. The dissociated cell suspension was filtered through a 100 μm cell strainer and collected. Cells were plated with a mixture of complete F-medium/conditioned medium from irradiated J2 culture supplemented with 10 μM Y-27632. Subculturing was performed with trypsin treatment when required.
LuCaP35CR [49] and PDX-derived tumor tissues were collected and cut to 2–4 mm3. Tumors were digested using collagenase IV (STEMCELL) and incubated at 37 °C for 30 min until tumor cells were dispersed. Advanced DMEM (ADMEM) medium supplemented with 1× GlutaMAX (Gibco), 1 M HEPES (Gibco) and 100 u/ml penicillin and 0.1 mg/ml streptomycin was added to the cell suspension, and then filtered through 40μm cell strainers to obtain a single-cell suspension. The cells were then centrifuged and resuspended in ADMEM complete medium containing GlutaMAX (Gibco), 100units/ml penicillin, 0.1 mg/ml streptomycin, B27 (Gibco), N-Acetylcysteine (Thermo Scientific), Human Recombinant EGF (Thermo Scientific), Recombinant FGF-10 (Invitrogen), A-83-01 (Tocris), SB202190 (Bioscience), Nicotinamide (Thermo Scientific), dihydrotestosterone (Sigma), PGE2 (Bioscience), Noggin (Thermo Scientific) and R-spondin (R & D Systems) [50]. Tumor cells were seeded in 96 well plate with Matrigel diluted in a 1:3 ratio of ADMEM complete medium and incubated at the 37 °C incubators for 15 min to solidify matrigel complex. Next, ADMEM complete medium mixed with PTUPB, with or without enzalutamide treatment, was added to each well. The viability of the organoids was analyzed using the CellTiter-Glo Luminescent assay (Promega) and visualized by immunofluorescence using the LIVE/DEAD® Viability/Cytotoxicity Assay Kit (Thermo Scientific) according to the manufacturer’s protocol.
In vivo tumorigenesis assay
All experimental procedures involving animals were approved by the Institutional Animal Care and Use Committee of UC Davis. VCaP cells (4 × 10⁶) were mixed with Matrigel (1:1) and injected subcutaneously into the flanks of 3- to 4-week-old male C.B-17/IcrHsd-Prkdcscid mice. After PSA levels were detectable (5–10 ng/mL), the mice were castrated, and the tumor volume was monitored. After the tumor grew back to 50–100 mm3, tumor-bearing mice were randomized into four groups (n = 6) and treated as follows: (1) vehicle control (0.5% Methocel A4M p.o.), (2) enzalutamide (25 mg/kg p.o.), (3) PTUPB (30 mg/kg p.o.), and (4) combination. Tumors were measured twice a week using calipers, and tumor volumes were calculated as length × width2/2. No sample or data point from the analysis was excluded. The experiments and data process were not blinded. After three weeks of treatment, tumor tissues were harvested and sent for testosterone measurement using liquid chromatography/mass spectrometry (LC/MS). Additional tumor tissues were embedded in paraffin and stained by IHC. The levels of blood urea nitrogen (BUN), phosphorus, calcium, total protein, albumin, globulin, glucose, cholesterol, alanine transaminase (ALT), alkaline phosphatase (ALP), and total bilirubin in mouse serum was determined using FUJI DRI-CHEM 4000 veterinary chemistry analyzer.
Immunohistochemistry
Tumors were fixed in formalin and paraffin-embedded tissue blocks were dewaxed, rehydrated, and blocked for endogenous peroxidase activity. Antigen retrieval was performed in sodium citrate buffer (0.01 mol/L, pH 6.0) in a microwave oven at 1000 W for 3 min and then at 100 W for 20 min. Non-specific antibody binding was blocked by incubation with 10% fetal bovine serum in PBS for 30 min at room temperature. slides were then incubated with anti-Ki67 (1:500; Neomarker) or anti-AR-V7 (1:200; Precision) at 4°C overnight. The slides were washed and incubated with biotin-conjugated secondary antibodies for 30 min, followed by incubation with avidin DH-biotinylated horseradish peroxidase complex for 30 min (Vectastain ABC Elite Kit, Vector Laboratories). The sections were developed using a diaminobenzidine substrate kit (Vector Laboratories) and counterstained with hematoxylin. The nuclear staining of the cells was scored and counted in five different fields of vision. Images were captured using an Olympus BX51 microscope equipped with a DP72 camera.
Steroid measurement by LC/MS
Tissue extracts were prepared by transferring a xenograft sample to a pre-weighed 2 mL screw-cap vial containing 10–20 zirconia/silica beads (2.3 mm; BioSpec) and tissue mass was noted (20–60 mg). Following the addition of 100 μL water, homogenization was carried out with a Precellys homogenizer (4 cycles, 6000 rpm, 20 s each). An internal standard (IS, deuterated T, and DHT) was added, and the samples were extracted twice by vortexing for 30 min with 1 mL 60/40 hexane/ethyl acetate (hex/EtOAc). extracted steroids were dried (CentriVap), reconstituted in 50 μL of 50 mmol/L hydroxylamine/50% methanol, incubated 1 h at 60 °C, and the resulting oximes analyzed using a Waters Aquity UPLC Separations Module coupled with a Waters Quattro Premier XE mass spectrometer. Separations were carried out with a 2.1 × 100 mm BEH 1.7 μmol/L C18 column, mobile phase water (A), and 0.1% formic acid in acetonitrile (B; gradient: 0.2 min, 25% B; 8 min, 70% B; 9 min, 100% B; 12 min, 100% B; 12.2 min, 25% B; 14 min run length). All data were collected in ES+ by multireaction monitoring (mrm), with instrument parameters optimized for the m/z values and corresponding fragments of the oxime steroids. Data processing was performed using Quanlynx (Waters) and exported to Excel for additional normalization of weights and volumes as required. Serum extracts (50 μL) were extracted as described above, omitting homogenization and using a single 1.5 mL volume of hex/EtOAc. Tissue culture samples were prepared similar to tissues, except that a slurry was generated from pellets by freeze/thaw cycles (3×) and vortexing prior to the transfer of 100 μL to extraction tubes.
Statistical analysis
Statistical analyses were performed using the SPSS software. Raw data were summarized by means, standard deviations (SD), and graphical summaries and then transformed if necessary to achieve normality. Data from the in vitro experiments are presented as mean ± SD from three independent experiments. Differences between individual groups were analyzed using two-tailed Student’s t test for single comparisons or one-way analysis of variance (ANOVA), followed by the Scheffé procedure for multiple group comparisons. In tumor growth experiments, the size of the tumor at sacrifice served as the primary response measure. Tumor growth and testosterone levels across groups were analyzed using ANOVA. Sample size was chosen based on the power to detect significant differences (p value less than 0.05) was considered statistically significant.
Supplementary Material
ACKNOWLEDGEMENTS
We sincerely thank Dr. Bo Chen in the Department of Urologic Surgery, Dr. Justin Siegel and Simon Kit Sang Chu in the Department of Chemistry at UC Davis for their assistance in our study.
FUNDING
This work was supported in part by grants from NIH/NCI R37CA249108 (Liu), R01CA251253 (Liu), Paul Calabresi Clinical Oncology K12 Program (5K12CA138464-09, Lara and Liu), NIH/NIEHS (RIVER Award) R35ES030443 (Hammock), NIH/NIEHS (Superfund Award) P42 ES004699 (Hammock), and UC Davis Comprehensive Cancer Center Support Grant (CCSG) awarded by the NCI (NCI P30CA093373). The maintenance and characterization of the LuCaP PDX models were supported by the Pacific Northwest Prostate Cancer SPORE (P50CA97186), the Department of Defense Prostate Cancer Biorepository Network (W81XWH-14-2-0183), and NCI P01-CA163227.
Footnotes
COMPETING INTERESTS
PTUPB is covered under a University of California Patent with SHH and BDH. Other authors declare no conflict of interest, financial or otherwise.
ADDITIONAL INFORMATION
Supplementary information The online version contains supplementary material available at https://doi.org/10.1038/s41388-022-02566-6.
Reprints and permission information is available at http://www.nature.com/reprints
DATA AVAILABILITY
The RNA sequence data in the present study have been deposited in Gene Expression Omnibus (GEO) with the accession number GSE216777. All data are available from the authors upon reasonable request.
REFERENCES
- 1.Locke JA, Guns ES, Lubik AA, Adomat HH, Hendy SC, Wood CA, et al. Androgen levels increase by intratumoral de novo steroidogenesis during progression of castration-resistant prostate cancer. Cancer Res. 2008;68:6407–15. (Research Support, Non-U.S. Gov’t). [DOI] [PubMed] [Google Scholar]
- 2.Mostaghel EA, Marck BT, Plymate SR, Vessella RL, Balk S, Matsumoto AM, et al. Resistance to CYP17A1 inhibition with abiraterone in castration-resistant prostate cancer: induction of steroidogenesis and androgen receptor splice variants. Clin Cancer Res. 2011;17:5913–25. [DOI] [PMC free article] [PubMed] [Google Scholar]
- 3.Stanbrough M, Bubley GJ, Ross K, Golub TR, Rubin MA, Penning TM, et al. Increased expression of genes converting adrenal androgens to testosterone in androgen-independent prostate cancer. Cancer Res. 2006;66:2815–25. [DOI] [PubMed] [Google Scholar]
- 4.Adeniji AO, Chen M, Penning TM. AKR1C3 as a target in castrate resistant prostate cancer. J Steroid Biochem Mol Biol. 2013;137:136–49. [DOI] [PMC free article] [PubMed] [Google Scholar]
- 5.Liu C, Armstrong CM, Lou W, Lombard A, Evans CP, Gao AC. Inhibition of AKR1C3 activation overcomes resistance to abiraterone in advanced prostate cancer. Mol Cancer Ther. 2017;16:35–44. [DOI] [PMC free article] [PubMed] [Google Scholar]
- 6.Liu C, Lou W, Zhu Y, Yang JC, Nadiminty N, Gaikwad NW, et al. Intracrine androgens and AKR1C3 activation confer resistance to enzalutamide in prostate cancer. Cancer Res. 2015;75:1413–22. [DOI] [PMC free article] [PubMed] [Google Scholar]
- 7.Mitsiades N, Sung CC, Schultz N, Danila DC, He B, Eedunuri VK, et al. Distinct patterns of dysregulated expression of enzymes involved in androgen synthesis and metabolism in metastatic prostate cancer tumors. Cancer Res. 2012;72:6142–52. [DOI] [PMC free article] [PubMed] [Google Scholar]
- 8.Zhao J, Ning S, Lou W, Yang JC, Armstrong CM, Lombard AP, et al. Cross-resistance among next-generation antiandrogen drugs through the AKR1C3/AR-V7 axis in advanced prostate cancer. Mol Cancer Ther. 2020;19:1708–18. [DOI] [PMC free article] [PubMed] [Google Scholar]
- 9.Powell K, Semaan L, Conley-LaComb MK, Asangani I, Wu YM, Ginsburg KB, et al. ERG/AKR1C3/AR constitutes a feed-forward loop for AR signaling in prostate cancer cells. Clin Cancer Res. 2015;21:2569–79. [DOI] [PMC free article] [PubMed] [Google Scholar]
- 10.Liu C, Yang JC, Armstrong CM, Lou W, Liu L, Qiu X, et al. AKR1C3 promotes AR-V7 protein stabilization and confers resistance to AR-targeted therapies in advanced prostate cancer. Mol Cancer Ther. 2019;18:1875–86. [DOI] [PMC free article] [PubMed] [Google Scholar]
- 11.Penning TM . Aldo-Keto reductase (AKR) 1C3 inhibitors: a patent review. Expert Opin Ther Pat. 2017;27:1329–40. [DOI] [PMC free article] [PubMed] [Google Scholar]
- 12.Pan CX, Lara P, Evans CP, Parikh M, de Vere White R, Dall’era M, et al. A phase Ib/II trial of indomethacin and enzalutamide to treat castration-resistant prostate cancer (CRPC). J Clin Oncol. 2018;36:TPS394. [Google Scholar]
- 13.Bauman DR, Rudnick SI, Szewczuk LM, Jin Y, Gopishetty S, Penning TM. Development of nonsteroidal anti-inflammatory drug analogs and steroid carboxylates selective for human aldo-keto reductase isoforms: potential antineoplastic agents that work independently of cyclooxygenase isozymes. Mol Pharm. 2005;67:60–8. [DOI] [PubMed] [Google Scholar]
- 14.Hwang SH, Wagner KM, Morisseau C, Liu JY, Dong H, Wecksler AT, et al. Synthesis and structure-activity relationship studies of urea-containing pyrazoles as dual inhibitors of cyclooxygenase-2 and soluble epoxide hydrolase. J Med Chem. 2011;54:3037–50. [DOI] [PMC free article] [PubMed] [Google Scholar]
- 15.Zhang G, Panigrahy D, Hwang SH, Yang J, Mahakian LM, Wettersten HI, et al. Dual inhibition of cyclooxygenase-2 and soluble epoxide hydrolase synergistically suppresses primary tumor growth and metastasis. Proc Natl Acad Sci USA. 2014;111:11127–32. [DOI] [PMC free article] [PubMed] [Google Scholar]
- 16.Fishbein A, Wang W, Yang H, Yang J, Hallisey VM, Deng J, et al. Resolution of eicosanoid/cytokine storm prevents carcinogen and inflammation-initiated hepatocellular cancer progression. Proc Natl Acad Sci USA. 2020;117:21576–87. [DOI] [PMC free article] [PubMed] [Google Scholar]
- 17.Gartung A, Yang J, Sukhatme VP, Bielenberg DR, Fernandes D, Chang J, et al. Suppression of chemotherapy-induced cytokine/lipid mediator surge and ovarian cancer by a dual COX-2/sEH inhibitor. Proc Natl Acad Sci USA. 2019;116:1698–703. [DOI] [PMC free article] [PubMed] [Google Scholar]
- 18.Wang F, Zhang H, Ma AH, Yu W, Zimmermann M, Yang J, et al. COX-2/sEH Dual Inhibitor PTUPB Potentiates the Antitumor Efficacy of Cisplatin. Mol cancer therapeutics. 2018;17:474–83. [DOI] [PMC free article] [PubMed] [Google Scholar]
- 19.Liu C, Lou W, Zhu Y, Nadiminty N, Schwartz CT, Evans CP, et al. Niclosamide inhibits androgen receptor variants expression and overcomes enzalutamide resistance in castration-resistant prostate cancer. Clin Cancer Res. 2014;20:3198–210. [DOI] [PMC free article] [PubMed] [Google Scholar]
- 20.Robinson D, Van Allen EM, Wu YM, Schultz N, Lonigro RJ, Mosquera JM, et al. Integrative Clinical Genomics of Advanced Prostate Cancer. Cell. 2015;162:454. [DOI] [PubMed] [Google Scholar]
- 21.Chng KR, Chang CW, Tan SK, Yang C, Hong SZ, Sng NY, et al. A transcriptional repressor co-regulatory network governing androgen response in prostate cancers. EMBO J. 2012;31:2810–23. [DOI] [PMC free article] [PubMed] [Google Scholar]
- 22.Asangani IA, Dommeti VL, Wang X, Malik R, Cieslik M, Yang R, et al. Therapeutic targeting of BET bromodomain proteins in castration-resistant prostate cancer. Nature. 2014;510:278–82. [DOI] [PMC free article] [PubMed] [Google Scholar]
- 23.Zhao Y, Gao JL, Ji JW, Gao M, Yin QS, Qiu QL, et al. Cytotoxicity enhancement in MDA-MB-231 cells by the combination treatment of tetrahydropalmatine and berberine derived from Corydalis yanhusuo W. T. Wang. J Intercult Ethnopharmacol. 2014;3:68–72. [DOI] [PMC free article] [PubMed] [Google Scholar]
- 24.Chou TC. Drug combination studies and their synergy quantification using the Chou-Talalay method. Cancer Res. 2010;70:440–6. [DOI] [PubMed] [Google Scholar]
- 25.Cai C, Wang H, Xu Y, Chen S, Balk SP. Reactivation of androgen receptor-regulated TMPRSS2:ERG gene expression in castration-resistant prostate cancer. Cancer Res. 2009;69:6027–32. [DOI] [PMC free article] [PubMed] [Google Scholar]
- 26.Cai C, He HH, Chen S, Coleman I, Wang H, Fang Z, et al. Androgen receptor gene expression in prostate cancer is directly suppressed by the androgen receptor through recruitment of lysine-specific demethylase 1. Cancer Cell. 2011;20:457–71. [DOI] [PMC free article] [PubMed] [Google Scholar]
- 27.Yu J, Yu J, Mani RS, Cao Q, Brenner CJ, Cao X, et al. An integrated network of androgen receptor, polycomb, and TMPRSS2-ERG gene fusions in prostate cancer progression. Cancer Cell. 2010;17:443–54. [DOI] [PMC free article] [PubMed] [Google Scholar]
- 28.Yepuru M, Wu Z, Kulkarni A, Yin F, Barrett CM, Kim J, et al. Steroidogenic enzyme AKR1C3 is a novel androgen receptor-selective coactivator that promotes prostate cancer growth. Clin Cancer Res. 2013;19:5613–25. [DOI] [PubMed] [Google Scholar]
- 29.Fan L, Peng G, Hussain A, Fazli L, Guns E, Gleave M, et al. The steroidogenic enzyme AKR1C3 regulates stability of the ubiquitin ligase Siah2 in prostate cancer cells. J Biol Chem. 2015;290:20865–79. [DOI] [PMC free article] [PubMed] [Google Scholar]
- 30.Doig CL, Battaglia S, Khanim FL, Bunce CM, Campbell MJ. Knockdown of AKR1C3 exposes a potential epigenetic susceptibility in prostate cancer cells. J Steroid Biochem Mol Biol. 2016;155:47–55. [DOI] [PMC free article] [PubMed] [Google Scholar]
- 31.Verma K, Zang T, Penning TM, Trippier PC. Potent and highly selective Aldo-Keto reductase 1C3 (AKR1C3) inhibitors act as chemotherapeutic potentiators in acute myeloid leukemia and T-cell acute lymphoblastic leukemia. J Med Chem. 2019;62:3590–616. [DOI] [PMC free article] [PubMed] [Google Scholar]
- 32.Hulcova D, Breiterova K, Zemanova L, Siatkac T, Safratova M, Vaneckova N, et al. AKR1C3 inhibitory potency of naturally-occurring amaryllidaceae alkaloids of different structural types. Nat Prod Commun. 2017;12:245–6. [PubMed] [Google Scholar]
- 33.Penning TM. AKR1C3 (type 5 17beta-hydroxysteroid dehydrogenase/prostaglandin F synthase): Roles in malignancy and endocrine disorders. Mol Cell Endocrinol. 2019;489:82–91. [DOI] [PMC free article] [PubMed] [Google Scholar]
- 34.Kikuchi A, Furutani T, Azami H, Watanabe K, Niimi T, Kamiyama Y, et al. In vitro and in vivo characterisation of ASP9521: a novel, selective, orally bioavailable inhibitor of 17beta-hydroxysteroid dehydrogenase type 5 (17betaHSD5; AKR1C3). Invest N Drugs. 2014;32:860–70. [DOI] [PubMed] [Google Scholar]
- 35.Chen M, Adeniji AO, Twenter BM, Winkler JD, Christianson DW, Penning TM. Crystal structures of AKR1C3 containing an N-(aryl)amino-benzoate inhibitor and a bifunctional AKR1C3 inhibitor and androgen receptor antagonist. Therapeutic leads for castrate resistant prostate cancer. Bioorg Med Chem Lett. 2012;22:3492–7. [DOI] [PMC free article] [PubMed] [Google Scholar]
- 36.Liu X, Krawczyk E, Suprynowicz FA, Palechor-Ceron N, Yuan H, Dakic A, et al. Conditional reprogramming and long-term expansion of normal and tumor cells from human biospecimens. Nat Protoc. 2017;12:439–51. [DOI] [PMC free article] [PubMed] [Google Scholar]
- 37.Liu X, Ory V, Chapman S, Yuan H, Albanese C, Kallakury B, et al. ROCK inhibitor and feeder cells induce the conditional reprogramming of epithelial cells. Am J Pathol. 2012;180:599–607. [DOI] [PMC free article] [PubMed] [Google Scholar]
- 38.Suprynowicz FA, Upadhyay G, Krawczyk E, Kramer SC, Hebert JD, Liu X, et al. Conditionally reprogrammed cells represent a stem-like state of adult epithelial cells. Proc Natl Acad Sci USA. 2012;109:20035–40. [DOI] [PMC free article] [PubMed] [Google Scholar]
- 39.McAuliffe PF, Evans KW, Akcakanat A, Chen K, Zheng X, Zhao H, et al. Ability to generate patient-derived breast cancer xenografts is enhanced in chemoresistant disease and predicts poor patient outcomes. PLoS One. 2015;10:e0136851. [DOI] [PMC free article] [PubMed] [Google Scholar]
- 40.Weeber F, Ooft SN, Dijkstra KK, Voest EE. Tumor organoids as a pre-clinical cancer model for drug discovery. Cell Chem Biol. 2017;24:1092–100. [DOI] [PubMed] [Google Scholar]
- 41.Beglyarova N, Banina E, Zhou Y, Mukhamadeeva R, Andrianov G, Bobrov E, et al. Screening of conditionally reprogrammed patient-derived carcinoma cells identifies ERCC3-MYC interactions as a target in pancreatic cancer. Clin Cancer Res. 2016;22:6153–63. [DOI] [PMC free article] [PubMed] [Google Scholar]
- 42.Saeed K, Rahkama V, Eldfors S, Bychkov D, Mpindi JP, Yadav B, et al. Comprehensive drug testing of patient-derived conditionally reprogrammed cells from castration-resistant prostate cancer. Eur Urol. 2017;71:319–27. [DOI] [PubMed] [Google Scholar]
- 43.Zhao J, Zhang M, Liu J, Liu Z, Shen P, Nie L, et al. AKR1C3 expression in primary lesion rebiopsy at the time of metastatic castration-resistant prostate cancer is strongly associated with poor efficacy of abiraterone as a first-line therapy. Prostate. 2019;79:1553–62. [DOI] [PubMed] [Google Scholar]
- 44.Hu R, Lu C, Mostaghel EA, Yegnasubramanian S, Gurel M, Tannahill C, et al. Distinct transcriptional programs mediated by the ligand-dependent full-length androgen receptor and its splice variants in castration-resistant prostate cancer. Cancer Res. 2012;72:3457–62. [DOI] [PMC free article] [PubMed] [Google Scholar]
- 45.Di Veroli GY, Fornari C, Wang D, Mollard S, Bramhall JL, Richards FM, et al. Combenefit: an interactive platform for the analysis and visualization of drug combinations. Bioinformatics. 2016;32:2866–8. [DOI] [PMC free article] [PubMed] [Google Scholar]
- 46.Liu C, Zhu Y, Lou W, Nadiminty N, Chen X, Zhou Q, et al. Functional p53 determines docetaxel sensitivity in prostate cancer cells. Prostate. 2013;73:418–27. [DOI] [PMC free article] [PubMed] [Google Scholar]
- 47.Liu C, Armstrong CM, Lou W, Lombard AP, Cucchiara V, Gu X, et al. Niclosamide and bicalutamide combination treatment overcomes enzalutamide- and bicalutamide-resistant prostate cancer. Mol Cancer Therapeutics. 2017;16:1521–30. [DOI] [PMC free article] [PubMed] [Google Scholar]
- 48.Subramanian A, Tamayo P, Mootha VK, Mukherjee S, Ebert BL, Gillette MA, et al. Gene set enrichment analysis: a knowledge-based approach for interpreting genome-wide expression profiles. Proc Natl Acad Sci USA. 2005;102:15545–50. [DOI] [PMC free article] [PubMed] [Google Scholar]
- 49.Nguyen HM, Vessella RL, Morrissey C, Brown LG, Coleman IM, Higano CS, et al. LuCaP prostate cancer patient-derived xenografts reflect the molecular heterogeneity of advanced disease an–d serve as models for evaluating cancer therapeutics. Prostate. 2017;77:654–71. [DOI] [PMC free article] [PubMed] [Google Scholar]
- 50.Drost J, Karthaus WR, Gao D, Driehuis E, Sawyers CL, Chen Y, et al. Organoid culture systems for prostate epithelial and cancer tissue. Nat Protoc. 2016;11:347–58. [DOI] [PMC free article] [PubMed] [Google Scholar]
Associated Data
This section collects any data citations, data availability statements, or supplementary materials included in this article.
Supplementary Materials
Data Availability Statement
The RNA sequence data in the present study have been deposited in Gene Expression Omnibus (GEO) with the accession number GSE216777. All data are available from the authors upon reasonable request.