

Abstract
This work prepared a composite of orange peels magnetic activated carbon (MG-OPAC). The prepared composite was categorized by X-ray diffraction (XRD), Fourier-transform infrared spectroscopy (FTIR), Brunauer–Emmett–Teller (BET), Energy-dispersive X-ray spectroscopy (EDX), Scanning Electron Microscopy (SEM) and vibrating-sample magnetometer (VSM) analyses. The MG-OPAC composite showed the surface area (155.09 m2/g), the total volume of pores (0.1768 cm3/g), and the mean diameter of pores (4.5604 nm). The saturation magnetization (Ms = 17.283 emu/g), remanence (Mr = 0.28999 emu/g) and coercivity (Hc = 13.714 G) were reported for the prepared MG-OPAC. Likewise, at room temperature, the MG-OPAC was in a super-paramagnetic state, which could be collected within 5 S (< 5 S) with an outside magnetic field. Influence of time of contact, absorbent dose, starting concentration of Cr6+ ions, and pH were tested to adjust the absorption process. The absorption behavior of MG-OPAC for hexavalent chromium was investigated by Langmuir (LIM), Freundlich (FIM) and Temkin (TIM) isotherm models (IMs). Applicability of LIM specifies that Cr6+ ions absorption procedure may be monolayer absorption. The maximum monolayer capacity (Qm) premeditated by LIM was 277.8 mg/g. Similarly, the absorption process was tested with different kinetic models like intraparticle diffusion (IPDM), pseudo-first-order (PFOM), Elovich (EM), pseudo-second-order (PSOM), and Film diffusion (FDM). The PSOM was best fitted to the experimental results of Cr6+ ions absorption with R2 ranging between 0.992 and 1.
Subject terms: Chemical engineering, Environmental chemistry
Introduction
Clean water is the most pressing issue confronting humanity, owing to the circumstance of the WHO considers water to be the most vital food product, owing to its importance to our health1. Access to safe and clean water is critical for ecosystems, living species, and humans. Due to population development, industrialization, and agricultural activity, existing clean water and freshwater sources are decreasing.
So, controlling water pollution has become increasingly important in recent years, making the treatment of industrial effluents a difficult problem in environmental research. Significant amounts of wastewater from home, industrial, and agricultural sources are still dumped into clean bodies of water. As a result, water contamination occurs, directly and indirectly affecting humans and natural ecosystems. Furthermore, most wastewater is discharged into the oceans, causing significant environmental damage in various ways2–4.
Wastewater contaminated with heavy metals like chromium, copper, arsenic, cadmium, zinc, mercury, nickel, and lead is one of the extremely remarkable environmental difficulties of this era. Heavy metals (HMs) removal is essential because they are harmful and carcinogenic elements that shouldn't be released into the environment directly5–9. As they leach into the surface and groundwater, they are absorbed by fishes and vegetables and then stored in the human body by the food chain, consequently causing acute or chronic diseases10–12. Chromium has two stable oxidation states in aqueous systems: trivalent and hexavalent. The trivalent form is necessary for life, while the hexavalent form is poisonous, mutagenic, and carcinogenic13–15. It can be absorbed through the skin and is a strong oxidant that is highly mobile in soil and water. The maximum amount of chromium that can be present in drinking water is 0.05 ppm for Cr6+ and 5 ppm for Cr3+, according to WHO standards16,17.
Hexavalent chromium is one of the most dangerous HM ions. It originated from leather tanning, electroplating, mining tailings, cement manufacturing, wood preservation, and other industries' effluents18. Also, it has been recorded among the top 20 pollutants on the Superfund Priority List of Hazardous Substances19.
For the treatment of wastewater, many techniques have been utilized to remove hexavalent chromium, such as adsorption20,21, reduction, ion exchange22, electrochemical processes23, precipitation24, and reverse osmosis25,26. Adsorption is thought to be a likely strategy because it is straightforward, simple to use, and effective at removing contaminants27–29. Several sorbents have been utilized to adsorb chromium from polluted waters, such as activated carbon (AC), sphagnum moss peat, fly ash and Wollastonite, and Pinus sylvestris bark21.
The adsorption behavior of AC is because of its extended surface area, highly established pore structure, and functional groups that are produced during the manufacturing process30,31. Because activated carbon is less expensive and easier to regenerate than more advanced purification products like reverse osmosis membranes, and ion exchange resins, it is a preferred method of treatment. The orange peel employed in this study often contains surface functional groups like amid, –OH, and –COOH. It also contains cellulose, hemicellulose, lignin, and pectin components. Activated carbon (AC) properties and forms of porosity, containing the surface chemistry, the size, shape, and distribution of the pores of the material, depending on the types of materials used, the activation techniques used, and the conditions in which they are activated32,33. Preparation and evaluation of bio-based magnetic AC have been reported as an effective adsorbent for the malachite green dye from water34. Magnetic activated carbon prepared from polyethylenimine and acorn shells as magnetic adsorbents were used, respectively, in the removal of uranium and methylene blue from water35,36. Kinetic and thermodynamic studies for rhodamine B removal by magnetic AC/CeO2 nanocomposite were investigated37. A collection of colorimetric sensing of heavy metals on metal-doped metal oxide nanocomposites has been reported38. Ultrasonic green synthesis method is reported for the preparation of zinc oxide nanoparticles loaded on activated carbon (AC) derived from coffee biomass39.
Both chemical and physical activation processes can be applied to create AC. Raw materials were carbonized at high temperatures in an inert atmosphere using the physical activation process, which was then activated using air, steam, or CO240. In the chemical activation process, raw materials were soaked with activator (dehydrating chemical agents) such as H3PO441, H2SO442, NaOH43, KOH44, ZnCl245, then carbonized in an inert atmosphere (with inert gases like nitrogen, argon) at a certain temperature. With a large surface area, clearly defined porous materials, excellent yields, and the greatest adsorption capacity, activated carbon employing ZnCl2 as a chemical activator was the best46,47.
Powdered AC (PAC) and granular AC (GAC) are the two main AC used to treat wastewater. Most researchers used GAC for the adsorption of pollutants from the water as it is easy to be separated (isolated) from the bulk fluid by classification or screening; however, PAC requires less contact time and lower capital cost than GAC. Thus, magnetic PAC (PMAC), a promising composite material that can be isolated from water using an external magnetic field, is created by mixing PAC with magnetic iron oxide nanoparticles (magnetic separators).
Consequently, this work aims to form a composite magnetic orange peel activated carbon (MG-OPAC) using ZnCl2 as a chemical activator and investigate as an absorbent for Cr6+ ions adsorption from water. The obtained MG-OPAC was categorized by XRD, surface area analysis, FT-IR, EDX, SEM and VSM. Magnetite nanoparticles are important for removing the MG-OPAC adsorbent from the adsorption solution after the completion of the curing process. The influence of process variables on the absorption process, like pH, contact time, absorbent mass, and starting concentration of Cr6+ ions, were investigated. Numerous kinetic and isotherm models were investigated to achieve a better consideration of the absorption process.
Materials and methods
Chemicals and materials
Orange peels were gathered from a local market in Alexandria, Egypt, cleaned with distilled water (DW), and dried at 50 °C for 24 h. The dried peels were crushed in a mixer and put away until they were needed. Stock solution of Cr6+ ions was organized by dissolving 2.83 g of K2Cr2O7 in 1 L DW. Potassium dichromate (K2Cr2O7, M.W 294.185 g, assay 99.5%) and Ferric nitrate anhydrous (Fe(NO3)3, M.W. 241.86 g, assay 98%) were gotten from ADWIC, El-Nasr Chemical Company, Egypt. BDH Chemicals LTD provided the 1,5-diphenylcarbazide used as a substance for Cr6+ ions, while Universal Fine Chemicals PVT-LTD in Mumbai, India provided ZnCl2 (M.W.136.30 g, assay 99.5%). From SD Fine-Chem. Limited (SD FCL), we got HCl (M.W. 36.46 g, test 30–34%). For the synthesis of magnetite Fe3O4, ferrous sulphate (FeSO4.7H2O, M.W. 278.01 g, assay 98.5%) was acquired from Alpha Chemika in India. None of the compounds was further purified before usage.
Synthesis of AC from orange peels (OPAC)
Orange peels were cleaned with DW and dried for 20 h at 50 °C. The dried peels were pulverized in a blender before being activated with ZnCl2 in a 1:2 (W/W) ratio at 105 °C for 24 h. After that, it was held at 700 °C for 1 h with a nitrogen flow of 50 mL/min in a tubular furnace (T.F. Nabertherm B180 (RT 50/250/13)). It created OPAC in powder form. After being cooled to ambient temperature, the activated carbon was refluxed with 1N HCl for 2 h to eliminate the alkali and then washed with DW to achieve a neutral pH. It was then dried for four hours at 105 °C.
Preparation of orange peels magnetic AC (MG-OPAC)
One gram of activated carbon (AC) was suspended in 500 mL of a solution comprising 3.5 g (8.66 mmoL) Fe(No3)3 and 1.3 g (4.33 mmoL) FeSO4·7H2O to create magnetic activated carbon (MG-OPAC). The reaction was made at 50 °C with strong stirring for 1 h after the solution was sonicated (40 W, 200 kHz) for 10 min to precipitate the iron oxide. Next, NaOH aqueous solution was introduced drop-wise into the suspension until pH was elevated to 11–12. The precipitate was periodically rinsed with DW until pH was neutral before being removed from the water dispersion by an external magnetic field (or by filtration). After drying, the MG-OPAC composite was stored in a bottle until usage.
Artificial wastewater
By dissolving 2.827 g of K2Cr2O7 in DW and diluting it to 1 L, the stock solution of (1.0 g L1) Cr6+ ions was created. This standard solution was properly diluted to create the Cr6+ ions working solution. Using a pH metre and 0.1 M NaOH or HCl, the liquids' pH was changed. The 1,5-diphenylcarbazide technique was used to spectrophotometrically determine the Cr6+ ions concentration48. The 1.5-diphenylcarbazide reagent was made by combining 0.1 g of the compound with 6 mL of methanol, 1 mL of concentrated sulfuric acid, and stirring with a magnetic stirrer. The mixture was then diluted to 1 L with DW. To make the standard curve, concentrations between 10 and 150 mg/L were created from the stock solution.
Sample characterization
Using a surface area and pore analyzer, N2 adsorption/desorption isotherms at 77.4 K and a relative pressure (P/P°) range of 0.001–1 were used to measure the specific surface area (SBET) (BELSORP—Mini II, BEL Japan, Inc). The SBET, total volume of pores (VT), and mean diameter of pores (DP) of the produced MG-OPAC were calculated by the Brunauer–Emmett–Teller (BET) model49. Additionally, using the BELSORP analysis programme software, the t-plot approach was used to measure the micropore surface area (Smi) and micropore volume (Vmi). Utilizing a Bruker VERTEX70 with a platinum ATR model V-100 in the wave number range of 400–4000 cm–1, FTIR spectroscopy was used to recognize the functional groups existent in OPAC, orange peels magnetic activated carbon (MG-OPAC), and MG-OPAC composite after removal. Utilizing SEM, the produced composite's morphology was examined. In addition, EDX was employed to pinpoint the precise elements present on the sample surfaces under study by using SEM QUANTA 250 linked to EDX. The crystalline characteristics of MG-OPAC were categorized by XRD using a Panalytica X-Ray Diffractometer with Cu Kα radiation (k = 0.15406 nm) in the scanning range 2Ɵ (0–90). Vibrating sample magnetometers (VSM), made by VSM Lakeshore type 7410 in the USA, were applied to test the magnetic properties of MG-OPAC at room temperature.
Batch adsorption investigation
The impacts of numerous significant parameters, including the amount of adsorbent, contact time, and pH values between adsorbent and adsorbate, were examined in this experiment using the batch adsorption approach. 100 mL of water containing Cr6+ ions was agitated with absorbent MG-OPAC at 25 °C and 200 rpm to conduct batch adsorption tests. After the desired time of contact, the flask was removed, centrifuged, and the residual concentration of Cr6+ ions was measured spectrophotometrically through the 1,5-diphenylcarbazide procedure (50 µL superannuated + 2 mL reagent). On the absorption of Cr6+ ions, the effects of MG-OPAC mass (0.1–0.4 g/L), contact period (15–180 min), and starting adsorbate Cr6+ ions concentration (100–300 mg/L) were examined50–52. Equations (1, 2) were used to compute the adsorbent's qe adsorption capacity (mg/g).
| 1 |
| 2 |
where Ci (mg L–1) is starting concentration of Cr6+ ions, Ce (mg L–1) is the residual concentration of Cr6+ ions gotten at the equilibrium state, V (L) is the solution volume, R% is the percentage of removal, and W (g) is the weight of adsorbent.
Author statement for the use of plants
In this study, Experimental research and field studies on plant material (Orange peels), including the collection of plant waste material, complies with relevant institutional, national, and international guidelines and legislation.
Results and discussion
Materials characterization
BET surface area
The SBET, total volume of pores (VT), and mean diameter of pores (DP) of the produced MG-OPAC were calculated by the Brunauer–Emmett–Teller (BET) model. The impact of the temperature of carbonization on the preparation of OPAC was studied at temperatures fluctuating from 700 to 900 °C using BET and t-plot models (Table 1). As shown in Table 1, the higher values obtained for surface area and pore volume of OPAC are 1512.5 m2/g and 0.8854 cm3/g, respectively, at carbonization temperature 700 °C (Fig. 1a,b), and then decrease with increasing temperature to 900 °C. Heat shrinking of pores is the cause of the surface area, and the volume of pores decreases with rising temperature53.
Table 1.
Influence of carbonization temperature on the volume of pores and surface area of OPAC.
| Model | Temp. (°C) | BET | t-plot | |||
|---|---|---|---|---|---|---|
| Sample | SBET (m2 g) | VT (cm3/g) | DP (nm) | Smi (m2/g) | Vmi (cm3/g) | |
| OPAC | 700 | 1512.5 | 0.8854 | 2.3415 | 1474.0 | 0.8624 |
| 800 | 1472.1 | 0.8411 | 2.2855 | 1444.1 | 0.8147 | |
| 900 | 1411.6 | 0.9506 | 2.6935 | 1323.9 | 0.9211 | |
Figure 1.

(a) BET surface area curve of OPAC, (b) t-Plot surface area curve of OPAC, (c) BET surface area curve of MG-OPAC, (d) t-Plot surface area curve of MG-OPAC, (e) Adsorption–desorption isotherm of OPAC, (f) Adsorption–desorption isotherm of MG-OPAC.
For prepared MG-OPAC, a smaller SBET (155.09 m2 g–1), VT (0.1768 cm3/g) and DP (4.5604 nm) (Fig. 1c,d) were obtained due to the incorporation of iron oxide (Fe3O4) over the porous surface of OPAC. Figure 1c explains the N2 adsorption–desorption isotherms of fabricated MG-OPAC. The OPAC sample isotherm (Fig. 1e) demonstrated step type I isotherms (Micropores), while the MG-OPAC sample isotherm (Fig. 1f) demonstrated step type IV isotherms (Mesopores) following the classification of IUPAC54,55. The knee formation of OPAC shows monolayer-coated micropores. The isotherm IV of MG-OPAC suggests that absorbate gas fills pores at relatively low pressures, and the observed plateau suggests multilayer adsorption through the pores at moderate pressures. The existence of capillary condensation in the mesopores (Type IV isotherm) in MG-OPAC, on the other hand, was made clear by an increase in absorbed volume at high relative pressure.
XRD investigation
XRD was used to distinguish the crystalline properties of MG-OPAC using X-ray Defractommeter (panalytica) with Cu Kα radiation (k = 0.15406 nm) in the scanning range 2Ɵ (0–90). Found XRD pattern of the MG-OPAC is presented in Fig. 2 (according to card NO 00-001-1111). The observed bands at 2Ɵ = 30.1°, 35.5°, 43°, 57.2° and 62.7° link to 220, 311, 400, 511, and 440 faces of Fe3O4. The composite synthesis of Fe3O4 and activated carbon was validated by the acquired XRD decoration56. Extreme crystalline was formed at 2Ɵ = 35.5°. The low surface area of MG-OPAC can be explained via the XRD sharp peak. The XRD data can prove the low specific surface area in the case of MG-OPAC.
Figure 2.

XRD pattern of the prepared MG-OPAC.
FTIR investigation
FTIR spectroscopy was used to recognize the functional groups existent in OPAC, orange peels magnetic activated carbon (MG-OPAC), and MG-OPAC composite after removal process of Cr6+ ions at the wavenumber range 400–4000 cm−1. Figure 3a illustrates FTIR spectrum of OPAC as a broad peak at 3775.4–3715.9 cm–1 is assigned to O–H bonding57. This O–H group occurs because of the existence of H2O molecules probably caused by semi-dried samples during the analysis. The peak at 2322.6, 1583.64 cm–1 correlated to C–H in the CH3 group and C=C aromatic ring, respectively58. The peak at 1393.4 cm–1 is because of O–H bending, which indicates the presence of oxygen in the sample. The peak at 1137.8 cm–1 corresponds to C–O stretching of COOH, phenol, alcohol, ether and ester59. The peak at 644.87 cm–1 is due to C–C stretching vibration. The spectrum in Fig. 3b illustrates the existence of a new intense peak at 563.9 cm–1, which could be assigned to M–O peak, possibly indicating the interaction between iron and oxygen in the samples60. In Fig. 3c peak due to C=C aromatic ring, C–O stretching and M–O peak was shifted to (1616.19, 1115.77, 557.85) cm–1 and these FTIR spectra changes approve the binding of Cr6+ ions with active groups existent in the MG-OPAC adsorbent.
Figure 3.
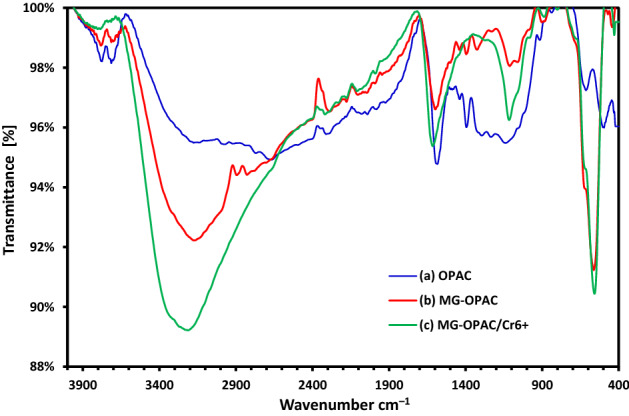
FTIR investigation of (a) OPAC, (b) MG-OPAC, (c) Cr6+ ions absorbed on MG-OPAC.
VSM investigation
The magnetic hysteresis loop of MG-OPAC (OPAC/Fe3O4), as depicted in Fig. 4, showed almost no coercivity and remanence, demonstrating the composite's usual paramagnetic behaviour. The values of the coercive force (Hc), remanance (Mr), and saturation magnetization (Ms) were determined to be 17.283 emu/g, 0.31832 emu/g, and 12.965 G, respectively. According to the ratio, Mr/Ms (0.02), the MG-OPAC was in a super-paramagnetic state at ambient temperature due to the low Mr value of less than 25%. The composite may be obtained with an external magnetic field in less than 5 s, according to inset Fig. 461,62.
Figure 4.

Magnetic hysteresis loop of nanocomposite MG-OPAC.
SEM and EDX analysis
The surface images of the manufacturing of OPAC and MG-OPAC were shown using scanning electron microscopy (SEM) analysis. The exact elements on the surface of the examined samples were identified by Energy-dispersive X-ray spectroscopy (EDX). SEM and EDX images were recorded by using QUANTA 250. Figure 5b illustrates that Fe3O4 deposited onto the surface of OPAC. The SEM image of MG-OPAC (Fig. 5b) shows that most of the micropores in OPAC (Fig. 5a) were filled with Fe3O4 particles which explains the low specific surface area reported by BET for MG-OPAC. As seen from Fig. 5a, the surface of OPAC has porous textures, and the OPAC pores were opened due to the activation with ZnCl2. From Fig. 5b, it is possible to recognize that the surface of MG-OPAC has a homogenous appearance after being filled partially with Fe3O4 particles. Also, the magnetic molecules were held more into the pores because of the magnetite particles on the OPAC surface during the process34.
Figure 5.

SEM micrograph of (a) OPAC under magnification of 37,000, (b) MG-OPAC under magnification of 25,000.
EDX spectrum for OPAC, MG-OPAC composite, and Cr6+ ions adsorbed on MG-OPAC composite exists in Fig. 6. Figure 6a displays the EDX spectrum of OPAC, which exposed that the content of carbon was 86.30%, followed by oxygen 11.99%. The use of ZnCl2 in the chemical activation preparation of OPAC was blamed for the presence of zinc and chlorine in the sample. The EDX spectrum of MG-OPAC is depicted in Fig. 6b, and revealing five major elements: carbon, sulphur, oxygen, zinc, and iron. The presence of sulfur was ascribed to using FeO4S in preparation for MG-OPAC. However, the presence of iron was thought to have resulted from iron oxide that had formed on the surface of the OPAC during the magnetization. Chromium has been adsorbed on the surface of MG-OPAC, as shown in Fig. 6c.
Figure 6.

EDX investigation of (a) OPAC, (b) MG-OPAC composite, (c) Cr6+ ions absorbed on MG-OPAC.
Absorption investigation
Influence of pH on removal efficiency
Because of its effect on the surface characteristics of the absorbent and Cr ion forms in water, pH is one of the most crucial factors since it regulates the absorption capacity63,64. Cr ions co-exist in the pH range of 1.0–6.0 in various forms, including Cr2O7–, HCrO4–, Cr4O132–, and Cr3O102–, with HCrO4– predominating. CrO42– and Cr2O72– are the dominating species when the pH of the solution rises Adsorption work was accompanied by all other parameters held constant (Cr concentration = 200 mg/L; agitating speed = 200 rpm; adsorbent dose = 2.0 g/L; temperature = 25 °C) in to study the impact of solution pH on Cr6+ ions adsorption. The maximum amount of Cr6+ that could be adsorbed was 89.2 at pH 1.3. As the pH of the solution increased, the amount of chromium that could be absorbable decreased, hence (pH 1.3) was chosen as the ideal pH value for additional absorption tests (Fig. 7). Because there are more H + ions on the absorbent surface at lower pH values, there is a stronger electrostatic interaction between the positively charged absorbent surface and the chromate ions (HCrO4–). Because both anions (CrO42– and OH–) compete to be adsorbed on the surface of the absorbent, less absorption occurs at alkaline pH values65–67.
Figure 7.
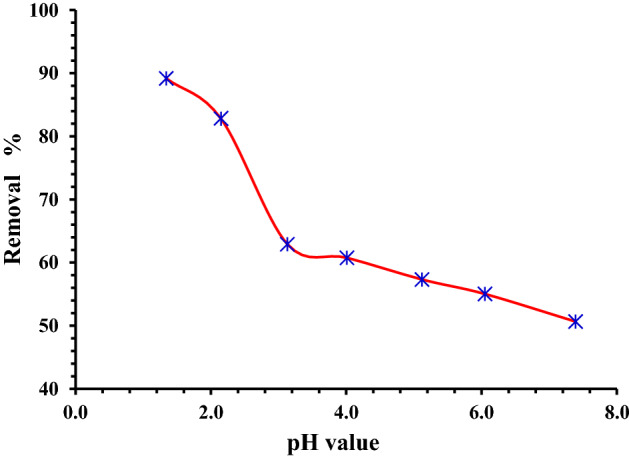
Impact of pH on the absorption of Cr6+ ions onto MG-OPAC (200 mg/L of Cr6+ ions, 2 g/L of adsorbent, 25 °C, 200 rpm, 180 min).
Impact of adsorbent dose and time of contact
The impact of time of contact on the absorption of diverse starting concentrations of Cr6+ ions (100, 150, 200, 300 mg/L) was studied using 2.0 g/L (200 mg/100 mL) of MG-OPAC at 200 rpm, 25 °C and 1.3 pH (Fig. 8a). Because it was determined from the kinetic investigation that the majority of the chromium absorption by MG-OPAC was accomplished in 180 min, these studies were carried out with a 180 min contact time.
Figure 8.

(a) Impact of time of contact on the absorption of varied starting concentrations of Cr6+ by 2 g/L of MG-OPAC, (b) Influence of the MG-OPAC doses on the absorption of Cr6+ ions, 200 rpm, 25 °C and pH 1.3.
Also, the impact of the adsorbent dose was investigated by using various adsorption doses of MG-OPAC (1, 1.5, 2, 2.5, 3, 4 g/L), 300 mg/L of Cr6+ ions, 200 rpm, 25 °C and 1.3 pH. The outcomes demonstrated that the percentage of Cr6+ adsorption increased with increasing adsorbent dose, and the highest absorption was noted with the MG-OPAC dose of 4 g/L (Fig. 8b). Increased MG-OPAC surface area and the obtainability of more absorption sites may be to blame for the rise in the percentage of absorption with absorbent dose.
Effect of starting Cr6+ ions concentration
It investigated how the starting concentration of Cr6+ ions in solutions affected the rate of absorption on MG-OPAC. The test solution had a pH of 1.3, adsorbent dosages of 1–4 g/L, and beginning Cr6+ ion concentrations of 100, 150, 200, and 300 mg/L. The experiment lasted for three hours. The findings demonstrated that when the beginning Cr concentration increased, the % chromium adsorption reduced (perhaps as a result of an increase in the mass transfer driving force) (Fig. 9a). As the concentration of Cr ions in the test solution grew, the mass of Cr absorbed per unit mass (adsorption capacity qe) of the absorbent also increased (Fig. 9b). The equilibrium absorption capacity qe (mg/g) of the MG-OPAC was measured from Eq. (3):
| 3 |
where Ci is the beginning concentration, Ce is the equilibrium concentration, V is the volume of solution in liter, and M is the weight of the MG-OPAC. It is common practice to derive the experimental adsorption isotherms by using the absorption capacity of an absorbent determined by the mass balance on the sorbate in a system with solution volume (V).
Figure 9.

(a) Impact of starting Cr6+ ions concentration onto the removal process, (b) Relationship between Cr6+ ions absorbed quantities at equilibrium (qe) and its beginning concentration by various MG-OPAC doses.
Adsorptionisothermstudy
The adsorption process can be estimated as a unit operation with the help of the equilibrium studies, which are crucial for optimizing the design factors of absorption systems. The solute distribution between the solid adsorbent and the liquid phase indicates the equilibrium position. To choose an appropriate model that may be applied in the design process, equilibrium data must precisely fit into various isotherm models (IMs)68,69. The factors achieved from the diverse isotherm models offer significant details regarding the sorbent's absorption mechanisms, surface characteristics, and empathies. Langmuir (LIM), Freundlich (FIM), and Timken (TIM) are only a few of the equations that can be used to depict equilibrium data. The applicability of IMs is matched by evaluating the R270.
The fundamental tenet of the LIM is that just one absorption layer occurs following the creation of a monolayer of absorbate on the outer surface of the absorbent (without any contact between absorbed molecules)71. This IM also presupposes homogenous surface adsorption energies and the absence of absorbate transmigration. To estimate the maximal absorption capacity (Qm, mg/g) due to complete monolayer coverage on the MG-OPAC surface, the Langmuir isotherm model (LIM) was chosen. Equation (4) can be used to express the linear LIM.
| 4 |
Ka is the LIM constant (L/mol) which is exponentially related to the heat of absorption and correlated to the absorption strength. A plot of 1/qe versus l/Ce gives a straight line of the slope (, and the intercept is (Fig. 10a). The data obtained from LIM for the removal of Cr6+ ions onto MG-OPAC have R2 (0.922–0.998) (Table 2). These results indicated the fitting of LIM to the experimental adsorption results. The Qm is 277.78 mg/g as determined by the linear solvation of LIM.
Figure 10.

(a) LIM; (b) FIM for removal of Cr6+ ions; (c) TIM adsorption of Cr6+ over 1, 1.5, 2, 2.5, 3 and 4 g/L of MG-OPAC.
Table 2.
LIM, FIM and TIM data for absorption of Cr6+ ions onto MG-OPAC (1.0–4.0 g/L).
| IM | IM factors | MG-OPAC doses | |||||
|---|---|---|---|---|---|---|---|
| 1 g/L | 1.5 g/L | 2 g/L | 2.5 g/L | 3 g/L | 4 g/L | ||
| LIM | Qm (mg/g) | 107.53 | 113.36 | 103.09 | 112.36 | 101.01 | 277.78 |
| Ka × 103 | 44.50 | 56.96 | 101.15 | 96.01 | 168.65 | 26.34 | |
| R2 | 0.980 | 0.939 | 0.984 | 0.958 | 0.922 | 0.998 | |
| FIM | 1/n | 0.43 | 0.33 | 0.30 | 0.22 | 1.18 | 0.81 |
| KF | 13.71 | 21.67 | 25.56 | 35.92 | 5.50 | 8.71 | |
| R2 | 0.905 | 0.992 | 0.981 | 0.974 | 0.971 | 0.992 | |
| TIM | AT | 0.54 | 0.44 | 1.12 | 1.56 | 0.40 | 0.51 |
| BT | 22.26 | 26.74 | 21.25 | 20.12 | 54.68 | 35.86 | |
| bT | 111.33 | 92.67 | 116.57 | 123.12 | 45.31 | 69.08 | |
| R2 | 0.991 | 0.961 | 0.998 | 0.947 | 0.995 | 0.992 | |
The first established relationship that describes the sorption process is the FIM72,73. The use of the FIM demonstrates that sorption energy exponentially declines on the achievement of the absorption centers of an absorbent. This FIM applies to absorption on heterogeneous surfaces with absorbed molecules interacting. Equation (5) represents the linear form of the FIM.
| 5 |
where KF (L/mg) is the FIM constant indicative of the comparative adsorption capacity of the adsorbent, and 1/n is a constant indicating the strength of sorbate absorption onto the sorbent or heterogeneity of surface, as 1/n value gets closer to zero, the surface becoming more heterogeneous. A value of 1/n < 1 indicates a normal LIM, while 1/n > 1 indicates cooperative absorption. A plot of log qe versus log Ce gives a straight line with a slope of 1/n and an intercept of KF (Fig. 10b). It is clear from Table 2 that the (1/n) values were less than 1, demonstrating that the surface nature of the MG-OPAC is heterogeneous and beneficial for the absorption process. The 'n' value is > 1, indicating that the physical mechanism of Cr6+ ions adsorption onto MG-OPAC is favourable74,75.
According to TIM, all molecules in the layer's heat of absorption reduce linearly with coverage as a result of absorbate–absorbent interactions, and the maximal binding energy is uniformly distributed throughout the adsorption process76,77. The FIM equation implies that the deterioration in the absorption heat is logarithmic, whereas the TIM assumes it is linear. Equation (6) can be used to present the linear TIM.
| 6 |
where B = (RT)/b, R is the universal gas constant, 8.314 J mol/K, and T is the absolute temp. in Kelvin. The constant b is correlated to the adsorption heat. A (L/g) is the TIM equilibrium binding constant in agreement with the maximum binding energy. The plot of ln Ce against qe (Fig. 10c), the binding energy (A) and the isotherm constant (b) were measured and represented in Table 2. The Temkin isotherm appears to suit the equilibrium results for the absorption of Cr6+ ions onto the surface of the material (MG-OPAC) well, as seen by the correlation coefficients obtained R2 > 0.947. The results of the current study's b measurements for the pollutants point to some weak ionic interactions (physisorption), which confirms that the absorption is physisorption78.
Kineticstudiesofadsorption
The operating results have been fitted using kinetic models to explore the absorption mechanism, which governs the absorption process. In this study, the absorption of chromium hexavalent ions (Cr6+) were tested with pseudo-first-order (PFOM)79, pseudo-second-order (PSOM)80, intraparticle diffusion (IPDM)81, Film diffusion (FDM)82, and Elovich (EM) kinetic models83–85. The correlation coefficients (R2) represented the degree of the covenant between the model-predicted values and the work results. The PFOM is commonly conveyed by the Eq. (7) as an integrated form of PFOM.
| 7 |
where qt is the quantity of solute absorbed at time t (min), qe is the quantity of solute (mg/g) absorbed at saturation, and k1 is the PFOM rate constant (min−1). The qe and k1 values can be measured from the intercept and slope of the plots of t versus log (qe − qt), respectively. The measured results obtained from the above plots were reported in Table 3. The qe experiment does not agree with the qe measured values and demonstrates the unsuitability of the PFOM, and the process is not a first-order reaction. The PSOM is usually expressed by the Eq. (8).
| 8 |
where qe (mg/g) is the absorbed amount at equilibrium and K2 (min/mg) is the PSOM rate constant. The plot of (t/qt) against (t) gave a straight line that was applied to measure the PSOM constants. The Cr6+ ions kinetics adsorption behavior onto MG-OPAC was depicted in Table 3. It is obvious from the plot results (Fig. 11b) that PSOM was best fitted with high linearity by means of R2 (> 0.99) than PFOM. Also, the qe experimental and qe measured results are in better covenant for the PSOM than the PFOM (Fig. 11a).
Table 3.
Evaluation of the predicted and experimental qe data for various starting Cr6+ ions and MG-OPAC doses, as well as the PFOM and PSOM adsorption rate constants.
| Parameter | PFOM | PSOM | |||||||
|---|---|---|---|---|---|---|---|---|---|
| MG-OPAC doses (g/L) | Cr6+ ion (mg/L) | qe (exp.) | qe (calc.) | k1 × 103 | R2 | qe (calc.) | k2 × 103 | h | R2 |
| 1.0 | 100 | 65.59 | 36.02 | 13.82 | 0.975 | 70.92 | 0.65 | 3245 | 0.995 |
| 150 | 79.55 | 42.95 | 15.66 | 0.914 | 84.75 | 0.64 | 4598 | 0.992 | |
| 200 | 91.50 | 37.46 | 16.58 | 0.960 | 96.15 | 0.85 | 7830 | 0.998 | |
| 300 | 133.68 | 53.51 | 13.59 | 0.993 | 133.33 | 0.53 | 9462 | 0.997 | |
| 1.5 | 100 | 55.83 | 24.18 | 19.81 | 0.988 | 58.82 | 1.49 | 5157 | 1.000 |
| 150 | 73.30 | 38.02 | 18.42 | 0.936 | 78.74 | 0.80 | 4933 | 0.997 | |
| 200 | 86.73 | 39.82 | 17.50 | 0.995 | 91.74 | 0.79 | 6666 | 0.998 | |
| 300 | 112.97 | 32.97 | 10.13 | 0.975 | 114.94 | 0.84 | 11,049 | 0.995 | |
| 2.0 | 100 | 46.11 | 9.81 | 15.20 | 0.935 | 46.95 | 3.77 | 8312 | 1.000 |
| 150 | 65.06 | 35.24 | 19.58 | 0.983 | 69.93 | 0.92 | 4508 | 0.998 | |
| 200 | 81.19 | 35.26 | 16.12 | 0.987 | 85.47 | 0.87 | 6377 | 0.998 | |
| 300 | 99.79 | 39.46 | 16.81 | 0.908 | 104.17 | 0.86 | 9293 | 0.997 | |
| 2.5 | 100 | 37.75 | 5.59 | 20.27 | 0.970 | 38.31 | 8.42 | 12,361 | 1.000 |
| 150 | 56.57 | 21.63 | 21.65 | 0.989 | 58.82 | 1.96 | 6770 | 0.996 | |
| 200 | 72.48 | 43.14 | 20.04 | 0.994 | 78.74 | 0.72 | 4473 | 0.998 | |
| 300 | 91.72 | 35.55 | 15.66 | 0.963 | 96.15 | 0.88 | 8136 | 0.997 | |
| 3.0 | 100 | 31.82 | 4.92 | 30.17 | 0.952 | 32.15 | 15.33 | 15,848 | 1.000 |
| 150 | 48.04 | 12.84 | 22.80 | 0.979 | 49.26 | 3.89 | 9442 | 1.000 | |
| 200 | 63.94 | 21.53 | 23.95 | 0.995 | 66.23 | 2.21 | 9690 | 1.000 | |
| 300 | 85.35 | 31.51 | 16.58 | 0.990 | 89.29 | 1.06 | 8425 | 0.998 | |
| 4.0 | 100 | 24.10 | 1.74 | 27.18 | 0.952 | 24.21 | 40.62 | 23,810 | 1.000 |
| 150 | 36.10 | 7.28 | 31.55 | 0.992 | 36.63 | 12.12 | 16,260 | 1.000 | |
| 200 | 48.09 | 14.44 | 36.85 | 0.995 | 48.78 | 7.02 | 16,694 | 1.000 | |
| 300 | 71.54 | 23.18 | 20.27 | 0.991 | 74.07 | 4.14 | 22,735 | 1.000 | |
Figure 11.

Kinetic adsorption analysis (a) PFOM; (b) PSOM, (c) EM, (d) IPDM, and (e) FDM.
The EM designates the chemisorption performance between adsorbate and adsorbent. The EM equation is the rate equation established on the absorption capacity typically provided by Eq. (9).
| 9 |
From the plot of ln (t) versus qt (Fig. 11c), the EM constants were measured from the intercept (1/β) ln(αβ) and slope (1/β) of the straight lines and presented in Table 4. The R2 are wavy and fluctuated between 0.865 and 0.996 without a confident role (R2 is very low), which reveals the unsuitability of EM to the work results achieved for removing Cr6+ ions onto MG-OPAC.
Table 4.
The IPDM, EM, and FDM kinetic adsorption investigation results.
| MG-OPAC dose (g/L) | Cr6+ conc | EM | IPDM | FDM | ||||||
|---|---|---|---|---|---|---|---|---|---|---|
| β | α | R2 | Kdif | C | R2 | KFD | C | R2 | ||
| 1.0 | 100 | 0.079 | 1.13E + 01 | 0.987 | 3.15 | 24.14 | 0.943 | 0.0349 | − 0.53 | 0.652 |
| 150 | 0.078 | 3.34E + 01 | 0.969 | 3.21 | 36.67 | 0.975 | 0.0381 | − 0.58 | 0.661 | |
| 200 | 0.082 | 1.17E + 02 | 0.987 | 3.05 | 52.14 | 0.953 | 0.0368 | − 0.19 | 0.691 | |
| 300 | 0.056 | 1.53E + 02 | 0.985 | 4.53 | 73.35 | 0.984 | 0.0383 | − 0.41 | 0.623 | |
| 1.5 | 100 | 0.126 | 5.57E + 01 | 0.981 | 1.94 | 31.74 | 0.906 | 0.0359 | − 0.03 | 0.768 |
| 150 | 0.088 | 3.86E + 01 | 0.981 | 2.88 | 36.34 | 0.975 | 0.0362 | − 0.30 | 0.733 | |
| 200 | 0.084 | 8.78E + 01 | 0.988 | 3.04 | 47.41 | 0.987 | 0.0372 | − 0.28 | 0.706 | |
| 300 | 0.095 | 1.71E + 03 | 0.924 | 2.75 | 73.65 | 0.976 | 0.0338 | − 0.04 | 0.582 | |
| 2.0 | 100 | 0.25 | 2.97E + 03 | 0.952 | 0.95 | 34.16 | 0.859 | 0.0313 | 0.69 | 0.718 |
| 150 | 0.10 | 3.69E + 01 | 0.996 | 2.52 | 32.84 | 0.983 | 0.0372 | − 0.33 | 0.751 | |
| 200 | 0.09 | 8.38E + 01 | 0.994 | 2.81 | 44.59 | 0.980 | 0.0348 | − 0.16 | 0.705 | |
| 300 | 0.09 | 4.73E + 02 | 0.974 | 2.81 | 62.46 | 0.993 | 0.0365 | − 0.12 | 0.698 | |
| 2.5 | 100 | 0.49 | 1.48E + 06 | 0.947 | 0.49 | 31.80 | 0.844 | 0.0309 | 1.34 | 0.849 |
| 150 | 0.16 | 2.88E + 02 | 0.994 | 1.57 | 37.11 | 0.938 | 0.0353 | 0.23 | 0.820 | |
| 200 | 0.08 | 2.53E + 01 | 0.989 | 3.10 | 33.21 | 0.976 | 0.0383 | − 0.45 | 0.753 | |
| 300 | 0.09 | 2.36E + 02 | 0.970 | 2.79 | 54.99 | 0.977 | 0.0359 | − 0.13 | 0.681 | |
| 3.0 | 100 | 0.80 | 1.14E + 09 | 0.925 | 0.30 | 28.30 | 0.812 | 0.0303 | 1.87 | 0.952 |
| 150 | 0.23 | 3.49E + 03 | 0.966 | 0.99 | 36.11 | 0.852 | 0.0334 | 0.81 | 0.865 | |
| 200 | 1.59 | 1.08E + 02 | 0.991 | 1.54 | 45.22 | 0.909 | 0.0379 | 0.34 | 0.834 | |
| 300 | 0.10 | 3.36E + 02 | 0.994 | 2.45 | 53.47 | 0.986 | 0.0377 | − 0.13 | 0.687 | |
| 4.0 | 100 | 3.06 | 2.00E + 29 | 0.995 | 0.12 | 22.65 | 0.735 | 0.0272 | 2.63 | 0.952 |
| 150 | 1.69 | 9.14E + 23 | 0.915 | 0.43 | 31.11 | 0.685 | 0.0315 | 1.82 | 0.946 | |
| 200 | 0.37 | 1.29E + 06 | 0.869 | 0.63 | 40.60 | 0.802 | 0.0369 | 1.21 | 0.929 | |
| 300 | 0.14 | 1.11E + 03 | 0.865 | 1.74 | 49.81 | 0.943 | 0.0351 | 0.34 | 0.795 | |
Migration (transport) of the absorbate (Cr6+) ions from the liquid phase to the solid phase (MG-OPAC) is a step in the multi-step process of adsorption. This is followed by the diffusion of the Cr6+ ions into the interiors of the pores. IPDM might be the rate-regulating step in an experiment that uses a batch process and fast agitating86,87. This hypothesis was tested using a graph that showed the relationship between the quantities of Cr6+ ions absorbed (qt) and the t1/2. The IPDM is another kinetic model (KM) that should be utilized to investigate the rate-limiting phase for Cr6+ ions absorption onto MG-OPAC since it is likely that the Cr6+ ion is transferred from its water solution to MG-OPAC by IPDM. The following Eq. (10) is a typical way to express the IPDM.
| 10 |
where Kdif (mg/g) is the IPDM rate constant. C (intercept) values offer evidence about the boundary layer thickness. The external mass transfer resistance increase as the intercept increase (Table 4). In Fig. 11d plots of t1/2 versus qt result in straight lines not passed via the origin with R2 values fluctuating from low to high without confident meaning, which is revealing of some degree of boundary layer control and this additional illustration that the IPDM is not only the rate-determining step for the removal of Cr6+ ions by MG-OPAC but also other methods may governor the absorption rate.
The solute molecules' movement across the interface between the solid and liquid phases is crucial to adsorption82,88,89. Equation (11) can be used to apply the liquid film diffusion model.
| 11 |
where KFD is the FDM rate constant and F is the fractional of equilibrium achievement (F = qt/qe). Plots of –ln (1 − F) against t (Fig. 11e), straight lines achieved did not pass via the origins, and this shows that FD is not the rate-determining step of the absorption process (Table 4).
AssessmentoftheMG-OPACandotherabsorbentsforCr6+ionsabsorption
To ascertain the effectiveness of the produced composite and the activation technique employed, a comparative examination of various adsorbents in expressions of absorption rate and adsorption capacity of Cr6+ was carried out. The findings are reported in Table 5.
Table 5.
Assessment of various adsorbents and the MG-OPAC for the removal of Cr6+ ions.
| Type of absorbent | Removal RATE % | Qm (mg/g) | References |
|---|---|---|---|
| MG-OPAC | 96.2 | 277.78 | This work |
| C. Hitosan grafted crotonaldehyde (CGC) | 98.99 | 434.78 | 16 |
| Date palm seed wastes (DSC) | 100 | 120.48 | 51 |
| Red alga Pterocladia capillacea | 58 | 12.85 | 57 |
| Sugarcane bagasse | 92 | 5.75 | 90 |
| Maize corn-cob | 62 | 3.0 | 90 |
| Jatropha oil cake | 97 | 11.75 | 90 |
| Modified fly ashes (MFAs) | 98.7 | 1.063 | 91 |
| Rubber | 100 | 43.86 | 92 |
| Fe3O4 nanoparticles | 88.83 | 0.610 | 93 |
| Microporous nano-activated carbon (MNAC) | 99.12 | 13.33 | 94 |
| Celtek clay | – | 21.55 | 95 |
| Red algae (Ceramium virgatum) | 90.0 | 26.5 | 96 |
| Lichen (Parmelina tiliaceae) biomass | 96.0 | 52.1 | 97 |
| Moss (Hylocomium splendens) biomass | 99.0 | 42.1 | 98 |
| Olive Leaves | ~ 52.0 | 42.4 | 99 |
MechanismoftheCr6+ionsabsorptiononMG-OPAC
Typically, the adsorption of metal ions involves intricate processes such as adsorption by physical forces, ion exchange, chelation, and ion entrapment in capillaries and gaps inside and between sorbent96,100,101. According to the FTIR study, the MG-OPAC contains several functional groups, including carboxyl, hydroxyl, and amine, which can be implicated in the binding processes. These functional groups also participate in metal ion binds, which rely on the pH level of the aqueous solution. At low pH, the positive surface charge of MG-OPAC should facilitate the binding of the negatively charged HCrO4– ions. At the active surfaces of the MG-OPAC, acidic conditions facilitate the interchange of the HCrO4– species with HO ions. Because the coordination interactions between metal ions and hydroxyl functional groups and other ion exchangeable moieties on the biomass surface are relatively weak in the mildly acidic solution, the sorption capacity decreased with increasing pH in the pH 3–5 range96,102. Furthermore, the ionized state of the MG-OPAC surface at the investigated pH is connected to the reduction in sorption at higher pH (pH > 5) in addition to the production of soluble hydroxylated complexes of the metal ions. These findings demonstrate the dominance of the pseudo-second-order sorption mechanism and the overall rate constant.
Conclusion
This study focused on the Cr6+ ions adsorption from water by magnetic orange peels activated carbon (MG-OPAC). The use of an external magnetic field makes it simple to extract MG-OPAC from the medium due to its high adsorption capabilities. At pH 1.5 and 180 min of contact time, the highest level of chromium adsorption was achieved. Adsorbent dosage enhanced the adsorption percentage, with 4.0 g/L absorbent dose achieving the highest adsorption percentage. As the Cr6+ ions concentration grew, the adsorption percentage decreased, but the quantity of Cr6+ absorbed per unit mass (adsorption capacity qe) of the absorbent increased. Timken isotherm model and LIM have described the working findings well and proposed a maximum monolayer adsorption capacity (Qm) of 277.8 mg/g. The PSOM results fit well the results of absorption kinetics.
Author contributions
A.K., who produced the original draft and oversaw the practical section, was in charge. Dr. M.S. reviewed the first manuscript draft. Prof. M.S. managed the research project. Dr. S.R., who also supervised the analysis work, edited the original text. Professor A.E.N. planned, and supervised the project, edited the final manuscript, and submitted it.
Funding
Open access funding provided by The Science, Technology & Innovation Funding Authority (STDF) in cooperation with The Egyptian Knowledge Bank (EKB). This work was partially supported by The Science, Technology & Innovation Funding Authority (STDF) of Egypt, project number CB-22816 and SCSE-31235.
Data availability
The datasets used in this investigation are accessible for review upon request from the corresponding author of the paper.
Competing interests
The authors declare no competing interests.
Footnotes
Publisher's note
Springer Nature remains neutral with regard to jurisdictional claims in published maps and institutional affiliations.
References
- 1.Golovin, V. L., Popova, T. Y., Medved, P. V., & Bezborodov, S. A. Treatment features of high-color natural waters. In IOPConferenceSeries:EarthandEnvironmentalScience, vol. 666, No. 4, 042039. (IOP Publishing, 2021).
- 2.El Nemr, A. PetroleumContaminationinWarmandColdMarineEnvironment. (Nova Science Publishers, Inc., 2005) (ISBN1-59454-615-0).
- 3.El Nemr, A. Impact, monitoring and management of environmental pollution. In PollutionScience,TechnologyandAbatementSeries (Nova Science Publishers, Inc., 2010) (ISBN-10:1608764877,ISBN-13:9781608764877).
- 4.El Nemr, A. Environmental pollution and its relation to climate change. In PollutionScience,TechnologyandAbatementSeries (Nova Science Publishers, Inc., 2011). (ISBN-13:978-1-61761-794-2).
- 5.Ali, H., & Khan, E. Environmental chemistry and ecotoxicology of hazardous heavy metals: Environmental persistence, toxicity, and bioaccumulation. J.Chem. 6730305 (2019).
- 6.Mehmood A, Mirza MA, Choudhary MA, Kim KH, Raza W, Raza N, Sarfraz M. Spatial distribution of heavy metals in crops in a wastewater irrigated zone and health risk assessment. Environ. Res. 2019;168:382–388. doi: 10.1016/j.envres.2018.09.020. [DOI] [PubMed] [Google Scholar]
- 7.Gupta, V. K., Ali, I. In EnvironmentalWater, Ch. 1 (eds. Ali, V. K. G.) (Elsevier, 2013).
- 8.Hunsom M, Pruksathorn K, Damronglerd S, Vergnes H, Duverneuil P. Electrochemical treatment of heavy metals (Cu2+, Cr6+, Ni2+) from industrial effluent and modeling of copper reduction. Water Res. 2005;39(4):610–616. doi: 10.1016/j.watres.2004.10.011. [DOI] [PubMed] [Google Scholar]
- 9.Adhoum N, Monser L, Bellakhal N, Belgaied JE. Treatment of electroplating wastewater containing Cu2+, Zn2+ and Cr (VI) by electrocoagulation. J. Hazard. Mater. 2004;112(3):207–213. doi: 10.1016/j.jhazmat.2004.04.018. [DOI] [PubMed] [Google Scholar]
- 10.Rai PK, Lee SS, Zhang M, Tsang YF, Kim KH. Heavy metals in food crops: Health risks, fate, mechanisms, and management. Environ. Int. 2019;125:365–385. doi: 10.1016/j.envint.2019.01.067. [DOI] [PubMed] [Google Scholar]
- 11.Merzouk B, Yakoubi M, Zongo I, Leclerc JP, Paternotte G, Pontvianne S, Lapicque F. Effect of modification of textile wastewater composition on electrocoagulation efficiency. Desalination. 2011;275(1–3):181–186. doi: 10.1016/j.desal.2011.02.055. [DOI] [Google Scholar]
- 12.Hassaan MA, El Nemr A, Madkour FF. Environmental assessment of heavy metal pollution and human health risk. Am. J. Water Sci. Eng. 2016;2(3):14–19. [Google Scholar]
- 13.Shanker, A. K. Chromium:EnvironmentalPollution,HealthEffectsandModeofAction. (2019).
- 14.Basha S, Murthy ZVP, Jha B. Biosorption of hexavalent chromium by chemically modified seaweed, Cystoseira indica. Chem. Eng. J. 2008;137(3):480–488. doi: 10.1016/j.cej.2007.04.038. [DOI] [Google Scholar]
- 15.Basta AH, Lotfy VF, Hasanin MS, Trens P, El-Saied H. Efficient treatment of rice byproducts for preparing high-performance activated carbons. J. Clean. Prod. 2019;207:284–295. doi: 10.1016/j.jclepro.2018.09.216. [DOI] [Google Scholar]
- 16.El Nemr A, Ismail M, El Ashry HES, Abdel Hamid H. Novel simple modification of chitosan as adsorptive agent for removal of Cr6+ from aqueous solution. Egypt. J. Chem. 2020;63(4):21–22. [Google Scholar]
- 17.Acar FN, Malkoc E. The removal of chromium (VI) from aqueous solutions by Fagus orientalis L. Bioresour. Technol. 2004;94(1):13–15. doi: 10.1016/j.biortech.2003.10.032. [DOI] [PubMed] [Google Scholar]
- 18.Abou-Elela SI, Fawzy ME, El-Sorogy MM, Abo-El-Enein SA. Bio-immobilization of Cr (VI) and its impact on the performance of a pilot scale anaerobic sludge reactor treating municipal wastewater. Egypt. J. Chem. 2018;61(4):629–637. [Google Scholar]
- 19.Rong S, Sun Y. Degradation of TAIC by water falling film dielectric barrier discharge–influence of radical scavengers. J. Hazard. Mater. 2015;287:317–324. doi: 10.1016/j.jhazmat.2015.02.003. [DOI] [PubMed] [Google Scholar]
- 20.Kongsuwan A, Patnukao P, Pavasant P. Binary component sorption of Cu (II) and Pb (II) with activated carbon from Eucalyptus camaldulensis Dehn bark. J. Ind. Eng. Chem. 2009;15(4):465–470. doi: 10.1016/j.jiec.2009.02.002. [DOI] [Google Scholar]
- 21.El Nemr, A. Non-conventional textile waste water treatment. In "PollutionScience,TechnologyandAbatement"Series (Nova Science Publishers, Inc., 2012). (HardcoverISBN:978-1-62100-079-2,e-bookISBN:978-1-62100-228-4). https://www.amazon.com/Non-Conventional-Treatment-Pollution-Technology-Abatement/dp/1621000796.
- 22.Abo-Farha SA, Abdel-Aal AY, Ashour IA, Garamon SE. Removal of some heavy metal cations by synthetic resin purolite C100. J. Hazard. Mater. 2009;169(1–3):190–194. doi: 10.1016/j.jhazmat.2009.03.086. [DOI] [PubMed] [Google Scholar]
- 23.Chen G. Electrochemical technologies in wastewater treatment. Sep. Purif. Technol. 2004;38(1):11–41. doi: 10.1016/j.seppur.2003.10.006. [DOI] [Google Scholar]
- 24.Alvarez MT, Crespo C, Mattiasson B. Precipitation of Zn (II), Cu (II) and Pb (II) at bench-scale using biogenic hydrogen sulfide from the utilization of volatile fatty acids. Chemosphere. 2007;66(9):1677–1683. doi: 10.1016/j.chemosphere.2006.07.065. [DOI] [PubMed] [Google Scholar]
- 25.Ipek U. Removal of Ni (II) and Zn (II) from an aqueous solutionby reverse osmosis. Desalination. 2005;174(2):161–169. doi: 10.1016/j.desal.2004.09.009. [DOI] [Google Scholar]
- 26.Shahalam AM, Al-Harthy A, Al-Zawhry A. Feed water pretreatment in RO systems: Unit processes in the Middle East. Desalination. 2002;150(3):235–245. doi: 10.1016/S0011-9164(02)00979-7. [DOI] [Google Scholar]
- 27.Nyirenda J, Zombe K, Kalaba G, Siabbamba C, Mukela I. Exhaustive valorization of cashew nut shell waste as a potential bioresource material. Sci. Rep. 2021;11(1):1–14. doi: 10.1038/s41598-021-91571-y. [DOI] [PMC free article] [PubMed] [Google Scholar]
- 28.Salman JM, Njoku VO, Hameed BH. Adsorption of pesticides from aqueous solution onto banana stalk activated carbon. Chem. Eng. J. 2011;174(1):41–48. doi: 10.1016/j.cej.2011.08.026. [DOI] [Google Scholar]
- 29.Amarasinghe BMWPK, Williams RA. Tea waste as a low-cost adsorbent for the removal of Cu and Pb from wastewater. Chem. Eng. J. 2007;132(1–3):299–309. doi: 10.1016/j.cej.2007.01.016. [DOI] [Google Scholar]
- 30.Munoz, G. A. Magnetic activated carbons for gold adsorption from alkaline cyanide solutions. Doctoral dissertation, PhD Thesis, University of Utah, Salt Lake City (2006).
- 31.El-Shamy AM, Farag HK, Saad W. Comparative study of removal of heavy metals from industrial wastewater using clay and activated carbon in batch and continuous flow systems. Egypt. J. Chem. 2017;60(6):1165–1175. [Google Scholar]
- 32.Guedes RE, Luna AS, Torres AR. Operating parameters for bio-oil production in biomass pyrolysis: A review. J. Anal. Appl. Pyrol. 2018;129:134–149. doi: 10.1016/j.jaap.2017.11.019. [DOI] [Google Scholar]
- 33.Wang Z, Yang H, Li Y, Zheng X. Robust silk fibroin/graphene oxide aerogel fiber for radiative heating textiles. ACS Appl. Mater. Interfaces. 2020;12(13):15726–15736. doi: 10.1021/acsami.0c01330. [DOI] [PubMed] [Google Scholar]
- 34.Altintig E, Onaran M, Sarı A, Altundag H, Tuzen M. Preparation, characterization and evaluation of bio-based magnetic activated carbon for effective adsorption of malachite green from aqueous solution. Mater. Chem. Phys. 2018;220:313–321. doi: 10.1016/j.matchemphys.2018.05.077. [DOI] [Google Scholar]
- 35.Saleh TA, Naeemullah TM, Sarı A. Polyethylenimine modified activated carbon asnovel magnetic adsorbent for the removal of uranium from aqueous solution. Chem. Eng. Res. Des. 2017;117:218–227. doi: 10.1016/j.cherd.2016.10.030. [DOI] [Google Scholar]
- 36.Altıntıg E, Altundag H, Tuzen M, Sarı A. Effective removal of methylene blue from aqueous solutions using magnetic loaded activated carbon as novel adsorbent. Chem. Eng. Res. Des. 2017;122:151–163. doi: 10.1016/j.cherd.2017.03.035. [DOI] [Google Scholar]
- 37.Tuzen M, Sarı A, Saleh TA. Response surface optimization, kinetic and thermodynamic studies for effective removal of rhodamine B by magnetic AC/CeO2 nanocomposite. J. Environ. Manag. 2018;206:170–177. doi: 10.1016/j.jenvman.2017.10.016. [DOI] [PubMed] [Google Scholar]
- 38.Ali Z, Ullah R, Tuzen M, Ullah S, Rahim A, Saleh TA. Colorimetric sensing of heavy metals on metal doped metal oxide nanocomposites: A review. Trends Environ. Anal. Chem. 2023;37:e00187. doi: 10.1016/j.teac.2022.e00187. [DOI] [Google Scholar]
- 39.Altıntıg E, Yenigun M, Sarı A, Altundag H, Tuzen M, Saleh TA. Facile synthesis of zinc oxide nanoparticles loaded activated carbon as an eco-friendly adsorbent for ultra-removal of malachite green from water. Environ. Technol. Innov. 2021;21:101305. doi: 10.1016/j.eti.2020.101305. [DOI] [Google Scholar]
- 40.Gerçel Ö, Özcan A, Özcan AS, Gercel HF. Preparation of activated carbon from a renewable bio-plant of Euphorbia rigida by H2SO4 activation and its adsorption behavior in aqueous solutions. Appl. Surf. Sci. 2007;253(11):4843–4852. doi: 10.1016/j.apsusc.2006.10.053. [DOI] [Google Scholar]
- 41.Han Q, Wang J, Goodman BA, Xie J, Liu Z. High adsorption of methylene blue by activated carbon prepared from phosphoric acid treated eucalyptus residue. Powder Technol. 2020;366:239–248. doi: 10.1016/j.powtec.2020.02.013. [DOI] [Google Scholar]
- 42.El-Sikaily A, El Nemr A, Khaled A. Copper sorption onto dried red alga Pterocladia capillacea and its activated carbon. Chem. Eng. J. 2011;168(2):707–714. doi: 10.1016/j.cej.2011.01.064. [DOI] [Google Scholar]
- 43.Marrakchi F, Ahmed MJ, Khanday WA, Asif M, Hameed BH. Mesoporous-activated carbon prepared from chitosan flakes via single-step sodium hydroxide activation for the adsorption of methylene blue. Int. J. Biol. Macromol. 2017;98:233–239. doi: 10.1016/j.ijbiomac.2017.01.119. [DOI] [PubMed] [Google Scholar]
- 44.Kumar JA, Amarnath DJ, Sathish S, Jabasingh SA, Saravanan A, Hemavathy RV, Yaashikaa PR. Enhanced PAHs removal using pyrolysis-assisted potassium hydroxide induced palm shell activated carbon: Batch and column investigation. J. Mol. Liq. 2019;279:77–87. doi: 10.1016/j.molliq.2019.01.121. [DOI] [Google Scholar]
- 45.Awual MR, Yaita T, Kobayashi T, Shiwaku H, Suzuki S. Improving cesium removal to clean-up the contaminated water using modified conjugate material. J. Environ. Chem. Eng. 2020;8(2):103684. doi: 10.1016/j.jece.2020.103684. [DOI] [Google Scholar]
- 46.Duan XL, Yuan CG, Jing TT, Yuan XD. Removal of elemental mercury using large surface area micro-porous corn cob activated carbon by zinc chloride activation. Fuel. 2019;239:830–840. doi: 10.1016/j.fuel.2018.11.017. [DOI] [Google Scholar]
- 47.Li W, Zheng P, Guo J, Ji J, Zhang M, Zhang Z, Abbas G. Characteristics of self-alkalization in high-rate denitrifying automatic circulation (DAC) reactor fed with methanol and sodium acetate. Bioresour. Technol. 2014;154:44–50. doi: 10.1016/j.biortech.2013.11.097. [DOI] [PubMed] [Google Scholar]
- 48.Zhang LI, Zhao LI, Yu Y, Chen C. Removal of lead from aqueous solution by non-living Rhizopus nigricans. Water Res. 1998;32(5):1437–1444. doi: 10.1016/S0043-1354(97)00348-5. [DOI] [Google Scholar]
- 49.Rouquerol F, Rouquerol J, Sing K. Adsorption by Powders and Porous Solids. Academic Press; 1999. [Google Scholar]
- 50.El Nemr A. Potential of pomegranate husk carbon for Cr (VI) removal from wastewater: Kinetic and isotherm studies. J. Hazard. Mater. 2009;161(1):132–141. doi: 10.1016/j.jhazmat.2008.03.093. [DOI] [PubMed] [Google Scholar]
- 51.El Nemr A, Khaled A, Abdelwahab O, El-Sikaily A. Treatment of wastewater containing toxic chromium using new activated carbon developed from date palm seed. J. Hazard. Mater. 2008;152(1):263–275. doi: 10.1016/j.jhazmat.2007.06.091. [DOI] [PubMed] [Google Scholar]
- 52.El Nemr A, El Sikaily A, Khaled A, Abdelwahab O. Removal of toxic chromium (VI) from aqueous solution by activated carbon using Casuarina equisetifolia. Chem. Ecol. 2007;23(2):119–129. doi: 10.1080/02757540701197754. [DOI] [Google Scholar]
- 53.Yorgun S, Vural N, Demiral H. Preparation of high-surface area activated carbons from Paulownia wood by ZnCl2 activation. Microporous Mesoporous Mater. 2009;122(1–3):189–194. doi: 10.1016/j.micromeso.2009.02.032. [DOI] [Google Scholar]
- 54.Gregg SJ, Sing KSW. Adsorption, Surface Area and Porosity. 2. Academic Press; 1982. [Google Scholar]
- 55.Sing KSW, Everett DH, Haul RAW, Moscou L, Pierotti RA, Rouquerol J, Siemieniewska T. Reporting physisorption data for gas/solid interface with special reference to the determination of surface area and porosity. Pure Appl. Chem. 1985;57:603–619. doi: 10.1351/pac198557040603. [DOI] [Google Scholar]
- 56.Do MH, Phan NH, Nguyen TD, Pham TTS, Vu TTT, Nguyen TKP. Activated carbon/Fe3O4 nanoparticle composite: Fabrication, methyl orange removal and regeneration by hydrogen peroxide. Chemosphere. 2011;85(8):1269–1276. doi: 10.1016/j.chemosphere.2011.07.023. [DOI] [PubMed] [Google Scholar]
- 57.El Nemr A, El Sikaily A, Khaled A, Abdelwahab O. Removal of toxic chromium from aqueous solution, wastewater and saline water by marine red alga Pterocladia capillacea and its activated carbon. Arab. J. Chem. 2015;8:105–117. doi: 10.1016/j.arabjc.2011.01.016. [DOI] [Google Scholar]
- 58.Yacob AR, Wahab N, Suhaimi NH, Mustajab MKAA. Microwave induced carbon from waste palm kernel shell activated by phosphoric acid. Int. J. Eng. Technol. 2013;5(2):214. doi: 10.7763/IJET.2013.V5.545. [DOI] [Google Scholar]
- 59.Shoaib, A. G., El-Sikaily, A., El Nemr, A., Mohamed, A. E. D. A., & Hassan, A. A. Preparation and characterization of highly surface area activated carbons followed type IV from marine red alga (Pterocladiacapillacea) by zinc chloride activation. BiomassConvers.Biorefinery 1–13 (2020).
- 60.Anyika C, Asri NAM, Majid ZA, Yahya A, Jaafar J. Synthesis and characterization of magnetic activated carbon developed from palm kernel shells. Nanotechnol. Environ. Eng. 2017;2(1):1–25. doi: 10.1007/s41204-017-0027-6. [DOI] [Google Scholar]
- 61.Ranjithkumar V, Sangeetha S, Vairam S. Synthesis of magnetic activated carbon/α-Fe2O3 nanocomposite and its application in the removal of acid yellow 17 dye from water. J. Hazard. Mater. 2014;273:127–135. doi: 10.1016/j.jhazmat.2014.03.034. [DOI] [PubMed] [Google Scholar]
- 62.Huang Y, Peng J, Huang X. One-pot preparation of magnetic carbon adsorbent derived from pomelo peel for magnetic solid-phase extraction of pollutants in environmental waters. J. Chromatogr. A. 2018;1546:28–35. doi: 10.1016/j.chroma.2018.03.001. [DOI] [PubMed] [Google Scholar]
- 63.Kapoor A, Viraraghavan T, Cullimore DR. Removal of heavy metals using the fungus Aspergillus niger. Bioresour. Technol. 1999;70(1):95–104. doi: 10.1016/S0960-8524(98)00192-8. [DOI] [Google Scholar]
- 64.Aksu Z. Equilibrium and kinetic modelling of cadmium (II) biosorption by C. vulgaris in a batch system: Effect of temperature. Sep. Purif. Technol. 2001;21(3):285–294. doi: 10.1016/S1383-5866(00)00212-4. [DOI] [Google Scholar]
- 65.Karthikeyan T, Rajgopal S, Miranda LR. Chromium (VI) adsorption from aqueous solution by Hevea Brasilinesis sawdust activated carbon. J. Hazard. Mater. 2005;124(1–3):192–199. doi: 10.1016/j.jhazmat.2005.05.003. [DOI] [PubMed] [Google Scholar]
- 66.Mohanty K, Jha M, Meikap BC, Biswas MN. Biosorption of Cr (VI) from aqueous solutions by Eichhornia crassipes. Chem. Eng. J. 2006;117(1):71–77. doi: 10.1016/j.cej.2005.11.018. [DOI] [Google Scholar]
- 67.Hamadi NK, Chen XD, Farid MM, Lu MG. Adsorption kinetics for the removal of chromium (VI) from aqueous solution by adsorbents derived from used tyres and sawdust. Chem. Eng. J. 2001;84(2):95–105. doi: 10.1016/S1385-8947(01)00194-2. [DOI] [Google Scholar]
- 68.El Nemr A, El-Sikaily A, Khaled A. Modeling of adsorption isotherms of Methylene Blue onto rice husk activated carbon. Egypt. J. Aquat. Res. 2010;36(3):403–425. [Google Scholar]
- 69.Eleryan A, Aigbe UO, Ukhurebor KE, Onyancha RB, Eldeeb TM, El-Nemr MA, Hassaan MA, Ragab S, Osibote OA, Kusuma HS, Darmokoesoemo H, El Nemr A. Copper (II) ion removal by chemically and physically modified Sawdust Biochar. Biomass Convers. Biorefinery. 2022 doi: 10.1007/s13399-022-02918-y. [DOI] [Google Scholar]
- 70.Shoaib AGM, El Nemr A, Ramadan MS, Masoud MS, El Sikaily A. Composite fabrication and characterization of crosslinked Polyaniline/Pterocladia capillacea—Activated carbon for adsorption of direct Blue-86 dye from water. Polym. Bull. 2022 doi: 10.1007/s00289-022-04563-x. [DOI] [Google Scholar]
- 71.Langmuir I. The constitution and fundamental properties of solids and liquids. Part I. Solids. J. Am. Chem. Soc. 1916;38(11):2221–2295. doi: 10.1021/ja02268a002. [DOI] [Google Scholar]
- 72.Freundlich H. Über die adsorption in lösungen. Z. Phys. Chem. 1907;57(1):385–470. doi: 10.1515/zpch-1907-5723. [DOI] [Google Scholar]
- 73.Mahmoud ME, Amira MF, Daniele S, El Nemr A, Abouelanwar ME, Morcos B. Recovery of silver and gold quantum dots from wastewater via coagulative adsorption onto CoFe2O4 based magnetic covalent-organic framework to generate efficient nanocatalysts for degradation of doxorubicin drug. J. Water Process Eng. 2023;51:103409. doi: 10.1016/j.jwpe.2022.103409. [DOI] [Google Scholar]
- 74.Crini G, Peindy HN, Gimbert F, Robert C. Removal of CI Basic Green 4 (Malachite Green) from aqueous solutions by adsorption using cyclodextrin-based adsorbent: Kinetic and equilibrium studies. Sep. Purif. Technol. 2007;53(1):97–110. doi: 10.1016/j.seppur.2006.06.018. [DOI] [Google Scholar]
- 75.Eleryan A, Yılmaz M, El-Nemr MA, Ragab S, Helal M, Hassaan MA, El Nemr A. Mandarin Biochar-TETA (MBT) prepared from Citrus reticulata peels for adsorption of Acid Yellow 11 dye from water. Sci. Rep. 2022;12:17797. doi: 10.1038/s41598-022-22359-x. [DOI] [PMC free article] [PubMed] [Google Scholar]
- 76.Tempkin MI, Pyzhev V. Kinetics of ammonia synthesis on promoted iron catalyst. Acta Phys. Chim. USSR. 1940;12(1):327. [Google Scholar]
- 77.El-Nemr MA, Aigbe UO, Ukhurebor KE, Onyancha RB, El Nemr A, Ragab S, Osibote OA, Hassaan MA. Adsorption of Cr6+ ion using activated Pisum sativum peels decorated with triethylenetetramine. Environ. Sci. Pollut. Res. 2022;29:91036–91060. doi: 10.1007/s11356-022-21957-6. [DOI] [PMC free article] [PubMed] [Google Scholar]
- 78.El-Nemr MA, El Nemr A, Hassaan MA, Ragab S, Tedone L, De Mastro G, Pantaleo A. Microporous activated carbon prepared from Pisum sativum pods using different activation methods for adsorptive removal of Acid Orange 7 dye from water. Molecules. 2022;27:4840. doi: 10.3390/molecules27154840. [DOI] [PMC free article] [PubMed] [Google Scholar]
- 79.Lagergren S. Zur theorie der sogenannten adsorption geloster stoffe. Kungliga Svenska Vetenskapsakademiens, Handlingar. 1898;24:1–39. [Google Scholar]
- 80.Ho YS, McKay G, Wase DAJ, Forster CF. Study of the sorption of divalent metal ions on to peat. Adsorpt. Sci. Technol. 2000;18(7):639–650. doi: 10.1260/0263617001493693. [DOI] [Google Scholar]
- 81.McKay, G. The adsorption of dyestuffs from aqueous solution using activated carbon. Analytical solution for batch adsorption based on external mass transfer and pore diffusion. Chem.Eng. (1983).
- 82.Boyd GE, Adamson AW, Myers LS., Jr The exchange adsorption of ions from aqueous solutions by organic zeolites. II. Kinetics. J. Am. Chem. Soc. 1947;69(11):2836–2848. doi: 10.1021/ja01203a066. [DOI] [PubMed] [Google Scholar]
- 83.Chien SH, Clayton WR. Application of Elovich equation to the kinetics of phosphate release and sorption in soils. Soil Sci. Soc. Am. J. 1980;44(2):265–268. doi: 10.2136/sssaj1980.03615995004400020013x. [DOI] [Google Scholar]
- 84.Sparks, D. L. Kinetics of reactions in pure and in mixed systems. Soil Phys. Chem. 83–145 (1986).
- 85.Zeldowitsch J. Über den mechanismus der katalytischen oxydation von CO an MnO2. Acta Physicochim. URSS. 1934;1:364–449. [Google Scholar]
- 86.Hosain ANA, El Nemr A, El Sikaily A, Mahmoud ME, Amira MF. Surface modifications of nanochitosan coated magnetic nanoparticles and their applications in Pb(II), Cu(II) and Cd(II) removal. J. Environ. Chem. Eng. 2020;8(5):104316. doi: 10.1016/j.jece.2020.104316. [DOI] [Google Scholar]
- 87.El Nemr A, El-Assal AAM, El Sikaily A, Mahmoud ME, Amira MF, Ragab S. New magnetic cellulose nanobiocomposites for Cu(II), Cd(II) and Pb(II) ions removal: Kinetics, thermodynamics and analytical evaluation. Nanotechnol. Environ. Eng. 2021;6:42. doi: 10.1007/s41204-021-00138-9. [DOI] [Google Scholar]
- 88.El Nemr A, Eleryan A, Ragab S. Synthesis of 6-cellulose-triethylenetetramine-glutaraldehyde for removal of toxic chromium from aquatic environment. Desalin. Water Treat. 2020;245(1):129–143. doi: 10.5004/dwt.2021.27960. [DOI] [Google Scholar]
- 89.Yılmaz M, Eldeeb TM, Hassaan MA, El-Nemr MA, Ragab S, El Nemr A. The use of Mandarin-Biochar-O3-TETA (MBT) produced from mandarin peels as a natural adsorbent for the removal of Acid Red 35 (AR35) dye from water. Environ. Process. 2022;9:44. doi: 10.1007/s40710-022-00592-w. [DOI] [Google Scholar]
- 90.Garg UK, Kaur MP, Garg VK, Sud D. Removal of hexavalent chromium from aqueous solution by agricultural waste biomass. J. Hazard. Mater. 2007;140(1–2):60–68. doi: 10.1016/j.jhazmat.2006.06.056. [DOI] [PubMed] [Google Scholar]
- 91.Ren, R. S., Shi, F. E., Chen, Y. N., & Jiang, D. H. Kinetic and equilibrium studies of Cr (VI) from wastewater with modified fly ashes. In 20104thInternationalConferenceonBioinformaticsandBiomedicalEngineering 1–4. (IEEE, 2010).
- 92.Vasudevan M, Ajithkumar PS, Singh RP, Natarajan N. Mass transfer kinetics using two-site interface model for removal of Cr(VI) from aqueous solution with cassava peel and rubber tree bark as adsorbents. Environ. Eng. Res. 2015;21(2):152–163. doi: 10.4491/eer.2015.152. [DOI] [Google Scholar]
- 93.Zhang J, Lin S, Han M, Su Q, Xia L, Hui Z. Adsorption properties of magnetic magnetite nanoparticle for coexistent Cr (VI) and Cu (II) in mixed solution. Water. 2020;12(2):446. doi: 10.3390/w12020446. [DOI] [Google Scholar]
- 94.El Nemr, A., Aboughaly, R. M., El Sikaily, A., Ragab, S., Masoud, M. S., & Ramadan, M. S. Microporous nano-activated carbon type I derived from orange peel and its application for Cr (VI) removal from aquatic environment. BiomassConvers.Biorefinery. 1–19 (2020).
- 95.Sarı A, Tuzen M, Soylak M. Adsorption of Pb(II) and Cr(III) from aqueous solution on Celtek clay. J. Hazard. Mater. 2007;144:41–46. doi: 10.1016/j.jhazmat.2006.09.080. [DOI] [PubMed] [Google Scholar]
- 96.Sarı A, Tuzen M. Biosorption of total chromium from aqueous solution by red algae (Ceramium virgatum): Equilibrium, kinetic and thermodynamic studies. J. Hazard. Mater. 2008;160:349–355. doi: 10.1016/j.jhazmat.2008.03.005. [DOI] [PubMed] [Google Scholar]
- 97.Uluozlu OD, Sari A, Tuzen M, Soylak M. Biosorption of Pb(II) and Cr(III) from aqueous solution by lichen (Parmelina tiliaceae) biomass. Bioresour. Technol. 2008;99:2972–2980. doi: 10.1016/j.biortech.2007.06.052. [DOI] [PubMed] [Google Scholar]
- 98.Sari A, Mendil D, Tuzen M, Soylak M. Biosorption of Cd(II) and Cr(III) from aqueous solution by moss (Hylocomium splendens) biomass: Equilibrium, kinetic and thermodynamic studies. Chem. Eng. J. 2008;144:1–9. doi: 10.1016/j.cej.2007.12.020. [DOI] [Google Scholar]
- 99.Sahin G, Aslan A, Tuzen M, Sarıd A. Removal of Cr ions from aquatic solutions using olive leaves as low-cost bio-sorbent. At. Spectrosc. 2020;41(6):256–262. [Google Scholar]
- 100.Zhang Y, Banks C. A comparison of the properties of polyurethane mmobilized Sphagnum moss, seaweed, sunflower waste and maize for the biosorption of Cu, Pb, Zn and Ni in continuous flow packed columns. Water Res. 2006;40:788–798. doi: 10.1016/j.watres.2005.12.011. [DOI] [PubMed] [Google Scholar]
- 101.Chojnacka K, Chojnacki A, Gorecka H. Biosorption of Cr3+, Cd2+ and Cu2+ ions by blue-green algae Spirulina sp.: Kinetics, equilibrium and the mechanism of the process. Chemosphere. 2005;59:75–84. doi: 10.1016/j.chemosphere.2004.10.005. [DOI] [PubMed] [Google Scholar]
- 102.Argun ME, Dursun S, Ozdemir C, Karatas M. Heavy metal adsorption by modified oak sawdust: Thermodynamics and kinetics. J. Hazard. Mater. 2007;141:77–85. doi: 10.1016/j.jhazmat.2006.06.095. [DOI] [PubMed] [Google Scholar]
Associated Data
This section collects any data citations, data availability statements, or supplementary materials included in this article.
Data Availability Statement
The datasets used in this investigation are accessible for review upon request from the corresponding author of the paper.