

Abstract
A combination of different methods was applied to investigate the occurrence of anaerobic processes in aerated activated sludge. Microsensor measurements (O2, NO2−, NO3−, and H2S) were performed on single sludge flocs to detect anoxic niches, nitrate reduction, or sulfate reduction on a microscale. Incubations of activated sludge with 15NO3− and 35SO42− were used to determine denitrification and sulfate reduction rates on a batch scale. In four of six investigated sludges, no anoxic zones developed during aeration, and consequently denitrification rates were very low. However, in two sludges anoxia in flocs coincided with significant denitrification rates. Sulfate reduction could not be detected in any sludge in either the microsensor or the batch investigation, not even under short-term anoxic conditions. In contrast, the presence of sulfate-reducing bacteria was shown by fluorescence in situ hybridization with 16S rRNA-targeted oligonucleotide probes and by PCR-based detection of genes coding for the dissimilatory sulfite reductase. A possible explanation for the absence of anoxia even in most of the larger flocs might be that oxygen transport is not only diffusional but enhanced by advection, i.e., facilitated by flow through pores and channels. This possibility is suggested by the irregularity of some oxygen profiles and by confocal laser scanning microscopy of the three-dimensional floc structures, which showed that flocs from the two sludges in which anoxic zones were found were apparently denser than flocs from the other sludges.
Activated of sludge is currently the most widely used process for the treatment of both domestic and industrial wastewaters and, at least by scale, one of the most important microbiological technologies (18). It relies primarily on the degradation and uptake of organic matter by a microbial community under oxic conditions. Processes at modern plants are often supplemented with anoxic reactor stages to enhance nitrogen and phosphorous removal. The biomass is finally separated from the purified water by gravitational settling prior to the recirculation of part of this sludge back into the aeration basin. The process, therefore, selects for microorganisms that remain in the system due to their growth in flocs.
This immobilized growth leads to conditions that markedly differ from conditions of suspended growth in the bulk water phase. Closer interactions of different physiological types of microorganisms, e.g., of ammonia and nitrite oxidizers (22), are possible, and bacteria are better protected from protozoan grazing (13) or harmful substances. On the other hand, the transport of solutes (e.g., oxygen and nutrients) in flocs is expected to be mainly diffusional (50, 51). Although the vast majority of activated sludge flocs have been reported to be smaller than 20 μm in diameter, i.e., of a size at which diffusion limitation is unlikely, flocs larger than 50 μm contribute the most to surface area, volume, and mass (28). In these larger flocs, the development of anoxic zones has been postulated due to diffusion limitation (see e.g., reference 50). This possibility allows for combined nitrification-denitrification in quasistratified flocs; hence, reaction space and time would be saved (16 and 51 and references therein). Less beneficial, anoxic microniches may also support the survival and activity of sulfate-reducing bacteria (SRB) in aerated activated sludge, resulting in the production of H2S and subsequent problems with sludge bulking (58) or floc disintegration (38).
These hypotheses have been supported indirectly by several reports of nitrogen losses from aeration basins (e.g., in references 16, 20, and 51) and by the detection of SRB in activated sludge by cultivation (26, 58) and fluorescence in situ hybridization (FISH) (34). In contrast, no anoxic zones could be detected with oxygen microsensors in large activated sludge flocs (diameter, 1.6 mm) at air saturation (26).
Recently, a flow system was developed for microelectrode measurements in freely sinking aggregates (“marine snow”) that also enables the analysis of smaller and more fragile flocs in a natural flow field (40, 41). We used this setup for microsensor measurements of oxygen, nitrate, nitrite, and hydrogen sulfide in individual activated sludge flocs. These single floc measurements were complemented with 15NO3− and 35SO42− incubation experiments (15, 37) to determine overall rates of denitrification and sulfate reduction in the different sludges tested. Finally, the three-dimensional structure, which is critical for the transport mechanism in a floc (diffusion or advection), was recorded by confocal laser scanning microscopy (CLSM) and the samples were screened for SRB by FISH with rRNA-targeted oligonucleotide probes (4, 34) and by PCR with primers specific for the dissimilatory sulfite reductase gene (53). By this multiple-method approach we hoped to achieve a more comprehensive picture of the occurrence and preconditions of anaerobic processes in activated sludge flocs.
MATERIALS AND METHODS
Samples.
Activated sludge samples were obtained from the aeration basins of municipal wastewater treatment plants (WWTP) in Bremen-Seehausen (Germany), Aarhus-Marselisborg, Odder (both Denmark), and Prague (Czech Republic), and from two lab-scale sequencing batch reactors (SBR) receiving artificial wastewater (peptone, 1,000 mg chemical oxygen demand (COD) liter−1; acetic acid, 300 mg COD liter−1; glucose, 400 mg COD liter−1; ethanol, 300 mg COD liter−1, total N, 82 mg liter−1; N-NH4+, 0.2 mg liter−1; total P, 14 mg liter−1). The sulfate concentration was 102 mg of SO42− liter−1. Both SBR were operated with rapid filling periods (5 to 10 min) to simulate the conditions in a plug-flow reactor with high-substrate-concentration gradients. SBR1 was operated with a complete oxic cycle (23 h of aeration, 1 h of settling), whereas SBR2 was subjected to an alternating cycle (3 h of anoxic conditions, 8 h of aeration, 1 h of settling). Some operational data of the investigated sludges are summarized in Table 1.
TABLE 1.
Operational data of the investigated activated sludge plants
| Site | COD (mg liter−1)a | N-NH4 (mg liter−1)a | Total P (mg liter−1)a | MLSSb (g liter−1)a | Reaction time (h) | Sludge age (days) |
|---|---|---|---|---|---|---|
| Aarhus WWTP | 419 | 33.1 | 3.2 | 4.3 | 5.7 | 25 |
| Bremen WWTP | 476 | 37.5 | 7.0 | 3.04 | 6.5 | 10 |
| Odder WWTP | 450 | 34 | 12 | 3.14 | NAd | NA |
| Prague WWTP | 242 | 20 | 3.65 | 2.7 | 3.3 | 3.3 |
| SBR1 | 2,000 | 0.2c | 14 | 7.4 | 46 | 25 |
| SBR2 | 2,000 | 0.2c | 14 | 3.2 | 33 | 8 |
Influent values.
MLSS, mixed-liquor suspended solids.
N was supplied as organic N in peptone; total N (influent) was 82 mg liter−1.
NA, data not available.
For microsensor measurements a small portion of sludge was diluted to avoid massive agglomeration of flocs after sampling, and single flocs were carefully transferred to the measuring setup by means of a pipette with the tip cut open. For the batch experiments, freshly collected sludge was allowed to settle, the supernatant was discarded, and the concentrated sludge was used for the incubations.
Microsensor measurements.
Clark-type microsensors for O2 (42), LIX-type microsensors for NO2− and NO3− (8), and amperometric H2S microsensors (25) were constructed, calibrated, and used for measurements as previously described. The lower detection limits of NO2− and H2S were 0.1 and 1 μM, respectively. Microprofiles of single activated sludge flocs were recorded by keeping the flocs freely suspended in a vertical-flow system, where the flow velocity opposed and balanced the sinking velocity of the individual floc. To create a parallel, nonturbulent, uniform flow, a nylon stocking was mounted in the flow chamber horizontally to the flow and the flocs were positioned just above this net (40, 41). With this flow system the flocs could be stabilized in the upwardly flowing water column and microsensor measurements with a spatial resolution of 25 to 50 μm were possible from above, i.e., downstream of the floc, without disturbing the flow field (40). For practical reasons, microprofiles of different chemical species were usually recorded in different flocs.
The artificial wastewater used in the flow chamber contained 200 μM sodium acetate, 760 μM (NH4)2SO4, 220 μM KH2PO4, 400 μM K2HPO4, and 41 μM MgSO4, representing a low food-to-microorganism (F/M) ratio of approximately 0.1, which is a value typical for most nutrient removal plants (47). For measurements of NO2− and NO3− profiles, this medium was supplemented with 100 μM KNO3. Microsensor measurements were performed at 20°C under three different oxygen conditions: air saturation (∼280 μM), 2 mg of oxygen liter−1 (∼60 μM, the oxygen set point of most aeration basins), and anoxic conditions.
Additionally, 10 ml of activated sludge was amended with a mixture of acetate, propionate, and butyrate (final concentration, 1 mM each) in a test tube and incubated for approximately 1 h without aeration. After oxygen was depleted (proven by microsensor measurements), an H2S microsensor was repeatedly introduced into the sludge.
Calculations.
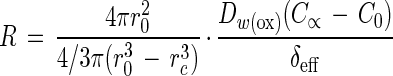
The volumetric oxygen respiration rate (R) of a sphere with zero-order kinetics at steady state is described by the following equation (41):
 |
1 |
where r0 is the radius of the sphere, 4πr02 and 4/3πr03 are the surface area and volume, respectively, rc is the radial distance from the center at which the oxygen concentration becomes 0 (if there is no anoxic zone, rc equals 0), DW(ox) is the molecular diffusion coefficient of oxygen in water, C∞ and C0 are the concentrations of oxygen in the bulk water phase and at the floc surface, respectively, and δeff is the effective thickness of the diffusive boundary layer (DBL) (see Fig. 1). The same formula was used to calculate nitrate reduction rates of single flocs from nitrate microprofiles. The DW for oxygen at 20°C is 2.12 · 10−5 cm2 s−1 (5), and that for nitrate is 1.66 · 10−5 cm2 s−1 (29). Determination of δeff and data processing were done by a simple diffusion-reaction model by assuming zero-order kinetics as described in detail by Ploug et al. (41).
FIG. 1.

Typical microprofiles of oxygen, nitrite, and nitrate in activated sludge flocs from the WWTP at Prague (A) and SBR1 (B), measured in the net-jet flow chamber with 2 mg of O2 liter−1. The dotted nitrate profile in panel A was recorded under anoxic conditions and displays the nitrate reduction potential of the floc. All profiles shown were measured in separate flocs of the same size, and the data were compiled for the two panels displayed. Shaded area, floc; r0, floc surface; rc, distance from the floc center where oxygen disappears; δeff, effective DBL.
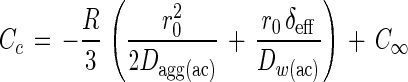
Acetate concentration at the floc center was estimated from the volumetric oxygen respiration rates with the following equation (41):
 |
2 |
where Cc is the acetate concentration at the floc center, δeff is the effective thickness of the DBL determined from the oxygen profiles, and Dagg(ac) and DW(ac) are the molecular diffusion coefficients of acetate in the floc and in water, which were assumed to be the same. DW(ac) was calculated with standard tables and formulas (30) and corrected for codiffusion of NH4+ (the cation with the highest concentration in the medium) to a value of 1.00 · 10−5 cm2 s−1 (29). The same formula was also applied with respect to oxygen, where C and D are concentrations and diffusion coefficients of oxygen, respectively (41). Thereby, the respiration rates required to create anoxic conditions at the floc center (i.e., with Cc equal to 0) were calculated as a function of floc size at different bulk water concentrations of oxygen (see Fig. 5).
FIG. 5.

Volumetric oxygen respiration rates required to create anoxic conditions exactly at the center of a floc with a maximum DBL under different bulk oxygen concentrations (calculated from equation 2). Under such diffusion-limited conditions, R decreases with the square of the floc radius. The shaded area represents respiration rates and floc diameters that have been measured during this study. The dotted line represents the highest volumetric respiration rates measured in microbial communities (9, 21).
15NO3− incubations.
Denitrification rates were determined with a batch reactor with a liquid volume of 1.2 liters and a gas volume of 0.5 liter (including tubing). The reactor was cylindrical with a diameter of 10 cm and a height of 17 cm. The bottom section was funnel shaped with a porous glass grid in the center, through which gas was supplied. This arrangement prevented the development of stagnant zones. The gas flow rate was just sufficient to keep the flocs in suspension. Oxygen concentration measurements at different positions within the reactor showed that it was well mixed under test conditions. Prior to the incubations, N2 in the reactor was exchanged by argon to lower the background, thereby improving the detection of 15N-enriched N2. Rate measurements were performed at air saturation, at an oxygen concentration of 40 to 60 μM, and in the absence of oxygen by adjusting the oxygen/argon ratio in the gas supply. An oxygen microelectrode was inserted in the reactor for continuous monitoring during the experiments. Three hundred milliliters of concentrated activated sludge was added to the reactor, which was then filled up with 1 liter of artificial wastewater (as described for the microsensor measurements) and amended with sodium acetate to a concentration of 7.8 mM. The reactor contained 2 to 4 g of total suspended solids (TSS) liter−1. After the oxygen concentration was adjusted, 8.3 ml of Na15NO3 was added from a 12 mM stock solution of 99.2 atom% of 15NO3−, corresponding to a final concentration of 100 μM 15NO3−. During the 30-min incubation experiment, gas samples of 1 ml were taken from the reactor headspace every three minutes through a septum with a gas-tight syringe (model 1001RN; Hamilton) and transferred to gas-tight exetainers (Labco) that had been filled with N2-free distilled water.
Subsamples of gas (250 μl) were analyzed on an isotope ratio mass spectrometer with collectors for 28N2, 29N2, and 30N2 (Sira Series II; VG Isotech, Middlewich, Chesire, United Kingdom) as described previously (37, 44). Total denitrification rates were calculated as the sum of levels of denitrification of 15NO3− and 14NO3−, which were derived from the measured production of 14N15N and 15N15N as described in detail by Nielsen (37).
35SO42− incubations.
Sulfate reduction rates were determined by the 35S-radiotracer method (15) in samples from SBR1, SBR2, and the WWTP at Prague. Reactor design, incubation conditions, and filling of the reactor were as described for the 15N experiments. After the oxygen concentration was adjusted, 20 ml of tracer was added (Na235SO4, 2 MBq). Through a septum, samples of 5 ml were taken from the reactor during the first 10 minutes once per minute and then for another 10 minutes once every two minutes. Subsequently, samples were taken every 10 minutes until 1 h after the start of the test. To each sample, 5 ml of fixation solution (20% Zn acetate, 1% formaline [pH 5]) was added, and the mixture was shaken well. Samples to which 0.1 ml of tracer was added after fixation were used as blanks for each incubation. Fixed samples were stored at 4°C until further analysis within 2 months. The samples were then centrifuged at 10,000 × g, and the reduced sulfur species in the pellet were determined by single-step chromate distillation according to the method of Fossing and Jørgensen (15). The detection limit of the method was a sulfate reduction rate of 5 μmol of S g of TSS−1 h−1.
SRB screening.
Activated sludge samples were fixed with paraformaldehyde, immobilized on microscopic slides, and dehydrated as described previously (3). For FISH, a set of oligonucleotide probes specific for SRB was used, specifically, probe SRB385 (2), which targets a broad range of SRB but also binds to numerous non-SRB (e.g., myxobacteria, clostridiae, and actinomycetes [34]); probes DSV698, DSV407, DSV1292, and DSV214, specific for the family Desulfovibrionaceae (34), probes 221 and 660, specific for the genera Desulfobacterium and Desulfobulbus, respectively (10); and probes DSB985 and DSS658, specific for the genus Desulfobacter and the taxon Desulfosarcina-Desulfococcus (34), respectively. All probes were purchased labeled with the fluorescent dye CY3 (Interactiva Biotechnologie, Ulm, Germany) and used in FISH by using the protocol and the conditions recently described by Manz et al. (34). After the hybridization procedure the samples were stained with 4′,6-diamidino-2-phenylindole (DAPI) according to the method of Wagner et al. (52), mounted with antifading reagent (Vectashield; Vector Laboratories Inc., Burlingame, Calif.), and examined under an epifluorescence microscope (Carl Zeiss, Jena, Germany).
Independent testing for the presence of SRB was done by amplification of a 1.9-kb DNA fragment encoding most of the α and β subunits of the dissimilatory sulfite reductase (DSR). DNAs were extracted from four activated sludge samples (WWTP in Bremen and Prague, SBR1, and SBR2) by a combined freeze-thaw (three cycles of freezing in liquid nitrogen and heating at 37°C) and hot phenol-chloroform-isoamyl alcohol treatment (49). The DSR gene fragments were then amplified with the primer pair DSR1F (5′-AC[C/G]CACTGGAAGCACG-3′) and DSR4R (5′-GTGTAGCAGTTACCGCA-3′) described by Wagner et al. (53). The PCR mixture (100 μl) contained 100 pmol of each primer, 25 nmol of all four deoxynucleoside triphosphates, 200 μg of bovine serum albumin, 10 μl of 10× PCR buffer (HT Biotechnology Ltd.), and 10 to 100 ng of template DNA. We used a hot-start PCR program in which 1 U of SuperTaq DNA polymerase (HT Biotechnology Ltd.) was added at 80°C after 5 min of heating at 94°C and in which there were 35 cycles of 1 min at 94°C, 1 min at 60°C, and 3 min at 72°C. The PCR products were loaded and evaluated on a 1% agarose gel. As a positive control for proper PCR performance with DNAs from activated sludge samples, a 550-bp-long 16S rDNA fragment was amplified with universal primers as described by Muyzer et al. (36).
Three-dimensional (3D) analysis of flocs.
For staining with fluorescein isothiocyanate (FITC), which covalently binds to proteins (19), 0.2 ml of settled flocs was added to 15 ml of staining solution (0.1 M sodium phosphate [pH 7.0], 4 mg of FITC liter−1). After 5 min of gentle mixing, the aggregates were allowed to settle, the solution was decanted, and the flocs were washed twice with 0.1 M sodium phosphate, pH 7.0. The aggregates were stored at 4°C in 0.1 M sodium phosphate (pH 7.0) with 4% paraformaldehyde. For CLSM analysis, the pH was raised to 9 by the addition of 1 M carbonate buffer. Staining with calcofluor to visualize polysaccharides was performed similarly in the same buffer with 300 mg of calcofluor liter−1 (7). The staining time was 2 h. Washing and storage were as described above. The aggregates were microscopically examined at pH 7.0. DNAs within the flocs were stained with ethidium bromide (1 μg ml−1) for 15 min in the same buffer. The flocs were washed as described above and immediately analyzed by CLSM.
CLSM analysis.
FITC-, calcofluor-, and ethidium bromide-stained flocs were transferred in 1 ml of buffer to a chamber sealed on the bottom with a glass cover and analyzed with an inverse CLSM (model LSM510; Carl Zeiss). A 40× objective (model Plan-Neofluar 1.3) was used and three different lasers (UV wavelength, 351 plus 364 nm; Ar ion wavelength 458 plus 488 nm; HeNe wavelength, 543 nm) were applied for excitation. Image processing, including 3D reconstruction, was performed with the standard software package delivered with the instrument (version 2.01, service pack 2). Images were printed on a Kodak printer 8650 by use of the software package Power Point (version 7.0; Microsoft).
RESULTS
Microprofiles.
We took microsensor measurements for the different parameters in 250 individual activated sludge flocs with a size range of 400 to 2,300 μm (maximum length as observed by dissection microscopy). Larger flocs often consisted of a loose agglomeration of compact subunits of 50 to 100 μm, suggesting a dynamic aggregation and disintegration. Flocs smaller than 400 μm could not be sufficiently stabilized in the flow chamber for profiling.
When the flocs were incubated under air saturation (∼280 μM), oxygen was never depleted but showed values of 90 to 200 μM in the floc center. In several flocs (indicated by arrows in Fig. 3) oxygen gradients were somewhat irregular or weak, and oxygen increased locally inside a floc. Nitrite concentrations slightly increased towards the center, reaching 0.5 to 2 μM, probably due to nitrification. Nitrate concentrations increased to above bulk water concentrations in some flocs (indicating nitrifying activity), appeared unchanged in other flocs, and decreased by 5 to 10 μM in only three large flocs (SBR2).
FIG. 3.

Volumetric oxygen respiration rates versus floc diameter as measured under air saturation (A) and under 2 mg of O2 liter−1 (B). Arrows indicate flocs where the oxygen profile was most likely influenced by advective transport (liquid flow). These data points were excluded from the regression curve, as the respiration rates are most probably underestimates (see Discussion).
Incubation under 40 to 60 μM oxygen, resembling the conditions in aeration basins, led to oxygen concentrations of typically less than 20 μM in the floc center. Complete depletion of oxygen was observed within 12 of 14 flocs from the two SBR and within 2 of 8 flocs from the WWTP at Bremen but not within flocs from any other sample. Accordingly, a significant decrease of nitrate towards the floc center was detected only within the SBR flocs, and nitrate reduction rates of individual flocs were calculated in the range of 2 to 14 nmol mm−3 h−1 (average for SBR1 flocs, 5.9 nmol mm−3 h−1; average for SBR2 flocs, 10.2 nmol mm−3 h−1). All other samples showed no or very little nitrate consumption (maximum nitrate reduction rate, 1.7 nmol mm−3 h−1; averages, 0 to 0.7 nmol mm−3 h−1). Nitrite concentrations in most flocs were below 2 μM and showed hardly any change. In a few flocs nitrite accumulated to concentrations of 5 to 20 μM, possibly because nitrite oxidation was inhibited by low oxygen concentrations. Typical profiles of oxygen, nitrate, and nitrite in activated sludge flocs from the WWTP samples and from SBR samples are displayed in Fig. 1A and B, respectively.
To test the samples for their nitrate reduction capacity, we also recorded nitrate and nitrite profiles while oxygen was absent. A decrease of nitrate was measured in virtually all tested flocs from all sludges (Fig. 1A). The derived nitrate reduction rates were quite heterogeneous, spanning a range of 0.5 to 27 nmol mm−3 h−1. Nitrite profiles were similar to the ones measured under 40 to 60 μM oxygen, although nitrite production in this case must be attributed to nitrate reduction.
No H2S was detectable by microsensor measurements in any floc from any sample, not even in sludge that had been amended with a mixture of acetate, propionate, and butyrate and incubated under anoxic conditions for 1 h in a test tube.
Respiration rate.
Volumetric respiration rates (R) of individual flocs were calculated from the oxygen profiles by assuming diffusion to be the only transport process. They were between 0 and 18 nmol of O2 mm−3 h−1, with the highest R values being found in those sludges in which anoxic microniches had been detected, i.e., in SBR1, SBR2, and the WWTP at Bremen (Fig. 2). Under 40 to 60 μM oxygen, the respiration rates obviously decreased with floc size (Fig. 3B), while under air saturation this trend was somewhat less pronounced (Fig. 3A).
FIG. 2.

Mean volumetric respiration rates (R) and mean floc sizes (d) with standard deviations (T bars) of all flocs from all samples in which oxygen gradients were measured. The dotted line indicates a floc diameter of 1 mm. ∗, sludges in which anoxic zones were detected.
Incubation experiments.
Batch experiments to determine denitrification and sulfate reduction rates by stable isotope and radioisotope techniques were performed under the same conditions and with results similar to those of the microsensor measurements (Table 2). Under air saturation virtually no denitrification occurred, and under reactor conditions the rates were extremely low except with the SBR samples. All sludges were, however, capable of denitrification under anoxic conditions. Sulfate reduction could not be detected either in sludge from the Prague WWTP or in sludges from the SBR, regardless of the aeration conditions applied (air saturation, reactor conditions, or anoxic conditions).
TABLE 2.
Denitrification rates as determined by 15NO3 incubations of various sludges under three different incubation conditions
| Sludge sample | Mean denitrification rate ± SD (μmol of N g of TSS−1 min−1)
|
||
|---|---|---|---|
| Air saturation | 20% air saturation | Anoxic conditions | |
| Aarhus WWTP | 0.003 ± 0.001 | 0.114 ± 0.058 | 1.496 ± 0.151 |
| Bremen WWTP | NDa | 0.046 ± 0.013 | 3.212 ± 1.690 |
| Odder WWTP | 0.007 ± 0.004 | 0.040 ± 0.003 | 1.592 ± 0.401 |
| Prague WWTP | 0.005 ± 0.003 | 0.038 ± 0.005 | 1.198 ± 0.358 |
| SBR1 | 0.191 ± 0.12 | 0.470 ± 0.234 | 1.257 ± 0.128 |
| SBR2 | 0.101 ± 0.022 | 0.940 ± 0.282 | 1.826 ± 0.246 |
ND, not determined.
SRB screening.
FISH with probe SRB385 suggested the presence of SRB in all tested sludges. The abundance of specifically hybridized cells was roughly estimated to be 1 to 2% in the SBR and 3 to 5% of total cells stained by DAPI in all other samples. Of the more specific probes, only DSV698 and DSV1292, complementary to the majority of Desulfovibrio species, detected significant numbers of target cells, i.e., 0.5 to 1% in the SBR and 2 to 4% of total cells in the other samples. In comparison, members of the genera Desulfobacterium, Desulfobacter, Desulfobulbus, Desulfomicrobium, and Desulfosarcina detected by FISH together made up less than 0.2% of total cells in all samples. Additionally, DNAs were extracted from activated sludge samples of the SBR as well as from samples of the WWTP at Prague and Bremen. Using the same amount of DNA (ca. 20 ng) for the PCR, we obtained no PCR product of the DSR gene fragments from the SBR samples but we retrieved distinct PCR products of the expected size from the WWTP samples (data not shown). As DSR is a key enzyme for sulfate reduction, the detection of its genes indicates the presence of SRB (or of at least their DNAs) in the WWTP but not in the SBR activated sludges.
3D analysis of activated sludge flocs.
For a qualitative analysis of the 3D floc structures of different sludges (WWTP at Prague and Bremen, SBR1, and SBR2), flocs were stained with either FITC, calcofluor, or ethidium bromide. These fluorescent dyes bind to proteins, polysaccharides, and DNA, respectively, which represent the main compounds of the extracellular polymeric substance of activated sludge flocs (50). Staining of these substances should therefore result in the visualization of the floc’s structure. A comparison of the different stains revealed that, at the low resolution needed to visualize complete flocs, all three dyes yielded approximately the same picture, i.e., the same ratio of stained floc material to unstained pore volume. However, as FITC-conferred fluorescence of the flocs was brightest and gave the best CLSM images, all further 3D analyses were performed with FITC-stained flocs.
CLSM analysis revealed clear differences between the floc structures of the different sludge types. WWTP flocs appeared to have a fluffier structure than the SBR flocs, with more and larger pores (i.e., the unstained part), which were estimated to comprise 50 to 80% of the entire floc volume. In contrast, SBR flocs seemed to be denser and more compact (pore volume, 30 to 65%). An example of each kind of floc is shown in Fig. 4. It should be mentioned, however, that the numbers must be treated as estimates after examination of 52 flocs rather than as a quantitative description of pore volumes and floc populations. Nevertheless, the qualitative differences in porosities and structures were evident.
FIG. 4.

CLSM images (for the red-green overlay, use red-green glasses) of the 3D structures of activated sludge flocs from the WWTP at Prague (A) and SBR1 (B) after FITC staining. Size of pictures, 300 by 300 μm.
DISCUSSION
Anoxic microniches and denitrification.
When incubated under air saturation, anoxia was never detected inside activated sludge flocs, which is in agreement with the measurements of Lens et al. (26). Calculation of acetate concentrations in the centers of the flocs, based on the measured oxygen respiration rates (equation 2), showed that in only 2 of 35 flocs could acetate be completely depleted. Therefore, assuming that acetate (this study) or glucose and starch (26) were suitable substrates for the microbial community in activated sludge, respiration was most likely not limited by the availability of organic carbon. These results indicate that the respiration capacity of activated sludge is simply not sufficient to create anoxia under air saturation. However, even when flocs were incubated under more realistic conditions (2 mg of O2 liter−1), no anoxic zones and no nitrate reduction were detected except in activated sludge flocs of the SBR and a few flocs from the Bremen WWTP. The question of how representative the microsensor measurements from single flocs were, i.e., if the measuring approach was suited to detect anoxic microniches and if the results are meaningful for a complete activated sludge basin, has to be raised. In our study, we analyzed only flocs larger than 400 μm. Although this size class is present in activated sludge only in low numbers compared to the numbers of smaller flocs, flocs of this size contribute most to the volume and mass of the sludge (12, 28) and hence are most important for the activity of a plant. Furthermore, anoxic zones due to diffusion limitation are primarily to be expected in larger flocs since the volumetric respiration rates required to create anoxia exactly at the center of a floc increase with the square of the floc radius (equation 2) (Fig. 5) (41). Therefore, under reactor conditions, volumetric respiration rates of more than 70 nmol mm−3 h−1 are necessary for anoxia in flocs with a diameter of 400 μm or less. Such high rates have been found only in microbial mats (21) and nitrifying aggregates (9), while the rates reported from various other systems such as detritus pellets (41), trickling filter biofilms (23, 24), microbial mats (14), and sediments (14, 43) are all in the same range (1.2 to 39.6 nmol mm−3 h−1) as the values measured in this study (0 to 19 nmol mm−3 h−1). It is thus questionable if the respiration rates required for anoxia in flocs smaller than 400 μm can ever be reached in activated sludge (Fig. 5). Furthermore, we measured microprofiles by simulating sinking flocs, i.e., in a flow chamber with laminar flow, where no turbulent mixing or collisions of flocs occur. The latter processes, however, are typical of aerated activated sludge basins and obviously lead to a steady aggregation and disintegration of flocs. Gradients and flocs are consequently dynamic features; e.g., the center of a floc might become exposed to oxygen again after an anoxic period by the disruption of the floc. For these two reasons, the sizes of the studied flocs and the measuring conditions, it was more likely to overestimate anaerobic processes in the activated sludges by microsensor analysis rather than to overlook them.
The isotope incubation experiments served as independent controls for the microsensor data, as they averaged over the all flocs present in a large sample and better simulated the mixing conditions in an activated sludge basin. Consistent with the microprofiles, significant denitrification under 2 mg of O2 liter−1 was measured only in the SBR. Under anoxic conditions, all sludges showed denitrification rates of 0.5 to 4.2 μmol of N g of mixed-liquor suspended solids−1 min−1, i.e., rates comparable to those of conventional anoxic activated sludge basins designed for denitrification (6, 50). These results show that denitrifiers were present in all sludges and that the virtual absence of denitrification in most sludges during aeration can indeed be explained by the absence of anoxic niches inside the activated sludge flocs. Furthermore, denitrification under 2 mg of O2 liter−1 represented similar percentages of maximum denitrification rates in both 15N incubations and microsensor measurements (data not shown), which indicates that microprofiles were actually recorded under realistic conditions and reflected data relevant for the whole aeration basin. The comparison of 15N incubation results and nitrate microsensor measurements also suggests that the decrease of nitrate inside flocs is indeed indicative of denitrification rather than nitrate ammonification or assimilatory nitrate reduction.
Some nitrate microprofiles showed nitrate reduction under air saturation, and denitrification rates determined by 15N incubations were slightly above the detection limit in samples where no anoxic zones were found. Thus, one may speculate about the occurrence of aerobic denitrifiers (31, 39, 45). However, their contribution to overall denitrification seems to be almost negligible in the analyzed systems.
Another considerable factor is the bulk water concentration of oxygen. Obviously, reducing the aeration of activated sludge will immediately increase the probability of anoxic microniches and hence anaerobic processes inside a diffusion-controlled floc (Fig. 5). Indeed there have been reports on enhanced denitrification rates in aerated activated sludges when the bulk oxygen concentration was set to 0.5 to 1.5 mg liter−1 (17, 20, 57). However, nitrification might be less effective or become incomplete; therefore, attempts to achieve nitrogen removal by simultaneous nitrification and denitrification by simply lowering the bulk oxygen concentration would require continuous monitoring and a careful balance of both processes.
Respiration rates.
Valuable information can be derived from the measured volumetric respiration rates (R) of individual flocs in relation to their size. As displayed in Fig. 5, smaller flocs require higher respiration rates to become anoxic because of their higher surface to volume ratios. This also applies to the investigated samples (Fig. 2). For example, the mean floc sizes of analyzed flocs from SBR1 and the Aarhus WWTP are almost the same; however, only the respiration rates of SBR1 are sufficient to create anoxic zones. Furthermore, the volumetric respiration rate was negatively correlated with floc size (d) (Fig. 3), which was somewhat more pronounced for flocs under reactor conditions than for flocs under air saturation. A decrease of R with d2 usually indicates diffusion limitation within the floc (Fig. 5). The observed decrease of R with d1.5 at 40 to 60 μM oxygen (Fig. 3B) might be explained by the different extents of oxygen limitation in the different flocs that contributed to the regression analysis since (i) some flocs are truly diffusion limited and have anoxic centers, (ii) some flocs might slow down respiration rates due to rather low oxygen concentrations (1 to 5 μM) in their centers, and (iii) some flocs with higher oxygen levels in their centers respire with maximum rates since the Km for oxygen consumption by heterotrophic bacteria is about 1 μM (56). In contrast, diffusion limitation can be excluded from the reasons for this trend under air saturation (Fig. 3A). Oxygen as well as organic carbon is present in concentrations high enough to prevent any limitations, as has been discussed before. An alternative explanation lies in the structure and geometry of the floc. Larger flocs might be less dense than smaller ones, i.e., contain fewer active cells per volume and more voids and dead material. This seems to be partially the case, as large flocs (>1 mm in diameter) often enclose bigger particles which do not contribute to respiration. Furthermore, activated sludge flocs are fractal in their geometry, with fractal dimensions of 1.0 to 1.8 (27, 33, 48). As is typical of fractal aggregates, the porosity of flocs increases with increasing floc size (1), resulting in reduced mass and hence respiration rate per volume as the aggregates get larger. The same also of course applies under the lower oxygen concentrations. Fractal geometry of activated sludge flocs might therefore provide an explanation of why the volumetric respiration rates of most sludges have been too low to create anoxic conditions even in the larger flocs. Alternatively, the lack of anoxic microniches might be due to advective transport through pores and channel-like structures (32) since larger flocs often consist of dense subunits that are only loosely connected. Flow might have been detected in several oxygen profiles that showed a local increase in oxygen concentration (Fig. 3). In the absence of photosynthesis, advective transport of oxygen-rich bulk medium through pores into the floc is the only process that could explain this observation. Flow can substantially enhance oxygen transfer compared to diffusion. In this case, our calculations of volumetric respiration rates (and denitrification rates) based on diffusional transport underestimate R. If advection is an important transport mechanism in activated sludge flocs, reduced oxygen bulk concentrations do not necessarily result in anoxic zones and enhanced denitrification as discussed above.
Considering fractal geometry and advective transport might help to understand the differences between the flocs from the SBR and the other samples. SBR have been reported to form more compact (and larger) flocs (54), which may allow for higher volumetric respiration rates than those produced by conventional WWTP flocs and prevent advective transport of oxygen inside the floc. This hypothesis is supported by CLSM analysis of the 3D floc structure that demonstrated SBR flocs to be more compact than WWTP flocs (Fig. 4). However, further research, i.e., on fractal geometry and advective transport, is needed to better understand the impact of floc structure on a floc’s function.
Sulfate reduction.
Low numbers of SRB were detected by FISH in all samples, and the amplification of the DSR gene fragments indicated the presence of SRB at least in samples from the WWTP at Bremen and Prague. In contrast, no sulfate reduction was detected in any experiment by microsensor or radioisotope analysis. The sensitivities of the applied techniques were relatively high (1 μM H2S and 5 μmol of S g of TSS−1 h−1 for microsensor and radioisotope analyses, respectively) and immediate reoxidation by oxygen or nitrate was excluded during anoxic incubations in nitrate-free medium. By the 35S analysis even the immediate precipitation of H2S, e.g., as FeS (38), would have been detected. However, a shortcoming of the approach was the use of acetate as the sole carbon source in almost all experiments. Acetate is not utilized as an electron donor by incompletely oxidizing SRB, including Desulfovibrio sp. (55), which was detected as the main component of the SRB community in the analyzed samples. Sulfate reduction in our experiments had therefore to rely on endogenous electron donors of the activated sludge that were either produced from the acetate added or had been stored within the flocs. Whereas this assumption is doubtful for the microsensor experiments, due to the small volume of a single floc compared to the incubation volume and time in the flow system, it is sound for the 35SO42− incubations. In the batch reactor, about one-third of the reactor volume consisted of concentrated activated sludge and only two-thirds of the sludge bulk water had been replaced by the artificial medium. Essentially, the substrate spectrum was similar to that of the original activated sludge sample but was slightly diluted. Furthermore, no sulfate reduction could be detected after anoxic incubation of sludge with a mixture of acetate, propionate, and butyrate in a test tube. For these reasons, we presume that we were able to detect sulfate reduction in the observed systems if it had occurred. However, some of the H2S microsensor measurements and some of the 35SO42− incubations should be repeated with more complex substrates to eventually prove our results and assumptions.
The absence of sulfate reduction, and the detection of significantly lower numbers of SRB in the SBR than in the WWTP samples in our opinion indicates unfavorable conditions for SRB in the investigated sludges. We suggest that SRB are not able to grow and to multiply in the aerated activated sludge but that they rely on continuous reinoculation via sewer, biofilm wall growth in the basin (46), or backwash from settler and anaerobic digesters. The lack of these sources in the lab-scale SBR might explain the low numbers of SRB detected there by FISH. Also, the amount of DNA applied to the DSR gene fragment screening might have been too low to yield PCR products from the SBR. Considering the reported occurrence of higher numbers of SRB in activated sludge (e.g., in references 26, 34, and 58), we suggest based on our results, that the actual function of these SRB in the aeration basins might not be sulfate reduction. For instance, oxygen (11) and nitrate (35) have been described as alternative electron acceptors. However, plant-to-plant differences must also be kept in mind, and sulfate reduction may occur in activated sludge systems other than those used in our study. Further investigations are needed to clarify these preliminary results.
In conclusion, we found that of anoxic microniches and denitrification are possible and detectable in aerated activated sludge (bulk oxygen concentration, 2 mg liter−1). The structure of the activated sludge flocs plays an important role in the occurrence of this phenomenon. However, anoxia seems to be the exception rather than the rule in conventional WWTP, and sulfate reduction seems to be almost fully absent. The exact interrelations between the structure and function of an activated sludge floc require further investigation, especially to describe quantitatively the fractal geometry-respiration correlation and to eventually prove the absence of sulfate reduction in activated sludge.
ACKNOWLEDGMENTS
We thank G. Eickert, A. Eggers, and V. Hübner for constructing oxygen and hydrogen sulfide microsensors. Jörg Wulf is acknowledged for his help with in situ hybridizations.
This work was supported by a grant from the Körber Foundation and by the Max-Planck Society.
REFERENCES
- 1.Alldredge A. The carbon, nitrogen and mass content of marine snow as function of aggregate size. Deep-Sea Res. 1998;45:529–541. [Google Scholar]
- 2.Amann R I, Binder B J, Olson R J, Chisholm S W, Devereux R, Stahl D A. Combination of 16S rRNA-targeted oligonucleotide probes with flow cytometry for analyzing mixed microbial populations. Appl Environ Microbiol. 1990;56:1919–1925. doi: 10.1128/aem.56.6.1919-1925.1990. [DOI] [PMC free article] [PubMed] [Google Scholar]
- 3.Amann R I, Krumholz L, Stahl D A. Fluorescent-oligonucleotide probing of whole cells for determinative, phylogenetic, and environmental studies in microbiology. J Bacteriol. 1990;172:762–770. doi: 10.1128/jb.172.2.762-770.1990. [DOI] [PMC free article] [PubMed] [Google Scholar]
- 4.Amann R I, Ludwig W, Schleifer K H. Phylogenetic identification and in situ detection of individual microbial cells without cultivation. Microbiol Rev. 1995;59:143–169. doi: 10.1128/mr.59.1.143-169.1995. [DOI] [PMC free article] [PubMed] [Google Scholar]
- 5.Broecker W S, Peng T-H. Gas exchange rates between air and sea. Tellus. 1974;26:21–35. [Google Scholar]
- 6.Christensen M H, Harremoes P. Biological denitrification of sewage: a literature review. Prog Water Technol. 1977;8:509–555. [Google Scholar]
- 7.de Beer D, O’Flaharty V, Thaveesri J, Lens P, Verstraete W. Distribution of extracellular polysaccharides and flotation of anaerobic sludge. Appl Microbiol Biotechnol. 1996;46:197–201. [Google Scholar]
- 8.de Beer D, Schramm A, Santegoeds C M, Kühl M. A nitrite microsensor for profiling environmental biofilms. Appl Environ Microbiol. 1997;63:973–977. doi: 10.1128/aem.63.3.973-977.1997. [DOI] [PMC free article] [PubMed] [Google Scholar]
- 9.de Beer D, van den Heuvel J C, Ottengraf S P P. Microelectrode measurements of the activity distribution in nitrifying bacterial aggregates. Appl Environ Microbiol. 1993;59:573–579. doi: 10.1128/aem.59.2.573-579.1993. [DOI] [PMC free article] [PubMed] [Google Scholar]
- 10.Devereux R, Kane M D, Winfrey J, Stahl D A. Genus- and group-specific hybridization probes for determinative and environmental studies of sulfate-reducing bacteria. Syst Appl Microbiol. 1992;15:601–609. [Google Scholar]
- 11.Dilling W, Cypionka H. Aerobic respiration in sulfate reducing bacteria. FEMS Microbiol Lett. 1990;71:123–128. [Google Scholar]
- 12.Droppo I G, Flannigan D T, Leppard G G, Jaskot C, Liss S N. Floc stabilization for multiple microscopic techniques. Appl Environ Microbiol. 1996;62:3508–3515. doi: 10.1128/aem.62.9.3508-3515.1996. [DOI] [PMC free article] [PubMed] [Google Scholar]
- 13.Eberl L, Schulze R, Ammendola A, Geisenberger O, Erhart R, Sternberg C, Molin S, Amann R. Use of green fluorescent protein as a marker for ecological studies of activated sludge communities. FEMS Microbiol Lett. 1997;149:77–83. [Google Scholar]
- 14.Epping E H G, Jørgensen B B. Light enhanced oxygen respiration in benthic phototrophic communities. Mar Ecol Prog Ser. 1996;139:193–203. [Google Scholar]
- 15.Fossing H, Jørgensen B B. Measurement of bacterial sulfate reduction in sediments: evaluation of a single-step chromium reduction method. Biogeochemistry. 1989;8:205–222. [Google Scholar]
- 16.Goronszy M C, Demoulin G, Newland M. Aerated denitrification in full-scale activated sludge facilities. Water Sci Technol. 1996;34:487–491. [Google Scholar]
- 17.Goronszy M C, Demoulin G, Newland M. Aerated denitrification in full-scale activated sludge facilities. Water Sci Technol. 1997;35:103–110. [Google Scholar]
- 18.Gray N F. Activated sludge. Theory and practice. Oxford, United Kingdom: Oxford University Press; 1990. [Google Scholar]
- 19.Griebe T. Ph.D. thesis. Hamburg, Germany: University of Hamburg; 1991. [Google Scholar]
- 20.Hao X, Doddema H J, van Groenestijn J W. Conditions and mechanisms affecting simultaneous nitrification and denitrification in a Pasveer oxidation ditch. Bioresour Technol. 1997;59:207–215. [Google Scholar]
- 21.Jøorgensen B B, Des Marais D J. The diffusive boundary layer of sediments: oxygen microgradients over a microbial mat. Limnol Oceanogr. 1990;35:1343–1355. doi: 10.4319/lo.1990.35.6.1343. [DOI] [PubMed] [Google Scholar]
- 22.Juretschko S, Timmermann G, Schmidt M, Schleifer K-H, Pommerening-Röser A, Koops H-P, Wagner M. Combined molecular and conventional analysis of nitrifying bacterial diversity in activated sludge: Nitrosococcus mobilis and Nitrospira-like bacteria as dominant populations. Appl Environ Microbiol. 1998;64:3042–3051. doi: 10.1128/aem.64.8.3042-3051.1998. [DOI] [PMC free article] [PubMed] [Google Scholar]
- 23.Kühl M, Glud R N, Ploug H, Ramsing N B. Microenvironmental control of photosynthesis and photosynthesis-coupled respiration in an epilithic cyanobacterial biofilm. J Phycol. 1996;32:799–812. [Google Scholar]
- 24.Kühl M, Jørgensen B B. Microsensor measurement of sulfate reduction and sulfide oxidation in compact microbial communities of aerobic biofilms. Appl Environ Microbiol. 1992;58:1164–1174. doi: 10.1128/aem.58.4.1164-1174.1992. [DOI] [PMC free article] [PubMed] [Google Scholar]
- 25.Kühl M, Steuckart C, Eickert G, Jeroschewski P. A H2S microsensor for profiling biofilms and sediments: application in an acidic lake sediment. Aquat Microb Ecol. 1998;15:201–209. [Google Scholar]
- 26.Lens P N, De Poorter M-P, Cronenberg C C, Verstraete W H. Sulfate reducing and methane producing bacteria in aerobic wastewater treatment systems. Water Res. 1995;29:871–880. [Google Scholar]
- 27.Li D, Ganczaczyk J J. Fractal geometry of particle aggregates generated in water and wastewater treatment process. Environ Sci Technol. 1989;23:1385–1389. [Google Scholar]
- 28.Li D, Ganczarczyk J. Size distribution of activated sludge flocs. Res J Water Pollut Control Fed. 1991;63:806–814. [Google Scholar]
- 29.Li Y H, Gregory S. Diffusion of ions in sea water and in deep-sea sediments. Geochim Cosmachim Acta. 1974;38:703–714. [Google Scholar]
- 30.Lide D R, editor. CRC handbook of chemistry and physics. 73rd ed. Boca Raton, Fla: CRC Press; 1992. [Google Scholar]
- 31.Lloyd D, Boddy L, Davies K J P. Persistence of bacterial denitrification capacity under aerobic conditions: the rule rather than the exception. FEMS Microbiol Ecol. 1987;45:185–190. [Google Scholar]
- 32.Logan B E, Hunt J R. Bioflocculation as a microbial response to substrate limitations. Biotechnol Bioeng. 1988;31:91–101. doi: 10.1002/bit.260310202. [DOI] [PubMed] [Google Scholar]
- 33.Logan B E, Wilkinson D B. Fractal geometry of marine snow and other biological aggregates. Limnol Oceanogr. 1990;35:130–136. [Google Scholar]
- 34.Manz W, Eisenbrecher M, Neu T R, Szewzyk U. Abundance and spatial organization of Gram-negative sulfate-reducing bacteria in activated sludge investigated by in situ probing with specific 16S rRNA targeted oligonucleotides. FEMS Microbiol Ecol. 1998;25:43–61. [Google Scholar]
- 35.McCready R G L, Gould W D, Cook F D. Respiratory nitrate reduction by Desulfovibrio sp. Arch Microbiol. 1983;135:182–185. [Google Scholar]
- 36.Muyzer G, Brinkhoff T, Nübel U, Santegoeds C M, Schäfer H, Wawer C. Denaturing gradient gel electrophoresis (DGGE) in microbial ecology. In: Akkermans A D L, van Elsas J D, de Bruijn F J, editors. Molecular microbial ecology manual. 3rd ed. 3.4.4. Dordrecht, The Netherlands: Kluwer Academic Publishers; 1998. pp. 1–27. [Google Scholar]
- 37.Nielsen L P. Denitrification in sediment determined from nitrogen isotope pairing. FEMS Microbiol Ecol. 1992;86:357–362. [Google Scholar]
- 38.Nielsen P H, Keiding K. Disintegration of activated sludge flocs in presence of sulfide. Water Res. 1998;32:313–320. [Google Scholar]
- 39.Patureau D, Bernet N, Moletta R. Combined nitrification and denitrification in a single aerated reactor using the aerobic denitrifier Comamonas sp. strain SGLY2. Water Res. 1997;31:1363–1370. [Google Scholar]
- 40.Ploug H, Jørgensen B B. A net-jet flow system for mass transfer and microsensor studies of sinking aggregates. Mar Ecol Prog Ser. 1999;176:279–290. [Google Scholar]
- 41.Ploug H, Kühl M, Buchholz-Cleven B, Jørgensen B B. Anoxic aggregates—an ephemeral phenomenon in the pelagic environment? Aquat Microb Ecol. 1997;13:285–294. [Google Scholar]
- 42.Revsbech N P. An oxygen microelectrode with a guard cathode. Limnol Oceanogr. 1989;34:474–478. [Google Scholar]
- 43.Revsbech N P, Madsen B, Jørgensen B B. Oxygen production and consumption in sediments determined at high spatial resolution by computer simulation of oxygen microelectrode data. Limnol Oceanogr. 1986;31:293–304. [Google Scholar]
- 44.Risgaard-Petersen N, Rysgaard S. Nitrate reduction in sediments and waterlogged soil measured by 15N techniques. In: Alef K, Namijaeri P, editors. Methods in applied soil microbiology and biochemistry. New York, N.Y: Academic Press; 1995. pp. 287–295. [Google Scholar]
- 45.Robertson L A, Cornelisse R, de Vos P, Hadioetomo R, Kuenen J G. Aerobic denitrification in various heterotrophic nitrifiers. Antonie Leeuwenhoek. 1989;56:289–299. doi: 10.1007/BF00443743. [DOI] [PubMed] [Google Scholar]
- 46.Santegoeds C M, Ferdelman T G, Muyzer G, de Beer D. Structural and functional dynamics of sulfate-reducing populations in bacterial biofilms. Appl Environ Microbiol. 1998;64:3731–3739. doi: 10.1128/aem.64.10.3731-3739.1998. [DOI] [PMC free article] [PubMed] [Google Scholar]
- 47.Sedlak R. Phosphorus and nitrogen removal from municipal wastewater. Principle and practice. 2nd ed. Boca Raton, Fla: Lewis Publishers; 1991. [Google Scholar]
- 48.Tambo N, Watanabe Y. Physical characteristics of flocs, 1: the floc density function and aluminum floc. Water Res. 1979;13:409–419. [Google Scholar]
- 49.Teske A, Wawer C, Muyzer G, Ramsing N B. Distribution of sulfate-reducing bacteria in a stratified fjord (Mariager Fjord, Denmark) as evaluated by most-probable-number counts and denaturing gradient gel electrophoresis of PCR-amplified ribosomal DNA fragments. Appl Environ Microbiol. 1996;62:1405–1415. doi: 10.1128/aem.62.4.1405-1415.1996. [DOI] [PMC free article] [PubMed] [Google Scholar]
- 50.Verstraete W, van Vaerenbergh E. Aerobic activated sludge. In: Schönborn W, editor. Biotechnology. Vol. 8. Microbial degradations. 1st ed. Weinheim, Germany: VCH; 1986. pp. 43–112. [Google Scholar]
- 51.von Münch E, Lant P, Keller J. Simultaneous nitrification and denitrification in bench-scale sequencing batch reactors. Water Res. 1996;30:277–284. [Google Scholar]
- 52.Wagner M, Amann R, Lemmer H, Schleifer K-H. Probing activated sludge with oligonucleotides specific for proteobacteria: inadequacy of culture-dependent methods for describing microbial community structure. Appl Environ Microbiol. 1993;59:1520–1525. doi: 10.1128/aem.59.5.1520-1525.1993. [DOI] [PMC free article] [PubMed] [Google Scholar]
- 53.Wagner M, Roger A M, Flax J L, Brusseau G A, Stahl D A. Phylogeny of dissimilatory sulfite reductases supports an early origin of sulfate respiration. J Bacteriol. 1998;180:2975–2982. doi: 10.1128/jb.180.11.2975-2982.1998. [DOI] [PMC free article] [PubMed] [Google Scholar]
- 54.Wanner J. Activated sludge bulking and foaming control. Lancaster, Pa: Technomic Publishing Company; 1994. [Google Scholar]
- 55.Widdel F, Bak F. Gram-negative mesophilic sulfate-reducing bacteria. In: Balows A, Trüper H G, Dworkin M, Harder W, Schleifer K-H, editors. The prokaryotes. 2nd ed. New York, N.Y: Springer-Verlag; 1992. pp. 3352–3378. [Google Scholar]
- 56.Wimpenny J W. Oxygen and carbon dioxide as regulators of microbial growth and metabolism. In: Meadow P M, Pirt S J, editors. Microbial growth. Cambridge, United Kingdom: Cambridge University Press; 1969. pp. 161–198. [Google Scholar]
- 57.Wistrom A O, Schroeder E D. Enhanced nutrient removal by limiting dissolved oxygen concentration in a continously fed, intermittently decanted, activated sludge plant. Environ Technol. 1996;17:371–380. [Google Scholar]
- 58.Zietz U. The formation of sludge bulking in the activated sludge process. Eur Water Pollut Control. 1995;5:21–27. [Google Scholar]