Abstract
Data provided by in situ sensors is always affected by some level of impreciseness as well as uncertainty in the measurements due to process operation disturbance or material property variance. In-process data precision and reliability should be considered when implementing active product quality control and real-time process decision making in pharmaceutical continuous manufacturing. Data reconciliation is an important strategy to address such imperfections effectively, and to exploit the data redundancy and data correlation based on process understanding. In this study, a correlation between tablet weight and main compression force in a rotary tablet press was characterized by the classical Kawakita equation. A load cell, situated at the exit of the tablet press chute, was also designed to measure the tablet production rate as well as the tablet weight. A novel data reconciliation strategy was proposed to reconcile the tablet weight measurement subject to the correlation between tablet weight and main compression force, in such, the imperfect tablet weight measurement can be reconciled with the much more precise main compression force measurement. Special features of the Welsch robust estimator to reject the measurement gross errors and the Kawakita model parameter estimation to monitor the material property variance were also discussed. The proposed data reconciliation strategy was first evaluated with process control open-loop and closed-loop experimental data and then integrated into the process control system in a continuous tablet manufacturing line. Specifically, the real-time reconciled tablet weight measurements were independently verified with an at-line Sotax Auto Test 4 tablet weight measurements every five minutes. Promising and reliable performance of the reconciled tablet weight measurement was demonstrated in achieving process automation and quality control of tablet weight in pilot production runs.
Keywords: Data reconciliation, Pharmaceutical, Continuous manufacturing, Tablet press, Quality by Design
1. Introduction
The emerging pharmaceutical continuous manufacturing (PCM) is now entering the arena of big data with more and more critical material attributes (CMA), critical quality attributes (CQA) and critical process parameters (CPP) acquired in real time using process analytical technology (PAT) sensors. Although the management and integration of these data have been receiving extensive interests (Markl et al., 2013; Cao et al., 2018), the measurement data reliability and the transition from a data-rich to information and knowledge-rich manufacturing have not attracted enough attention thus far (Ierapetritou et al., 2016). For example, the measurements from in-situ sensors in the powder-based pharmaceutical manufacturing often suffer from random errors due to process disturbances or gross errors occurring due to changes in material properties and environmental factors. The current practice in other industries is to use multivariate statistical process control (MSPC) to monitor the variation in the measurement data by projecting them into a small number of principal components and testing them against statistical control limits prespecified under nominal operation, e.g., Hoteling’s T2 and square prediction error (SPE). However, these data-driven approaches do not separate the true variation of the product quality attributes from the measurement data imperfection. Yet, the identification of product quality variations is of great concerns to support active product quality control and real-time process decision making in pharmaceutical continuous manufacturing (Moreno et al., 2017; Yu et al., 2014). Furthermore, there are some critical quality attribute variables that cannot be measured directly in real time and thus cannot be captured by MSPC methods, such as the tablet weight as investigated in this work. Moreover, an adequate database of nominal operation for MSPC development is not always available, especially during the early-stages of product or process development. Hence, the development of new approaches that are able to tackle data imprecision and uncertainty, based on process knowledge, may have significant impact in pharmaceutical continuous manufacturing.
Data reconciliation (DR) is a mathematical approach applied to correct imperfect measurement data to satisfy a mathematical model of the process, generally based on mass and energy balances, material property relations, process variance and dynamics, or correlation between variables. The original idea of data reconciliation in the 1960 s, correcting the measurement data with normally distributed random errors with zero mean, has since been extended to measurement gross error identification and elimination, unmeasured state variable estimation, model parameter estimation, etc. These data reconciliation applications have been successfully implemented in various industries during the past few decades (Câmara et al., 2017). Several recent industrial applications have been reported, including for a natural gas processing plant, wherein the mass flows of output streams and raw feed were reconciled to satisfy mass balance equations with an aim to check the presence of gross errors in the measured data (Rafiee and Behrouzshad, 2016). A corrected expansion curve with reasonable enthalpy-entropy relationships and better estimates of isentropic efficiencies were obtained with data reconciliation implemented in a 1000 MW steam turbine power plant (Guo et al., 2016). More recently, data reconciliation was also employed to improve the reliability and accuracy of measured data for a direct air-cooling condenser of thermal power plant based on the relationship between back pressure of the steam turbine and the condenser-related variables (Li et al., 2018).
Hence, the main objective of this paper is to introduce data reconciliation to the emerging pharmaceutical continuous manufacturing. DR has the capability to address the imperfection of PAT sensor measurement data by incorporating process understanding gained during pharmaceutical development using the QbD framework. For example, the design-space in QbD can be described by the inequality constraints in DR (Guo et al., 2016), the process understanding developed in QbD can be mathematically modelled and cast into nonlinear equality constraints of DR (Valdetaro and Schirru, 2011), or the variation in the process coefficients/material parameters can also be included and quantified as estimated parameters in DR (Weiss et al., 1996). Furthermore, given the significant differences in uncertainties, which generally occur between CQA and CPP measurements, the implementation of DR is also of practical importance for active process control of CQAs by adjusting CPPs. For example, most CQA variables are now measured using in situ spectroscopy probes, e.g., active pharmaceutical ingredient (API) composition in formulated powder is measured by a Near Infrared (NIR) probe (Vanarase et al., 2010). Such measurements are often subject to either inherent error in chemometric model calibration, or the extra variation/drift due to material property change (particle size, bulk density, etc.), probe fouling, and environmental humidity and temperature changes, etc. (Chen et al., 2011). On the other hand, the CPP variables are commonly and directly measured using reliable mechanical or electrical sensors, e.g., the compression force in a tablet press, which tend to have less measurement uncertainties. It is worth mentioning that the robust design of traditional manufacturing equipment (tablet press, roller compactor, etc.), which provides reliable measurement of CPPs with minimum variations, has allowed pharmaceutical manufacturing to continue to operate in the past century in batch mode while handling CQA variations via off line statistical quality control (SQC) methods. The challenge in pharmaceutical continuous manufacturing nowadays is to effectively integrate those noisier and possibly biased CQA measurements into the process control system so as to effectively supervise the control of CPPs while minimizing the need for off line SQC. However, this integration could potentially amplify variations in CPPs and product quality attributes, if data uncertainty in the CQAs measurements are not carefully dealt with. DR can be considered part of the PAT framework for the process as the PAT framework tools include design of the measurement system and process control (Food and Drug Administration, 2004). In this study, a data reconciliation framework is proposed for pharmaceutical continuous tablet manufacturing. Special features of using a Welsch robust estimator to reject measurement gross error (Liu et al., 2018) and a joint parameter estimation to address the model-plant mismatches are highlighted. The proposed DR framework was demonstrated in a pilot continuous tablet manufacturing process. First, the Kawakita equation, which characterizes the relationship between main compression force (CPP) and tablet weight (CQA) was considered (Su et al., 2018a), in which the material parameter was automatically estimated to accommodate changes in material property or compressibility. The reconciled tablet weight measurement was integrated into a hierarchical three-level process control design to maintain consistent tablet weight production (Su et al., 2017). The final tablet weights were also independently and periodically verified using at-line Sotax Auto Test 4 tablet weight measurements. The performance of the data reconciliation framework together with the developed control system design proved to offer a robust tablet weight control approach in pharmaceutical continuous manufacturing.
This paper is organized as follows. Section 2 briefly introduces the principle and recent development of data reconciliation and proposes a general data reconciliation framework for pharmaceutical continuous manufacturing systems. Section 3 describes the implementation of data reconciliation for a continuous tablet manufacturing process with active process monitoring and control of tablet weight. This is followed by the implementation and verification of the proposed data reconciliation framework in a rotary tablet press in Section 4. Concluding remarks and further consideration for the data reconciliation in pharmaceutical continuous manufacturing are provided in Section 5.
2. Data reconciliation
2.1. Principle
The principle of data reconciliation originally derives from the requirement to correct measurement errors due to random noise, which is most commonly expressed in industrial applications as a weighted least square (WLS) minimization problem (Câmara et al., 2017), as shown below,
| (1) |
where zm is the vector of measured process variables; z is the corresponding reconciled measurement; W is the weighting matrix, y, x, u are process output, state, and input variables, respectively; and θ the model parameters in the function vectors f (·) and g (·) which represent the process model, i.e., mass and energy balance, as equality and inequality constraints, respectively. The explicit use of process knowledge by combining measurement data with a process model, specifically known as the topological redundancy, in data reconciliation ensures that the reconciled measurements are consistent with the known relationships between process variables with minimum adjustment of the measurement data.
Though in practice the measurement data may be subject to non-random errors, requiring additional techniques such as robust statistics to detect gross errors or the use of robust estimators to give less weight to the contribution of large errors of (z − zm) in the objective function (Johnston and Kramer, 1995; Weiss et al., 1996), the underlying principle and framework in data reconciliation mostly remains the same. Furthermore, it is also straightforward for the data reconciliation to be extended to include parameter estimation and state variable estimation. For example, as long as the system redundancy and observability are satisfied (Crowe, 1996), uncertain model parameter θ and unmeasured process state variable x can be conveniently included in the set of decision variables z or constraints in the optimization problem. In such way, systematic errors in process model and unknown process/product qualities can be corrected and monitored, respectively. Overall, the scope of data reconciliation and its connections with optimization, parameter estimation, and state estimation can be illustrated in Fig. 1.
Fig. 1.
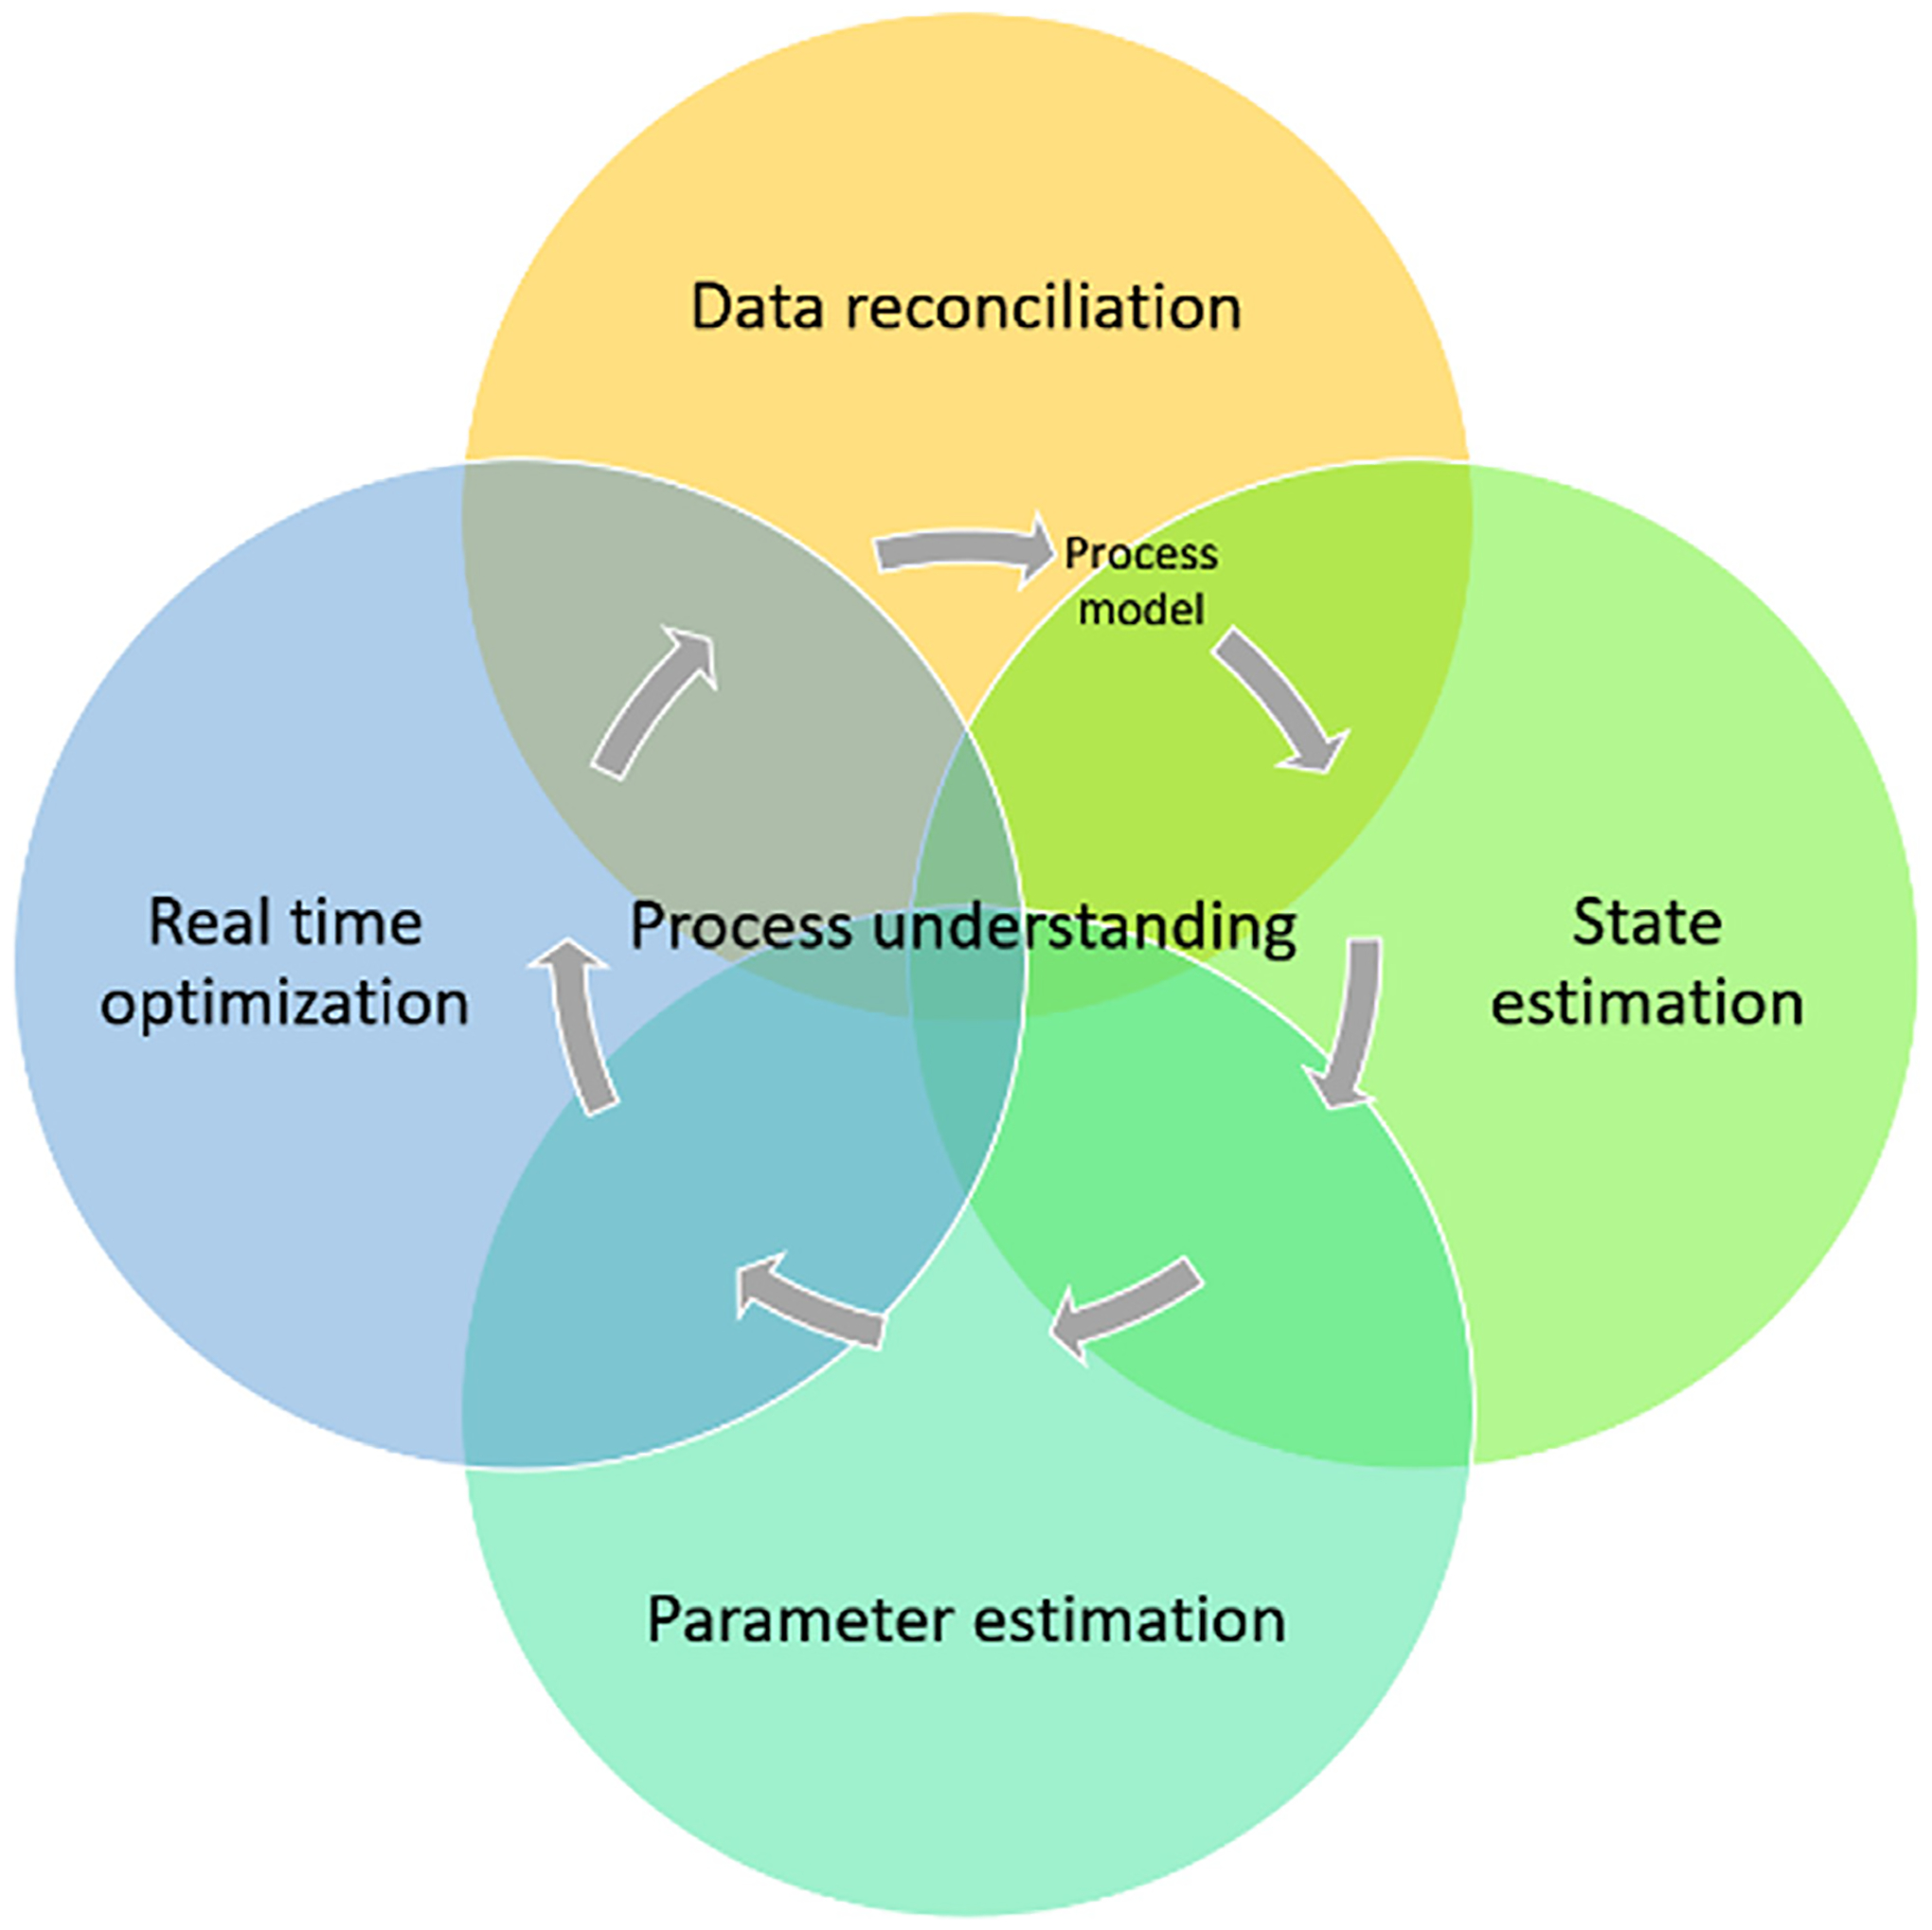
Scope and connections of data reconciliation with other related approaches.
2.2. Recent development in data reconciliation
Current challenges related to data reconciliation for gross error detection and identification techniques have been recently reviewed (Valle et al., 2018). The role of data filtering or processing before DR was corroborated (Tona et al., 2005). The authors also collected an extensive set of benchmark test problems for validating new DR technique. Since data reconciliation is intensively based on the optimization strategy and algorithm, several numerical aspects of data reconciliation have also been reviewed recently (Câmara et al., 2017), including the presence of estimated parameters in the objective function, solution approach using nonlinear programming solvers, methods for estimating objective function gradients, initial guess generation, and optimization algorithms.
In terms of the robust estimator, a recent comparative performance analysis of data reconciliation was presented, involving two procedures based on biweight function and three estimation techniques that use the Welsch, quasi-weighted least squares, and correntropy M-estimators (Llanos et al., 2015). Similar evaluation of robust estimators for dynamic data reconciliation and state estimation was also reported recently for a feeding-blending system in pharmaceutical continuous manufacturing (Liu et al., 2018).
Beside the commonly exploited process knowledge in the form of first-principle mass and energy balance at steady-state or dynamic condition, the use of simplified (Bagajewicz and Cabrera, 2003), data-driven, or semi-empirical process models have also been utilized for data reconciliation in complex systems. For example, when direct analytical formulation or numerical simulation techniques were not feasible for data reconciliation in a direct air-cooling condenser, a non-explicit relationship between the back pressure of the steam turbine and the condenser-related variables was established using data-driven support vector regression (Li et al., 2018). Additionally, shape constraints such as monotonicity and convexity/concavity profiles for process variables, which represent constraints relating measurements over several time instants have been proposed to reconcile concentration measurement in complex chemical reaction system without the use of first-principle reaction kinetic models (Srinivasan et al., 2017).
From the perspective of systematic implementation strategies, the problems of data reconciliation, economic optimization and interaction with the underlying basic control system were reviewed for hydrogen network management in a petroleum refinery (Sarabia et al., 2012), and the importance of data reconciliation and gross error detection in the proposed decision support system was demonstrated. A hierarchical decomposition approach for on-line data reconciliation and optimization for an industrial utility plant was also proposed (Lee et al., 1998). By decomposing a large and complex system into several subsystems, it was suggested that the handling several small size subsystems instead of the original large-scale system provided a reduction in computation time, a more robust solution, simplicity of problem formulation and easier maintenance. Other strategies for handling the optimization problem in large-scale systems were also proposed, including e.g., a nested three-stage sequential computation approach (Faber et al., 2003; Faber et al., 2004) or a parallel and self-adaptive cooperative strategy (Penas et al., 2017).
A detailed review of data reconciliation technique is out of the scope of this work, however, its robust capabilities in dealing with measurement errors and implementation in various industries should provide a sound cornerstone for its applications in pharmaceutical continuous manufacturing.
2.3. A general data reconciliation framework for PCM
Powder-based unit operations, i.e., blending, tableting, are typically employed in pharmaceutical continuous secondary manufacturing, where physical changes usually occur within seconds or minutes. There is also a limited holdup in each unit operation due to the desire to reduce the waste of off-spec in-process material, thus the buffering provided by material inventory is limited. Additionally, the impact of stream recycling or substantial back mixing in the process on material traceability must be characterized and well understood in the pharmaceutical manufacturing industry (Lee et al., 2015). Thus, variations in upstream operations typically propagate rapidly with direct impact on downstream processes. Conventional DR formulation and experience with large-scale stream network based on steady-state conservation laws of mass and energy may or may not be directly transferable to the more challenging quality-intensive PCM process. Accordingly, a general DR framework is proposed based on the following mathematical formulation,
| (2) |
where zm t, is the vector of measured process variables z at time t; zt is the corresponding reconciled measurement at time t; a robust estimator ρ (·) is preferably considered; wz is the weight vector for the measurement error e = (zt − zm,t); and wm is the penalty weight vector for successive move of the reconciled measurement or estimated process variables and model parameters in a continuous manufacturing environment; t is the process time when f (·) and g (·) are components of the dynamic process model; T is a moving window within which the process data set are used for dynamic data reconciliation (Liu et al., 2018).
Firstly, a dynamic process model is required to understand the propagation of process disturbances from upstream to downstream and their effect on the variance of the CQA, and to serve as the basis for the dynamic data reconciliation problem. The reconciled values of the measurement data generated in real time can then be directly used within the active process control system. For example, dynamic process models based on either a state-space model or a series of tanks model were recently demonstrated for data reconciliation purpose in our recent work in a simulated pharmaceutical continuous feeding-blending system (Su et al., 2017; Liu et al., 2018). In the last decade, significant effort has been devoted to process/flowsheet modelling of pharmaceutical continuous manufacturing processes (Rogers et al., 2013; Boukouvala et al., 2012; Sen et al., 2013). For example, gPROMS process model libraries were reported for control system design for continuous direct compaction processes (Singh et al., 2014; García-Muñoz et al., 2018), facilitating the future implementation of DR within a flowsheet modelling environment (Piccolo et al., 1996).
Secondly, given the current challenges in reliability of PAT sensors for CQA measurement, a robust estimator ρ (·) is necessary to suppress the measurement gross error simultaneously with data reconciliation. This is also important for the direct integration of reconciled CQA measurements into a fault-tolerant active process control system (Su et al., 2017). On the other hand, in order to either avoiding excessive moves in reconciled measurement data to be integrated into control system due to large CQA measurement noise, or to balance between data reconciliation and parameter estimation in the optimization, the selection of the weights wz and wm in the objective function is important and is often empirically tuned based on heuristic process understanding in most model-based optimization and control algorithms (Câmara et al., 2017; Su et al., 2016).
Thirdly, although the parameter estimation is intended mainly for off-line applications, as generally performed during the development of process models, it is recommended that important model parameters be identified through sensitivity analysis and included in the optimization variable vector z as well as in the objective function (Piccolo et al., 1996; Camara et al., 2016). Product and process knowledge developed within the QbD framework often includes an understanding of the impact of raw material variability on final product quality. Thus, it is of significant importance to understand and estimate the variance of these material-related model parameters through joint data reconciliation and parameter estimation. Moreover, model-plant mismatch can be reduced through updating of model parameters when changes from historical values of model parameters are detected (Wu et al., 2016). This is a widely used strategy in industrial DR applications (Câmara et al., 2017).
3. Continuous tablet manufacturing
3.1. Pharmaceutical continuous direct compression
Tablets are the most common oral solid dosage form that can be generally manufactured by direct compression or augmented with either dry granulation or wet granulation to accommodate particular formulation requirements. Common processing steps for direct compression include feeding, blending and tableting. The pilot continuous direct compression line at Purdue University was used for the studies in this work. The continuous manufacturing process consists of two Schenck AccuRate PureFeed® AP-300 loss-in-weight feeders that can achieve and maintain specified feed rates by measuring the changes in remaining powder weight. The feeders continuously feed the API, Acetaminophen (APAP), and the excipient, Avicel Microcrystalline Cellulose PH-200 (MCC 200), into a Gericke GCM-250 continuous blender, wherein the two components are mixed. A Schenck AccuRate DP4 micro feeder adds the glidant silicon dioxide into the powder flow exiting the continuous blender, which is then conveyed directly to a Natoli BLP-16 continuous rotary tablet press featuring a total of 16 punch-die stations.
The tablet press is itself a multi-stage process, in which each station undergoes the following major steps: die filling, metering, pre-compression, main-compression, tablet ejection and take-off from lower punch, as shown in Fig. 2. After die filling in the feed frame, the metering stage manipulates the dosing position to adjust the volume of powder within the die, which is then locked between the upper and lower punches during pre-compression and main-compression until tablet ejection and take-off. The pre-compression helps to remove the air trapped in the die and to rearrange the particle packing, while the main-compression serves to compact and solidify the powder into tablet. The tablet weight can be controlled by changing the dosing position subject to the variation of powder bulk density or filling time due to change in turret speed and/or feed frame speed. The minimum in-die tablet thickness is determined by the punch displacement which is manually set by altering the distance between the main compression rollers before tableting operation with the current tablet press. Hence, the maximum main-compression force is causally dependent on the amount of powder in die or, equivalently, the tablet weight, as indicated by a lock symbol for the closed system of pre-compression and main compression stages. The relationship between main-compression force and tablet weight is an important QbD process understanding in material compressibility, as discussed next.
Fig. 2.
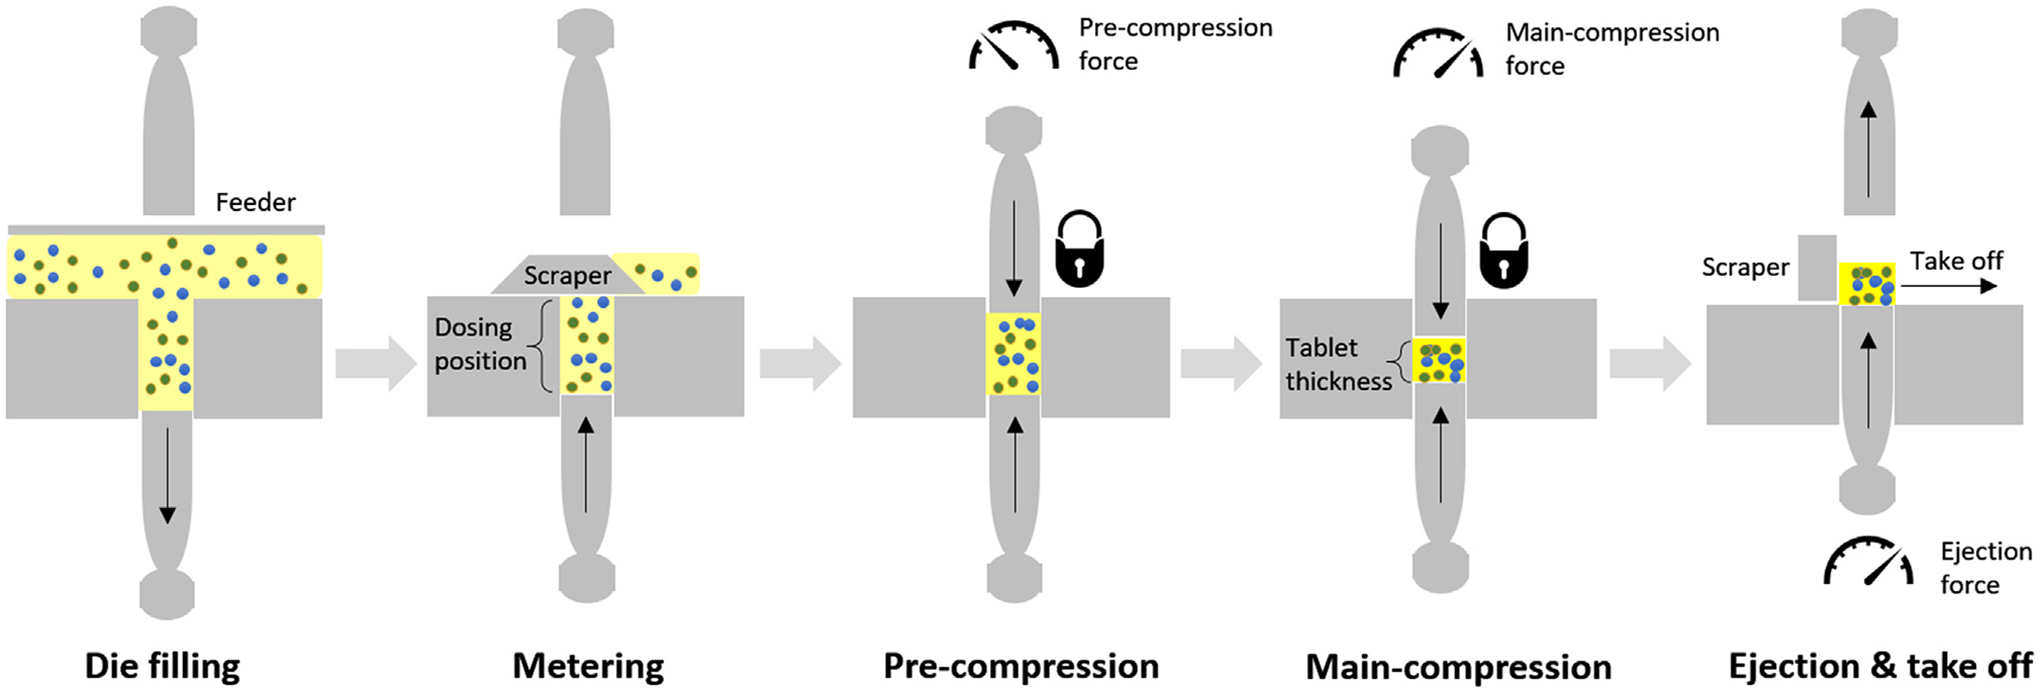
Major steps in Natoli BLP-16 rotary tablet press.
3.2. QbD implementation
The continuous direct compaction process was integrated with state-of-the-art process analytical technologies (PAT) sensors and process control strategies to monitor the process operation within the design-space and maintain consistent product quality. For example, the API mass fraction was measured in situ using a Near Infrared spectrometer (Control Development, Inc.) at the exit of the continuous blender (Vanarase et al., 2010). The powder flowrate was measured using an X-ray based mass flow meter (SETXvue XP-300, Enurga, Inc.) (Ganesh et al., 2017). These CQA and CPP measurement data were collected using Emerson DeltaV OPC system to support a hierarchical three-level process control system designed according to the ISA 95 standard (Su et al., 2017), as shown in Fig. 3. For example, the DR module in this work was located at Level 2.
Fig. 3.
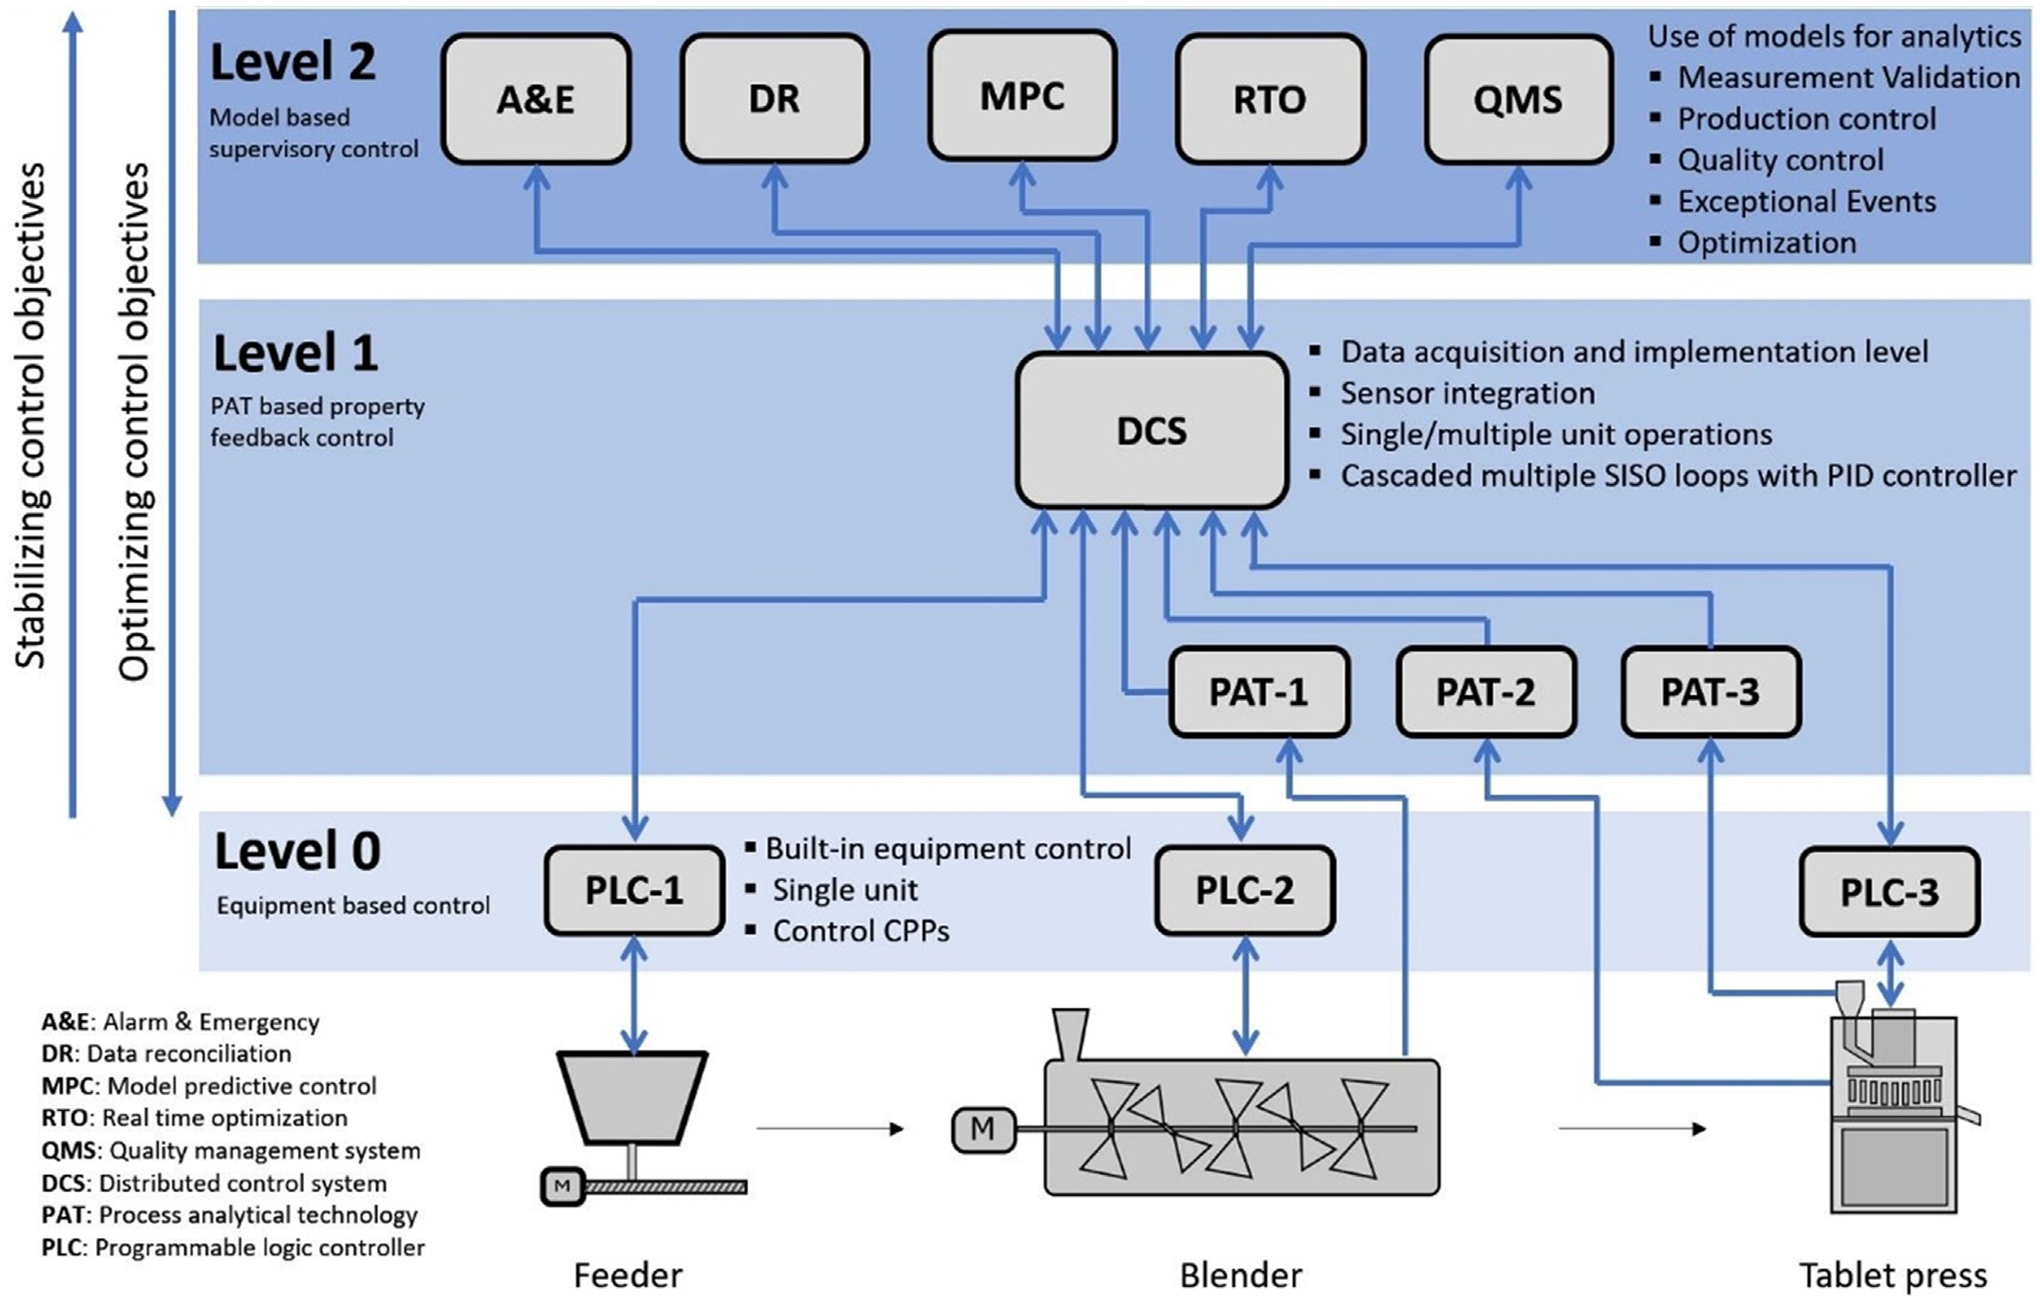
A hierarchical three-level process control for direct compaction.
Specifically, the critical-to-quality variables in the tablet press were identified as tablet weight, relative density, strength and main compression force (Su et al., 2018b). The weight of the tablet ultimately determines the API potency within a dose. It also determines the main compression force at the pre-set punch displacement and thus the relative density and tensile strength of the tablet, which in turn can affect the final product attributes such as dissolution rate. Commercial at-line instruments, such as Sotax Auto Test 4, are often employed to measure the tablet weight as well as strength at intervals of minutes. However, the destructive and slow measurements cannot be efficiently integrated with the process control system to maintain consistent quality production in real time. Therefore, an in-house design for real-time tablet weight measurement based on a Mettler Toledo ME 4001E mass balance was considered in this study (discussed in the next subsection). Although a similar design was reported in a recent publication for tablet weight control (Bhaskar et al., 2017); neither the tablet weight measurement reliability and accuracy were thoroughly verified therein, nor was its validity in enhancing the real-time tablet weight control confirmed. For example, compared to the conventional open-loop operation, the key aspect of how to avoid introducing extra variations into the tablet quality attributes due to measurement data imperfection or due to process closed-loop control operation was not demonstrated. A sampling time of 20 s in the tablet press data acquisition system was used which may impede the capturing of process dynamics and thus downgrade the expected process control performance (Shardt and Huang, 2013). Hence, in the following sections, a data reconciliation strategy for tablet weight measurement in enhancing the QbD implementation in continuous rotary tablet press is demonstrated and discussed.
3.3. Data reconciliation for tablet press
The in-house design of the system used for real-time tablet weight measurement and control is schematically shown in Fig. 4. Tablets exciting the tablet press chute are collected in a container placed on top of an electronic balance. The balance is connected to a computer with an RS232 cable to transfer the measurement data of total tablet weight via MathWorks MATLAB Instrument Control Toolbox. A Baud Rate of 9600 bps (bits-per-second) is chosen for the RS232 serial COM connection to achieve a real-time measurement, approximately a sampling time of 330 ms. The corresponding tablet production rate can be obtained by taking the first-order derivative of the total tablet weight measurement. A tablet weight measurement (Wt, mg) is then calculated by dividing the tablet production rate by turret speed and number of stations, as shown below,
| (3) |
where the turret speed determines the total counts of tablet produced per time unit. The proposed in-house design is efficient and accurate, however, may lack of enough precision due to non-static measurement with the balance. Hence, a flexible moving window time to collect roughly 100 tablets was adopted when taking the first-order derivative to calculate the tablet production rate and tablet weight. The authors assumed that a total count of 100 tablets is representative to calculate the mean tablet weight and a moving window time for 100 tablets doesn’t filter out the process dynamics. However, gross errors can also occur when tablet samples are pneumatically diverted to the at-line Sotax Auto Test 4 device or an empty container is reloaded. Therefore, a data reconciliation strategy is desired to reduce the measurement uncertainty and eliminate the gross errors with this tablet weight measuring device.
Fig. 4.
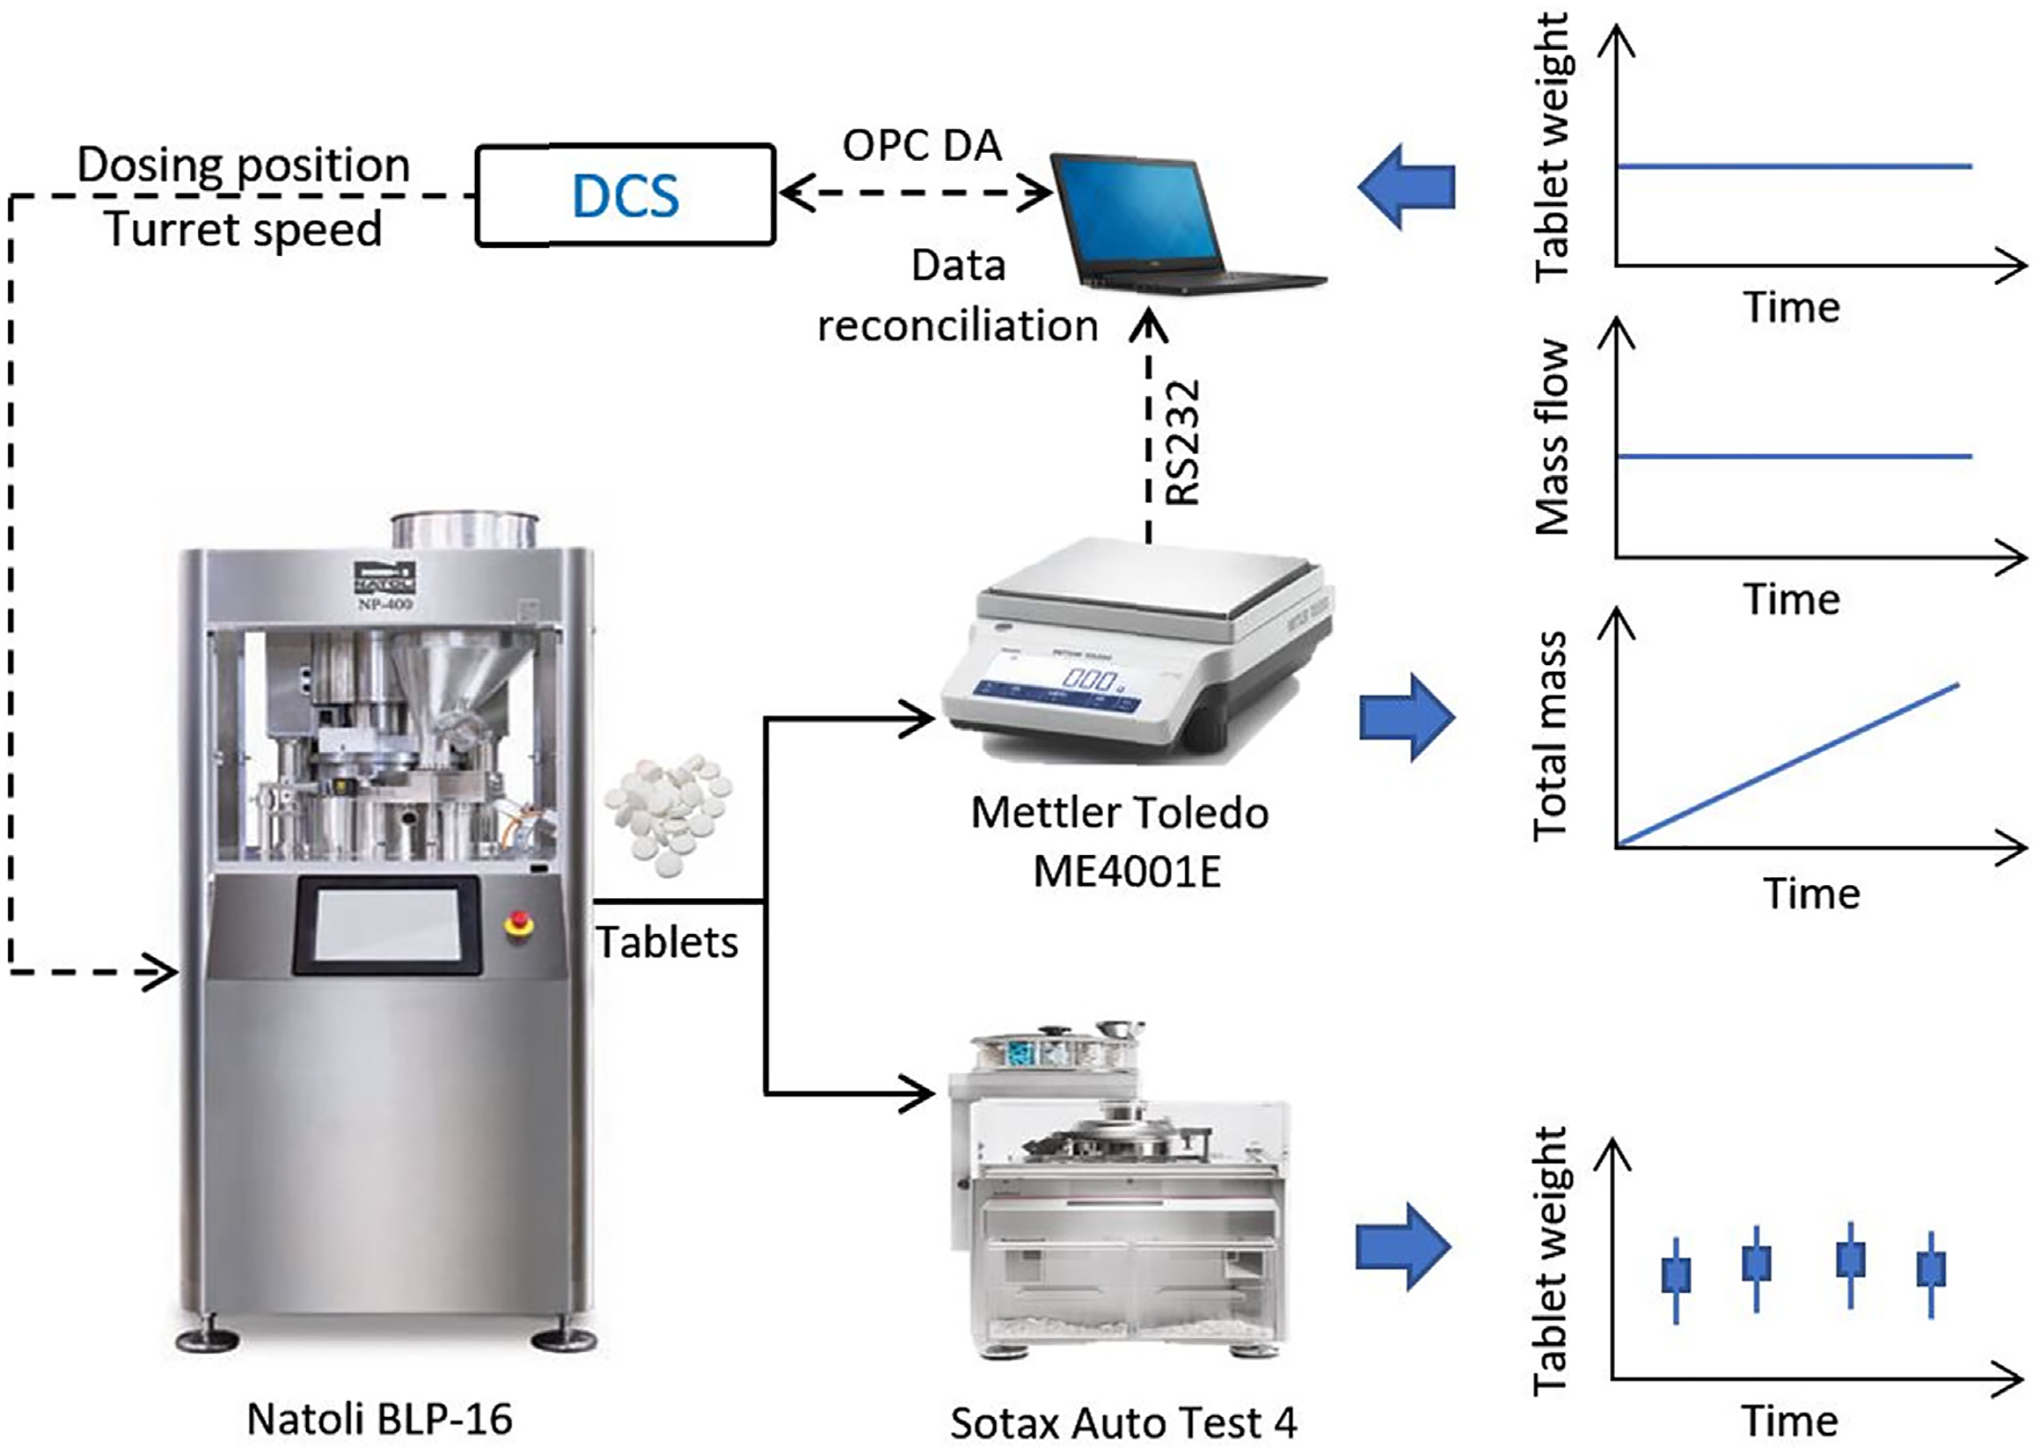
Tablet weight measurement for real-time monitoring and control.
First, to capture material understanding, powder compressibility is commonly characterized by the relationship between main compression force and the resulting in-die tablet relative density. It is one of the critical material attributes (CMAs) that affect consistent tablet manufacture. There are many models characterizing powder’s compressibility at various degree of compression. In this study, the Kawakita equation was employed to characterize the main compression force at high tablet relative density (Ludde, 1966), as given below.
| (4) |
| (5) |
where CF is the main compression force, kN; ρc is the model parameter of relative critical density, –, ρr the calculated in-die relative density from tablet weight Wt, and ρt the known a prior true density of the powder, g/cm3; parameters a and b (MPa) are interpreted as the maximum degree of compression and the reciprocal of the pressure applied to attain the maximum degree of compression, respectively; D is the diameter of the die, mm, and T is the minimum in-die tablet thickness pre-set by the punch displacement for B tooling punches with flat cylindrical punch surfaces, mm. It should be noted that the relative critical density ρc is an important material property, which can be used to characterize the material and compression process. Once characterized off-line, the Kawakita model can also be used as a soft sensor to predict the tablet weight using the real-time main compression force measurement as input. However, the soft sensor may lack of accuracy when the powder compressibility varies in, e.g., the relative critical density, due to material property changes of bulk density, particle size, blend composition, moisture content, etc., resulting in gross error due to model-plant mismatches, which should be monitored and eliminated as required.
The proposed general data reconciliation framework was implemented for the tablet weight measurement to correct the imperfect measurement data based on the process knowledge of material compressibility. It is emphasized here that the lock symbol in Fig. 2 indicates that the complexity of the large dimensional data reconciliation problem for the whole tablet press can be reduced by performing the DR problem on the closed subsystem consisting of the main-compression step that is a function involving only main compression force, tablet weight, and powder compressibility (Hodouin and Everell, 1980), which is easy to solve in real time. It should be acknowledged that the turret speed or the punch compaction speed also affects the main compression force to some extent. However, these process variables were observed to have only a marginal effect under the current operating conditions with the studied powder formulation and was thus neglected in the classical Kawakita model.
Since it is hard to ensure normality for the measurement error with the in-house tablet weight measurement, e.g., the impact of dropping tablets on the uncertainty of a non-static balance measurement changes as the total tablet mass builds up in the container, as well as due to the occurrence of gross errors, a Welsch robust estimator ρw was used in this study to accommodate the non-Gaussian measurement error distribution, as well to handle the nonlinearity of Eq. (4) (Dennis and Welsch, 1978; Prata et al., 2010), as shown below.
| (6) |
| (7) |
where ε is the standardized residual; cw is a tuning parameter; e = (zt − zm,t) is the measurement error as in Eq. (2); σ is the standard deviation of measurement error e and can be estimated from historical data for main compression force and tablet weight measurement (Wu et al., 2016). To jointly estimate and update the Kawakita model parameter, the relative critical density ρc is included in the reconciled vector variable z. Instead of a measured parameter to be included in zm, a reference estimated from the historical distribution of ρc can be considered herein (Camara et al., 2016).
In summary, the DR problem for the tablet weight measurement is formulated by casting Eqs. (4) to (7) into the general DR framework of (2), with z = [CF, Wt, ρc]. In this manner, both the uncertainty in the tablet press measurements and the model-plant mismatch in powder compressibility can be tackled within the steady-state optimization problem. Note that although the turret speed is also a measured variable, its measurement error is inherently included in determining the measured value of the tablet weight in Eq. (3), hence is not included explicitly in the data reconciliation.
4. Results and discussion
4.1. Powder compressibility characterization
Compressibility of a powder formulation of 10.0% APAP, 89.8% Avicel MCC PH-200 and 0.2% silica by mass was characterized with Natoli BLP-16 tablet press. The experiments were run in batch mode, wherein a pre-determined amount of blend was poured into the tablet press hopper and both the Natoli tablet press and the Sotax AT4 tester were run in tandem and connected to the DeltaV OPC system and its Process Historian. MATLAB’s statistical toolbox was used to create a set of 30 experimental conditions using Latin Hypercube Sampling (LHS) of turret speeds and in-die relative densities of tablets. Tablet feed frame speeds were set at a constant rate of 2 rpm higher than the turret speeds and the dosing positions were calculated from requisite relative densities by using bulk density of powder blend (i.e., around 0.35 g/cm3). The powder blend level in the hopper was kept constant before the start of each run to simulate a continuous manufacturing process. All measurement data of the above mentioned CPPs and CQAs were collected for each of the 2-minute runs. A hundred tablets were collected at-line at steady state to measure their attributes with the Sotax Auto Test 4 tablet tester. Process Historian data collected from both the tablet press and tablet tester were used to calculate mean and standard deviation of each of the measurements recorded. The Kawakita equation parameters were identified or estimated as follows, the punch die diameter D is 8.0 mm, powder true density ρt is 1.52 g/cm3,ρc is 0.250, a is 0.791, and b−1 equals 14.15 MPa. Good agreements between the Kawakita equation predictions of Eqs. (4) and (5) and experimental measurements are obtained, as shown in Fig. 5, demonstrating the clear correlation between the main compression force and tablet weight. Note that two in-die tablet thickness T of 4.60 mm and 4.10 mm were used here with varying dosing position to cover a wider range of relative density.
Fig. 5.
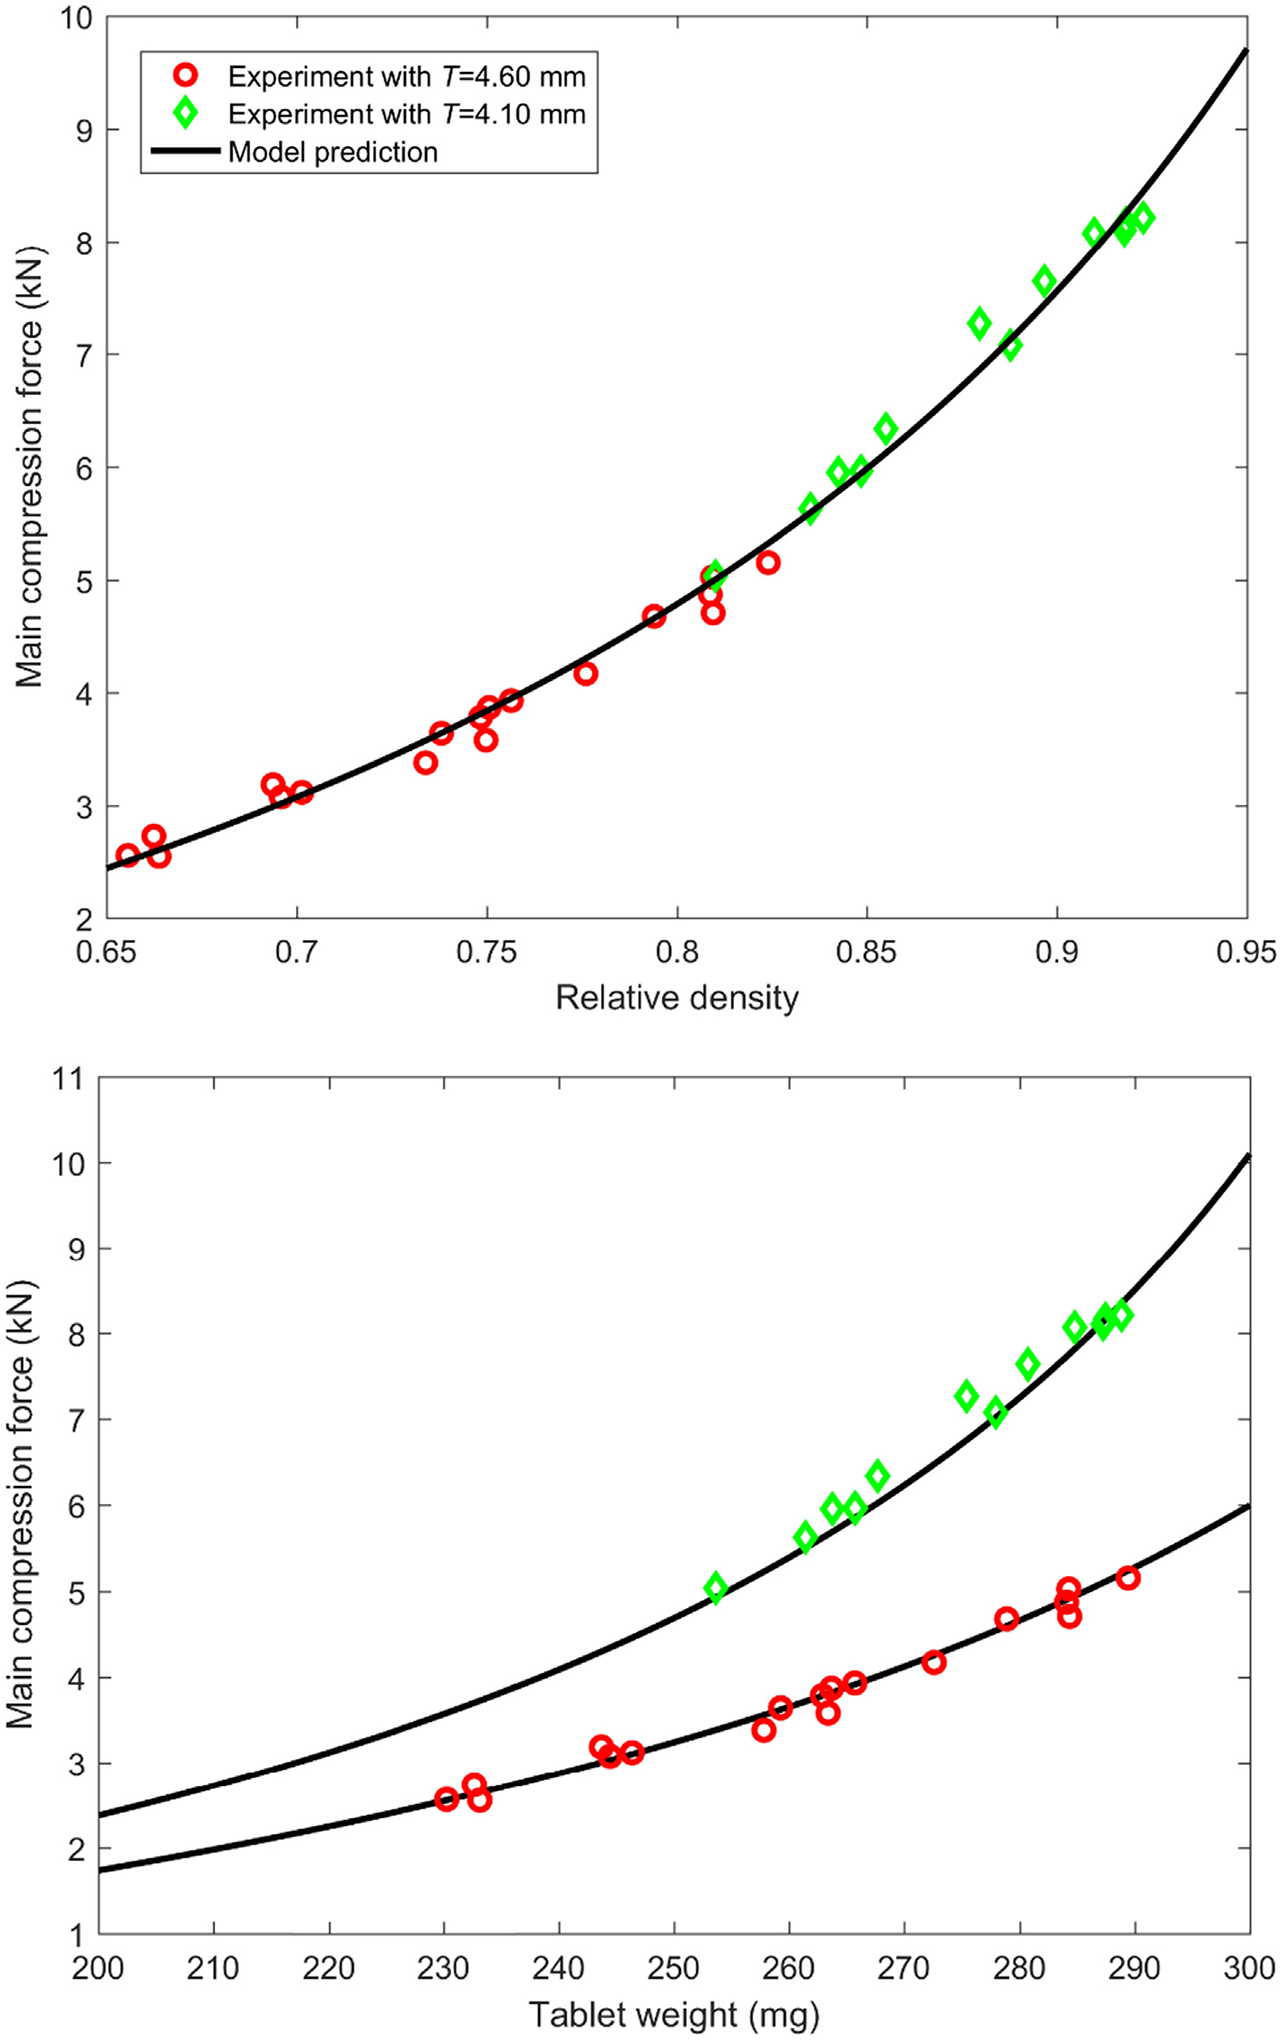
Comparisons between Kawakita model prediction and experimental measurements: main compression force vs. relative density (top) and main compression force vs. tablet weight (bottom).
4.2. Offline data reconciliation for tablet press
The proposed data reconciliation strategy was demonstrated and validated offline in the continuous tablet manufacturing pilot plant at Purdue University first with experimental data stored in the DeltaV Historian, as illustrated in Fig. 6. The experiment was run in open-loop control with step changes imposed on turret speed and dosing position. The Sotax tablet tester was employed to analyze the tablet weight when the process reached steady state after each step change.
Fig. 6.
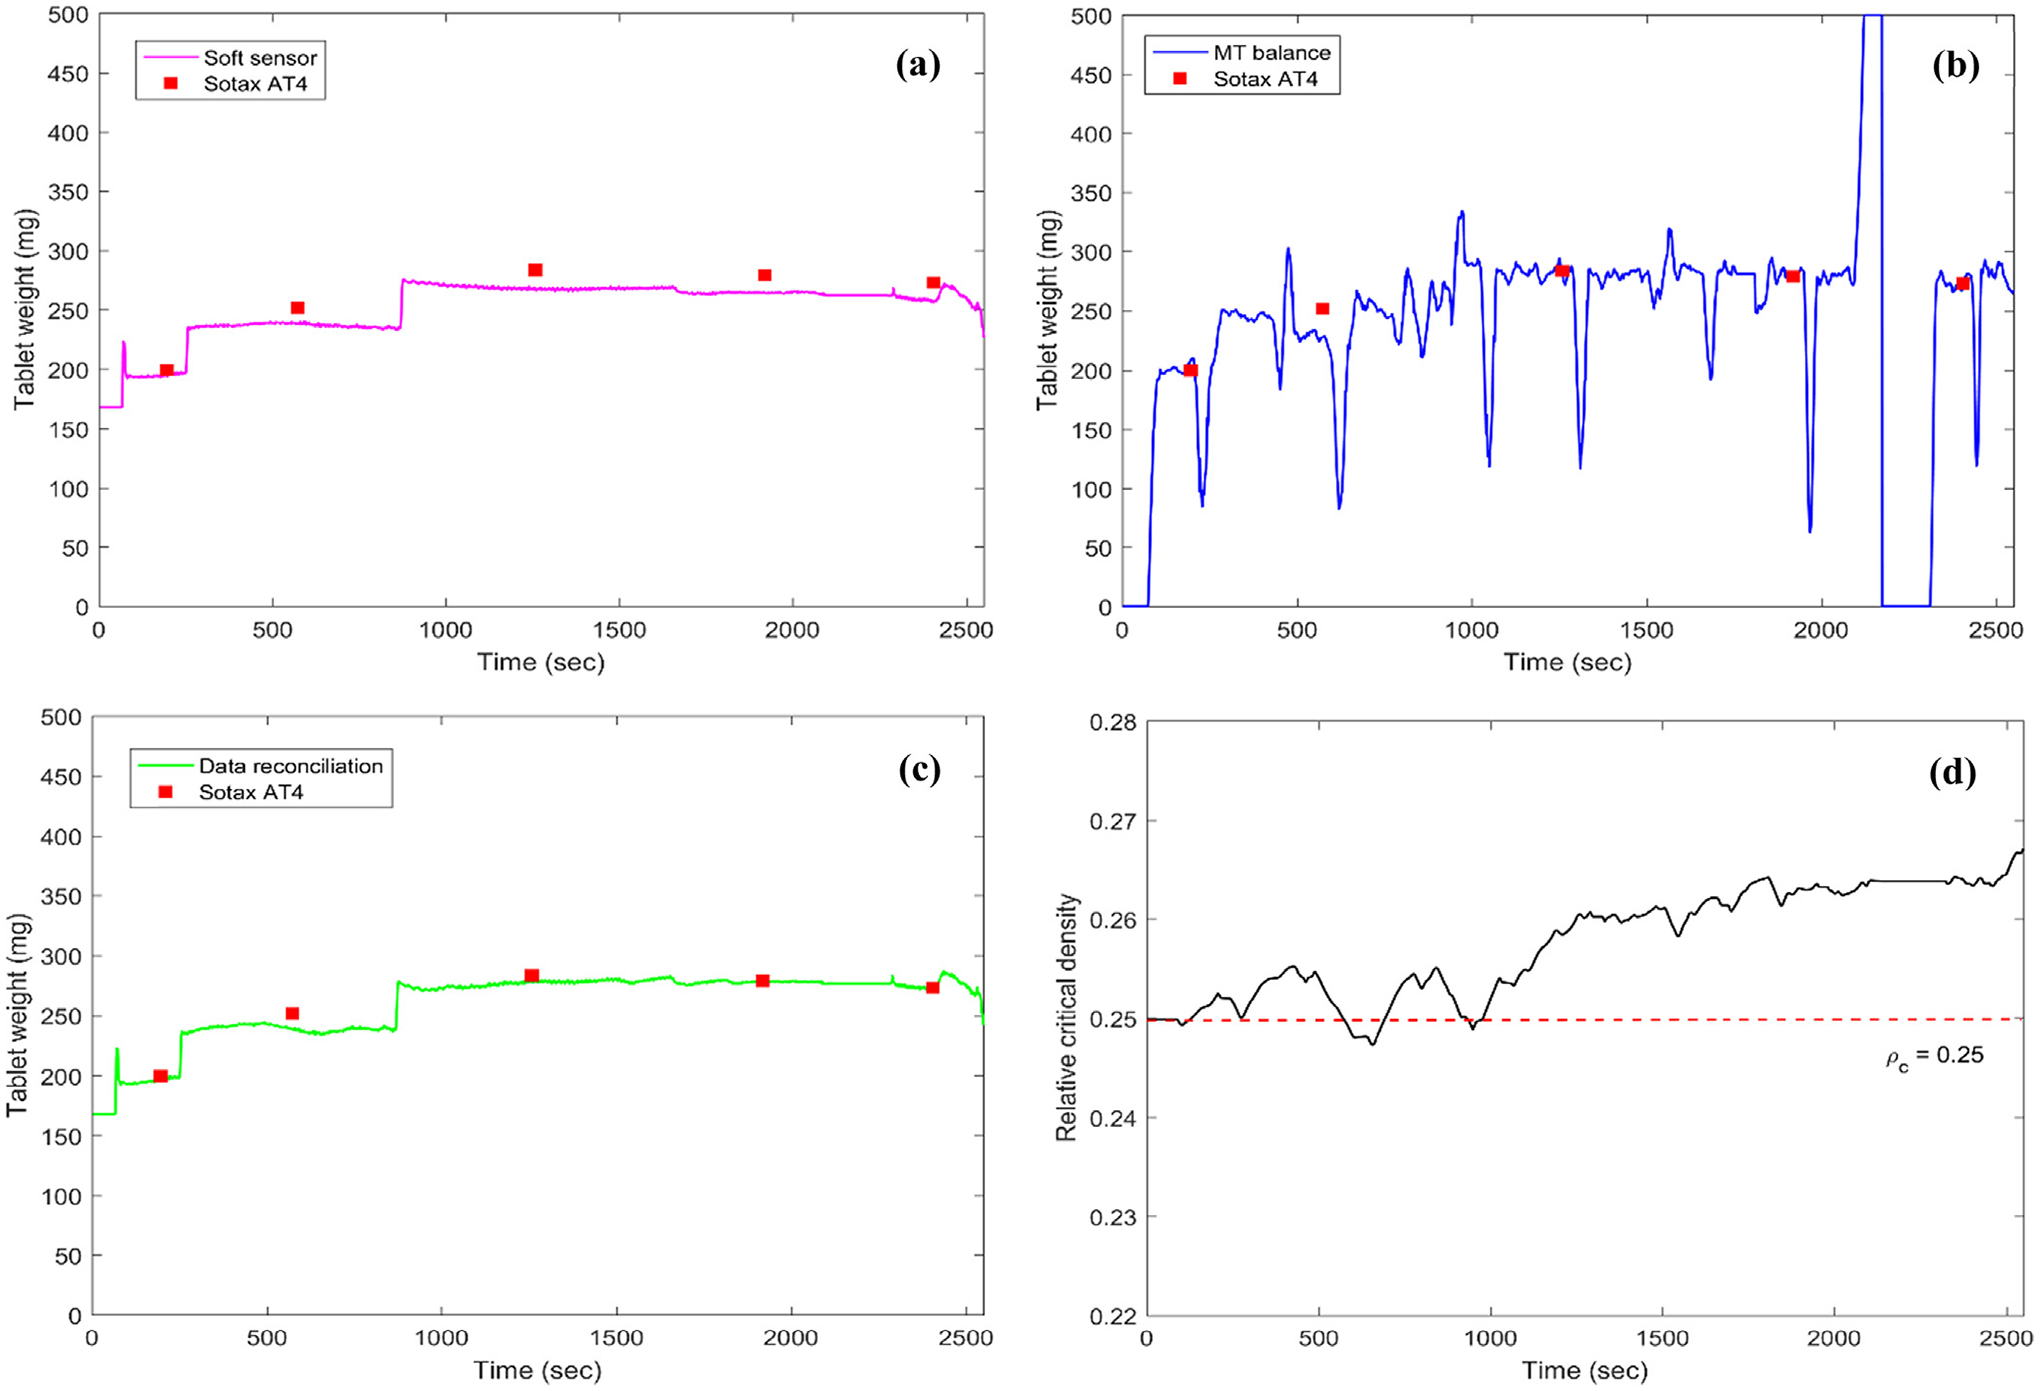
Offline data reconciliation with open-loop experiment with at-line Sotax AT4 sampling. (a) Soft sensor predictions of tablet weight with original Kawakita model subjects to model uncertainties; (b) Measurements of tablet weight with a balance subject to noise and gross errors; (c) Reconciled measurement of tablet weight; (d) Kawakita model parameter updates with data reconciliation.
It is observed that a soft sensor using the Kawakita equation developed during the powder compressibility characterization in Fig. 5 was able to predict the tablet weight with main compression force quite precisely and was able to track the step changes of tablet weight quite well. Worth mentioning here is that the main compression force measurement with Natoli BLP-16 was very stable and had been recently recalibrated to confirm its accuracy (the reconciled main compression force agreed well with the raw measurement, not shown here). However, an obvious offset was found when compared to the at-line Sotax AT4 measurement in Fig. 6(a) which was regarded as the most accurate and precise measurement at the current stage. It should be pointed out here that the powder compressibility characterization using Kawakita equation as demonstrated in Fig. 5 was completed about one year before this open-loop experiment and was using the same source of material but with shipments one year apart. Hence, variations in raw material properties are the likely cause for this offset. The in-house design of real-time tablet weight measurement based on a Mettler Toledo (MT) balance does suffer from gross errors due to diversion of tablet samples to the Sotax AT4 at predetermined regular intervals (see each drop-and-recover in measurement after Sotax AT4 sampling) as well as due to the disturbances caused by replacement of the tablet container between 2200 and 2400 s in Fig. 6(b). Overall, the tablet weight measurement by MT balance was accurate despite the noise owing to non-static balance measurement. The proposed data reconciliation strategy of this study which reconciled the main compression force and tablet weight on the basis of process knowledge on material compressibility characterized using the Kawakita model showed promise in two aspects. First, the gross errors with MT balance tablet weight measurement were eliminated by using a Welsch robust estimator without affecting the reconciled measurement, as shown in Fig. 6(c), a smooth tablet weight measurement was also obtained. The role of the robust estimator is especially important when the sensors were undergoing maintenance or replacement due to failures. Secondly, the relative critical density parameter ρc was estimated in real-time and monitored showing a shift from the reference value of 0.250 to 0.264, as shown in Fig. 6(d), which could be due to variations in raw material properties in particle size, moisture content, etc., among shipments one year apart. More research efforts are required to understand the influence of critical material attributes (CMAs) or the ingredient composition on the powder compressibility. Two more experiments with open-loop control and without the use of the at-line Sotax AT4 measurement to avoid gross errors were used to confirm the shift of the material compressibility, as shown in Fig. 7.
Fig. 7.
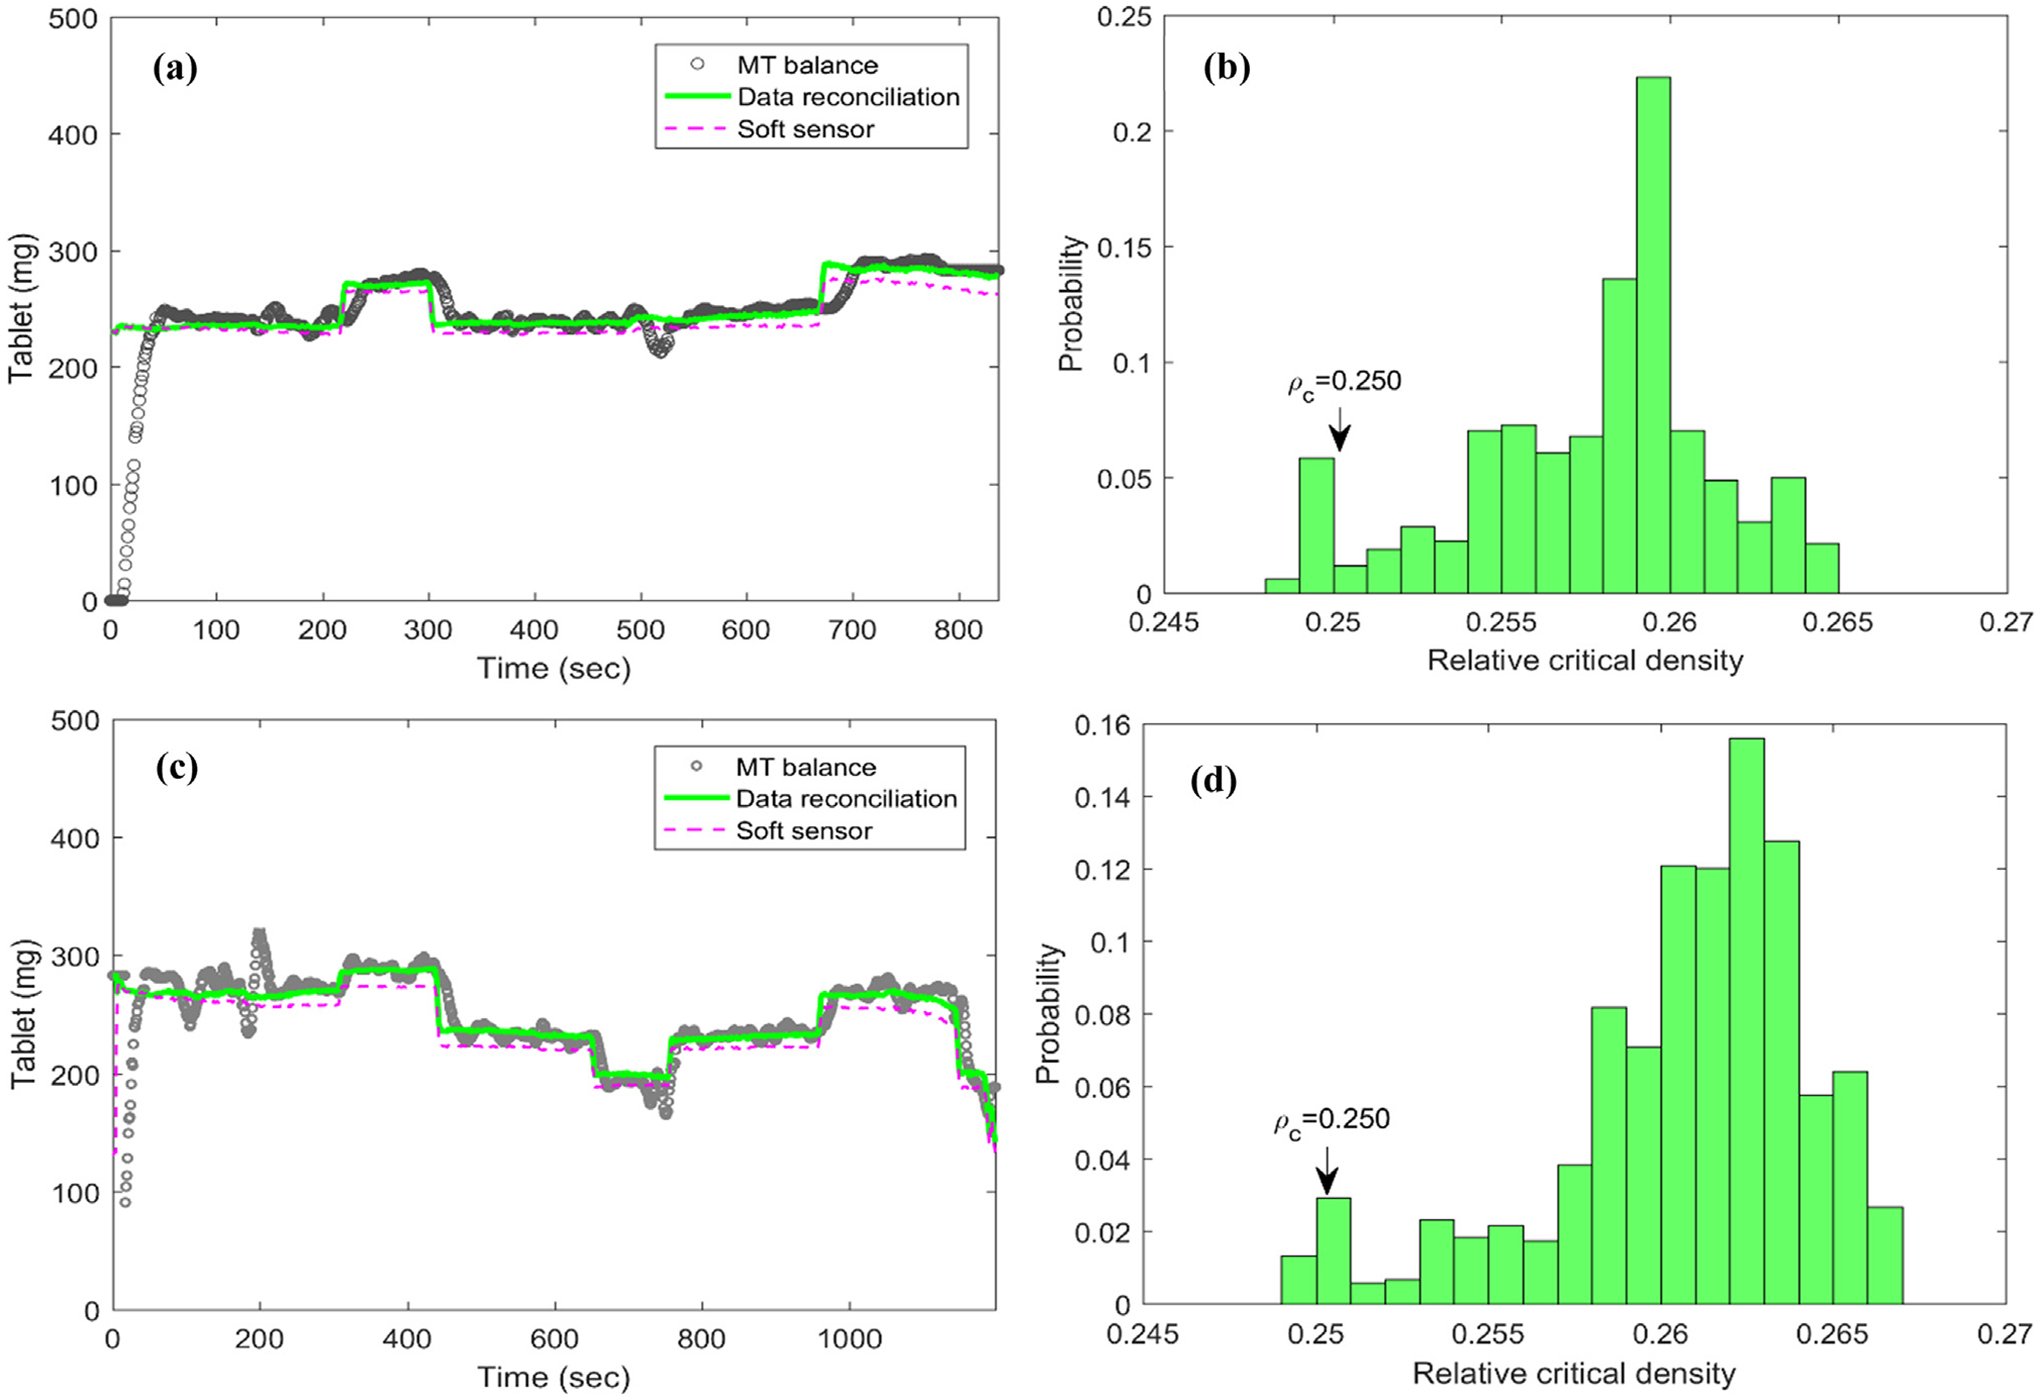
Offline data reconciliation with open-loop experiment without at-line Sotax AT4 sampling.
It can be seen from Fig. 7 that both experiments showed excellent performance of the proposed data reconciliation strategy in correcting the tablet weight measurement provided by the MT balance in reducing the measurement noise. The shift of the material compressibility in relative critical density, resulting in the model-plant mismatch of Kawakita model as well the offset of the soft sensor model prediction, was also corrected by the joint model parameter estimation in the proposed DR framework. The initial reference value of 0.250 in the proposed data reconciliation for relative critical density ρc can be updated once the shift in historical probability distribution of ρc is detected, for example, the mean value of ρc was shifted from the initial reference of 0.250 to 0.258 and 0.261 in these two experiments, respectively, as shown in Fig. 7(b) and (d). The real-time model parameter estimation and update is useful when there was a change in raw material properties or process operations. Moreover, the resulting changes in model parameters can be further used to diagnose the system variations in process operation and material properties, as well as to quantify their effects on product quality attributes.
Although DR generates benefits, it can have strong negative effects when some of its hypotheses are violated or the procedure does not find a feasible solution. In such situations, using reconciled data could yield worse results than using the measurements directly (Camara et al., 2016). Hence, before on-line application of the proposed data reconciliation for tablet weight measurement is integrated with the control system in the pilot continuous manufacturing process, it should be verified that the data reconciliation does not alter the system dynamics in the process. Thus, the introduction of any stability issue with the closed-loop control system can be avoided. In this regard, the data reconciliation was again applied offline, using DeltaV historian data of previous experiment trials, to a closed-loop control experiment with set point changes to the tablet weight by adjusting the dosing position, as shown in Fig. 8.
Fig. 8.
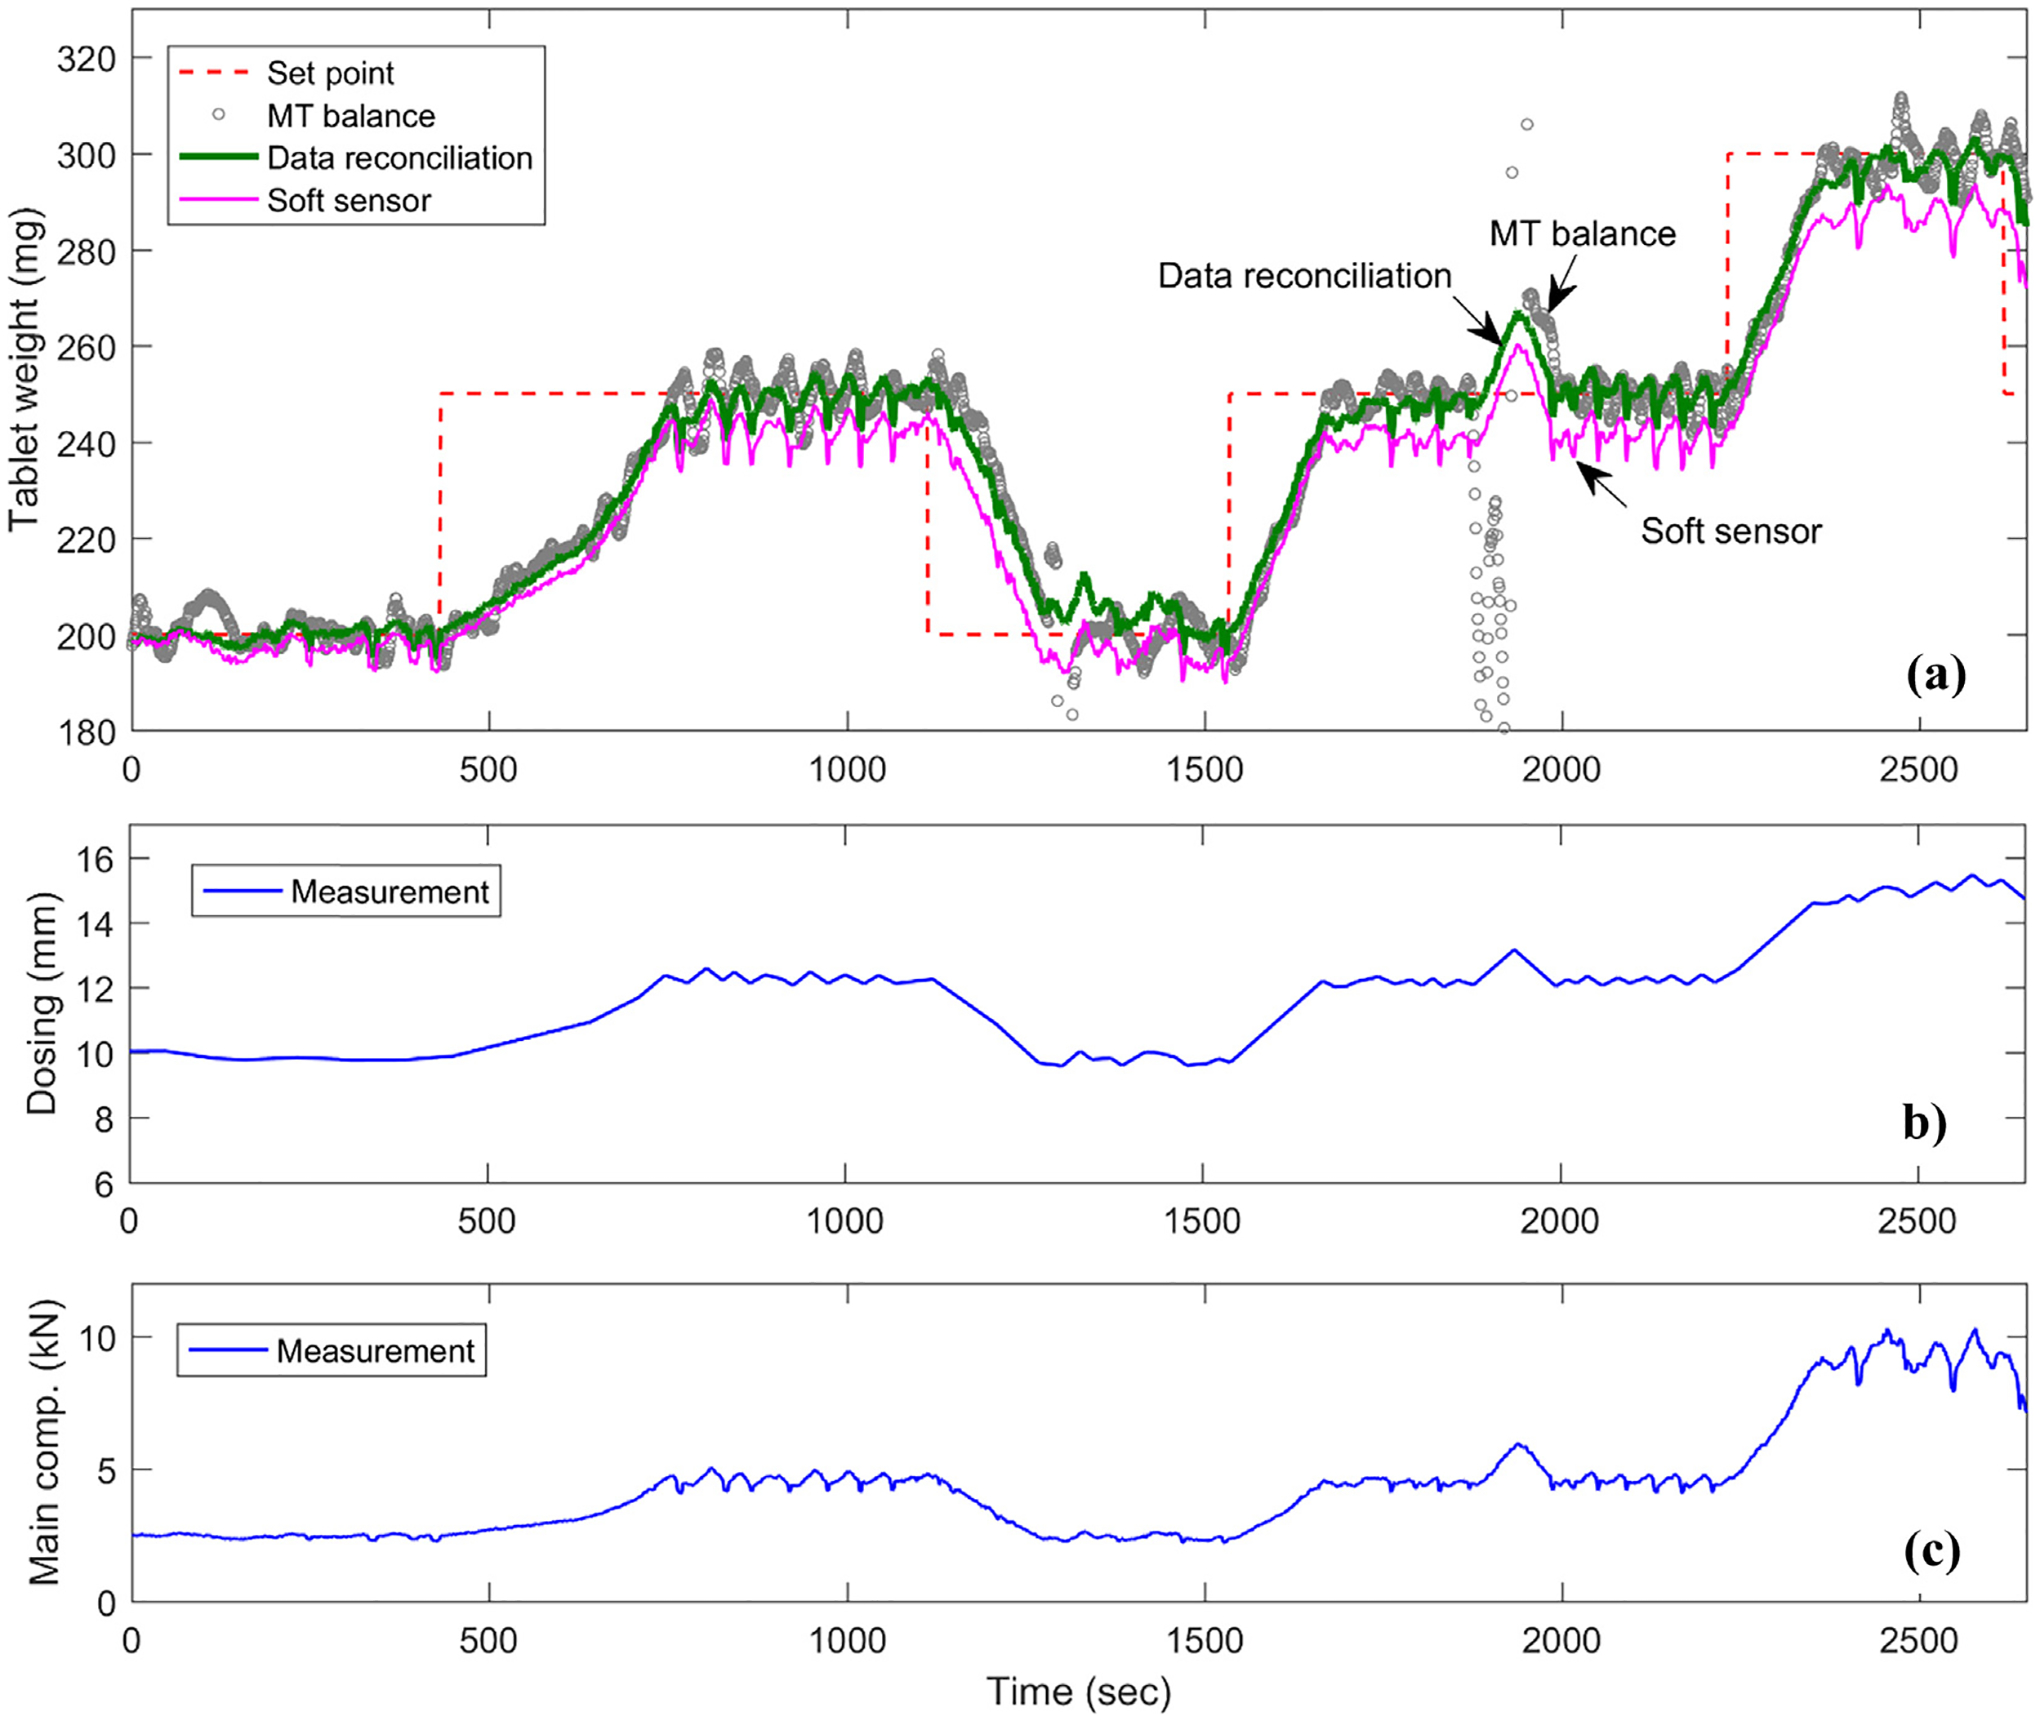
Offline data reconciliation with closed-loop experiment without at-line Sotax AT4 sampling.
It can be seen in Fig. 8(a) that the direct use of the noisy tablet weight measurement from the MT balance leads to oscillations in the tablet press, as shown by the variations in dosing position and main compression force after reaching the tablet weight set points in Fig. 8(b) and (c), respectively. The hypothesis in this study, as indicated by the lock symbol in Fig. 2, was that the main compression step forms a closed system and involves only the main compression force and tablet weight. The main compression step completes instantaneously without any dynamics nor with the exiting and dropping of tablets into the container due to a short distance. Therefore, it is as expected that the steady-state data reconciliation neither involves nor introduces extra dynamics to the system, the same oscillations for the reconciled tablet weight was thus also found in Fig. 8(a). The same applies to the soft sensor measurement by Kawakita model. The capability of data reconciliation in correcting the measurement uncertainties and estimating the model parameter were again confirmed with closed-loop experiment, as shown in Fig. 9. The measurement errors between the reconciled (or the soft-sensor predicted) measurement and raw measurement are plotted in Fig. 9(a) and (b) for tablet weight and main compression force, respectively. Normal error distributions with zero mean are found for both reconciled measurements as expected, whereas an error distribution with an offset was obtained for the soft-sensor measurement error due to the model-plant mismatch, which was, however, estimated and updated by the data reconciliation, see the distribution of relative critical density in Fig. 9(c) with a mean located at 0.257, shifting from its reference value of 0.250, same as observed with the open-loop experiment in Fig. 7(b) and (d).
Fig. 9.
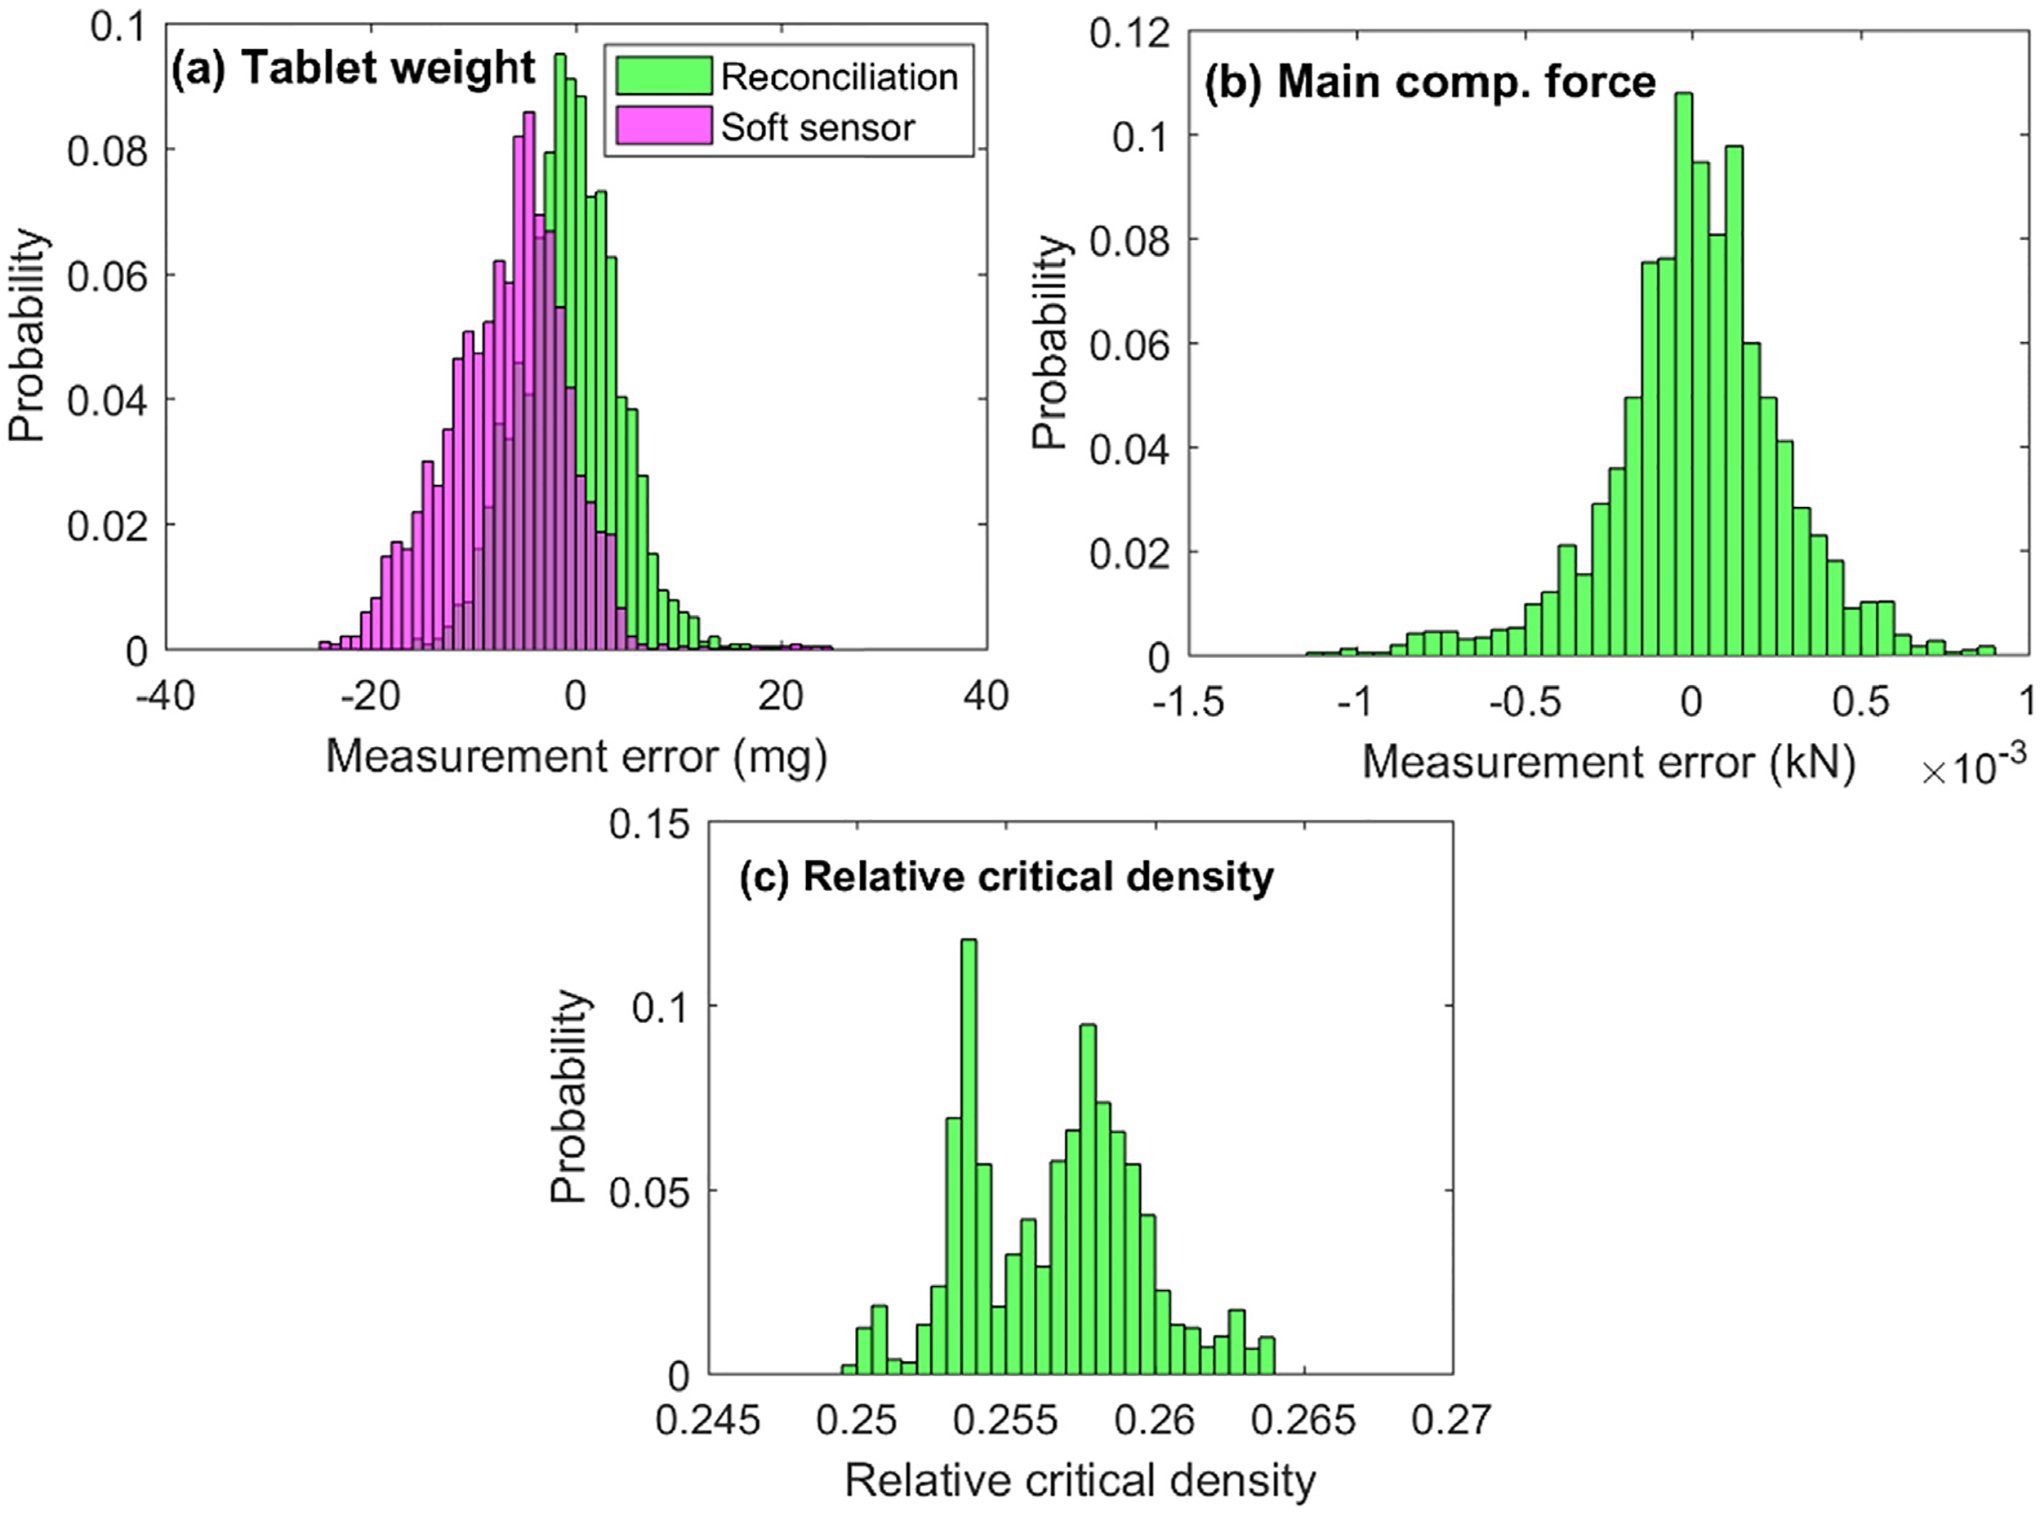
Measurement error and parameter estimation by offline data reconciliation with closed-loop experiment without at-line Sotax AT4 sampling.
Additionally, the data reconciliation formulation focusing solely on the main compression step includes only two nonlinear constraints of Eqs. (4) and (5), which can be solved within a fraction of a second using MATLAB built-in fmincon function. Thus, it is thereby confirmed that the data reconciliation strategy for tablet weight measurement was capable of reducing the tablet weight measurement uncertainties and estimating important Kawakita model parameter and was ready to be integrated with the process control system for on-line real-time application.
4.3. Online integrated data reconciliation and process control
The reconciled tablet weight measurement was integrated into the tablet press control system, so that the tablet production rate is calculated by Eq. (3) with a reconciled tablet weight and turret speed. The tablet press control system consisted of a hierarchical three-level control design according to the previously proposed systematic framework for process control design and risk analysis in continuous pharmaceutical solid-dosage manufacturing (Su et al., 2017; Su et al., 2018b). The Natoli BLP-16 tablet press has a built-in programmable logic control (PLC) panel to manipulate process parameters of dosing position and turret speed, which is regarded as the Level 0 control in this context, as shown in Fig. 3. A Level 1 control with decoupled Proportional Integral Derivative (PID) control loops was designed for a cascaded control of tablet weight, tablet production rate, and main compression force by manipulating the set points of dosing position and turret speed at the Level 0 control. A Level 2 model predictive control (MPC) was also designed, in which the main compression force was constrained and monitored as it closely related to the tablet CQAs of hardness, tensile strength, and dissolution rate (Su et al., 2018a). The Emersion DeltaV Control Studio and DeltaV Predict toolbox were utilized for Level 1 and 2 control development and implementation (Bhaskar et al., 2017), details of the control loops can be found in Fig. 10. The PID tuning parameters at Level 1 control and MPC process model and tuning parameters at Level 2 control were all retuned or reidentified with the integrated data reconciliation to achieve a better control performance. Continuous tabletting experiment was run first with open-loop control, then Level 1 control, and Level 2 control to validate the online data reconciliation, as well as to compare the control system performance, as shown in Fig. 11. The at-line Sotax AT4 tester was also sampling the tablets during the run to independently verify the final tablet quality.
Fig. 10.
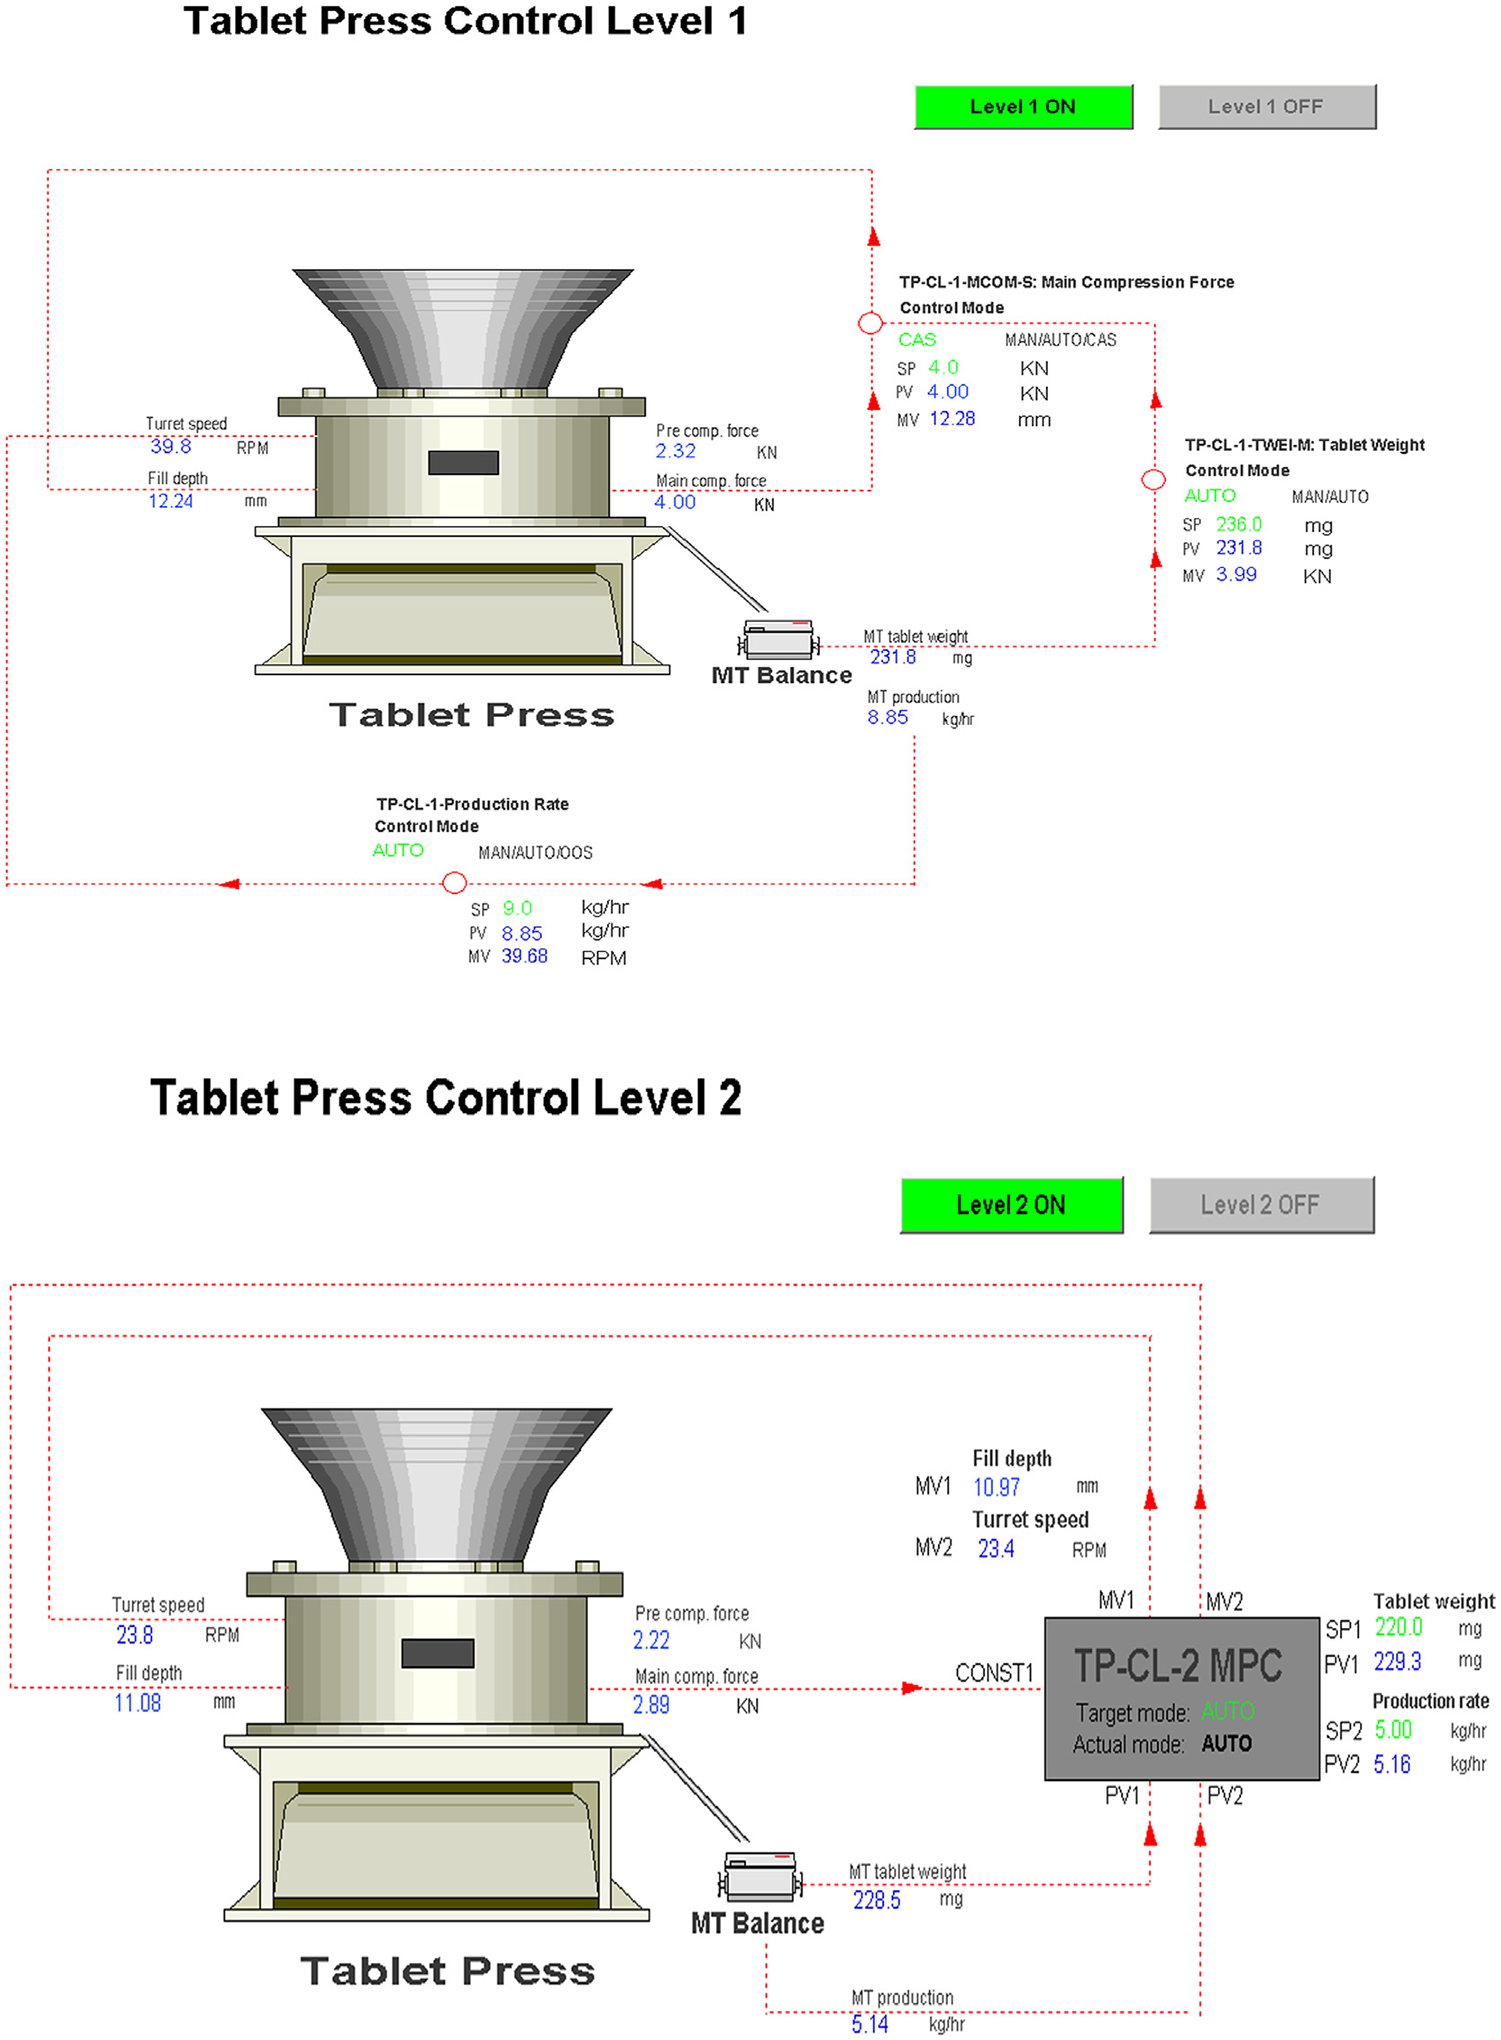
The hierarchical Level 1 (top) and Level 2 (bottom) control for continuous tablet press.
Fig. 11.
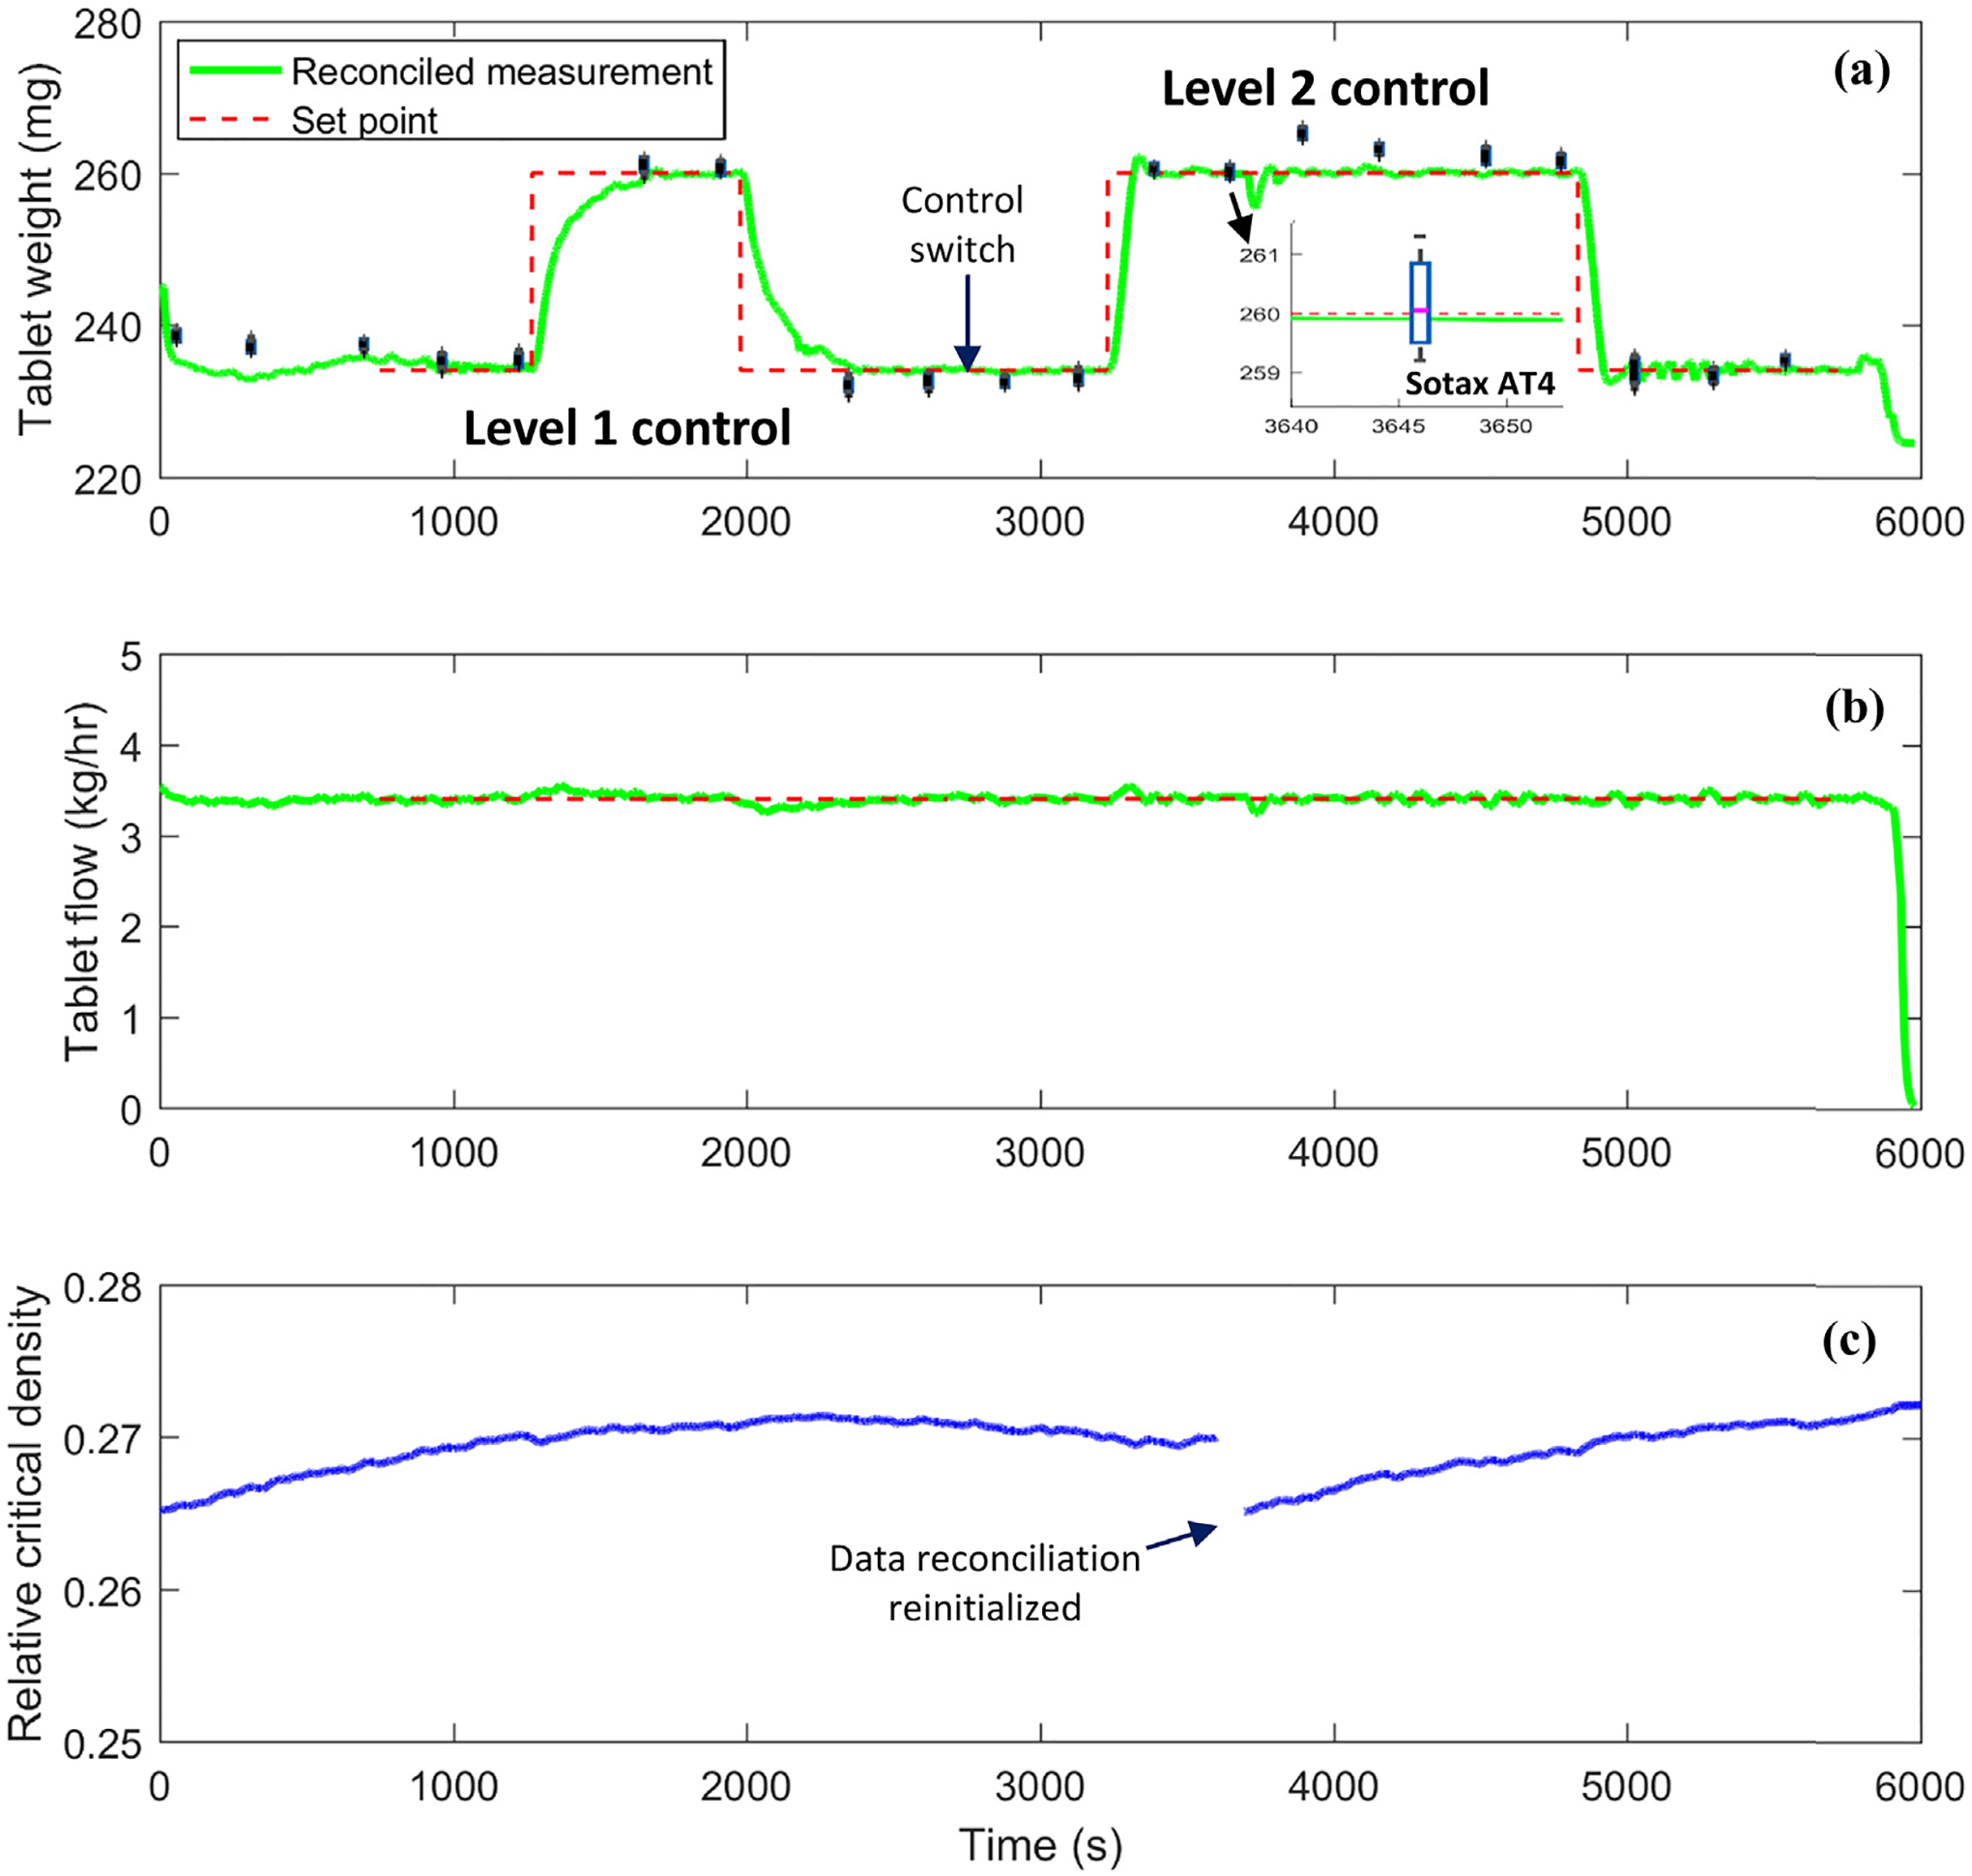
Online integrated data reconciliation and process control for continuous tablet press.
First, it should be pointed out that a total of 16 tablets were analyzed at each sample time with the Sotax AT4 tester, viz., collecting all tablets within one rotation of the turret. In this way, variation among punch stations and variation with processing time can both be characterized, see the box plot of sampling data points and the zoomed-in inset in Fig. 11(a). The control open-loop operation at the beginning of the tablet press run in Fig. 11(a) was conducted to confirm that the reconciled tablet weight measurement agreed well with the at-line Sotax AT4 measurement or to allow the data reconciliation to automatically update the Kawakita model parameter of relative critical density in order to reduce possible model-plant mismatch due to material variation. For instance, in Fig. 11(a) note how the reconciled tablet weight measurements started to match the Sotax AT4 measurements at the third sample and the updated relative critical density at the beginning of the operation in Fig. 11(c). Furthermore, during the control closed-loop operation, the data reconciliation continued updating the model parameter and reached a plateau under Level 1 and Level 2 control set-point changes. Even after a reinitialization of data reconciliation on-purpose at time 3600 s, an offset between reconciled tablet weight measurement and at-line Sotax AT4 measurement was observed but was then gradually reduced with the update of relative critical density. Hence, the proposed data reconciliation framework demonstrated an important feature of on-line automatic calibration for tablet weight measurement and was not found to interfere with the control system design.
Compared to the control closed-loop performance shown in Fig. 8, the integrated data reconciliation for tablet weight measurement has improved the control performance of the tablet press both at Level 1 and Level 2, viz., the system oscillation in Fig. 8 was eliminated in Fig. 11. More importantly, the tablet weight reached the set points steadily with both control strategies except that the Level 2 MPC control showed a more aggressive and promising control performance. During the set point changes of tablet weight, the tablet production rate was maintained the same to match the campaign production or processing capability upstream, e.g., the feeding and blending, see Fig. 11(b). More importantly, variations of the tablet weight among stations at steady state remained the same as the control open-loop operation with current experiment runs, (see the box plots of each sampling point in Fig. 11(a)). Overall, the control system design was shown to have the capability of reaching a targeted tablet weight set point automatically and steadily, which is important during process start up or product switch. Another benefit of the process control system is to maintain the tablet weight under process disturbances or material property variations, as long as the true variations in product quality is correctly understood and not biased by measurement uncertainty.
To sum up, the integrated data reconciliation and control strategy in the studied continuous tablet manufacturing process has demonstrated the capabilities in handling measurement uncertainty and gross errors, monitoring and estimating variations in material properties, and improving process automation and quality control performance in a real pilot plant continuous production of oral solid dosage.
5. Conclusions
Pharmaceutical continuous manufacturing with the goal of real-time release has provided a driving force for the implementation of PAT tools for measuring critical quality attributes. The benefits of both PAT and QbD implementation can be enhanced with insights from process systems engineering on product and process knowledge. Data reconciliation is a powerful and important mathematical tool to combine process knowledge and measurement to reduce data uncertainty and to extend to parameter and state estimation. It has also been widely acknowledged in other industries to improve process understanding and monitoring. As an initial effort, the proposed data reconciliation framework has demonstrated the advantages in handling measurement uncertainty and gross errors, monitoring and estimating variations in material properties, and improving process automation and quality control performance in a real pilot plant continuous production of oral solid dosage.
Although not demonstrated in this work, data reconciliation also shows the potential to estimate CQA variables that cannot be measured directly (Liu et al., 2018). Indeed, the joint treatment of data reconciliation with state estimation deserves more investigation in the future. Moreover, the estimation problem must be carefully designed in case some of the model parameters or state variable are not estimable or observable when performed independently and simultaneously with the data reconciliation procedure (Quelhas and de Jesus, 2013). In a broader view, data fusion or information fusion (Khaleghi et al., 2013) in pharmaceutical continuous manufacturing could provide further benefits. Information fusion is the study of efficient methods for automatically or semi-automatically transforming information from different sources and different points in time into a representation that provides effective support for human or automated real-time release decision making.
Acknowledgement
Funding for this project was made possible, in part, by the Food and Drug Administration through grant U01FD005535. Views expressed by authors do not necessarily reflect the official policies of the Department of Health and Human Services; nor does any mention of trade names, commercial practices, or organization imply endorsement by the United States Government. This work was also supported in part by the National Science Foundation under grant EEC-0540855 through the Engineering Research Center for Structure Organic Particulate Systems. Purdue Process Safety and Assurance Centre (P2SAC) and technical support from Douglas Voss of Natoli are also appreciated.
Footnotes
Declaration of interests
None.
Appendix A. Supplementary data
Supplementary data to this article can be found online at https://doi.org/10.1016/j.ijpharm.2019.04.003.
References
- Bagajewicz MJ, Cabrera E, 2003. Data reconciliation in gas pipeline systems. Ind. Eng. Chem. Res 42 (22), 5596–5606. [Google Scholar]
- Bhaskar A, Barros FN, Singh R, 2017. Development and implementation of an advanced model predictive control system into continuous pharmaceutical tablet compaction process. Int. J. Pharm 534, 159–178. [DOI] [PubMed] [Google Scholar]
- Boukouvala FN, Ramachandran R, Muzzio F, Ierapetritou M, 2012. An integrated approach for dynamic flowsheet modeling and sensitivity analysis of a continuous tablet manufacturing process. Comput. Chem. Eng 42, 30–47. [Google Scholar]
- Camara MM, Quelhas AD, Pito JC, 2016. Performance evaluation of real industrial RTO systems. Process 4, 44. [Google Scholar]
- Câmara MM, Soares RM, Feital T, Anzai TK, Diehl FC, Thompson PH, Pinto JC, 2017. Numerical aspects of data reconciliation in industrial applications. Processes 5 (4), 56. [Google Scholar]
- Cao H, Mushnoori S, Higgins B, Kollipara C, Fermier A, Hausner D, et al. , 2018. A systematic framework for data management and integration in a continuous pharmaceutical manufacturing processing line. Processes 6 (5), 53. [Google Scholar]
- Chen Z, Lovett D, Morris J, 2011. Process analytical technologies and real time process control a review of some spectroscopic issues and challenges. J. Process Control 21 (10), 1467–1482. [Google Scholar]
- Crowe CM, 1996. Data reconciliation-progress and challenges. J. Process Control 6 (2–3), 89–98. [Google Scholar]
- Dennis JE Jr, Welsch RE, 1978. Techniques for nonlinear least squares and robust regression. Commun. Statistics-Simul. Comput 7 (4), 345–359. [Google Scholar]
- Faber R, Li P, Wozny G, 2003. Sequential parameter estimation for large-scale systems with multiple data sets 1 computational framwork. Ind. Eng. Chem. Res 42 (23), 5850–5860. [Google Scholar]
- Faber R, Li P, Wozny G, 2004. Sequential parameter estimation for large-scale systems with multiple data sets 2 Application to an industrial coke-oven-gas purification process. Ind. Eng. Chem. Res 43 (15), 4350–4362. [Google Scholar]
- Ganesh S, Troscinski R, Schmall N, Lim J, Nagy Z, Reklaitis G, 2017. Application of X-ray sensors for in-line and non-invasive monitoring of mass flow rate in continuous tablet manufacturing. J. Pharm. Sci 106 (12), 3591–3603. [DOI] [PubMed] [Google Scholar]
- García-Muñoz S, Butterbaugh A, Leavesley I, Manley L, Slade D, Bermingham S, 2018. A flowsheet model for the development of a continuous process for pharmaceutical tablets: an industrial perspective. AIChE J 64, 511–525. [Google Scholar]
- Guo S, Liu P, Li Z, 2016. Inequality constrained nonlinear data reconciliation of a steam turbine power plant for enhanced parameter estimation. Energy 103, 215–230. [Google Scholar]
- Hodouin D, Everell M, 1980. A hierarchical procedure for adjustment and material balancing of mineral processes data. Int. J. Minneal Process 7, 91–116. [Google Scholar]
- Ierapetritou M, Muzzio F, Reklaitis G, 2016. Perspectives on the continuous manufacturing of powder-based pharmaceutical processes. AIChE J 62 (6), 1846–1862. [Google Scholar]
- Johnston LP, Kramer MA, 1995. Maximum likelihood data rectification: steady-state systems. AIChE J 41, 2415–2426. [Google Scholar]
- Khaleghi B, Khamis A, Karray FO, Razavi SN, 2013. Multisensor data fusion: a review of the state-of-the-art. Inf. Fusion 14, 28–44. [Google Scholar]
- Lee MH, Lee SJ, Han C, Chang KS, Kim SH, You SH, 1998. Hierarchical on-line data reconciliation and optimization for an industrial utility plant. Comput. Chem. Eng 22, S247–S254. [Google Scholar]
- Lee SL, O’Connor TF, Yang X, Cruz CN, Chatterjee S, Madurawe RD, Woodcock J, 2015. Modernizing pharmaceutical manufacturing: from batch to continuous production. J. Pharm. Innov 10 (3), 191–199. [Google Scholar]
- Li X, Wang N, Wang L, Kantor I, Robineau J-L, Yang Y, Marechal F, 2018. A data-driven model for the air-cooling condenser of thermal power plants based on data reconciliation and support vector regression. Appl. Thermal Eng 129, 1496–1507. [Google Scholar]
- Liu J, Su Q, Moreno M, Laird C, Nagy Z, Reklaitis G, 2018. Robust state estimation of feeding-blending systems in continuous pharmaceutical manufacturing. Chem. Eng. Res. Des 134, 140–153. [DOI] [PMC free article] [PubMed] [Google Scholar]
- Llanos CE, Sanchéz MC, Maronna RA, 2015. Robust estimators for data reconciliation. Ind. Eng. Chem. Res 54, 5096–5105. [Google Scholar]
- Ludde KH, 1966. Die Pulverkompression. Pharmazie 21, 393–403. [Google Scholar]
- Markl D, Wahl PR, Menezes JC, Koller DM, Kavsek B, Francois K, Khinast JG, 2013. Supervisory control system for monitoring a pharmaceutical holt melt extrusion process. AAPS PharmSciTech 14 (3), 1034–1044. [DOI] [PMC free article] [PubMed] [Google Scholar]
- Moreno M, Liu J, Ganesh S, Su Q, Yazdanpanah N, O’Connor T, et al. , 2017. Steady-state data reconciliation of a direct compression tableting line. AIChE annual meeting Minneapolis, US: AIChE Annual Meeting. [Google Scholar]
- Penas DR, González P, Egea JA, Doallo R, Banga JR, 2017. Parameter estimation in large-scale systems biology models: a parallel and self-adaptive cooperative strategy. BMC Bioinformatics BMC Series-open, Inclusive and Trusted 18, 52. [DOI] [PMC free article] [PubMed] [Google Scholar]
- Piccolo M, Douglas PL, Lee PL, 1996. Data reconciliation using Aspen Plus. Dev. Chem. Eng. Mineral Process 4, 157–182. [Google Scholar]
- Prata DM, Schwaab M, Lima EL, Pinto JC, 2010. Simultaneous robust data reconciliation and gross error detection through particle swarm optimization for an industrial polypropylene reactor. Chem. Eng. Sci 65, 4943–4954. [Google Scholar]
- Quelhas A, de Jesus NP, 2013. Common vulnerabilities of RTO implementation in real chemical processes. Can. J. Chem. Eng 91, 652–668. [Google Scholar]
- Rafiee A, Behrouzshad F, 2016. Data reconciliation with application to a natural gas processing plant. J. Nat. Gas Sci. Eng 31, 538–545. [Google Scholar]
- Rogers A, Hashemi A, Ierapetritou M, 2013. Modeling of particulate processes for the continuous manufacturing of solid-based pharmaceutical dosage forms. Process 1, 67–127. [Google Scholar]
- Sarabia D, de Prada C, Gómez E, Gutierrez G, Cristea S, Sola JM, Gonzalez R, 2012. Data reconciliation and optimal management of hydrogen networks in a petrol refinery. Control Eng. Practice 20, 343–354. [Google Scholar]
- Sen MC, Singh R, John J, Ramachandran R, 2013. Multi-scale flowsheet simulation of an integrated continuous purification-downstream pharmaceutical manufacturing process. Int. J. Pharm 445, 29–38. [DOI] [PubMed] [Google Scholar]
- Shardt YA, Huang B, 2013. Data quality assessment of routine operating data for process identification. Comput. Chem. Eng 55, 19–27. [Google Scholar]
- Singh R, Sahay A, Muzzio F, Ierapetritou M, Ramachandran Rohit, 2014. A systematic framework for onsite design and implementation of a control system in a continuous tablet manufacturing process. Comput. Chem. Eng 66, 186–200. [Google Scholar]
- Srinivasan S, Billeter J, Narasimhan S, Bonvin D, 2017. Data reconciliation for chemical reaction systems using vessel extents and shape constraints. Comput. Chem. Eng 101, 44–58. [Google Scholar]
- Su Q, Bommireddy Y, Gonzalez M, Reklaitis GV, Nagy ZK, 2018a. Variation and risk analysis in tablet press control for continuous manufacturing of solid dosage via direct compaction. The 13th international symposium on process systems engineering PSE 2018. [DOI] [PMC free article] [PubMed] [Google Scholar]
- Su Q, Hermanto M, Braatz R, Chiu M, 2016. Just-in-Time-Learning based extended prediction self-adaptive control for batch processes. J. Process Control 43, 1–9. [Google Scholar]
- Su Q, Moreno M, Ganesh S, Reklaitis GV, Nagy ZK, 2018b. Resilience and risk analysis of fault-tolerant process control design in continuous pharmaceutical manufacturing. J. Loss Prev. Process Ind 55, 411–422. [DOI] [PMC free article] [PubMed] [Google Scholar]
- Su Q, Moreno M, Giridhar A, Reklaitis GV, Nagy ZK, 2017. A systematic framework for process control design and risk analysis in continuous pharmaceutical solid-dosage manufacturing. J. Pharm. Innov 12, 327–346. [Google Scholar]
- Tona RV, Benqlilou C, Espuña A, Puigjaner L, 2005. Dynamic data reconciliation based on wavelet trend analysis. Ind. Eng. Chem. Res 44 (12), 4323–4335. [Google Scholar]
- U.S. Food and Drug Administration CDER. (2004). Guidance for Industry: PAT-A framework for innovative pharmaceutical development, manufacturing, and quality assurance
- Valdetaro ED, Schirru R, 2011. Simultaneous model selection, robust data reconciliation and outlier detection with swarm intelligence in a thermal reactor power calculation. Ann. Nucl. Energy 38 (9), 1820–1832. [Google Scholar]
- Valle EC, Kalid RD, Secchi AR, Kiperstok A, 2018. Collection of benchmark test problems for data reconciliation and gross error detection and identification. Comput. Chem. Eng 111, 134–148. [Google Scholar]
- Vanarase AU, Alcalà M, Jerez Rozo JI, Muzzio FJ, Romañach RJ, 2010. Real-time monitoring of drug concentration in a continuous powder mixing process using NIR spectroscopy. Chem. Eng. Sci 65, 5728–5733. [Google Scholar]
- Weiss GH, Romagnoli JA, Islam KA, 1996. Data reconciliation-an industrial case study. Comput. Chem. Eng 20 (12), 1441–1449. [Google Scholar]
- Wu SY, Chen C, Gu X, 2016. Research on data reconciliation based on generalized T distribution with historical data. Neurocomputing 175, 808–815. [Google Scholar]
- Yu LX, Amidon G, Khan MA, Hoag SW, Polli J, Raju GK, Woodcock J, 2014. Understanding pharmaceutical quality by design. AAPS J 16 (4), 771–783. [DOI] [PMC free article] [PubMed] [Google Scholar]


