Abstract
Objective
Previous electrophysiological research has characterized canonical oscillatory patterns associated with movement mostly from recordings of primary sensorimotor cortex. Less work has attempted to decode movement based on electrophysiological recordings from a broader array of brain areas such as those sampled by stereoelectroencephalography (sEEG), especially in humans. We aimed to identify and characterize different movement-related oscillations across a relatively broad sampling of brain areas in humans and if they extended beyond brain areas previously associated with movement.
Approach
We used a linear support vector machine (SVM) to decode time-frequency spectrograms time-locked to movement, and we validated our results with cluster permutation testing and common spatial pattern (CSP) decoding.
Main results
We were able to accurately classify sEEG spectrograms during a keypress movement task versus the inter-trial interval. Specifically, we found these previously-described patterns: beta (13 – 30 Hz) desynchronization, beta synchronization (rebound), pre-movement alpha (8 – 15 Hz) modulation, a post-movement broadband gamma (60 – 90 Hz) increase and an event-related potential. These oscillatory patterns were newly observed in a wide range of brain areas accessible with sEEG that are not accessible with other electrophysiology recording methods. For example, the presence of beta desynchronization in the frontal lobe was more widespread than previously described, extending outside primary and secondary motor cortices.
Significance
Our classification revealed prominent time-frequency patterns which were also observed in previous studies that used non-invasive electroencephalography (EEG) and electrocorticography (ECoG), but here we identified these patterns in brain regions that had not yet been associated with movement. This provides new evidence for the anatomical extent of the system of putative motor networks that exhibit each of these oscillatory patterns.
Keywords: Stereoelectroencephalography (sEEG), movement, oscillations, beta, machine learning, support vector machine
Introduction
Several spectral power changes in electrophysiological recordings related to the initiation of movement have been extensively replicated. Beta power (13 – 30 Hz) decreases (desynchronizes) several hundred milliseconds before movement and subsequently rebounds immediately following the movement. This has been shown most prominently in the subthalamic nucleus and globus pallidus local field potentials (Brown & Williams, 2005) and in sensorimotor electrocorticography (ECoG) recordings (Crone, 1998a; Miller et al., 2007; Stolk et al., 2019). In sensorimotor areas, broadband gamma (60 – 90 Hz) also increases around the time of movement and immediately after (Ball et al., 2008; Crone, 1998b), alpha power has been observed to both increase (Stolk et al., 2019) and decrease/desynchronize (Crone, 1998a) during movement, and a robust movement-related negative evoked potential emerges in the time domain 1 – 2 seconds before movement (Toro et al., 1994). These studies have focused on specific brain areas implicated in movement from early electrophysiological and neurosurgical work (Penfield & Boldrey, 1937) and have focused on the most prominent oscillations observed in those regions. However, recent work in a rodent model has suggested that movement-related activity is highly distributed throughout the brain, perhaps even more so than higher cognitive processes (Steinmetz et al., 2019). Sampling a broader range of brain regions in humans will clarify whether canonical motor-related brain regions (e.g. primary motor cortex) are the only ones that exhibit movement-related oscillations and to what extent traditionally non-motor regions demonstrate these same oscillations.
Patients with medically intractable epilepsy can have electrodes surgically inserted into their brains to record from deep structures to determine the focus of their epilepsy and guide the surgical resection of epileptogenic brain tissue. These stereo-electroencephalography (sEEG) recordings provide an opportunity to determine the spatial extent of movement-related oscillations in humans because they sample a broad range of brain areas, including deeper regions. Previous sEEG studies found that movement direction (Johnson et al., 2017) and movement path direction, deviation, and speed (Breault et al., 2017) had statistically-significant correlations with beta power in a few brain areas, which were on the order of r=0.2, reflecting modest predictive power at a single-trial resolution. Another study decoding movement speed that used a more complex classification method, least absolute shrinkage and selection operator (LASSO) linear regression, had a higher correlation of r=0.4 on average using the entire sEEG electrode implantation montage for a patient, but had a large range of correlations across patients and a mean squared error greater than one (Breault et al., 2019). Determining the electrophysiological correlates of movement characteristics, such as direction and speed, are valuable pursuits, but focusing on a specific property of movement likely requires sampling more specialized motor networks, which may not be extensively covered by the sEEG montages of the patients in any given study. This is because the sEEG electrode placements are idiosyncratic based on the clinical indication for each patient and the suspected origin of their epilepsy. Therefore, in studies with small groups of sEEG patients, many brain areas are sampled sparsely and some are not sampled at all. Additionally, sEEG electrodes record local field potentials, which are the combined signal from many neurons and glial cells. Thus, sEEG data may be more suitable for studying behavioral state changes that evoke large differences in synchronous activity in many neurons, such as transitioning from rest to movement, rather than studying more subtle behavioral changes that modulate the activity of fewer neurons, such as changing movement speed, at least until future technological advances enable smaller-scale depth recordings. Therefore, to determine the spatial extent of fundamental movement-related brain networks, we examined electrophysiological differences recorded with sEEG between a simple key-pressing movement and rest. We hypothesized that event-related potentials and oscillatory patterns in sEEG could be used to classify periods of movement compared to inter-trial periods of rest in a broad array of brain areas, including, and extending beyond, those previously described.
Methods
Participants
Eight patients with medically intractable focal epilepsy were surgically implanted with sEEG electrodes for clinical localization of ictal (seizure) onset and epileptogenic zones. All patients underwent robotic assisted 0.8 mm diameter stereoencephalography electrodes (PMT, Chanhassen, MN, USA) with center-to-center pitch of 3.3 to 5 mm for electrode contacts. The total number of electrode contacts analyzed was 979 with 122 +/− 2 contacts per patient. The contacts were distributed in the patients’ brains as shown in Figure 2. Patient demographic and clinical information is shown in Table 1. IRB approval was obtained at Oregon Health & Science University (MOD00042329). Informed consent was obtained under the Declaration of the Principles of Helsinki. All participants were above the age of 16 and gave written informed consent. Consent was given for publication of anonymized identifiable data from all participants. Participants were not enrolled in a clinical trial for this research.
Figure 2.
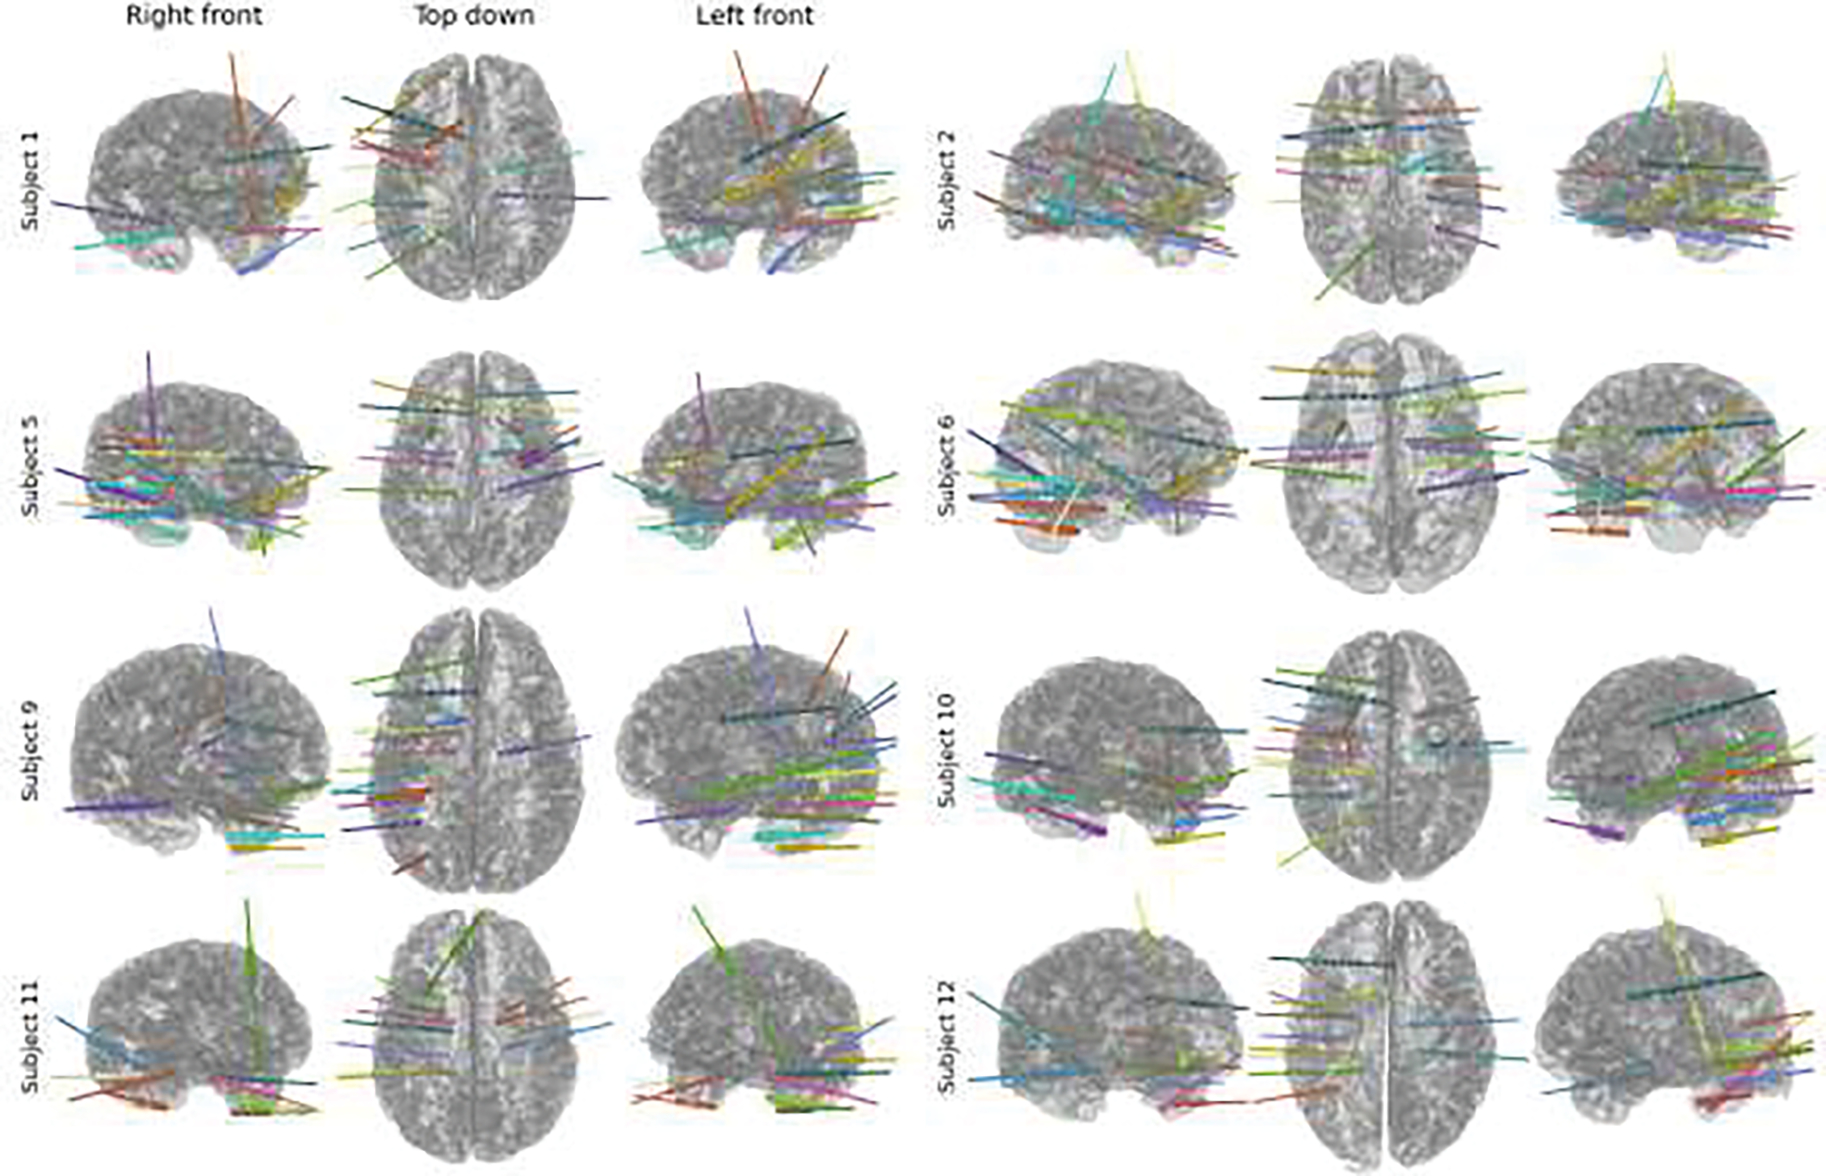
Surgical lead placements for the eight patients shown in a 3D rendering from three perspectives. Coverage was generally biased towards unilaterality and temporal lobe, but a wide range of brain areas were covered.
Table 1.
Patient demographic information and task performance information.
| ID | Age | Sex | Hand Used | Response Time (s) | Task Accuracy (Missed trials) | Events Used | Diagnosis of Origin | Surgery Based on sEEG | Notes |
|---|---|---|---|---|---|---|---|---|---|
| Subject 1 | 44 | M | R | 0.447 +/− 0.118 | 98.6% (0) | 202 | Left entorhinal cortex | None | Photodiode displaced for one block Previous left amygdalohippoca mpectomy |
| Subject 2 | 47 | F | L | 0.858 +/− 0.245 | 100.0% (1) | 280 | Bilateral middle and superior temporal gyri | Bilateral anterior thalamic nucleus DBS | Previous right anterior temporal lobectomy |
| Subject 5 | 33 | F | R | 1.373 +/− 0.624 | 99.3% (12) | 291 | Bilateral temporal pole, amygdala, left orbitofrontal | Ablation of right frontal FCD and right temporal pole and bilateral anterior thalamic nucleus DBS | Frontal cortical dysplasia |
| Subject 6 | 31 | F | R | 0.401 +/− 0.058 | 99.0% (0) | 298 | No seizures | Right anterior temporal lobectomy | |
| Subject 9 | 39 | M | R | 0.558 +/− 0.266 | 97.9% (8) | 286 | No seizures | None | |
| Subject 10 | 31 | F | R | 0.615 +/− 0.276 | 94.2% (7) | 289 | Left hippocampus, amygdala, parahippoca mpal gyrus | Left amygdalo-hippocampect omy | Posterior fossa arachnoid cyst and pseudomeningoc ele |
| Subject 11 | 30 | M | L | 0.595 +/− 0.485 | 100.0% (0) | 134 | Left amygdala and hippocampus | RNS in bilateral hippocampus | Photodiode displaced for two blocks |
| Subject 12 | 26 | M | R | 0.434 +/− 0.118 | 98.3% (0) | 279 | Temporalfrontal neocortical and mesial regions | None | Previous surgical resection of right temporal lobe Cortical dysplasia left fusiform / parahippocampal gyrus |
Abbreviations: deep brain stimulation (DBS), responsive neurostimulation (RNS), focal cortical dysplasia (FCD).
Task
Patients performed a forced two-choice reaction time task with the left and right arrow keys on a laptop using the index and middle finger of their dominant hand respectively (Figure 1). On each trial, patients were presented with a fixation cross for 300–700 ms followed by a left or right arrow cue. Patients were asked to respond before the arrow disappeared with the corresponding key on the laptop keyboard, with a total of 300 trials. The duration of the cue varied between 1.5 times and 4 times each patient’s average reaction time during 10 practice trials. The task was administered using a custom MATLAB script implementing PsychToolBox (Brainard, 1997; Kleiner et al., 2007; Pelli, 1997). The laptop was placed on the patient’s lap while reclined in a hospital bed. A photodiode was attached to the bottom right corner of the screen and was output to the amplifier to synchronize the task to the electrophysiology. Due to noise in the hospital environment a few photodiode events were corrupted for most patients (see Table 1), and, due to the patient displacing the photodiode by shifting in bed, two blocks of 75 trials for one patient and one block of 75 trials for another patient were unusable. Accurate timing could not be derived from trials without photodiode synchronization between the electrophysiology recording and the task so these trials were excluded. Trials where patients pressed the wrong button or did not press a button within the response window were also excluded. All patients responded with their dominant hand. Patients Subject 2 and Subject 11 were left handed and the rest of the patients were right-handed.
Figure 1.
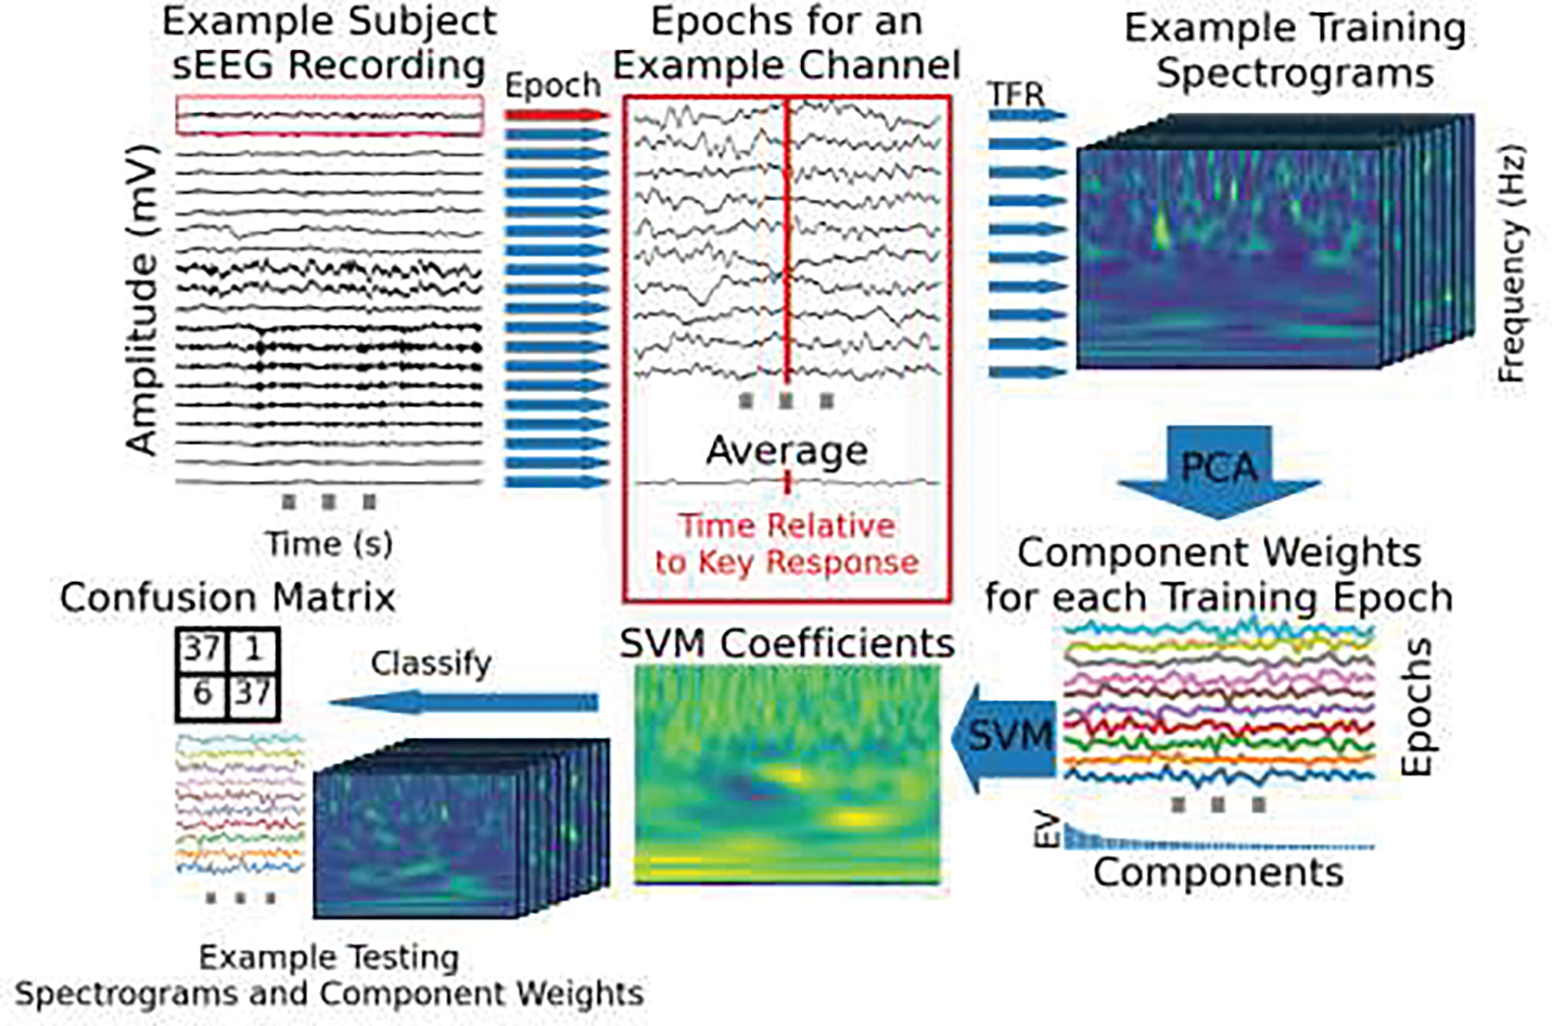
a) The task schema is shown per trial. The diagram is to scale in time. A typical response time (RT) is shown in red. Gray vertical lines indicate different time lengths used for that event to make trials unpredictable for the participant. Trials were included if the response was correct and the response time was within the cue period. b) A schematic of the SVM analysis process is shown. This procedure is repeated for each sEEG contact individually. First (labeled 1), the epochs are created for each of the shaded time areas in a. Example data from the response epoch is shown. Then (2), each epoch is decomposed into time-frequency (TFR) space. Next, principal component analysis (PCA) is applied to the spectrograms for training trials so each trial can be represented by weights per component (3). The explained variance (EV) of the components for this example is shown in the bar plot beneath the PCA weights per component. Next, a support vector machine (SVM) is fit to the PCA weights per trial. The SVM coefficients are shown both in relation to the component weights (4 top) and multiplied by the principal components and summed, projecting back into the time-frequency domain (4 bottom). Lastly, the coefficients are multiplied and summed with the component weights from each test trial and classified based on which category (movement or rest) the output is closer to. The linear decision boundary for the first two principal components out of the 50 used is shown for this example (5). c) The first three eigenvector spectrograms from the PCA decomposition for this example contact. Each principal component is a matrix of time-frequency loadings. Each trial was represented as a vector of weights, one for each principal component, that the SVM used to learn a decision boundary. The dimensionally-reduced, time-frequency representation of each trial can be visualized as a sum of these eigenvector spectrograms weighted by the vector of principal component weights for that trial. The SVM coefficients representing the optimal separation between response and inter-trial spectrograms are represented this way in step 4 (bottom) in b which creates a response-spectrogram-matching-template.
Electrode localization
Electrode positions were determined with MNE-Python (Gramfort, 2013) using the patients’ postoperative computed tomography (CT) image registered to their preoperative magnetic resonance (MR) image (A. Rockhill et al., 2022). The Freesurfer reconstruction labeling of voxels was used to assign anatomical labels to individual contacts with regards to each patient’s anatomy. The closest gray matter label within a 2 mm radius of the center of each contact was assigned to that contact. If no gray matter label was within 2 mm, the contact was assigned to a white matter label if it was within 2 mm. Contacts in white matter have been shown to aid in classification but are lower amplitude (Li et al., 2021) so gray matter labels were prioritized. The Desikan-Killiany atlas was used to label the electrode contacts (Desikan et al., 2006; Fischl, 2012). The contact locations were then warped to a template brain (cvs_avg35_inMNI152) for comparison of their relative spatial locations.
Electrophysiology Preprocessing and Spectrogram Generation
The fixation task events were synchronized with the recording using a photodiode (A. P. Rockhill et al., 2020). The keypress time in the sEEG recording was then determined by taking the difference between the timestamp for the fixation cross being sent to the monitor for display and the timestamp for the keypress on the task computer and adding that to the time of the photodiode deflection. The sEEG data were average re-referenced after excluding bad channels by manual inspection. Epochs were rejected if any channel exceeded 5 mV in peak-to-peak amplitude.
The time-frequency spectrogram for each event was computed via the Morlet wavelets method with frequencies from 1 to 250 Hz with 7 cycles per wavelet using MNE-Python (Gramfort, 2013). A baseline correction was applied by subtracting the baseline median and dividing by the baseline standard deviation for each frequency individually. The entire trial was used as the baseline as recommended in previous work (Delorme & Makeig, 2004). The voltage time-series signal, bandpass filtered between 0.1 and 40 Hz using a finite impulse response filter with a Hamming window of 6.6 times the reciprocal of the shortest transition band (the default in MNE-Python), was appended to the bottom of the spectrogram in order to include the event-related potential in the classification. For every epoch, half a second of data before the start and after the end of that epoch was included in the time-frequency decomposition but then cropped in order to avoid edge artifact.
Classification
Movement spectrograms included the period 0.5 seconds before the response key was pressed to 0.5 seconds after (and the cue-locked spectrograms for the additional analysis was from the time of the cue to 1 second after). These were classified as different from an equal length spectrogram during the inter-trial interval. The classification procedure consisted of the following steps: first, the training spectrograms were dimensionally reduced from 51 frequencies and 1000 time points (51,000 features total) to 50 components using principal component analysis (PCA). The classification accuracies for five randomly-chosen contacts per patient were computed for the full range of principal components using a 5-fold cross validation of the training data (the testing data was left unseen). The number of principal components that maximized the classification accuracy in this validation analysis was 50, which explained 60.2 ± 11.8% of the variance in the spectrogram data. The PCA components were then used as input to a linear SVM classifier (e.g. scikit-learn.org/stable/auto_examples/applications/plot_face_recognition) implemented in scikit-learn (Buitinck et al., 2013), similar to previous approaches (Miao et al., 2021). An 80 / 20% training-test split was used. In addition, another equal length period during a separate part of the inter-trial interval was used as a null classification as shown in Figure 1. The coefficient matrices from the SVM, which showed the correlations of time-frequency points with the movement classification, were validated using a one sample cluster permutation test implemented in MNE-Python (Gramfort, 2013). The threshold was set at 99% of a T distribution (alpha=0.01) with 978 degrees of freedom (one less than the number of contacts). For each sEEG channel, clusters with T-statistics more extreme than 99% (alpha=0.01) of permuted clusters were considered significant.
The SVM method was compared to common spatial pattern (CSP) decoding, a well-used approach in electrophysiology signal classification, for further validation (Gramfort, 2013; Koles et al., 1990). The key difference between the two methods was that the SVM classification was per-contact and therefore did not use any information about which patient or location the contact was recording from, whereas the CSP classification was per-patient and used patterns between all the channels recorded from each patient as the basis for classification. For the CSP classification, the voltage signal was bandpass filtered for each frequency using the same filter design as above and then the spatial pattern was classified using a linear discriminant analysis with 5-fold cross-validation. Thus, the linear SVM was agnostic of the relationship between activity in different sEEG channels whereas the relationship between sEEG channel activity the basis of CSP classification; this difference in approach made CSP an ideal method for validation.
Results
Quantification of the Accuracy of the Support Vector Machine Classifier
The linear SVM using principal components was an effective method of classifying movement spectrograms from spectrograms during the inter-trial interval. The mean of the distribution of scores was unlikely to occur by chance (paired t-test, p < 0.001, df = 977) compared to the null distribution generated from the classification with a separate inter-trial interval period instead of the period during movement. At an alpha=0.01 relative to the null distribution, 384/925 contacts had classification probabilities that were significant (Figure 3). The SVM classification showed that sensorimotor areas (primary motor and somatosensory cortex) had the highest classification accuracy, followed by prefrontal areas (Figure 4 and, in greater detail by specific area, in Figure 5). Despite having a greater amount of coverage, temporal areas generally had lower accuracy of classifications, but some temporal areas still had contacts with spectrograms that were able to be classified at accuracies that were unlikely to occur by chance.
Figure 3.
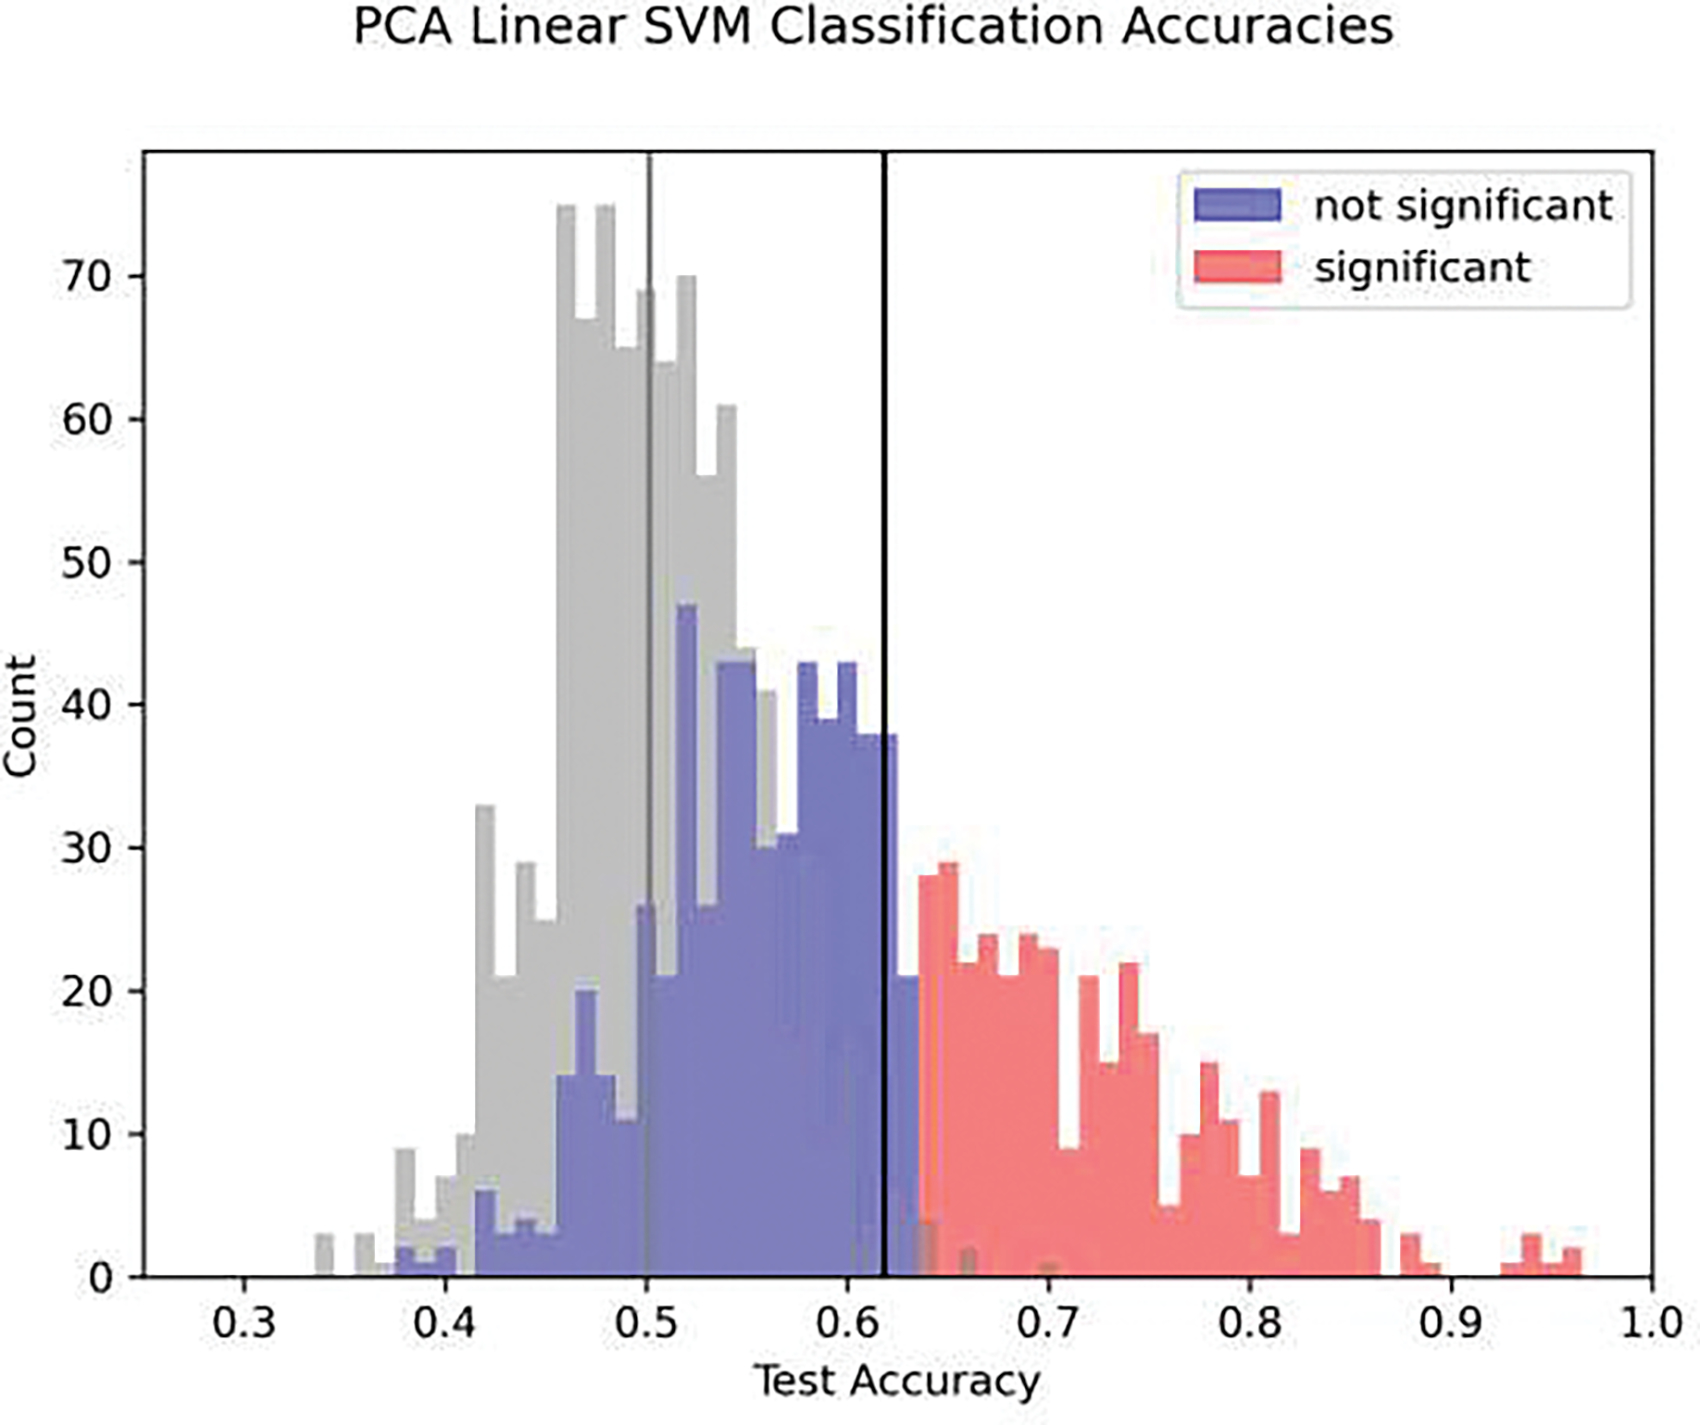
A histogram of the classification accuracy for all electrode contacts across all patients for the SVM classification. Contacts that are significant at an alpha=0.01 level relative to the null distribution pooled across all contacts are shown in red, those that are not are shown in blue. The mean of the total distribution of scores is indicated with a black line, compared to the mean of the null distribution which is shown in gray (paired t-test comparing differences in means between test and null data, p < 0.001, df = 924). Note that each patient had a different number of trials that were used as shown in Table 1 (see Methods for explanation of missing trials) but the classification accuracies are pooled since accuracy is a normalized metric.
Figure 4.
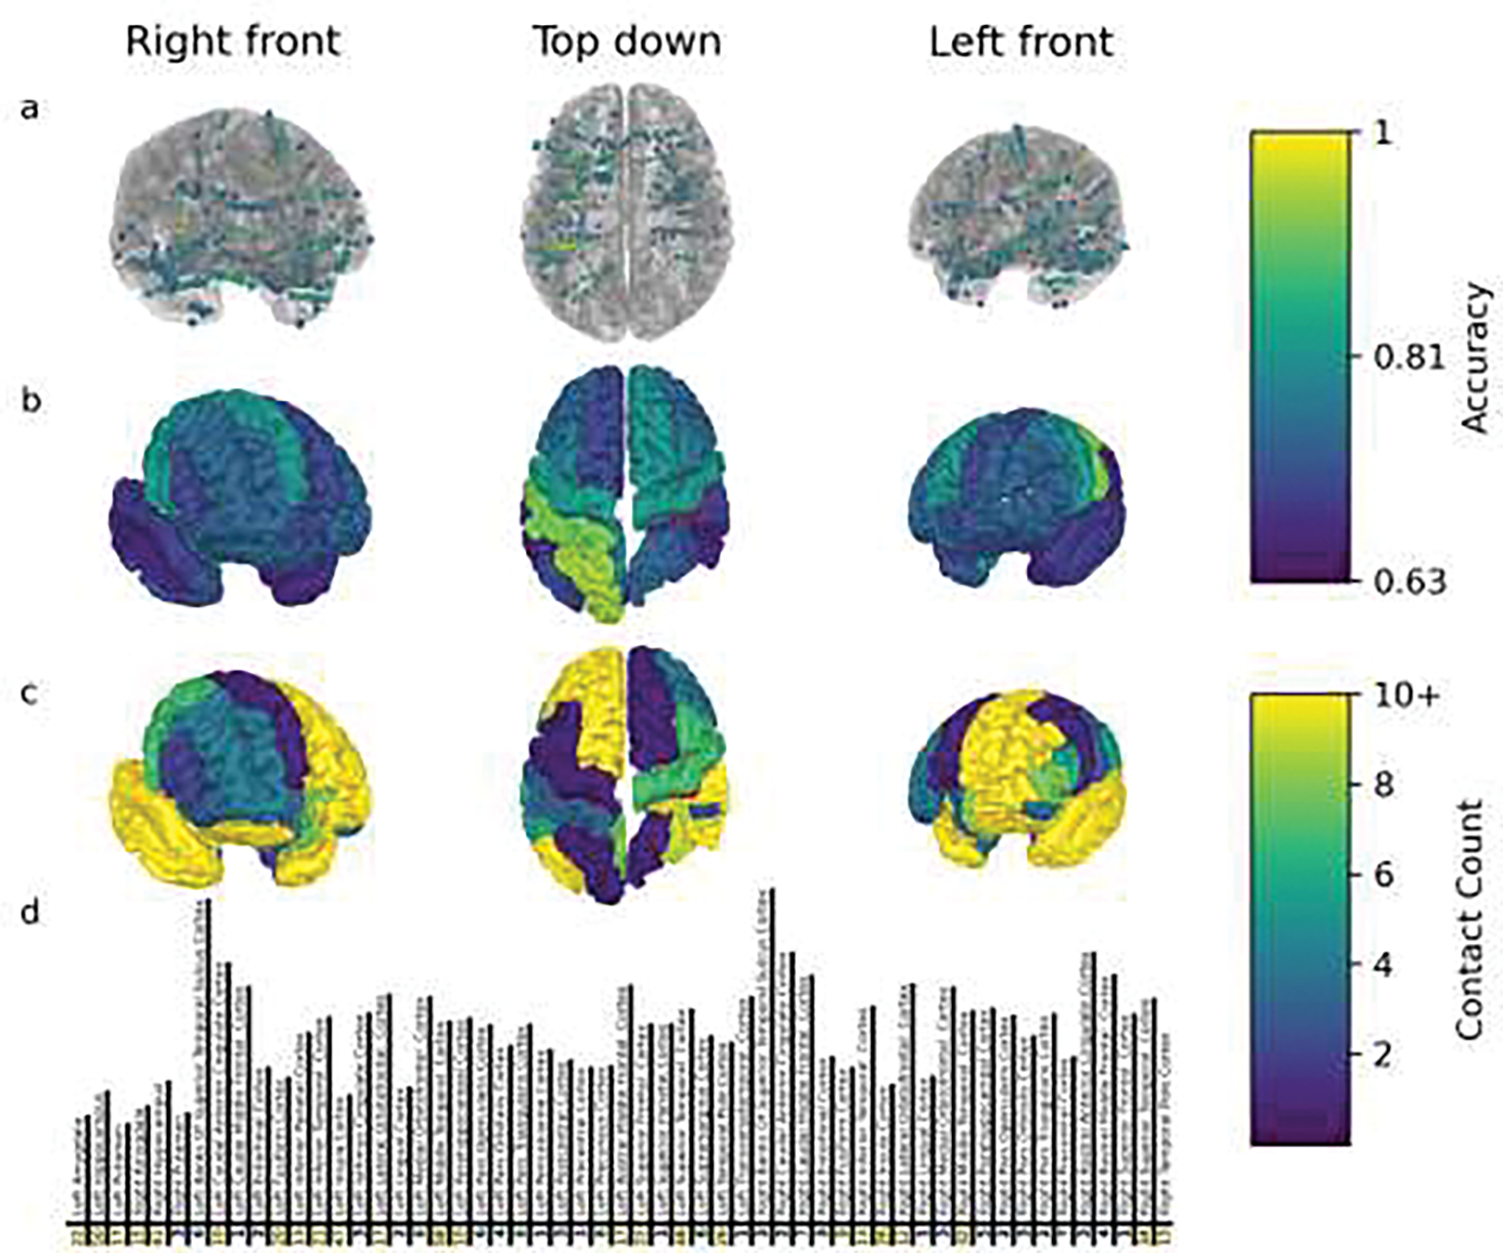
Electrode contacts which had spectrograms that were classified with accuracies significant at an alpha=0.01 level by the SVM are colored to indicate accuracy per contact (a) and averaged per region (b). The number of contacts implanted in each brain region across all patients for this study is shown in c and d, in tabular format. The highest accuracy was in sensorimotor regions followed by frontal areas with notably lower accuracy in temporal contacts. Regions without data are not shown. The central sulcus is drawn in red to aid in orienting the brain image.
Figure 5.
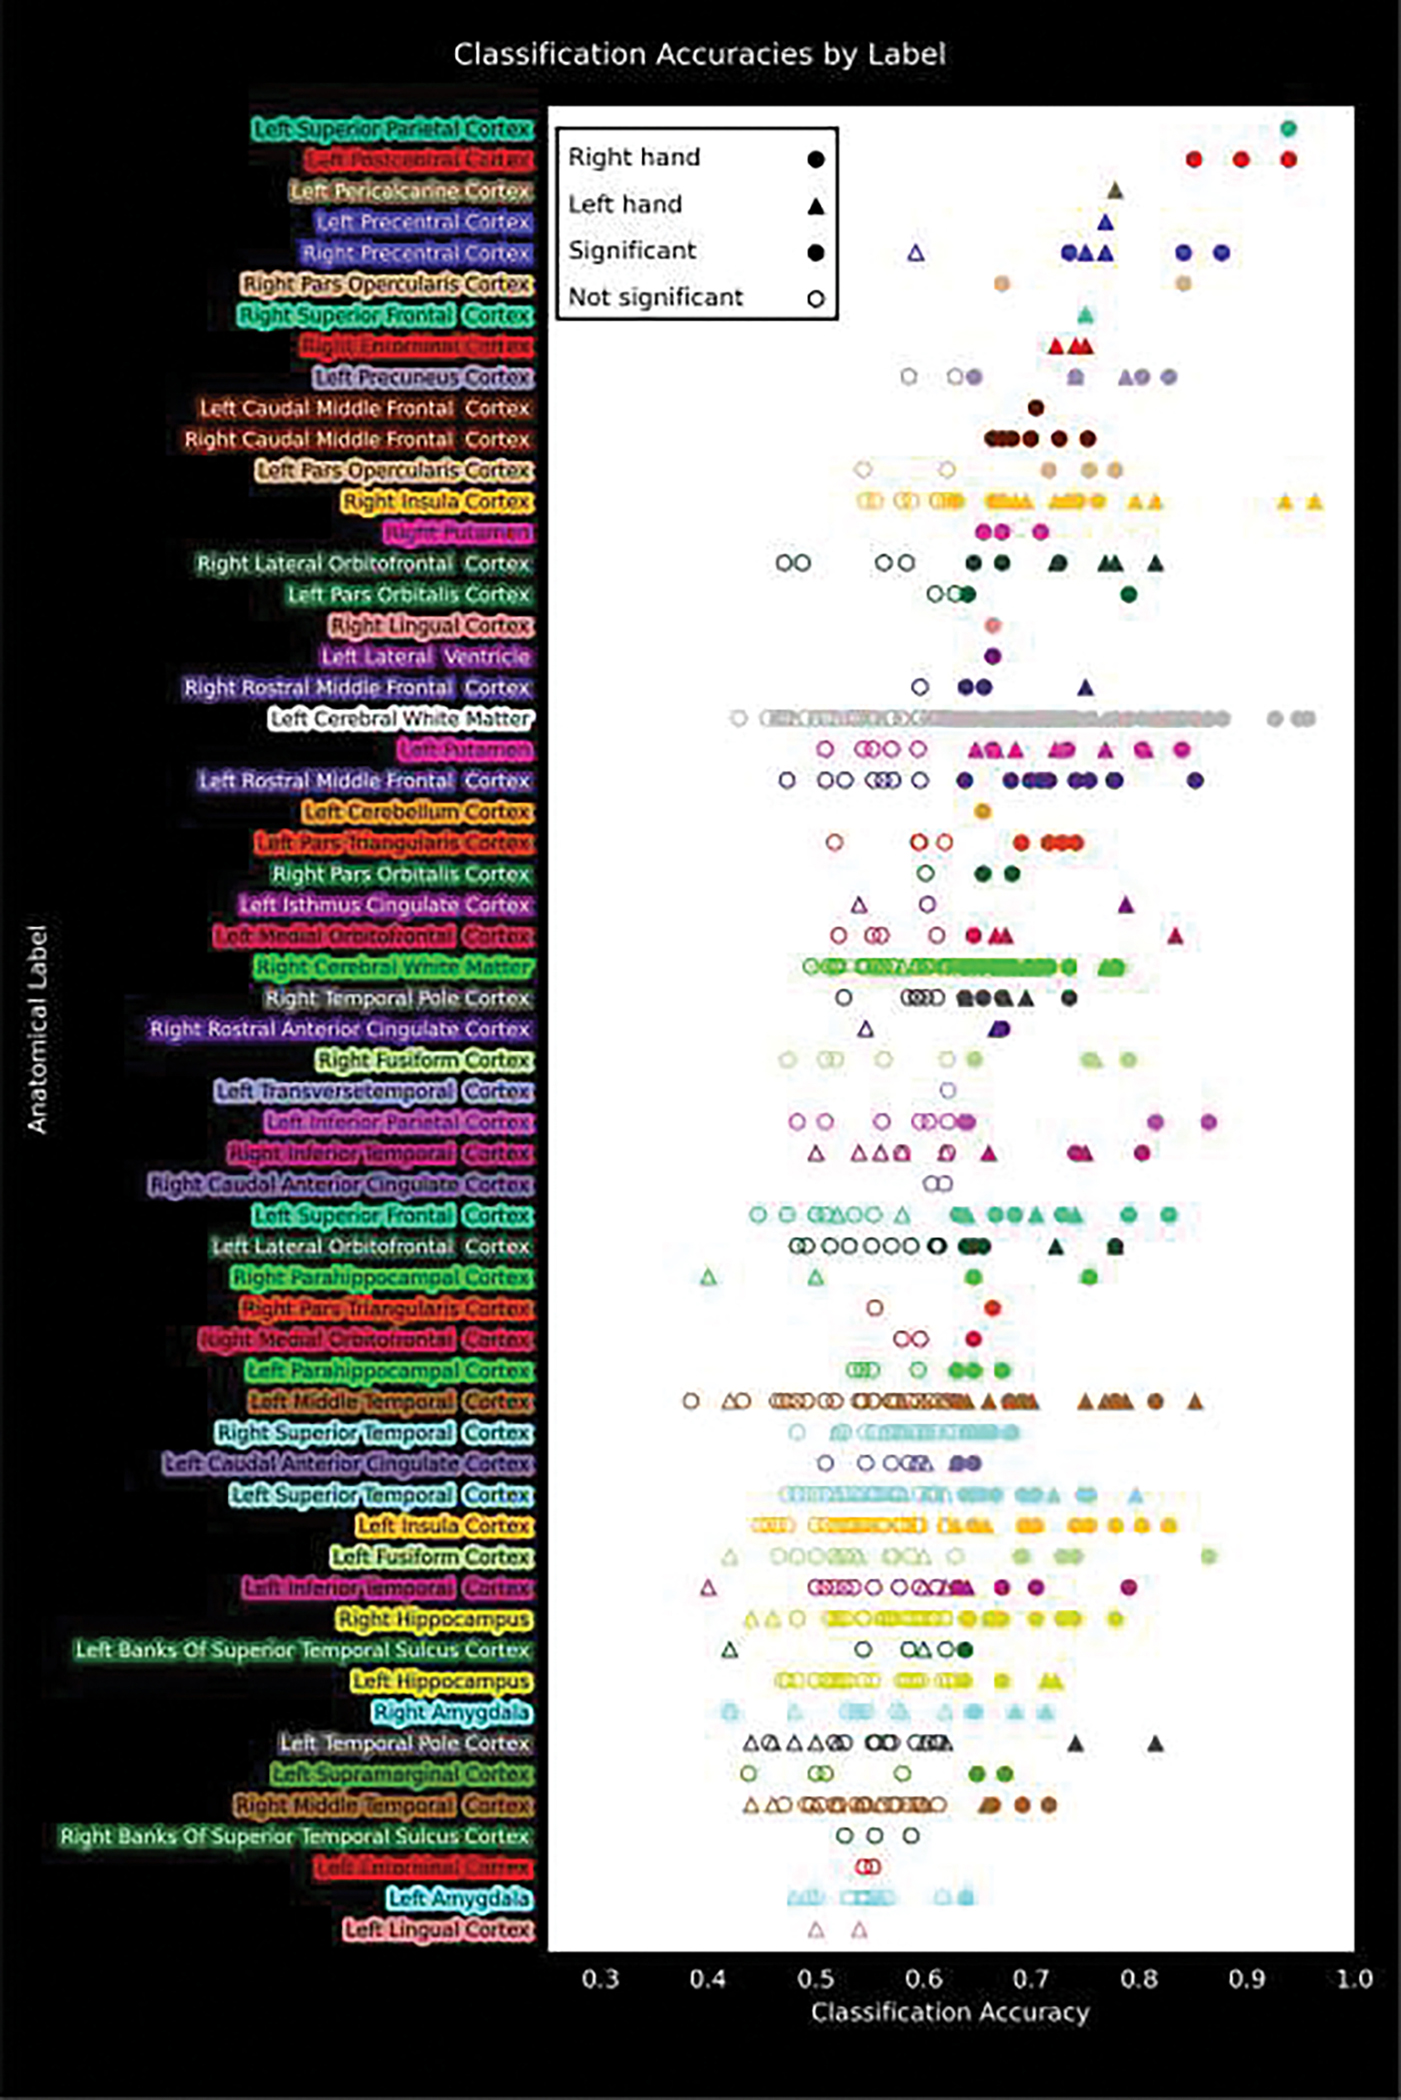
The classification accuracies of the SVM are shown for anatomical labels using the Desikan-Killiany atlas parcellation of the individual patient anatomy. Note that 48 contacts were unlabelled and are not shown. Some contacts were unlabelled because Freesurfer’s automated labeling process failed near lesions from previous epilepsy surgeries, contacts were above the pial surface (this happened when the deepest contact reached its target when the most superficial contact was still above the pial surface), or limited resolution of the MR and imperfect labeling process could not assign a label.
Support Vector Machine Classification Validation with Common Spatial Pattern Analysis
The CSP analysis showed that beta power was an important classification band in 5/8 patients (Figure 6). Additionally, four patients were classified by alpha power, with one patient’s classification depending exclusively on alpha power (Subject 10), suggesting this is also an important oscillatory pattern. Two patients (Subjects 11 and 12) were not able to be classified effectively using this method at all. Notably, the time-frequency features with above-chance classification accuracy in the CSP analysis, were nearly identical to the features from the SVM coefficient matrices and cluster permutation analysis (Figures 7 and 8). The CSP classification accuracies also corresponded well to those of the SVM; patients with worse CSP classification accuracy had fewer contacts that had significant classifications (r=0.966, p<0.001) for a linear regression between the CSP mean and mean contact accuracy per patient. Overall, the CSP and SVM classifications had concurrent results; the amount of movement-related brain activity implied by the accuracy of the classification was very similar for every patient, depending on their electrode implantation montage. This highlighted how widespread movement-related oscillations were observed to be, while, at the same time, suggesting such patterns were confined to specific neural circuitry that was not well-sampled in every patient.
Figure 6.
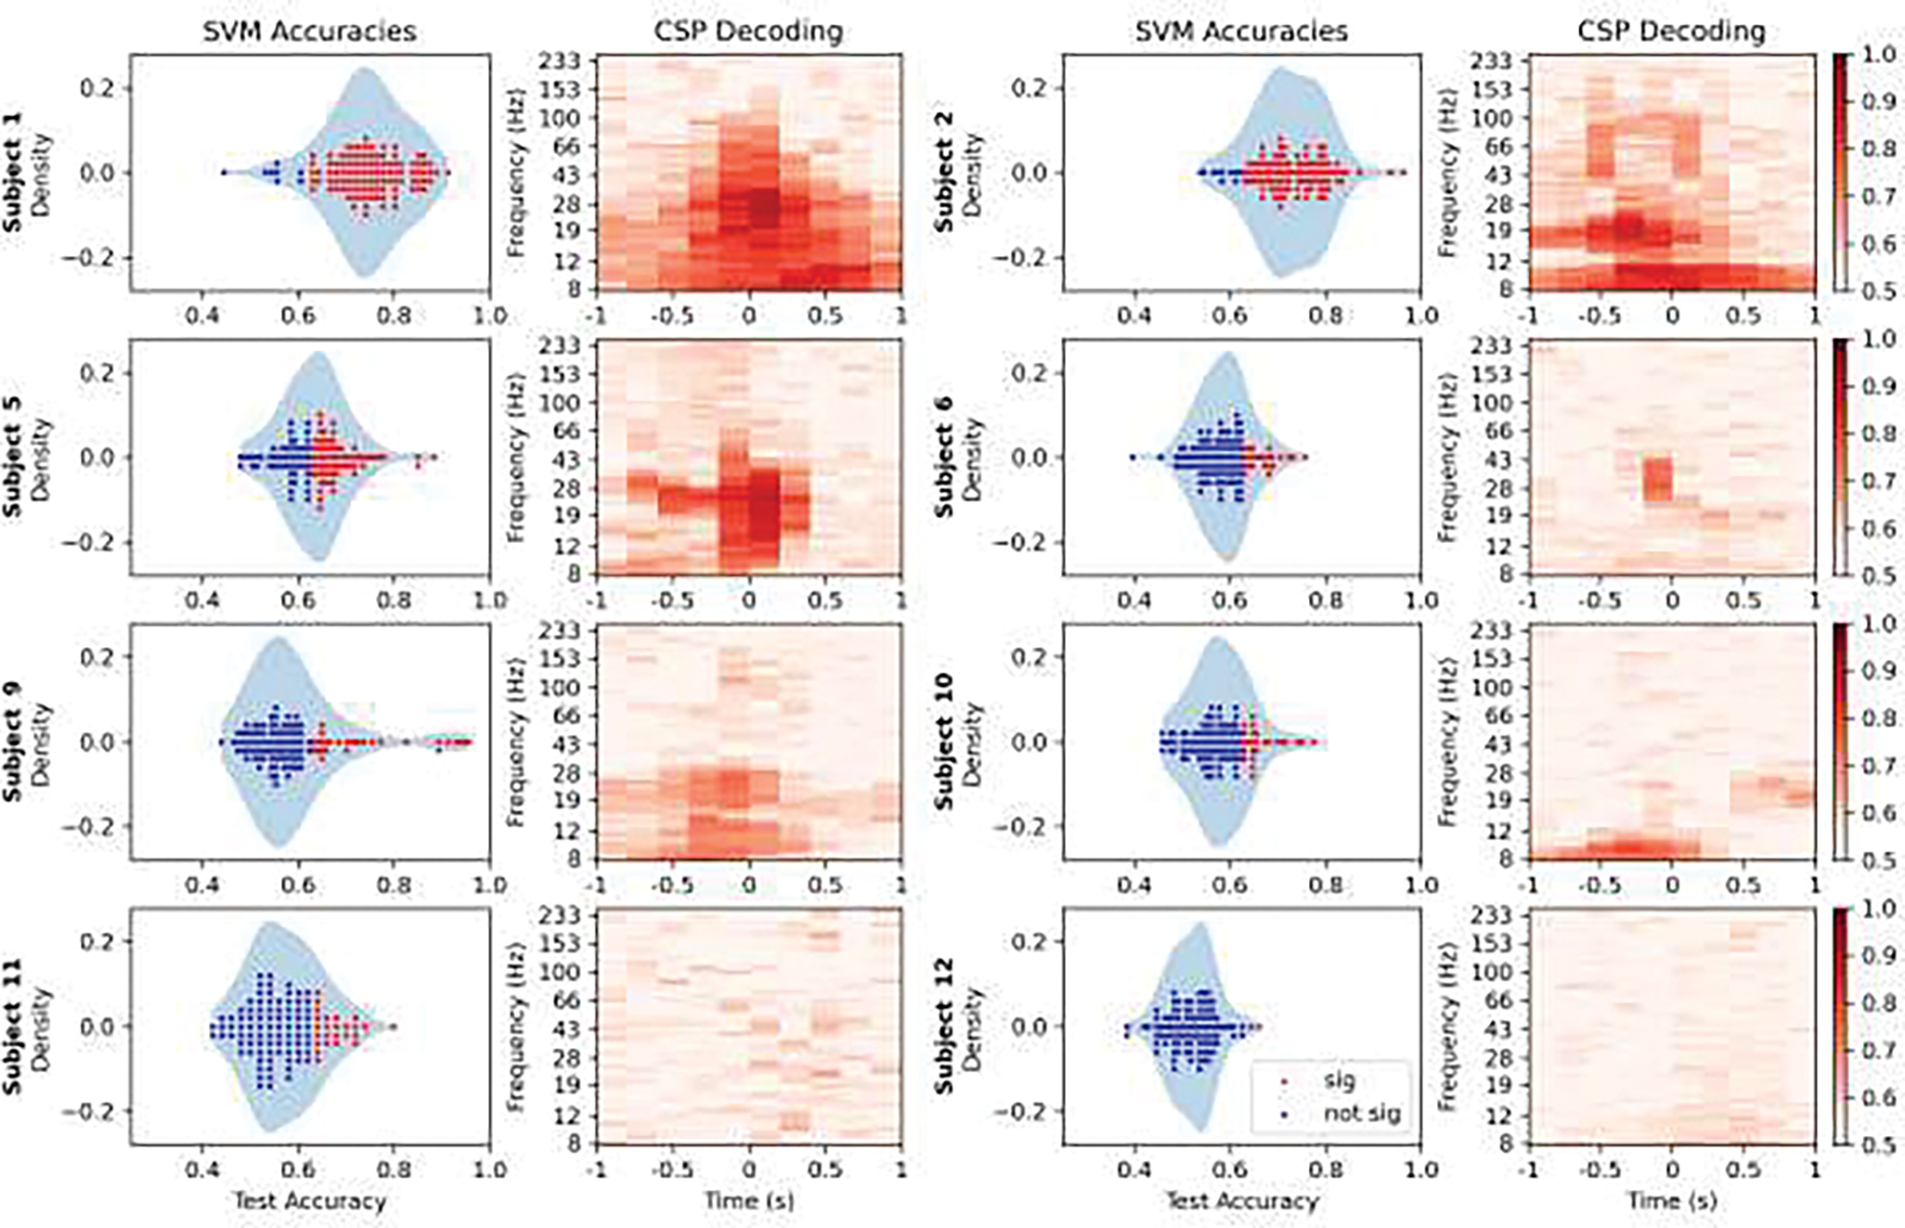
SVM and CSP classifier accuracies are shown on the left and right respectively of each pair of plots per patient. On the left, channels with significant (alpha=0.01) classifications relative to the null distribution for that patient are plotted in red, over a density plot of the distribution. On the right is the classification accuracy using the spatial pattern at each time-frequency bin. Note that patients with more significant classification channels (shown in red on the left) had greater CSP accuracies (darker red on the right). A linear regression between the mean scores for each was significant (r=0.966, p<0.001).
Figure 7.
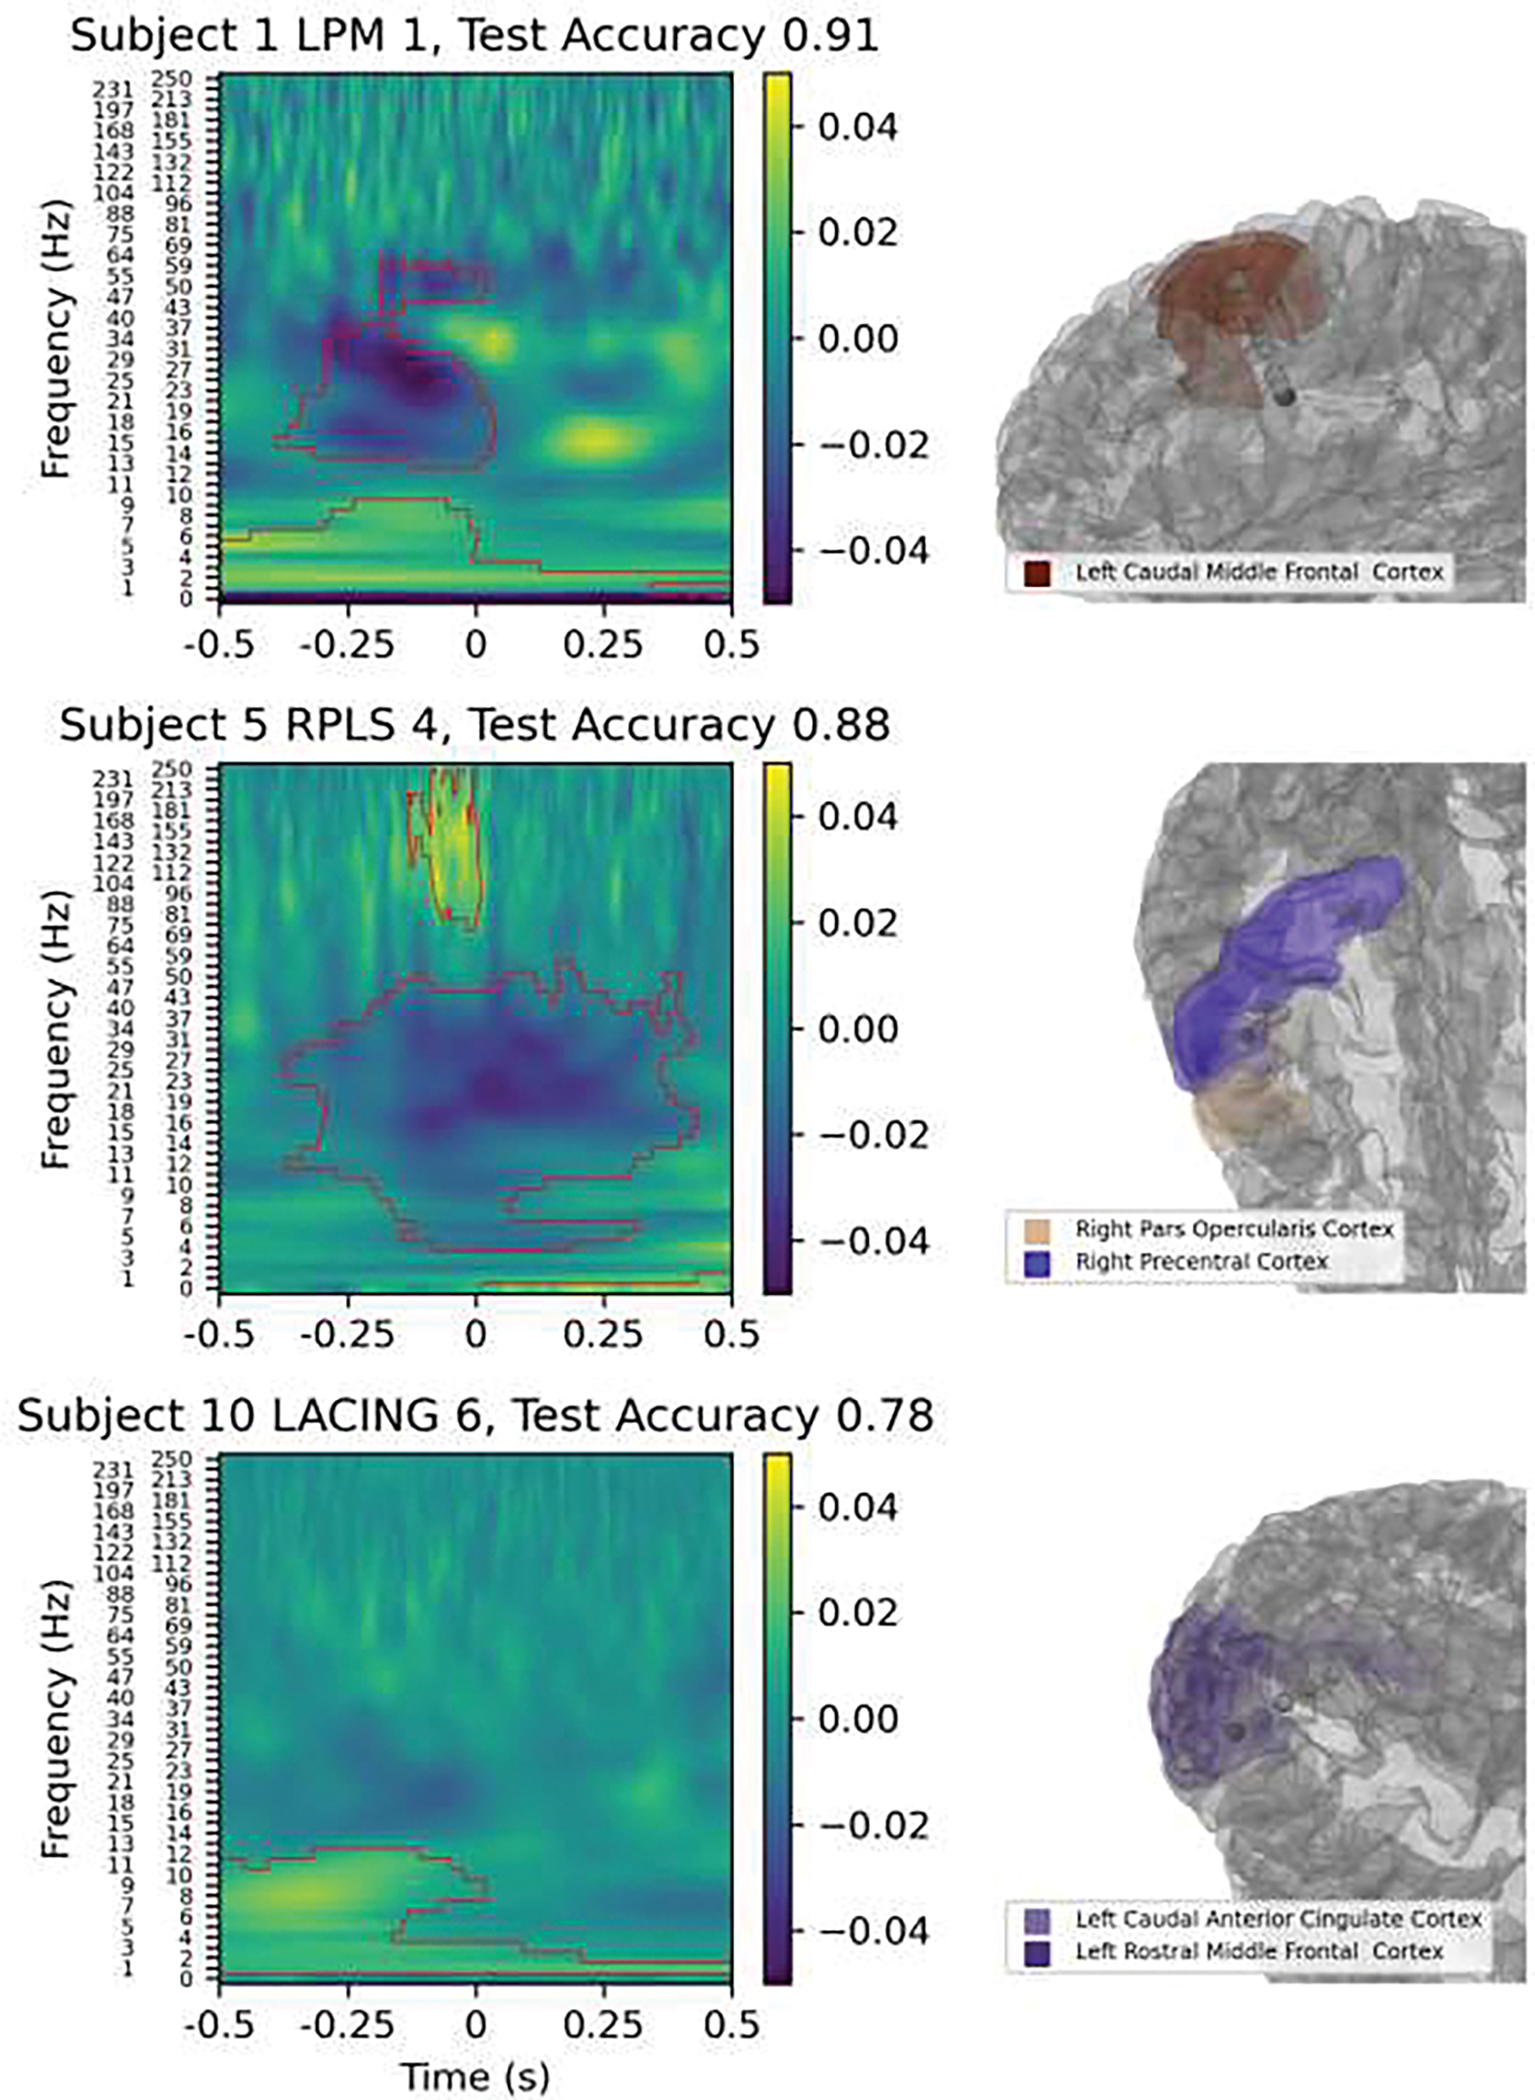
Electrode contacts with the highest classification accuracies: SVM coefficients from spectrogram classification are shown on the left with red contours from the cluster permutation analysis, and the anatomical location is on the right with the contact colored darker than the rest of the electrode. Note that LPM 1 is located in white matter and only gray matter structures are shown.
Figure 8.
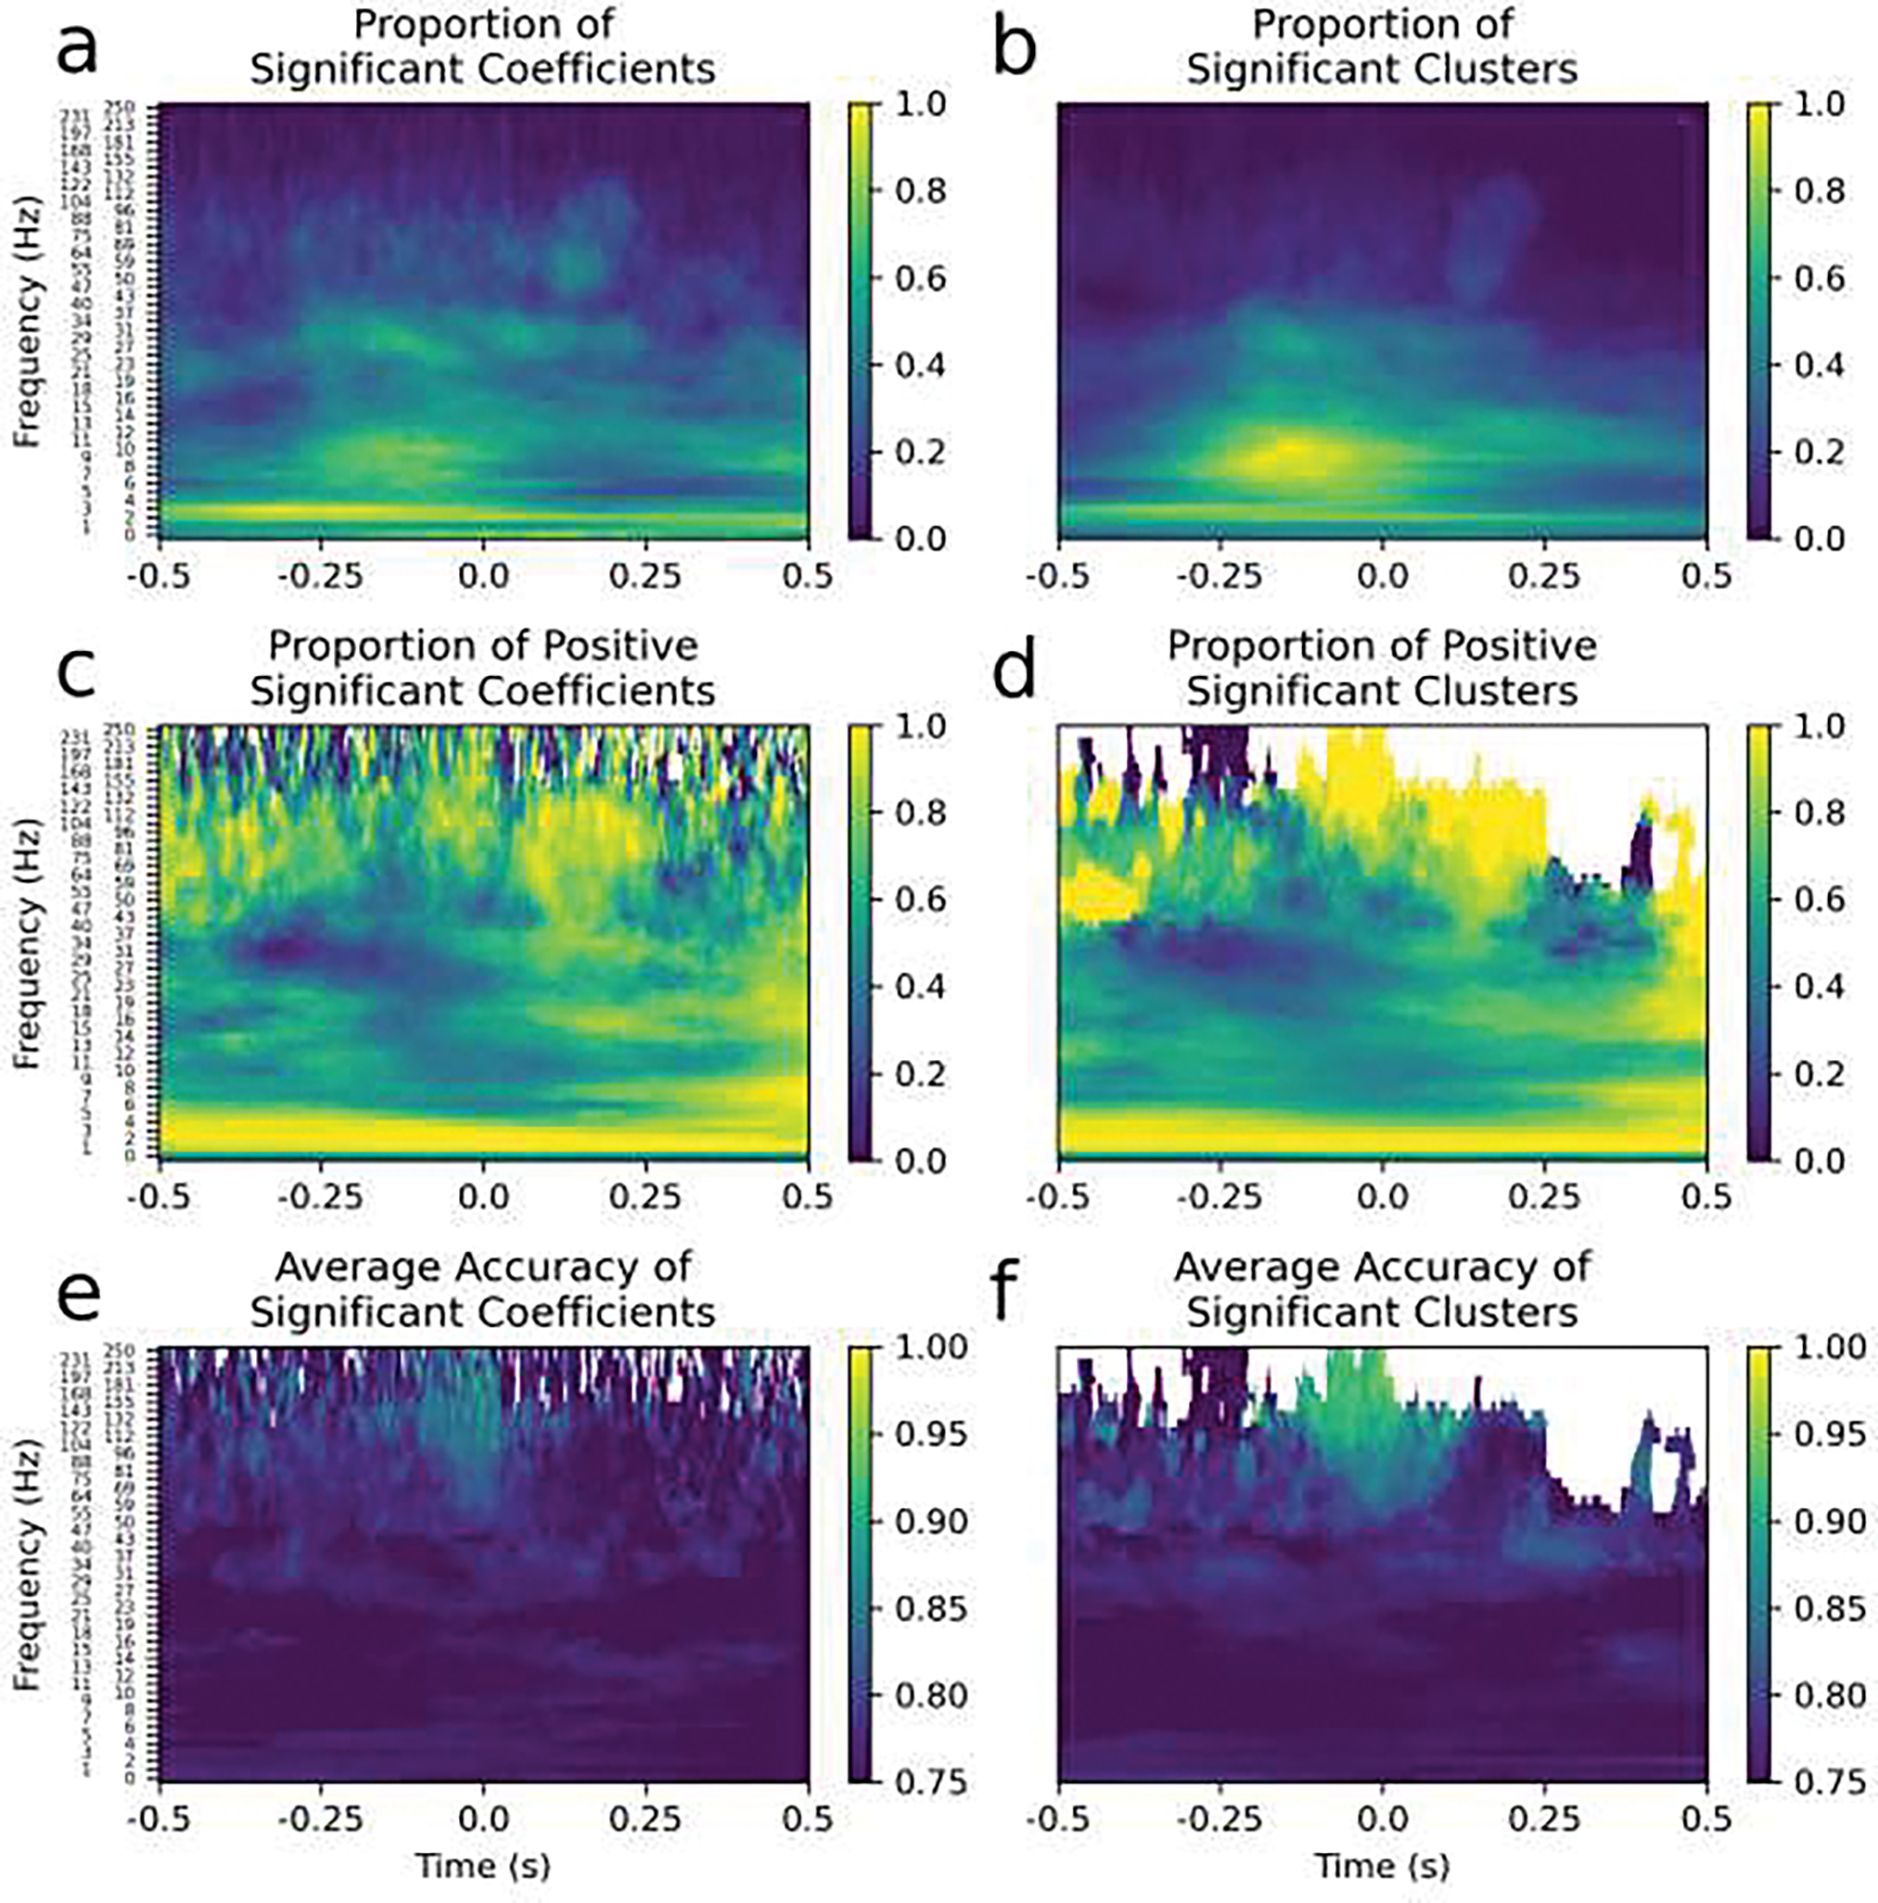
Summary feature maps of all the contacts with significant SVM classifications are shown. The SVM coefficient matrices (left column) corresponded nearly perfectly to the cluster permutation analysis (right column) that was performed independently for validation. Time-frequency points without any significant SVM coefficients or clusters are shown in white. In the left column are the SVM coefficients that are greater in absolute value than 99% of the null distribution of coefficients, and in the right column are the clusters that were significant at an alpha=0.01 level. a and b) The proportion of significant SVM coefficients (a) and clusters (b); more time-frequency points tended to be significant for pre-response alpha, post-response delta or evoked potentials. c and d) The proportion of each of the significant SVM coefficients (c) and clusters (d) that were positive; pre-response beta coefficients tended to be negative, post-response beta and gamma tended to be positive and all delta tended to be positive very strongly. Yellow indicates that more significant time-frequency coefficients or clusters increased during movement, blue indicates that more decreased during movement compared to the inter-trial period and green indicates that an equal amount increased and decreased significantly in different channels. e and f) The average classification accuracy for significant SVM coefficients (e) and clusters (f); beta and gamma oscillations tended to have higher classification accuracies.
Time-Frequency Dependencies of the Support Vector Machine Classifier
The SVM classification was used to determine which features of the spectrograms were important for classification to elucidate the mechanism of high-accuracy classifications. For each contact, the linear hyperplane optimized by the SVM was represented as a coefficient matrix that was used to evaluate the input spectrogram. The SVM classification worked by pointwise multiplying the coefficient matrix with the input spectrogram (represented in dimensionally reduced form by its PCA components), and if the sum is greater than zero the spectrogram was classified as being during movement. Thus, examining the coefficient matrix allowed us to explore which features of the spectrogram and the oscillatory patterns that they represented were related to high-accuracy classifications of movement. The coefficient matrices were assigned p-values for each time-frequency point using the distribution of coefficient matrices from the null classification with an alpha=0.01 (uncorrected) threshold.
Example SVM classifications for three contacts are shown in Figure 7 to highlight areas with above-chance classification accuracy and the differences between oscillatory patterns in different brain areas. The first contact, the deepest contact targeted to the left premotor region (LPM 1) for Subject 1, exhibited a typical pattern for primary motor areas; a pre-movement beta desynchronization with low-beta rebound (albeit non-significant) and a negative evoked potential relative to the average reference. This pattern had one of the highest test classification accuracies despite the contact being in white matter. This is consistent with previous results which showed that signals from contacts in white matter aid in classification but are lower amplitude (Li et al., 2021). The second contact, targeted to the right plane of a lesion (caused by focal cortical dysplasia; RPLS 4) of Subject 5, but outside of the lesion, was at the border of the right inferior precentral gyrus and pars opercularis and had a broader beta desynchronization both before and after the key press movement as well as an increase in gamma power just before the movement. The third contact, targeted to the left anterior cingulate (LACING 6) of Subject 10, had an increase in alpha power before the movement and an increase in delta power both before and after the movement. All of the oscillations in the classification coefficient images from these second two contacts have been observed in scalp EEG but precise anatomical localization in deep brain structures is lacking. The anatomical locations of different spectral features are explored in the subsequent analyses. Overall, contacts with above-chance classification accuracies relied on different spectral features to classify based on their anatomical location.
To interpret the coefficient matrices of the SVM classifications, and the information they convey about which oscillatory patterns were important for classification, several characteristics were computed and shown in Figure 8. The SVM coefficient matrices (Figure 8, left column) were compared with a cluster permutation analysis (Figure 8, right column) for validation; the significant time-frequency points were in almost exact correspondence between the two analyses. This was an important validation because the determining significant time-frequency points from the SVM coefficient matrices used an uncorrected significance level with multiple comparisons. For the first row, the proportion of significant time-frequency points was computed to determine which spectral features (i.e. time-frequency points) were the most widespread among the brain areas sampled in this study for contacts with significant classifications (Figure 8a and 8b). This shows prominent delta, alpha, and beta oscillations, an observation concordant with previous studies. This suggests that these spectral features are likely the most prominently used in movement neural circuits. Importantly, a and b show which frequency ranges are strongly modulated, but are agnostic as to the direction of modulation. To visualize the direction of movement-related modulation (relative to the inter-trial period) the proportion of positive significant coefficients (Figure 8c and 8d) was computed. Time-frequency points that consistently had decreased power in movement spectrograms compared to baseline spectrograms are closer to zero and shown in blue, whereas increased power is shown in yellow. Beta desynchronization, beta rebound and gamma power increase all had a consistent directionality. Lastly, for each time-frequency point, the average accuracy was computed for all classifications that had both a significant classification accuracy, relative to the null distribution of classification accuracies, and, in e, a significant coefficient for that time-frequency point, relative to the SVM coefficients of all the null classifiers at that particular time-frequency point, or, in f, were in a significant cluster (Figure 8e and 8f). Beta power around the time of movement as well as gamma power before and during movement, were observed in the contacts that were able to be classified with the greatest accuracies. These results are consistent with beta frequency oscillations being strongly linked to movement and movement disorders. They also suggest that gamma power is strongly associated with movement, although in fewer locations, as shown in Figure 8a and 8b. Interestingly, pre-movement alpha power was the only spectral feature which did not show a consistent directionality; alpha power increased in about as many brain areas as it decreased. Interestingly, alpha modulations were also observed in the greatest number of contacts (Figure 8a and 8b), but had lower-accuracy average classification potential than beta and gamma (Figure 8e and 8f). This evidence supports the conclusion that alpha oscillations are more ubiquitous than beta and gamma oscillations and are probably less directly related to movement; instead they may be primarily involved in movement-related cognition such as decision making or visual processing. Overall, the patterns observed in sEEG contacts recapitulated findings of previous literature using scalp EEG and ECoG but provided different information about the anatomical extent of these oscillations because sEEG sampled brain regions that are inaccessible with scalp EEG and ECoG.
Movement-Related Brain Areas using the same Oscillation that may be Networked
To analyze the anatomical locations of oscillatory patterns, important spectral features were selected qualitatively by inspection based on the feature maps in Figure 8. The time-frequency patterns of interest were chosen based on having a large proportion of significant clusters/coefficients or a consistent direction (most areas had both). The features chosen were the event-related potential, a movement delta increase before the movement but extending to slightly after, a beta decrease immediately before movement, both a high- and low-beta increase after movement and a gamma increase immediately after movement. These band-based categories are highlighted by a red box surrounding the time-frequency area of a relevant feature map in the first column Figure 9. The second column shows the distribution of significant time-frequency points relative to the area of the red box, where −1 represents when all points within the box are significant and decrease during movement and 1 represents when all points are significant and increase during movement. The histogram was divided into tertiles with the negative tertile in blue and the positive tertile in yellow. The contacts corresponding to classifications that used these features are plotted in the final three columns to show their position on the template brain. In addition, the oscillatory patterns of interest are shown in a different format in Figure 10; anatomical labels from the Desikan-Killiany atlas for the individual patient are used to highlight brain structures related to each oscillatory feature. The distributions of anatomical locations for contacts with significant classifications were unique for each oscillatory pattern.
Figure 9.
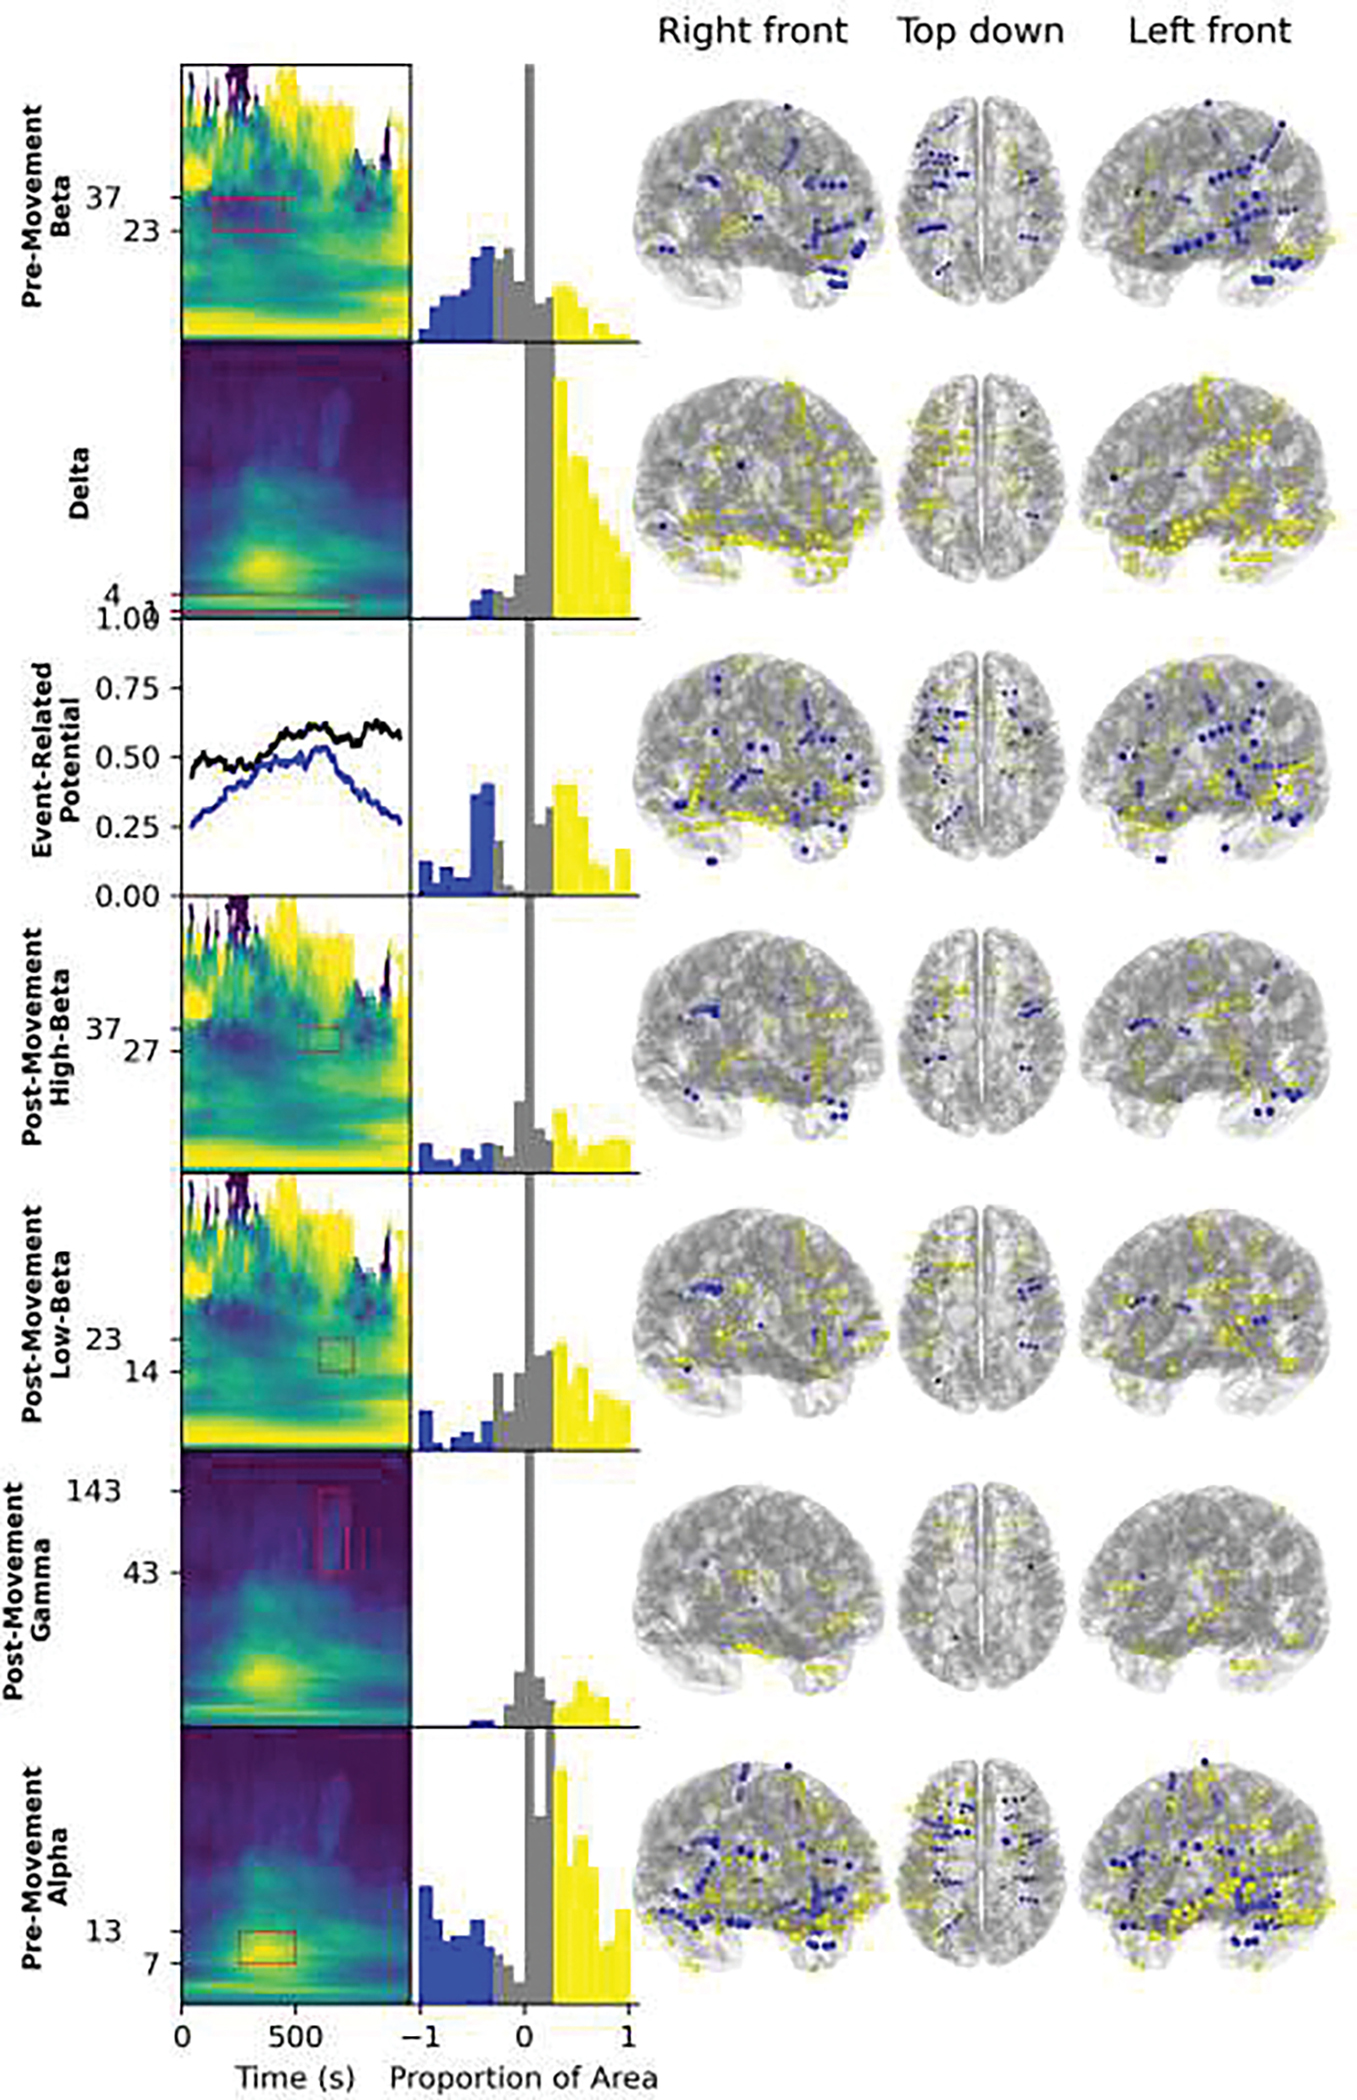
Anatomical locations of spectral features are shown on the template brain. In the first column, the time-frequency period in consideration is surrounded by a red box over a cluster permutation analysis feature map (Figure 8), except for the event-related potential for which both the proportion of significant clusters (blue) and the proportion of positive significant clusters (black) are shown in a time plot for ease of visualization. The choice of which time-frequency areas to consider was made based on the proportion of significant time-frequency points feature map and the proportion of positive clusters feature map, but only the feature map that shows the pattern more clearly is shown. The second column has histograms of the proportion of the selected area in a significant cluster for each contact, with −1 being all points in a significant negative cluster and +1 being all points in a significant positive cluster. The negative tertile is colored blue and the positive tertile is colored yellow. Note that the vast majority of contacts are near zero so the y-axis is truncated to show the rest of the distribution. The final three columns show the anatomical locations of contacts with each feature (i.e. in the negative and positive tertiles), warped to a template brain.
Figure 10.
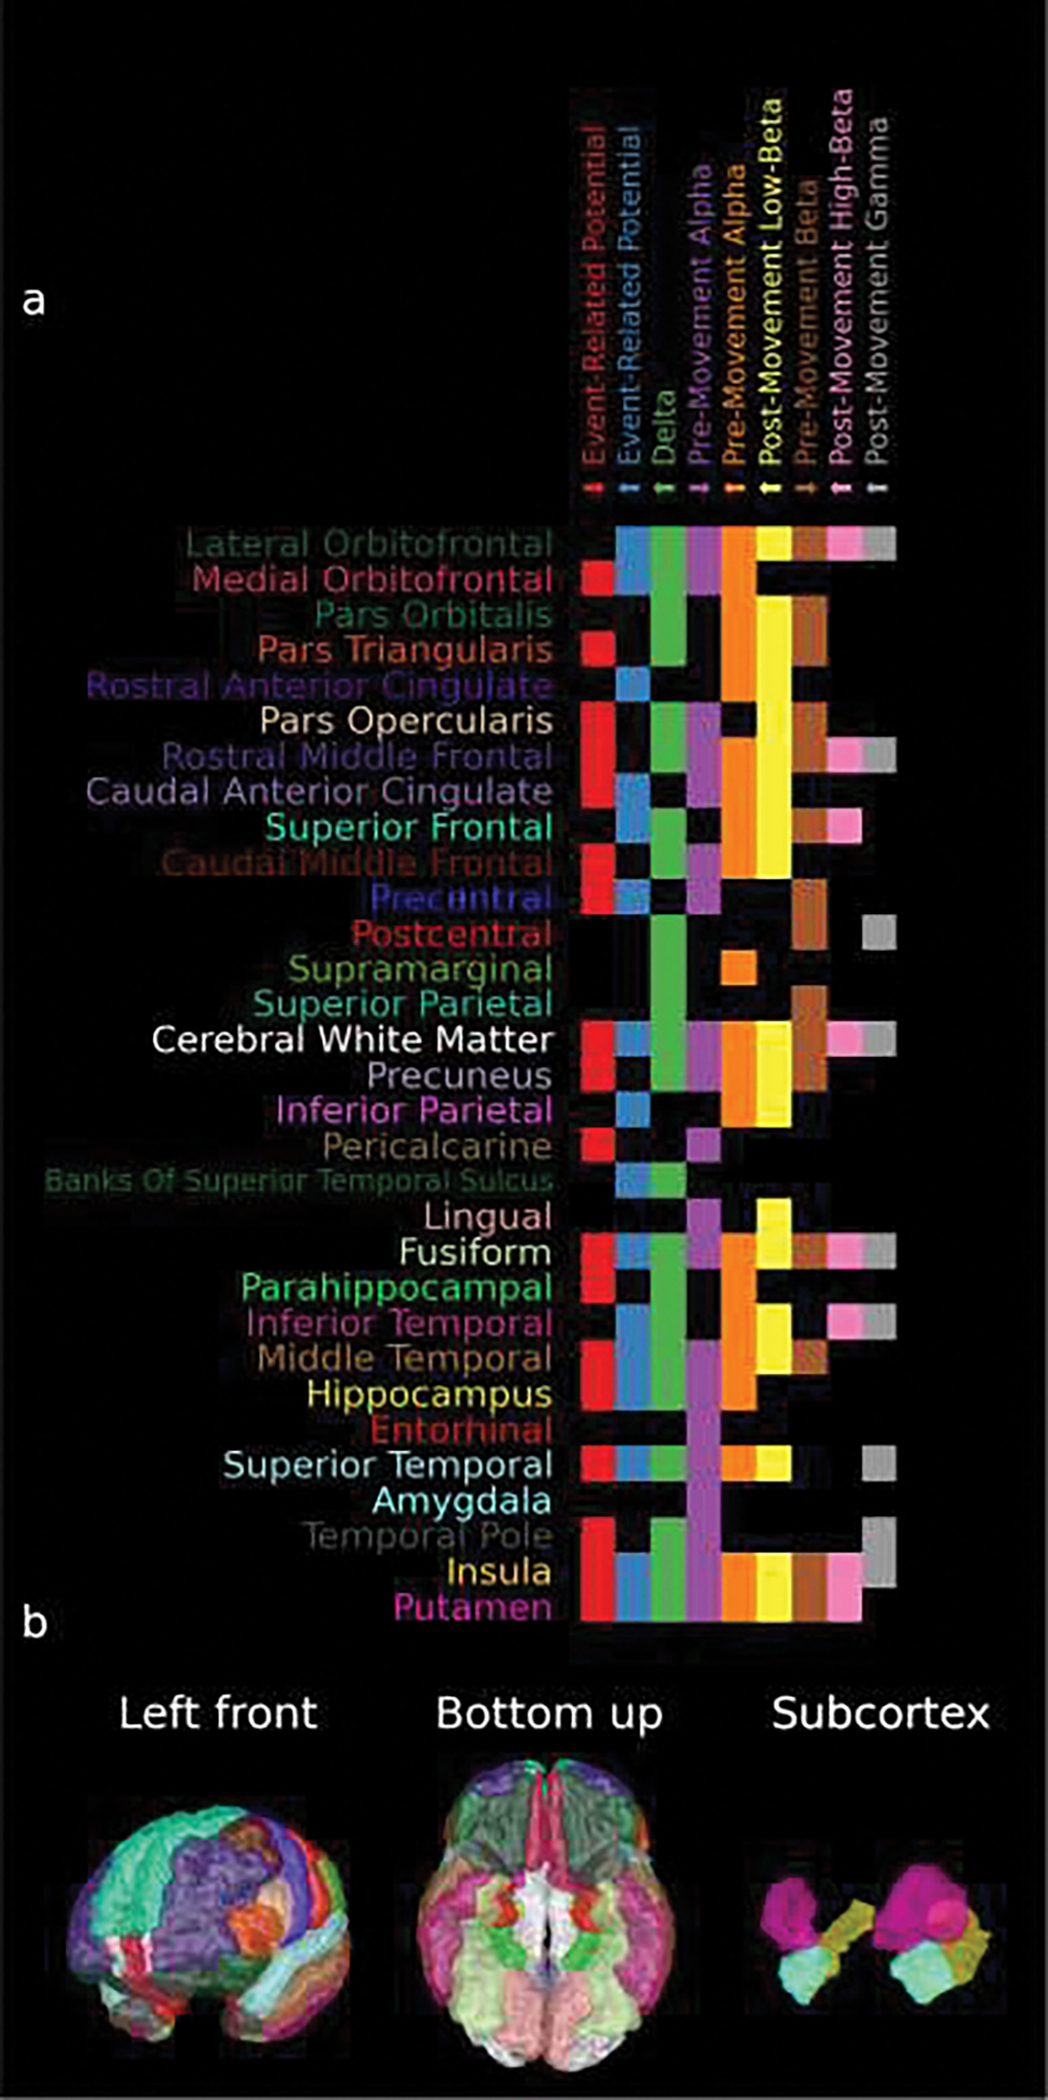
a) The Deskian-Killiany atlas labels, based on the individual patient’s brain anatomy, with significant-accuracy SVM classifications that used that oscillatory pattern as determined in Figure 9. Note that up arrows preceding the feature name indicate that that feature increased during movement period and down arrows indicate the opposite. b) The locations of the labels used in (a) on the template atlas with the colors matching the colors of the names of the brain regions of interest on the y-axis of (a). Note that the atlas labels are sorted clockwise by their angle in the sagittal plane, starting with frontal areas and wrapping around to temporal areas.
Discussion
Interpretation of Movement-Related Oscillatory Patterns
By using an SVM to classify sEEG data around the time of a movement from rest, we were able to leverage the power of machine learning while maintaining information about what contributed most to classification. We found that many electrode contacts had high-accuracy movement-related classifications throughout the brain; not all patients had contacts implanted in sensorimotor areas but nearly half of all contacts (41.5%) had classifications unlikely to be observed by chance. The contacts with above-chance accuracy are putatively in areas of distributed motor networks, or at least part of networks that were heavily recruited during a simple motor task. The locations of these contacts replicate and extend previous results in ECoG and EEG; beta desynchronization was observed in sensorimotor areas and the inferior frontal gyrus (Swann et al., 2009) but also extended to more superior frontal areas than previously described. Higher-frequency (>70 Hz) broadband gamma power, which has also been associated with a greater balance of excitation compared to inhibition, was observed to have a different distribution with greater frontal and less temporal activation. Broadband gamma has been correlated with population level neuronal spiking, and tends to be biased towards recording large excitatory neurons (Manning et al., 2009). Thus, this change in power likely reflects local changes in firing rates. The timing of gamma compared to the event-related potentials and their observed distributions suggest different roles of these features in motor networks, and that they are able to measure excitatory neurons differently, perhaps with event-related potentials being more related to phase resetting (Sauseng et al., 2007). Beta-gamma phase-amplitude coupling (PAC) has been observed to be abnormally elevated in Parkinson’s disease (de Hemptinne et al., 2015) so understanding the full spatial extent of the beta oscillations that are aberrantly coupled to gamma could inform the development of medical interventions that manipulate this neural circuit. Alpha power modulations were observed in prefrontal, sensorimotor, and mid-temporal regions, as were previously reported, but extended to subcortical and parietal areas that have not been linked with alpha. The areas that have not been associated with alpha rhythms may help link the many functional correlates of the alpha/mu oscillation (Pineda, 2005). The positive and negative event-related potentials were widely distributed in frontal, parietal and superior temporal areas. Somatosensory-related potentials have been successfully modeled by increases in excitatory output from the granular layer of somatosensory cortex (Jones et al., 2007). Lastly, the increase in delta power in almost all recorded brain areas during the peri-movement period may be related to an increase in concentration during the task (Harmony, 2013). In general, the relative timing of increases and decreases in oscillatory power relative to movement provides insight into how oscillations might travel between brain regions and consequently how information might flow.
Our results also quantify the amount of movement specialization in anatomically distinct human brain structures. We observed a normal distribution of classification accuracies across sEEG contacts rather than a bimodal distribution; this implies that the brain structures in which the contacts were implanted exist on a spectrum of movement-relatedness and so cannot be well-categorized as either movement-related or non-movement related. For contacts with different above-chance classification accuracies, these differences are not likely to be attributable to differences in environmental noise in the setup since that should be relatively similar for contacts in the same recording, nor the performance of the classifier since the same classifier was used and so likely learned each classification at a similar rate. Previous work has shown that, at a cellular level, stable sequences of activity are observed during simple motor tasks (Recanatesi et al., 2022) so it seems unlikely that different patterns of motor network activation occurred on each trial. Thus, the more likely explanation is that there were different amounts of movement-related signal relative to movement-unrelated signal in different brain areas based on the proportion of the population of neurons with activity modulated by movement recorded by that contact. In that case, the non-movement related neurons sampled by a contact could have been more active on some trials, overwhelming the signal of movement-related neurons and causing the classifier to fail on those trials. Thus, this study provides evidence that movement neural circuitry is distributed such that there is a continuum from relatively homogenous sensorimotor-dominated areas, like primary motor cortex, to areas where only a minority of neurons are modulated by movement. However, the distribution of classification accuracies was skewed positively, meaning that there are areas, which were able to be classified with very high accuracy, where there is relatively little non-movement-related neural signal that would cause classifications to fail. Thus, these areas indicate that movement neural circuitry is likely not evenly distributed throughout the brain, rather that some brain areas are specialized to control movement-related behaviors.
Lastly, this analysis was aligned to the keypress movement so, since patients had different response times on every trial, movement-unrelated neural activity evoked by the task (e.g. visual processing of the cue) would have been out-of-phase. Consequently, the oscillatory patterns important for classification were likely to be biased towards movement. Figure 11 shows that the spectral features important for classifying sEEG data time-locked to the go cue were more temporally smeared than for response-locked data (e.g. pre-movement beta). The time-course of the spectral features was therefore consistent with occurring just before and locked to responses. Since the spectral features for the response-locked sEEG data were immediately proceeding, during, and after the response and well localized in time, the most parsimonious explanation is that they are primarily related to movement, especially for such a simple task. However, other processes undoubtedly contribute and, as is typical in psychomotor tasks, the interpretation of the results is likely confounded to some extent by higher-order cognitive processes.
Figure 11.
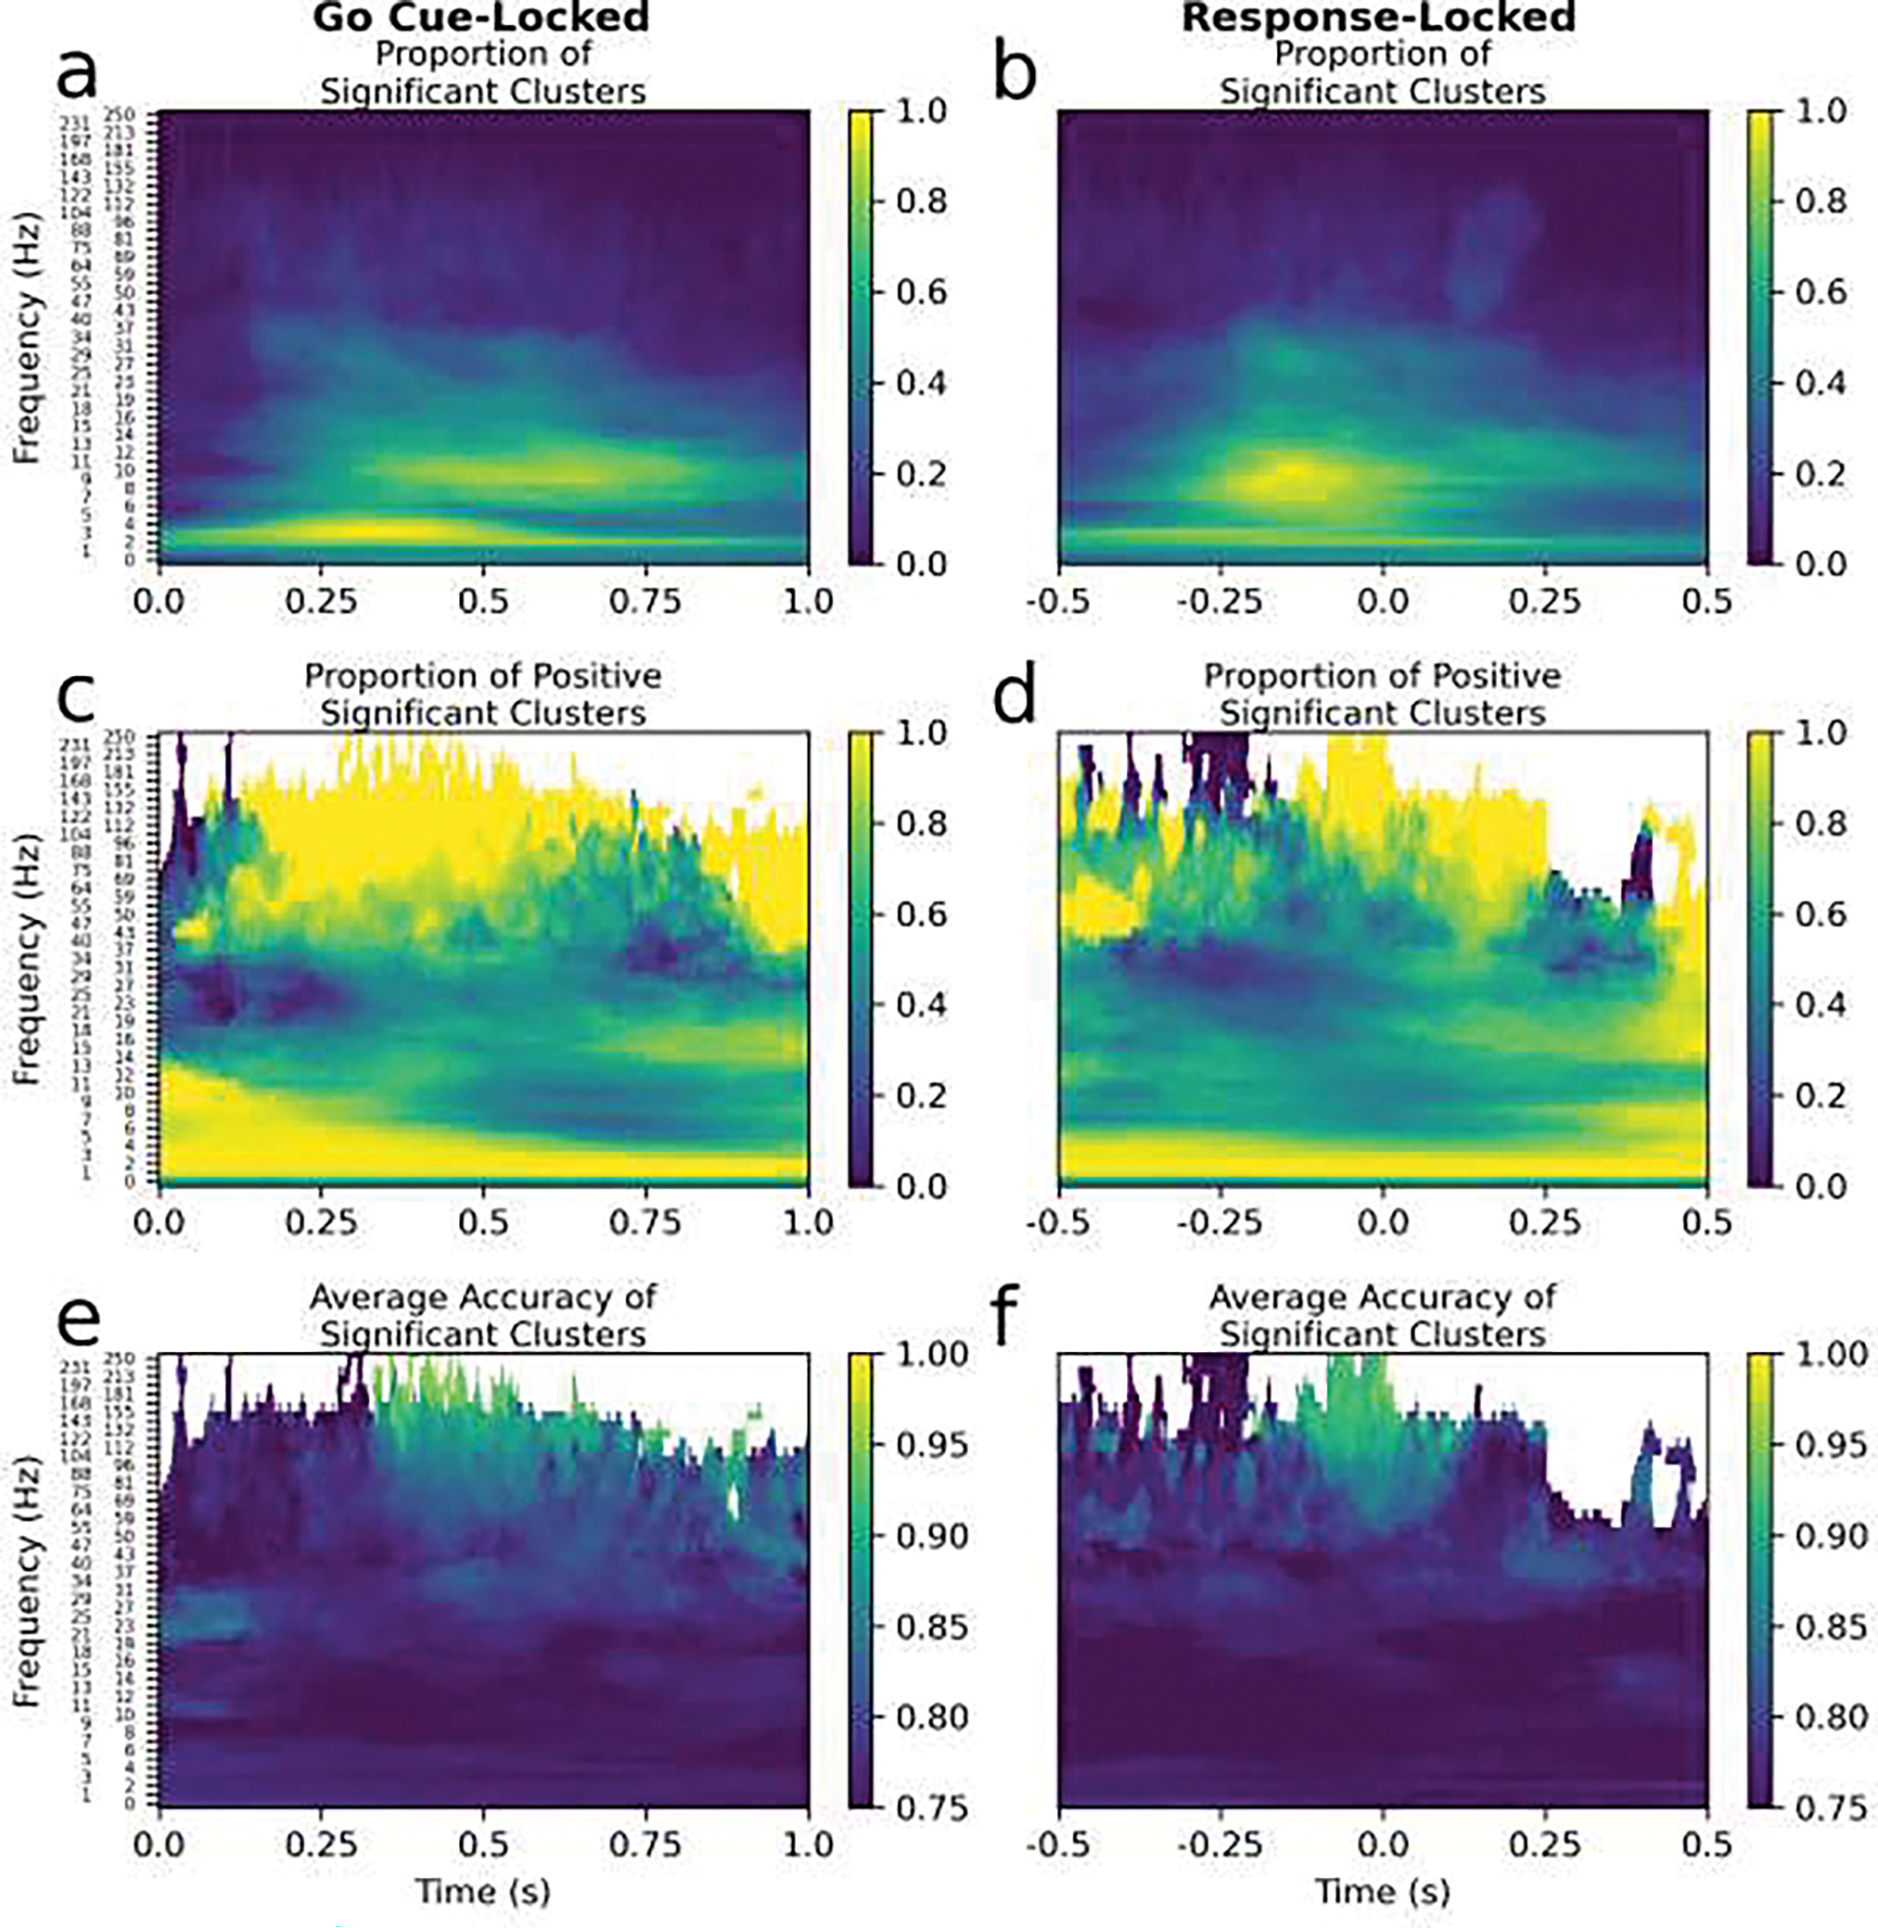
Cluster permutation results are shown for spectrogram data time-locked to the go cue (left column) and time-locked to the response (right column). These cluster permutation results were similar but the time-frequencies that were important to the classification for a greater number of contacts had greater spread in time for the go cue (a) compared to the response (b). as evidenced by the yellow areas in (a) being elongated in the time dimension compared to those in (b). This suggests that these signatures are more response-related than related to a cognitive process evoked by the go signal. Note the go cue is the presentation of the right or left arrow and the response-locked data was analyzed previously and is reproduced from Figure 8 (right column).
Considerations of sEEG Classification using a Support Vector Machine
With only eight patients, we were able to replicate some of the most widely-reported oscillatory patterns from ECoG and scalp EEG, which is indicative of the extensive research potential of sEEG, but, at the same time, our conclusions are based on sparse and idiosyncratic brain coverage depending on clinical needs for diagnosing epileptogenic zones. Stereo-EEG samples both deeper cortical structures than ECoG as well as including subcortical brain regions. It also can also record from white matter, and from gray matter without interference from pia and arachnoid mater, which can reduce ECoG signal amplitude relative to sEEG (Avanzini et al., 2016). However, sEEG samples a large range of brain networks that perform many different functions, compared to relatively contiguous sampling of gyral surfaces by ECoG. This information must be combined across patients, which we did by comparing contact-level results rather than comparing at patient-level as has been done in previous studies (Breault et al., 2019) since comparisons across patients are confounded by each patient having a different sEEG montage. One potential issue of this approach is that each contact must have a reference and so depends on other recordings of electrical potential from the patient. We used an average reference which allowed us to study the activity at an individual channel (compared to a bipolar referencing scheme where activity is localized between two contacts) but the recording from each contact was therefore dependent on the other contacts in the sEEG recording montage which were unique to every patient. However, with over 100 channels per montage, the average reference is likely to be stable and reproducible given a similar sized montage. All of the patients in this study had similar power spectral density of their sEEG data, which supports this claim, as does a previous study on referencing schemes which shows that the average reference is comparable to low-variance reference scheme (Uher et al., 2020). One potential issue with an average reference is the introduction of an event-related potential from the average reference. When this analysis was rerun with a bipolar referencing scheme, a similar number of contacts had significant classifications relative to the null distribution, which is evidence that this is not the case. Overall, sEEG is a promising avenue of inquiry for studying whole-brain oscillatory patterns so long as its unique limitations are considered and addressed.
We chose to account for the challenges of analyzing sEEG data by validating a machine learning approach with frequentist statistics. We classified sEEG spectrograms during movement with an SVM because of its interpretability; the SVM coefficients allowed us to determine which oscillations are related to movement and whether they increase or decrease in power. This came at the cost of classification accuracy; a more complex algorithm could have fit the data better. Future work may use more powerful machine learning approaches which will likely achieve better accuracies but may be less interpretable. Another issue with the SVM approach is that testing each frequency of oscillation at each time point of the epoch surrounding the movement to see if it differs from baseline suffers from multiple comparisons. We addressed this using cluster permutations which was ideal for comparison because it has been validated by simulations and is widely used in electrophysiology research (Maris & Oostenveld, 2007; Pernet et al., 2015). Cluster permutation testing on its own, however, cannot account for the more complex, subthreshold effects that are accessible to an SVM classifier and machine learning approaches in general. Additionally, since both the cluster permutation analysis and the PCA SVM analysis are stochastic, with randomness introduced during the permutations and the fitting of both principal components and the SVM respectively, convergent results provide evidence that results are robust and reproducible. A third issue with using an SVM is overfitting which can cause failures in replication. This was accounted for by using a test-training split; the classifier learned on separate data than was used to quantify its accuracy, allowing more complex patterns to be determined based on the training data while still being repeatable. The rationale here is that, if the classifier depends on idiosyncrasies in training data, it will not perform well on the testing data. Thus, results from classifiers that perform well on unseen data are likely to be generalizable to similar data. Finally, the PCA SVM analysis provides a classification whereas the cluster permutation analysis does not. Thus, depending on the goal, one may be preferable over the other. In summary, using an SVM allowed us to determine which oscillatory patterns related to movement in a way that is interpretable, and we validated this analysis with the commonly-used CSP and cluster permutation methods to ensure reproducibility.
Limitations
Our study had a relatively small sample size of eight patients. The sample is a unique patient population for which a sample of eight is not atypical. Nevertheless, the small number of patients and consequent limited spatial coverage is a major limitation of sEEG and this study in particular. Additionally, the extent of neural reorganization due to processes compensating for epileptic brain tissue or previous neurosurgical resection is not well known. The patients were able to perform this behavioral task relatively well and do not have major motor deficits. This may reflect a lack of significant reorganization but reorganization is possible. This needs to be considered with any sEEG study in epilepsy. However, since distributed activity during movement has also been observed in animal models (Steinmetz et al., 2019), it is reasonable to suspect similar results in humans are not driven by reorganization due to disease alone. Epileptic activity has not been observed to compromise the functionality of the brain tissue involved (Rossini et al., 2017), further supporting this claim.
Another limitation of our manuscript is that, although our task was a relatively simple motor task, there were undoubtedly other cognitive processes engaged during the button press responses - for instance visual processing, attention, and motor planning. Some of the contributions to each are delineated by comparing cue and movement-locked results, but there remains ambiguity on exactly what specific processes contribute to which components of the distributed activation evident in our results. Additionally, since the movements were simple button presses, we were unable to decode more refined elements of movement (for instance reach direction, movement velocity, etc.). This is another limitation inherent in our task and experimental design.
Future Directions and Applications
Our results suggest further avenues of inquiry related to the use of sEEG data to decode movement brain networks. An immediate direction of future study would be to place microgrids, capable of isolating single or at least many fewer neurons, on accessible areas of cortex implicated in movement to understand more about the oscillatory patterns in the area and their functional significance. Another future direction would be to use spectral connectivity for classification instead of spectrograms. This would test whether brain areas that have the same oscillatory patterns are part of the same neural circuit or whether there are multiple independent circuits that operate at the same oscillatory frequencies. Furthermore, connectivity analysis would yield functionally connected networks that would not be constrained by the qualitative labeling of spectral features in this current study. In this study, although each contact had its own unique classification pattern, the contacts were grouped based on shared spectral characteristics that only represented a subset, albeit an important subset for classification, of above-chance time-frequency points. Thus, one especially promising future extension of this work is to characterize the functional connectivity of oscillatory patterns related to movement.
The results from this study have several immediate applications. Patients with motor deficits may undergo invasive surgery to restore function with a brain-computer interface (BCI). Since ECoG has not yet been able to be used to fully restore movement (Miller et al., 2020) and since sEEG uses relatively small 2.4 mm bolt holes, which are less invasive than the craniotomy required for ECoG, improving BCI control by adding sEEG to sample different motor network nodes is an option that could be considered. Our results are also proof-of-concept that intraoperative functional brain mapping could be more efficient with this type of machine learning classification. Conventional passive (non-stimulation) mapping of functionally significant motor areas uses modulation of a predefined frequency band, commonly gamma (Kreidenhuber et al., 2019). Using an SVM or similar spectrogram-based classification would be more accurate because it includes a wider range of frequencies, including and extending beyond the predefined band.
Conclusion
Overall, we identified distinct time-frequency patterns with high-accuracy classifications using electrophysiological recordings of movement. Contacts with accurate classification are more widespread in anatomical location than previously described. The specific structural networks that communicate with these oscillations have yet to be fully determined but this characterization makes substantial progress toward that goal.
Acknowledgements
We would like to acknowledge Preeya Khanna for her helpful feedback on the manuscript. This work is supported by the Renée James Seed grant to Accelerate Scientific Research from University of Oregon (APR, NCS; PI: N. Swann) and NIH-1RF1MH117155–01 (BS, AM, AMR, PI: A. Raslan).
Footnotes
Conflict of Interest
The authors declare no competing financial interests.
Data and Code Availability
The anonymized data and code to reproduce this analysis are available at https://openneuro.org/datasets/ds004085 and https://github.com/alexrockhill/EMU_analysis respectively.
References
- Avanzini P, Abdollahi RO, Sartori I, Caruana F, Pelliccia V, Casaceli G, Mai R, Lo Russo G, Rizzolatti G, & Orban GA (2016). Four-dimensional maps of the human somatosensory system. Proceedings of the National Academy of Sciences, 113(13), E1936–E1943. 10.1073/pnas.1601889113 [DOI] [PMC free article] [PubMed] [Google Scholar]
- Ball T, Demandt E, Mutschler I, Neitzel E, Mehring C, Vogt K, Aertsen A, & Schulze-Bonhage A (2008). Movement related activity in the high gamma range of the human EEG. NeuroImage, 41(2), 302–310. 10.1016/j.neuroimage.2008.02.032 [DOI] [PubMed] [Google Scholar]
- Brainard DH (1997). The Psychophysics Toolbox. Spatial Vision, 10(4), 433–436. [PubMed] [Google Scholar]
- Breault MS, Fitzgerald ZB, Sacré P, Gale JT, Sarma SV, & González-Martínez JA (2019). Non-motor Brain Regions in Non-dominant Hemisphere Are Influential in Decoding Movement Speed. Frontiers in Neuroscience, 13, 715. 10.3389/fnins.2019.00715 [DOI] [PMC free article] [PubMed] [Google Scholar]
- Breault MS, Sacre P, Johnson JJ, Kerr M, Johnson MD, Bulacio J, Gonzalez-Martinez J, Sarma SV, & Gale JT (2017). Nonmotor regions encode path-related information during movements. 2017 39th Annual International Conference of the IEEE Engineering in Medicine and Biology Society (EMBC), 3339–3342. 10.1109/EMBC.2017.8037571 [DOI] [PubMed] [Google Scholar]
- Brown P, & Williams D (2005). Basal ganglia local field potential activity: Character and functional significance in the human. Clinical Neurophysiology, 116(11), 2510–2519. 10.1016/j.clinph.2005.05.009 [DOI] [PubMed] [Google Scholar]
- Buitinck L, Louppe G, Blondel M, Pedregosa F, Mueller A, Grisel O, Niculae V, Prettenhofer P, Gramfort A, Grobler J, Layton R, VanderPlas J, Joly A, Holt B, & Varoquaux G (2013). API design for machine learning software: Experiences from the scikit-learn project. ECML PKDD Workshop: Languages for Data Mining and Machine Learning, 108–122. [Google Scholar]
- Crone N (1998a). Functional mapping of human sensorimotor cortex with electrocorticographic spectral analysis. I. Alpha and beta event- related desynchronization. Brain, 121(12), 2271–2299. 10.1093/brain/121.12.2271 [DOI] [PubMed] [Google Scholar]
- Crone N (1998b). Functional mapping of human sensorimotor cortex with electrocorticographic spectral analysis. II. Event-related synchronization in the gamma band. Brain, 121(12), 2301–2315. 10.1093/brain/121.12.2301 [DOI] [PubMed] [Google Scholar]
- de Hemptinne C, Swann NC, Ostrem JL, Ryapolova-Webb ES, San Luciano M, Galifianakis NB, & Starr PA (2015). Therapeutic deep brain stimulation reduces cortical phase-amplitude coupling in Parkinson’s disease. Nature Neuroscience, 18(5), 779–786. 10.1038/nn.3997 [DOI] [PMC free article] [PubMed] [Google Scholar]
- Delorme A, & Makeig S (2004). EEGLAB: An open source toolbox for analysis of single-trial EEG dynamics including independent component analysis. Journal of Neuroscience Methods, 134(1), 9–21. 10.1016/j.jneumeth.2003.10.009 [DOI] [PubMed] [Google Scholar]
- Desikan RS, Ségonne F, Fischl B, Quinn BT, Dickerson BC, Blacker D, Buckner RL, Dale AM, Maguire RP, Hyman BT, Albert MS, & Killiany RJ (2006). An automated labeling system for subdividing the human cerebral cortex on MRI scans into gyral based regions of interest. NeuroImage, 31(3), 968–980. 10.1016/j.neuroimage.2006.01.021 [DOI] [PubMed] [Google Scholar]
- Destrieux C, Fischl B, Dale A, & Halgren E (2010). Automatic parcellation of human cortical gyri and sulci using standard anatomical nomenclature. NeuroImage, 53(1), 1–15. 10.1016/j.neuroimage.2010.06.010 [DOI] [PMC free article] [PubMed] [Google Scholar]
- Fischl B (2012). FreeSurfer. NeuroImage, 62(2), 774–781. 10.1016/j.neuroimage.2012.01.021 [DOI] [PMC free article] [PubMed] [Google Scholar]
- Gramfort A (2013). MEG and EEG data analysis with MNE-Python. Frontiers in Neuroscience, 7. 10.3389/fnins.2013.00267 [DOI] [PMC free article] [PubMed] [Google Scholar]
- Harmony T (2013). The functional significance of delta oscillations in cognitive processing. Frontiers in Integrative Neuroscience, 7, 83. 10.3389/fnint.2013.00083 [DOI] [PMC free article] [PubMed] [Google Scholar]
- Johnson JJ, Breault MS, Sacre P, Kerr MSD, Johnson M, Bulacio J, Gonzalez-Martinez J, Sarma SV, & Gale JT (2017). The role of nonmotor brain regions during human motor control. 2017 39th Annual International Conference of the IEEE Engineering in Medicine and Biology Society (EMBC), 2498–2501. 10.1109/EMBC.2017.8037364 [DOI] [PubMed] [Google Scholar]
- Jones SR, Pritchett DL, Stufflebeam SM, Hämäläinen M, & Moore CI (2007). Neural correlates of tactile detection: A combined magnetoencephalography and biophysically based computational modeling study. The Journal of Neuroscience: The Official Journal of the Society for Neuroscience, 27(40), 10751–10764. 10.1523/JNEUROSCI.0482-07.2007 [DOI] [PMC free article] [PubMed] [Google Scholar]
- Kleiner M, Brainard D, Pelli D, Ingling A, Murray R, & Broussard C (2007). What’s new in psychtoolbox-3. Perception, 36(14), 1–16. [Google Scholar]
- Koles ZJ, Lazar MS, & Zhou SZ (1990). Spatial patterns underlying population differences in the background EEG. Brain Topography, 2(4), 275–284. 10.1007/BF01129656 [DOI] [PubMed] [Google Scholar]
- Kreidenhuber R, De Tiège X, & Rampp S (2019). Presurgical Functional Cortical Mapping Using Electromagnetic Source Imaging. Frontiers in Neurology, 10, 628. 10.3389/fneur.2019.00628 [DOI] [PMC free article] [PubMed] [Google Scholar]
- Li G, Jiang S, Paraskevopoulou SE, Chai G, Wei Z, Liu S, Wang M, Xu Y, Fan Z, Wu Z, Chen L, Zhang D, & Zhu X (2021). Detection of human white matter activation and evaluation of its function in movement decoding using stereo-electroencephalography (SEEG). Journal of Neural Engineering, 18(4), 0460c6. 10.1088/1741-2552/ac160e [DOI] [PubMed] [Google Scholar]
- Manning JR, Jacobs J, Fried I, & Kahana MJ (2009). Broadband Shifts in Local Field Potential Power Spectra Are Correlated with Single-Neuron Spiking in Humans. Journal of Neuroscience, 29(43), 13613–13620. 10.1523/JNEUROSCI.2041-09.2009 [DOI] [PMC free article] [PubMed] [Google Scholar]
- Maris E, & Oostenveld R (2007). Nonparametric statistical testing of EEG- and MEG-data. Journal of Neuroscience Methods, 164(1), 177–190. 10.1016/j.jneumeth.2007.03.024 [DOI] [PubMed] [Google Scholar]
- Miao Y, Jin J, Daly I, Zuo C, Wang X, Cichocki A, & Jung T-P (2021). Learning Common Time-Frequency-Spatial Patterns for Motor Imagery Classification. IEEE Transactions on Neural Systems and Rehabilitation Engineering: A Publication of the IEEE Engineering in Medicine and Biology Society, 29, 699–707. 10.1109/TNSRE.2021.3071140 [DOI] [PubMed] [Google Scholar]
- Miller KJ, Hermes D, & Staff NP (2020). The current state of electrocorticography-based brain–computer interfaces. Neurosurgical Focus, 49(1), E2. 10.3171/2020.4.FOCUS20185 [DOI] [PubMed] [Google Scholar]
- Miller KJ, Leuthardt EC, Schalk G, Rao RPN, Anderson NR, Moran DW, Miller JW, & Ojemann JG (2007). Spectral Changes in Cortical Surface Potentials during Motor Movement. Journal of Neuroscience, 27(9), 2424–2432. 10.1523/JNEUROSCI.3886-06.2007 [DOI] [PMC free article] [PubMed] [Google Scholar]
- Pelli DG (1997). The VideoToolbox software for visual psychophysics: Transforming numbers into movies. Spatial Vision, 10(4), 437–442. [PubMed] [Google Scholar]
- Penfield W, & Boldrey E (1937). SOMATIC MOTOR AND SENSORY REPRESENTATION IN THE CEREBRAL CORTEX OF MAN AS STUDIED BY ELECTRICAL STIMULATION. Brain, 60(4), 389–443. 10.1093/brain/60.4.389 [DOI] [Google Scholar]
- Pernet CR, Latinus M, Nichols TE, & Rousselet GA (2015). Cluster-based computational methods for mass univariate analyses of event-related brain potentials/fields: A simulation study. Journal of Neuroscience Methods, 250, 85–93. 10.1016/j.jneumeth.2014.08.003 [DOI] [PMC free article] [PubMed] [Google Scholar]
- Pineda JA (2005). The functional significance of mu rhythms: Translating “seeing” and “hearing” into “doing.” Brain Research. Brain Research Reviews, 50(1), 57–68. 10.1016/j.brainresrev.2005.04.005 [DOI] [PubMed] [Google Scholar]
- Recanatesi S, Pereira-Obilinovic U, Murakami M, Mainen Z, & Mazzucato L (2022). Metastable attractors explain the variable timing of stable behavioral action sequences. Neuron, 110(1), 139–153.e9. 10.1016/j.neuron.2021.10.011 [DOI] [PMC free article] [PubMed] [Google Scholar]
- Rockhill A, Larson E, Stedelin B, Mantovani A, Raslan A, Gramfort A, & Swann N (2022). Intracranial Electrode Location and Analysis in MNE-Python. Journal of Open Source Software, 7(70), 3897. 10.21105/joss.03897 [DOI] [PMC free article] [PubMed] [Google Scholar]
- Rockhill AP, Raslan A, & Swann NC (2020). pd-parser: A tool for Matching Photodiode Deflection Events to Time-Stamped Events. Journal of Open Source Software, 5(54), 2674. 10.21105/joss.02674 [DOI] [PMC free article] [PubMed] [Google Scholar]
- Rossini L, Garbelli R, Gnatkovsky V, Didato G, Villani F, Spreafico R, Deleo F, Lo Russo G, Tringali G, Gozzo F, Tassi L, & de Curtis M (2017). Seizure activity per se does not induce tissue damage markers in human neocortical focal epilepsy: Seizures and Brain Damage. Annals of Neurology, 82(3), 331–341. 10.1002/ana.25005 [DOI] [PubMed] [Google Scholar]
- Sauseng P, Klimesch W, Gruber WR, Hanslmayr S, Freunberger R, & Doppelmayr M (2007). Are event-related potential components generated by phase resetting of brain oscillations? A critical discussion. Neuroscience, 146(4), 1435–1444. 10.1016/j.neuroscience.2007.03.014 [DOI] [PubMed] [Google Scholar]
- Steinmetz NA, Zatka-Haas P, Carandini M, & Harris KD (2019). Distributed coding of choice, action and engagement across the mouse brain. Nature, 576(7786), 266–273. 10.1038/s41586-019-1787-x [DOI] [PMC free article] [PubMed] [Google Scholar]
- Stolk A, Brinkman L, Vansteensel MJ, Aarnoutse E, Leijten FS, Dijkerman CH, Knight RT, de Lange FP, & Toni I (2019). Electrocorticographic dissociation of alpha and beta rhythmic activity in the human sensorimotor system. ELife, 8, e48065. 10.7554/eLife.48065 [DOI] [PMC free article] [PubMed] [Google Scholar]
- Swann N, Tandon N, Canolty R, Ellmore TM, McEvoy LK, Dreyer S, DiSano M, & Aron AR (2009). Intracranial EEG Reveals a Time- and Frequency-Specific Role for the Right Inferior Frontal Gyrus and Primary Motor Cortex in Stopping Initiated Responses. Journal of Neuroscience, 29(40), 12675–12685. 10.1523/JNEUROSCI.3359-09.2009 [DOI] [PMC free article] [PubMed] [Google Scholar]
- Toro C, Deuschl G, Thatcher R, Sato S, Kufta C, & Hallett M (1994). Event-related desynchronization and movement-related cortical potentials on the ECoG and EEG. Electroencephalography and Clinical Neurophysiology/Evoked Potentials Section, 93(5), 380–389. 10.1016/0168-5597(94)90126-0 [DOI] [PubMed] [Google Scholar]
- Uher D, Klimes P, Cimbalnik J, Roman R, Pail M, Brazdil M, & Jurak P (2020). Stereo-electroencephalography (SEEG) reference based on low-variance signals. 2020 42nd Annual International Conference of the IEEE Engineering in Medicine & Biology Society (EMBC), 204–207. 10.1109/EMBC44109.2020.9175734 [DOI] [PubMed] [Google Scholar]
Associated Data
This section collects any data citations, data availability statements, or supplementary materials included in this article.
Data Availability Statement
The anonymized data and code to reproduce this analysis are available at https://openneuro.org/datasets/ds004085 and https://github.com/alexrockhill/EMU_analysis respectively.


