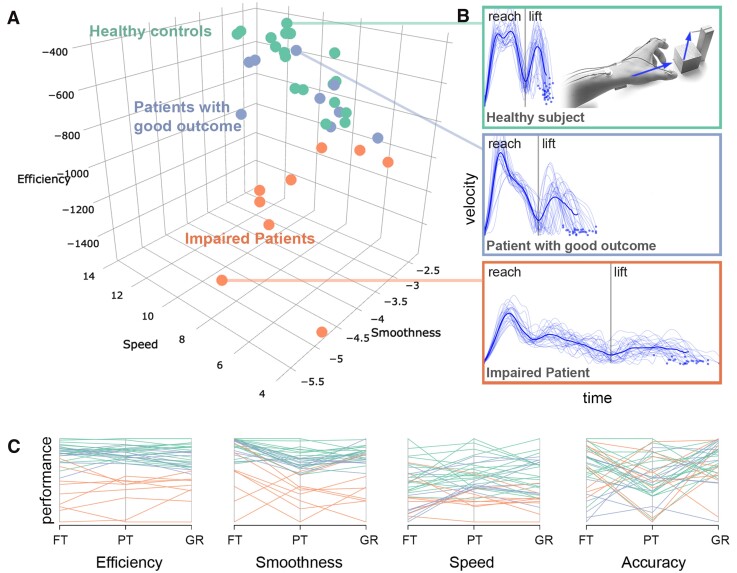
Figure 2.
Kinematic hand motor phenotypes. K-means clustering of hand kinematics yielded a two-cluster solution, (A) grouping healthy controls and patients with good motor outcome into the same cluster, in contrast to impaired patients. Participants are plotted based on reach-grasp-lift kinematics. (B) Examples of velocity profiles of one healthy participant (top), a patient with near-to-normal performance (middle), and one impaired patient (bottom). The dark blue lines indicate the mean velocity profile. (C) Parallel plot of all kinematic input variables entered into the clustering analysis, showing each participant’s performance for each scaled variable. FT = finger-tapping; PT = pointing; GR = grasping.

