Abstract
As a prolonged surge scenario, the COVID-19 pandemic has offered an unparalleled opportunity to improve hospital surge capacity (SC) understanding and the ability to manage it. In this study, the authors report the experience of a large hospital network and evaluate potential relationships between Intensive Care Units SC (ICU-SC) and some hospital-related variables: bed occupancy, emergency department admissions, ward admission from ED, and elective surgery procedures. Pearson’s partial correlation coefficient (r) has been used to define the relationship between SC and the daily values of the above variables, collected through a dedicated digital platform that also ensured a regular quality check of the data. The observation has concerned several levels of analysis, namely two different types of SC calculation (SC base—SCb and SC actual—SCa), hospital category level and multi-hospital level, and two consecutive pandemic waves. Among the 16 hospitals observed, the correlation was shown to be moderate-positive with non-ICU bed occupancy (r/ = 0.62, r/ = 0.54), strong/moderate with ICU bed occupancy (r/ = 0.72, r/ = 0.54), and moderate with ward admissions from ED (r/ = 0.50, r/ = 0.51) On the contrary, the correlation proved to be moderate-negative with ED admissions (r/ = − 0.69, r/ = − 0.62) and low with the number of elective surgery procedures (r/ = − 0.10, r/ = − 0.16). This study identified a positive correlation between SC and three variables monitored: ICU bed occupancy, non-ICU bed occupancy, and ward admissions from ED. On the contrary, the correlation was negative for ED admission and the number of elective surgery procedures. The results have been confirmed across all levels of analysis adopted.
Keywords: Surge capacity, Intensive care, Disaster medicine, Pandemics
Introduction
The burden on hospitals, particularly Intensive Care Units (ICU), due to the COVID-19 pandemic is unique in recent times. Anyone involved in preparedness and response to the pandemic realised the value of assessing hospitals’ capacity to stretch their resources, aiming to manage the surge of patients. In this regard, several interventions have been implemented to increase the number of additional beds at a single-hospital level and, particularly in advanced systems, at a more complex multi-hospital level [1, 2]. Surge capacity (SC) investigations have recently scaled up, although frequently confined to single hospital experiences or qualitative research [3–6].
Data on quantitative assessment of surge capacity in a large hospital network have been recently published by our research group, highlighting the crucial role of the medium-large hospital in the pandemic response and providing quantitative benchmarks for intensive care surge capacity (ICU-SC) [7]. However, the conditions underlying these results remain to be investigated.
This study intends to improve the quality of quantitative research in the field of SC, which remains a gap in the literature, aiming to offer health managers elements to guide their decisions. In this regard, it explores the role of some variables related to hospital operativity which, on top of organisational choices, may have had a dependent relationship with surge capacity. The authors speculate that knowledge of these relationships could have a role in better understanding the principles of hospital response for future similar scenarios, helping health decision-makers proactively take steps to improve hospital response by activating the resources needed.
In particular, the study's objective is to investigate the relationship between ICU-SC and hospital-impacting variables such as bed occupancy, emergency department (ED) admissions, hospital disposition decisions from ED, and elective surgery procedures. This research refers to a large hospital network with COVID-19 ICUs during two consecutive pandemic waves and also applies two complementary approaches to measuring SC, offering a more thorough approach to the investigations.
Materials and methods
Background and data collection
This research refers to a large hospital network of 46 public hospitals controlled by different health administrations, which are all part of the same regional health system (Tuscany, Italy). Among these, the point of investigation of this research focuses on hospitals with COVID-19 ICUs, defined as hospitals in which at least one ICU has been designated for the treatment of COVID-19 critical patients (henceforth H-ICU(Cov)). A Regional Operations Centre activated early in 2020 has implemented network strategies to balance hospitals' workloads. Data has been extracted from a dedicated digital platform used to monitor hospital bed occupancy and derived surge parameters [8], in which trained referents for each hospital of the regional network were asked to insert data at least once a day remotely. The system underwent regular quality checks (e.g., automatic detection of unlikely values, daily revision etc.).
Hospital categorisation
The authors adopted a classification based on the distribution in quintiles of the number of total beds extant in the pre-COVID-19 period among hospitals:
•Category 1: < 300 total beds.
•Category 2: 301–350 total beds.
•Category 3: 351–400 total beds.
•Category 4: 401–450 total beds.
•Category 5: > 451 pl total beds.
•Multi-H, which refers to the entire network of H-ICU(Cov) (all hospitals).
Period of analysis
Two consecutive pandemic waves were analysed in the period from 16 March 2020 to 20 December 2020 (the first and last days of data collection for this research). Specifically, the first wave refers to the period running from 16 March 2020 to 14 July 2020, and the second from 15 August 2020 to 20 December 2020. The end of the first wave and the beginning of the second wave were chosen as extreme values of the period when the total number of ICU COVID-19 beds occupied in the entire network was extremely low, notably ≤ 2 for at least seven consecutive days.
In total, 249 days were observed, 121 in the first and 128 in the second waves.
Surge capacity definition
In this paper, surge capacity (SC) refers to the additional number of beds activated in response to a given, not predictable, high influx of patients [9]. Each ICU bed activated is equipped based on the standards and regulations adopted for non-COVID-19 assistance, guaranteeing functional equivalent care [10]. Because of the evolutive nature of surge capacity over time, and again aiming to offer a more comprehensive analysis, the authors chose to measure SC using two different and complementary approaches [7]:
SC base (SCb), which refers to the number of non-COVID-19 beds extant in the pre-pandemic phase (ICU COVID-19 beds activated during the pandemic/ICU non-COVID-19 beds extant in the pre-pandemic phase)
SC actual (SCa), which refers to the daily updated number of non-COVID-19 beds effectively extant during the pandemic (ICU COVID-19 beds activated during the pandemic/ICU non-COVID-19 beds extant during the pandemic phase)
Differently from SC (base), SC (actual) concerns the dynamic behaviour of SC due to the continuous change in the number of extant beds over time in real scenarios. The calculation is based on the continuous variability of the numerator and denominator, which is extremely difficult to estimate in simulation-based exercises.
Study design and statistical analysis
In the perspective of a multicentre observational study, Pearson's partial correlation coefficient has been used to define the relationship between SC(base) and SC(actual) and five dependent variables, which might have an impact on SC:
Variable name: Non-ICU COVID-19 bed occupancy
Variable name: ICU COVID-19 bed occupancy
Rationale for investigation: Hospital pressure due to bed occupancy was expected to have played a prominent role in surge capacity. However, although intuitive, this hypothesis is not clearly borne out [11]
Description: additional beds (non-ICU and ICU) activated in response to the pandemic.
-
3.
Variable name: ED admissions.
Rationale for investigation: The surge in ED admissions may have been related to hospital SC, assuming that the more patients are admitted, the more beds are expected to be needed
Description: Number of patients admitted to the ED, referring to the total number of patients regardless of the clinical reason for ED referral
-
4.
Variable name: Ward admissions from ED (%).
Rationale for investigation: An increase in ward admissions from ED was expected to have triggered the need for additional ICU beds.
Description: Percentage of patients transferred to any hospital ward/area, including ICU, out of the total number of patients admitted to the ED.
-
5.
Variable name: Elective surgery procedures.
Rationale for investigation: A decrease in elective surgery procedures, as occurred during the pandemic period, may have made available more human resources for ICU assistance (anaesthesiologists) and ICU beds considering the reduced demand for post-surgery care. [12]
Description: Number of elective surgery procedures
For each variable, the relationship was evaluated at the same time as the measurement (T0). The relationship is indicated by a coefficient of correlation (r), based on which three levels of relationship (positive or negative) have been identified: low (0 < r < 0.3 or − 0.3 < r < 0), moderate (0.3 < r < 0.7 or − 0.7 < r < − 0.3), strong (> 0.7 or < − 0.7). The findings suggest considering these variables as potential indicators to address countermeasures proactively.
Results
Hospital categorisation and main characteristics
Within the entire hospital network, 16 hospitals have been identified as H-ICU(Cov) (Multi-H), of which n = 3 in Category 1, n = 3 in Category 2, n = 3 in Category 3, n = 3 in Category 4, n = 4 in Category 5.
The number of total hospital beds at Multi-H level was (mean ± SD) n = 476.50 ± 303.50 (Category 1 n = 213.00 ± 99.08, Category 2 n = 328.66 ± 22.18, Category 3 n = 378.33 ± 10.01, Category 4 n = 412.66 ± 6.66, Category 1 n = 906.50 ± 319.49).
The number of ICU hospital beds at Multi-H level (mean ± SD) was n = 23.94 ± 14.79 (Category 1 n = 10.00 ± 4.00, Category 2 n = 23.33 ± 5.13, Category 3 n = 23.33 ± 5.13, Category 4 n = 16.33 ± 3.79, Category 1 n = 41.00 ± 14.90).
The number of beds, both total and ICU, refers to the pre-COVID-19 period.
Correlation analysis with SC (Table 1)
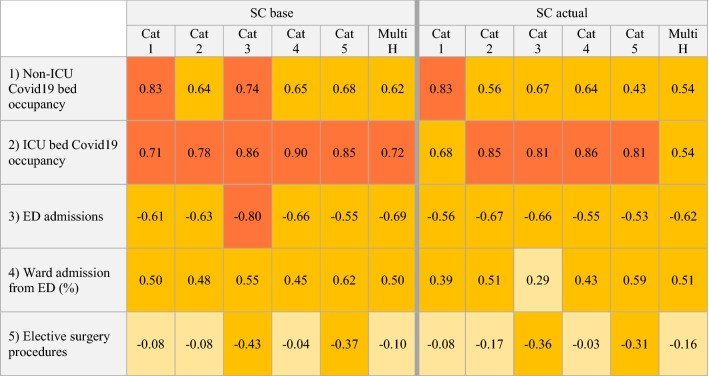
Table 1.
Coefficients of correlation (r)
Relationship between SC(base), SC (actual) and the five variables investigated. The level of relationship is identified by the r value (coefficient of correlation):
Low (0 < r < 0.3 or − 0.3 < r < 0), yellow-coloured boxes
Moderate (0.3 < r < 0.7 or − 0.7 < r < − 0.3), orange-coloured boxes
Strong (r > 0.7 or r < − 0.7), red-coloured boxes
Cat hospital category, Multi H multi-hospital level, referring to all 16 hospitals observed
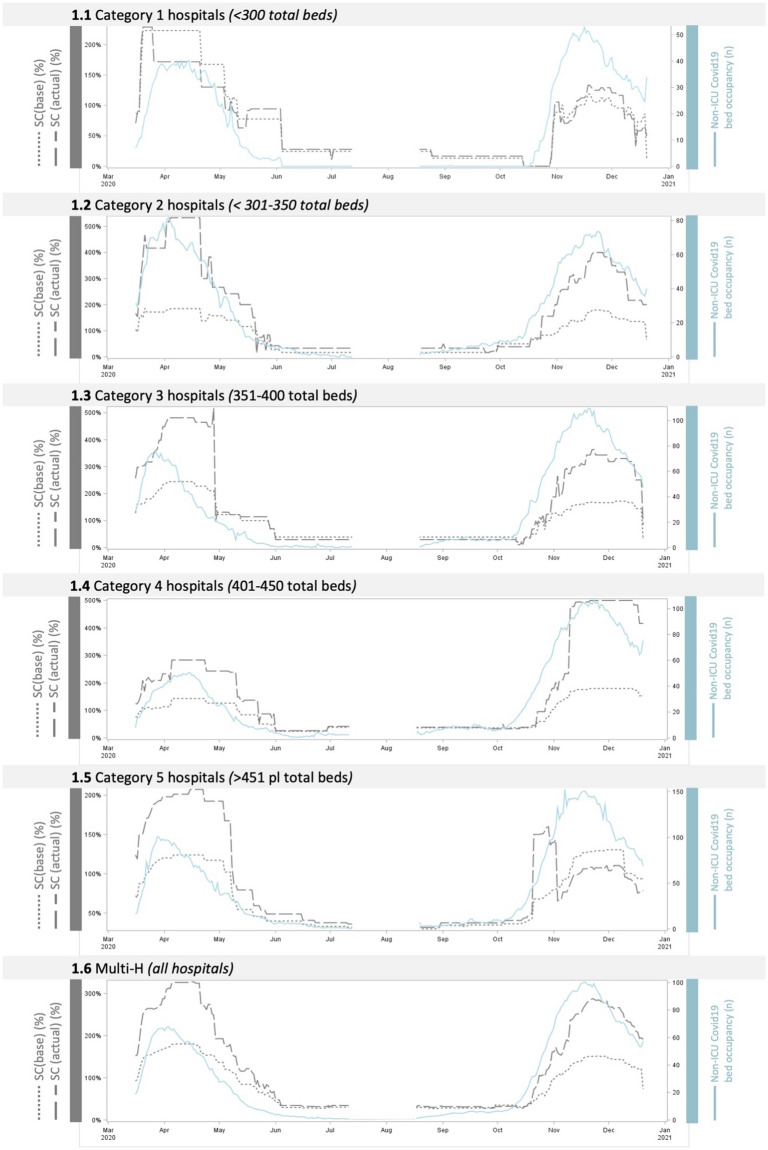
Non-ICU COVID-19 beds occupied (Fig. 1). This variable is shown to have a partial positive correlation with both SC(base) and SC(actual) among all hospital categories. A strong correlation is identified in Category 1 hospitals (r = 0.83, both SC base and actual) and Category 3 hospitals (r = 0.74). Regarding the multi-H analysis, the correlation is moderate with both SCb and SCa (respectively, r = 0.62 and 0.54).
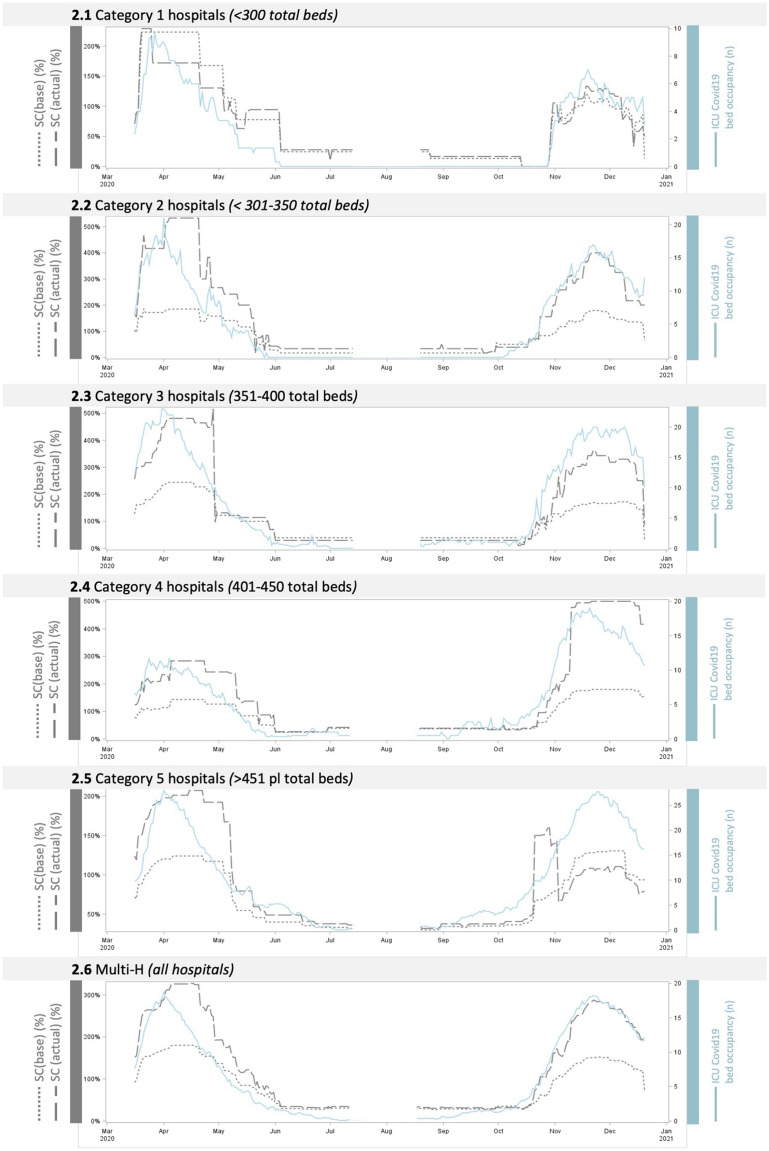
ICU COVID-19 beds occupied (Fig. 2). This variable is shown to have a partial positive correlation with both SC(base) and SC(actual) among all hospital categories. A strong correlation is identified in all hospital categories, except for Category 1 (r = 0.68 SCa). For the multi-H analysis, the correlation is strong with SCb (r = 0.72) and moderate with SCa (r = 0.54).
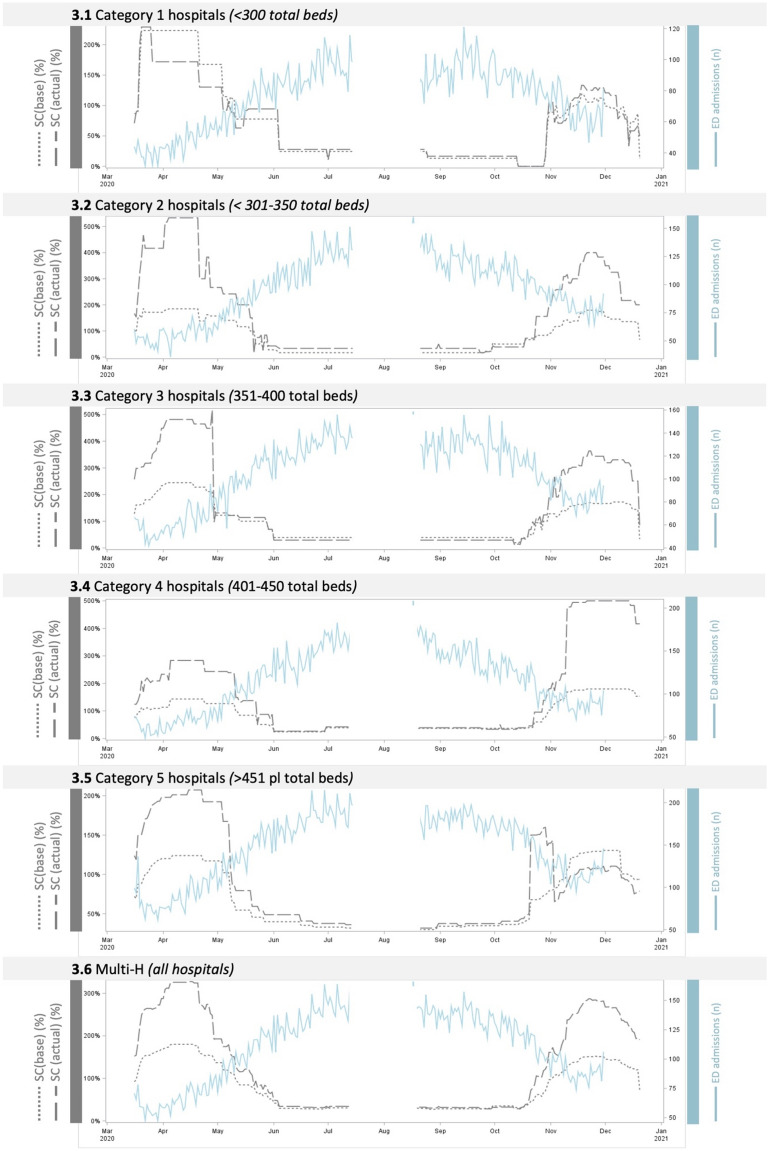
ED admissions (Fig. 3). This variable is shown to have a partial negative correlation with both SC(base) and SC(actual) among all hospital categories. A strong correlation with SCb is identified only in Category 3 (r = − 0.80). Regarding the multi-H analysis, the correlation is moderate with both SCb and SCa (respectively, r = − 0.69 and − 0.62).
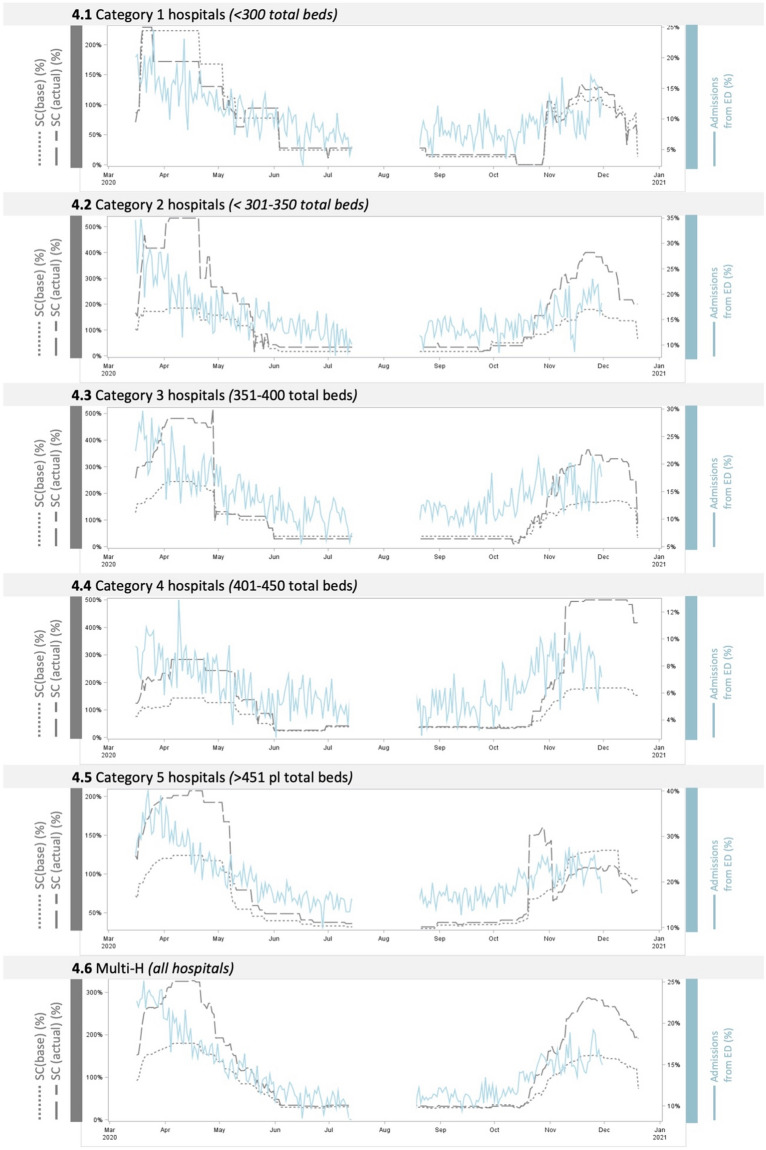
Ward admissions from ED (%) (Fig. 4). This variable is shown to have a partial positive correlation with both SC(base) and SC(actual) among all hospital categories, proving moderate in all cases. Regarding the multi-H analysis, the correlation is moderate with both SCb and SCa (respectively, r = 0.50 and 0.51)
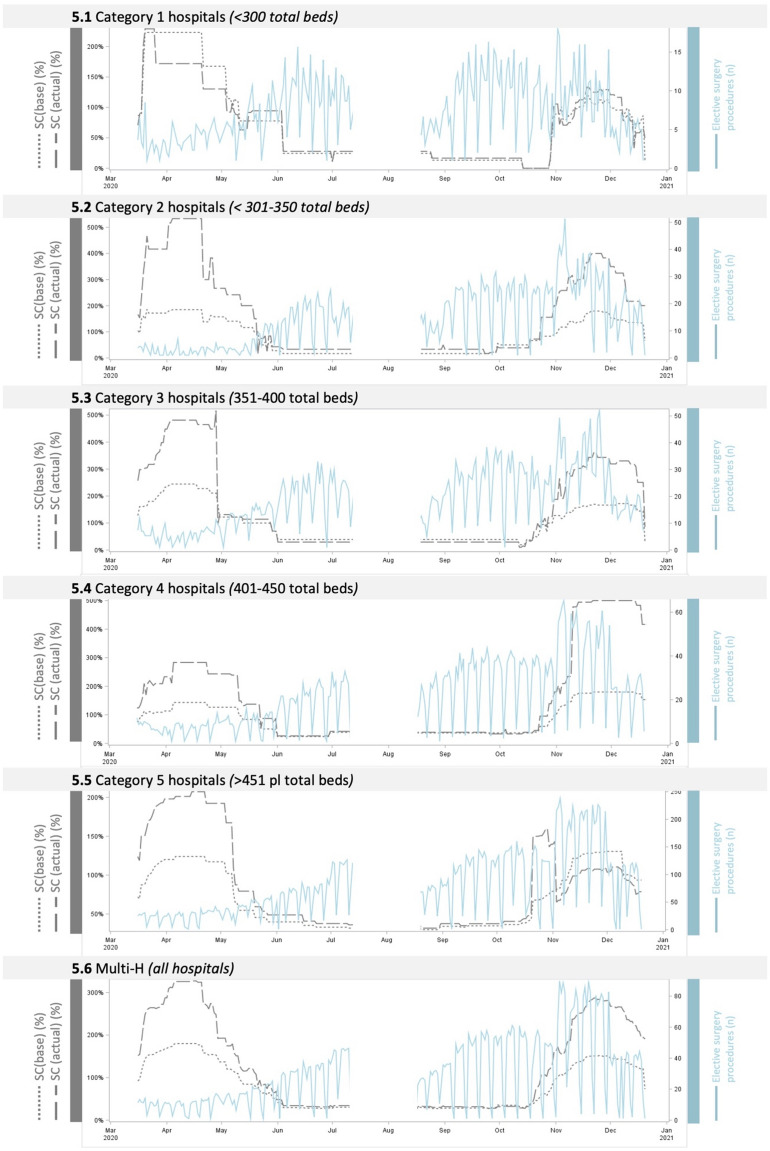
Elective surgery procedures (Fig. 5). This variable is shown to have a partial negative correlation with both SC(base) and SC(actual) among all hospital categories, proving to be low or moderate in all cases. Regarding the multi-H analysis, the correlation is low with both SCb and SCa (respectively, r = 0.10 and 0.16).
Fig. 1.
Relationship between SC and non-ICU COVID-19 bed occupancy trend (variable 1). The figure shows the relationship between SC(base), SC (actual) and non-ICU COVID-19 bed occupancy (variable 1) during two consecutive pandemic waves, for each hospital category (Fig. 1.1 to 1.5) and at the multi-hospital level (Fig. 1.6)
Fig. 2.
Relationship between SC and ICU COVID-19 bed occupancy trend (variable 2). The figure shows the relationship between SC(base), SC (actual) and ICU COVID19 bed occupancy (variable 2) during two consecutive pandemic waves, for each hospital category (Fig. 2.1 to 2.5) and at the multi-hospital level (Fig. 2.6)
Fig. 3.
Relationship between SC and ED admissions trend (variable 3). The figure shows the relationship between SC(base), SC (actual) and ICU ED admissions (variable 3) during two consecutive pandemic waves, for each hospital category (Fig. 3.1 to 3.5) and at the multi-hospital level (Fig. 3.6)
Fig. 4.
Relationship between SC and ward admissions from ED (%) trend (variable 4). The figure shows the relationship between SC(base), SC (actual) and ward admissions from ED (%) (variable 4) during two consecutive pandemic waves, for each hospital category (Fig. 4.1 to 4.5) and at the multi-hospital level (Fig. 4.6)
Fig. 5.
Relationship between SC and elective surgery procedures trend (variable 5). The figure shows the relationship between SC(base), SC (actual) and Elective surgery procedures (variable 5) during two consecutive pandemic waves, for each hospital category (Fig. 5.1 to 5.5) and at the multi-hospital level (Fig. 5.6)
Discussion
This study investigates the relationship between SC and some hospital variables that may have played a key role. The analysis was performed with reference to several hospital categories as well as to the entire hospital network to offer a more exhaustive analysis. Furthermore, to ensure greater robustness of the results, this study utilises two different approaches to calculating SC, namely SCb and SCa.
The first two variables investigated regarding both non-ICU and ICU COVID-19 hospital bed occupancy (variables 1 and 2) revealed a positive correlation with SC, which is shown to be strong (r > 0.7) with COVID-19 ICU bed occupancy in almost all categories. The relationship may be due to direct observation by hospital staff of the increasing (or decreasing) number of beds occupied. Indeed, unlike the other variables described here, the number of beds occupied is directly observed data, i.e., hospital staff directly observed the situation with their own eyes, although there is no automated bed occupancy monitoring system within each hospital. Such observation could be relevant to the correlation with non-ICU beds as well. However, in this latter case, it may have generated awareness that an almost stable percentage of non-ICU patients would require ICU admission [13]. It should be noted that the correlation pattern proved to be similar for both waves. However, concerning the multi-H level, the curves show an inverted pattern (Figs. 1.6, 2.6), meaning that SC was proportionally lower in the second wave, presumably due to an improved capacity over time to predict the need for and activate extra resources accurately. Although it has been considered in previous investigations on SC [14], the relationship between bed occupancy rate and SC has never been demonstrated. These findings suggest that there may be added value in adopting an occupancy rate monitoring strategy during high-influx scenarios.
The relationship between SC and ED admissions (variable 3) proved moderate-negative in all cases (except for the case of SCb in Category 3, which was strongly negative). This finding can lead to different interpretations. On the one hand, it is reasonable to assume that this relationship was not necessarily causal. Several studies have observed a significant reduction during the pandemic in ED admissions of patients who typically would have been admitted to the hospital, suggesting substantial deferment of care. This phenomenon was generally explained as having been mainly due to patients' concerns regarding the risk of contracting SARS-CoV-2 infection in an ED [15, 16], an element that appears to be independent of organisational choices made to improve SC in the pandemic scenario. On the other hand, in a more controversial interpretation, we would assume that a smaller number of people admitted to ED should have resulted in a smaller number of beds occupied and, consequently, fewer additional resources activated. However, compared to the pre-pandemic period, a more significant proportion of the patients admitted had respiratory symptoms, which evolved into a higher rate of hospitalisation and ICU occupation [13].
In other words, reduced ED pressure has not necessarily corresponded to a reduced need for additional hospital beds. According to this finding, the level of correlation identified suggests that this parameter should also be considered for future investigations during prolonged surge scenarios.
The relationship between SC and ward admissions from ED (%) (variable 4) was moderate-positive for all categories, with a slight exception for SCa Category 3. This finding appears consistent with the previous observation on ED admissions. In fact, the increase in this percentage, along with the reduction in hospital admissions, is related to an overall increase in patients requiring hospital care, presumably COVID-19 related, followed by an increase in additional resources. However, it should be underscored that the value refers not only to COVID-19 patients but to all patients coming from the ED. In the absence of specific data, we assume that most of the patients admitted in this circumstance had a COVID-19 infection. Moreover, given the same number of ED admissions, the increase in this percentage correlates with increased bed occupancy. Once again, because of the consistency of this finding across categories in both pandemic waves, the data support the importance of monitoring ward admissions from ED to assess the need for extra resources proactively.
The last point of investigation refers to the number of elective surgery procedures (variable 5). The results show a largely low-negative correlation with SC (particularly regarding the multi-H level). According to these findings, reducing surgical procedures, one of the countermeasures adopted by hospitals to improve SC, as often implemented during the pandemic and suggested by another research [17], may have improved SC values.
Although more assumptions at this stage are premature, a preliminary explanation of the effect of the elective surgery variable on the three, well-known components of the SC described by Kaji and coll. [18]: staff, stuff, and structure might reasonably assume that the decreased number of surgical procedures may have made available more critical health staff for the H-ICU(Cov) and critical equipment or infrastructures (i.e. “stuff” such as critical care equipment and surgery equipment) to be used for handling patients with SARS-CoV-2. Moreover, the reduction of elective procedures may have implied a consequent reduction of patients needing post-surgery ICU care. Our analysis identified a moderate correlation only in Category 3 hospitals (medium-size hospitals), where the reduction of surgical procedures may have been more significant. However, this data is not confirmed in smaller hospitals, nor at the multi-hospital level, where the correlation is shown to be low. These findings suggest that reducing elective surgery procedures may have a limited impact on improving SC. Further investigations are needed to better define the effective role of this strategy during patient surges, with the awareness that postponing elective surgeries that have already been scheduled could result in considerably worse outcomes for the community [19, 20].
To the best of our knowledge, this study is an innovative attempt to improve understanding of SC. Awareness of which monitorable variables correlate with SC may have particular importance in hospital preparedness and response during prolonged surge scenarios requiring additional ICU resources. It can be valuable in driving two elements: monitoring and acting proactively. In fact, continuous observation of the trends in these variables and awareness of the resources available in a given hospital should be considered as potential indicators to address countermeasures proactively (e.g., redirecting patients to other hospitals based on the level of occupancy or ward admissions from ED).
The measured variables can be easily monitored in health systems, and the figures reported here may represent a preliminary benchmark to improve understanding of SC's qualitative and quantitative principles, which remain a gap in the literature [3]. Moreover, this may evolve into a means of providing predictive models to support decision-makers in surge-related decisions, particularly on the number of resources that should be activated.
In this research, various approaches to analysis have been adopted (namely, different types of SC, hospital categorisation and multi-H level, and two consecutive waves) to improve the quality of the investigation and to bring out possible weaknesses in the findings. Even in this multi-perspective approach, the data show consistent patterns across all of the analyses, suggesting good reproducibility of results. Moreover, the reproducibility of these findings is further supported by the fact that the hospitals in the study had diverse management models (although under the same regional system, the hospitals fall within different organisation systems) as well as being in other geographical locations.
On in-depth examination, SCa values were less extreme than SCb values, consistent with the general tendency of SCb values to be lower. The graphical analysis of the two waves does not identify significant differences, except for bed occupancy, discussed above. Despite the same trend being present across different categories, some differences in the levels of correlation can be observed: overall, correlation levels appear to be more clearly evidenced in Cat3 Hospitals. However, the reasons behind these findings are difficult to determine and substantiate in the absence of additional elements.
Findings were confirmed with both of the SC calculation methods adopted and were consistent across the various hospital categories and for both pandemic waves, suggesting the need for further investigations to explore causation, which may help improve hospitals’ preparedness and response to prolonged surge scenarios.
Study Limitations. This study has some limitations. The investigation of occupancy intentionally refers only to COVID-19 beds occupied. Regarding variable 3 (ED admissions), the analysis is limited to the total number of patients, lacking a more precise evaluation of clinical patterns at the ED stage (e.g., patients with fever, dyspnoea etc.). Moreover, the hospitals in the study are all part of the same health system which, although organised in different sub-organisational models (health authority units), might have had a role in standardising some operational choices (e.g., the activation of the Regional Operations Centre may have favoured a better balance of occupancy).
Lastly, it should be noted that the investigation of causes beyond these findings is beyond the scope of this study. However, the authors are aware of the high number of elements which play a role in this matter, and which mainly refer to organisational choices related to the well-known determinants of SC, namely staff, stuff, and organisation.
Conclusion
The analysis of data collected in a large hospital network and monitored during the two first pandemic waves demonstrates a positive relationship between SC and three hospital variables: ICU bed occupancy, non-ICU bed occupancy, and ward admissions from ED. On the contrary, the correlation was negative for ED admission and the number of elective surgery procedures. The results have been confirmed across all levels of analysis, suggesting the need for further investigations to explore causation.
Acknowledgements
We would like to express our gratitude to all of the colleagues who made the difference in this extraordinarily difficult situation with their competence and exceptional dedication. The authors’ sincere recognition goes to all those involved in the pandemic response organization, particularly our intensive care and emergency services colleagues. We would also like to thank the Regional and Local Health Authorities for facilitating research in this sphere. This manuscript is the result of a study conducted within the framework of the International PhD in Global Health, Humanitarian Aid and Disaster Medicine jointly organised by Università del Piemonte Orientale (UPO) and Vrije Universiteit Brussel (VUB).
Author contributions
Authors MN and GV provided substantial contributions to the conception of the design of the manuscript; authors MN and LT to analysis and interpretation of the data; authors MN, FDC, LR, and IH to the methodology, design and supervision of the study; authors MN and MTM to the project administration; author MN to writing the original draft; authors MN, SR, GB, PB, and SS to critical revision. All authors read and approved the final version of the manuscript.
Funding
This research received no external funding.
Data availability
The datasets generated during and/or analysed during the current study are not publicly available due to the needfor authorization to use but are available from the corresponding author on reasonable request.
Declarations
Conflict of interest
The authors declare that they have no conflict of interest.
Ethical approval
This is an observational study. The local Ethics Committee (Comitato Etico Regione Toscana Sezione Area Vasta Centro–Ceavc) has confirmed that no ethical approval is required.
Informed consent
Not applicable.
Footnotes
Publisher's Note
Springer Nature remains neutral with regard to jurisdictional claims in published maps and institutional affiliations.
References
- 1.Wu Z, McGoogan JM. Characteristics of and important lessons from the coronavirus disease 2019 (COVID-19) outbreak in China: summary of a report of 72 314 cases from the Chinese center for disease control and prevention. JAMA. 2020;323:1239. doi: 10.1001/jama.2020.2648. [DOI] [PubMed] [Google Scholar]
- 2.Supady A, Staudacher D, Bode C, et al. Hospital networks and patient transport capacity during the COVID-19 pandemic when intensive care resources become scarce. Crit Care. 2021;25:28. doi: 10.1186/s13054-021-03462-3. [DOI] [PMC free article] [PubMed] [Google Scholar]
- 3.Bayram JD, Zuabi S, Subbarao I. Disaster metrics: quantitative benchmarking of hospital surge capacity in trauma-related multiple casualty events. Disaster Med Public Health Prep. 2011;5:117–124. doi: 10.1001/dmp.2010.19. [DOI] [PubMed] [Google Scholar]
- 4.McCabe R, Schmit N, Christen P, et al. Adapting hospital capacity to meet changing demands during the COVID-19 pandemic. BMC Med. 2020;18:329. doi: 10.1186/s12916-020-01781-w. [DOI] [PMC free article] [PubMed] [Google Scholar]
- 5.Davis DP, Poste JC, Hicks T, et al. Hospital bed surge capacity in the event of a mass-casualty incident. Prehosp Disaster med. 2005;20:169–176. doi: 10.1017/S1049023X00002405. [DOI] [PubMed] [Google Scholar]
- 6.Bardi T, Gómez-Rojo M, Candela-Toha AM, et al. Respuesta rápida a COVID-19, estrategias de escalada y desescalada para ajustar la capacidad suplementaria de camas de UVI a una epidemia de gran magnitud. Rev Esp Anestesiol Reanim. 2021;68:21–27. doi: 10.1016/j.redar.2020.09.003. [DOI] [PMC free article] [PubMed] [Google Scholar]
- 7.Nocci M, Ragazzoni L, Barone-Adesi F, et al. Dynamic assessment of surge capacity in a large hospital network during COVID-19 pandemic. Minerva Anestesiol. 2022 doi: 10.23736/S0375-9393.22.16460-6. [DOI] [PubMed] [Google Scholar]
- 8.Nocci M, Dannaoui B, Della Corte F, et al. Real-time coordination of the regional health system during the pandemic. Disaster Med Public Health Prep. 2020 doi: 10.1017/dmp.2020.501. [DOI] [PMC free article] [PubMed] [Google Scholar]
- 9.American College of Emergency Physicians Health care system surge capacity recognition, preparedness, and response. Ann Emerg Med. 2005;45:239. doi: 10.1016/j.annemergmed.2004.10.015. [DOI] [PubMed] [Google Scholar]
- 10.Hick JL, Einav S, Hanfling D, et al. Surge capacity principles. Chest. 2014;146:e1S–e16S. doi: 10.1378/chest.14-0733. [DOI] [PubMed] [Google Scholar]
- 11.Schull MJ. Hospital surge capacity: if you can’t always get what you want, can you get what you need? Ann Emerg Med. 2006;48:389–390. doi: 10.1016/j.annemergmed.2006.06.003. [DOI] [PMC free article] [PubMed] [Google Scholar]
- 12.Nurok M, Kahn JM. Intensive care unit capacity, cancellation of elective surgery, and the US pandemic response. Anesth Analg. 2020;131:1334–1336. doi: 10.1213/ANE.0000000000005170. [DOI] [PubMed] [Google Scholar]
- 13.Grasselli G, Pesenti A, Cecconi M. Critical care utilization for the COVID-19 outbreak in Lombardy, Italy: early experience and forecast during an emergency response. JAMA. 2020;323:1545. doi: 10.1001/jama.2020.4031. [DOI] [PubMed] [Google Scholar]
- 14.Mateen BA, Wilde H, Dennis JM, et al. Hospital bed capacity and usage across secondary healthcare providers in England during the first wave of the COVID-19 pandemic: a descriptive analysis. BMJ Open. 2021;11:e042945. doi: 10.1136/bmjopen-2020-042945. [DOI] [PMC free article] [PubMed] [Google Scholar]
- 15.Nourazari S, Davis SR, Granovsky R, et al. Decreased hospital admissions through emergency departments during the COVID-19 pandemic. Am J Emerg Med. 2021;42:203–210. doi: 10.1016/j.ajem.2020.11.029. [DOI] [PMC free article] [PubMed] [Google Scholar]
- 16.Jeffery MM, D’Onofrio G, Paek H, et al. Trends in emergency department visits and hospital admissions in health care systems in 5 states in the first months of the COVID-19 pandemic in the US. JAMA Intern Med. 2020;180:1328. doi: 10.1001/jamainternmed.2020.3288. [DOI] [PMC free article] [PubMed] [Google Scholar]
- 17.Prasad NK, Englum BR, Turner DJ, et al. A nation-wide review of elective surgery and COVID-surge capacity. J Surg Res. 2021;267:211–216. doi: 10.1016/j.jss.2021.05.028. [DOI] [PMC free article] [PubMed] [Google Scholar]
- 18.Kaji A, Koenig KL, Bey T. Surge capacity for healthcare systems: a conceptual framework. Acad Emerg Med. 2006;13:1157–1159. doi: 10.1197/j.aem.2006.06.032. [DOI] [PubMed] [Google Scholar]
- 19.Wu K, Smith CR, Lembcke BT, Ferreira TBD. Elective surgery during the COVID-19 pandemic. N Engl J Med. 2020;383:1787–1790. doi: 10.1056/NEJMclde2028735. [DOI] [PubMed] [Google Scholar]
- 20.Shehata IM, Elhassan A, Jung JW, et al. Elective cardiac surgery during the COVID-19 pandemic: proceed or postpone? Best Pract Res Clin Anaesthesiol. 2020;34:643–650. doi: 10.1016/j.bpa.2020.07.005. [DOI] [PMC free article] [PubMed] [Google Scholar]
Associated Data
This section collects any data citations, data availability statements, or supplementary materials included in this article.
Data Availability Statement
The datasets generated during and/or analysed during the current study are not publicly available due to the needfor authorization to use but are available from the corresponding author on reasonable request.


