

Abstract
Two-point discrimination (2PD) test reflects somatosensory spatial discrimination ability, but evidence on the relationship between 2PD and cortical gray matter (GM) volume is limited. This study aimed to analyze the relationship between cortical GM volume and 2PD threshold in young healthy individuals and to clarify the characteristics of brain structure reflecting the individual differences in somatosensory function. 2PD was measured in 42 healthy (20 females) volunteers aged 20–32 years using a custom-made test system that can be controlled by a personal computer. The 2PD of the right index finger measured with this device has been confirmed to show good reproducibility. T1-weighted images were acquired using a 3-T magnetic resonance imaging scanner for voxel-based morphometry analysis. The mean 2PD threshold was 2.58 ± 0.54 mm. Whole-brain multiple regression analysis of the relationship between 2PD and GM volume showed that a lower 2PD threshold (i.e. better somatosensory function) significantly correlated with decreased GM volume from the middle temporal gyrus to the inferior parietal lobule (IPL) in the contralateral hemisphere. In conclusion, a lower GM volume in the middle temporal gyrus and IPL correlates with better somatosensory function. Thus, cortical GM volume may be a biomarker of somatosensory function.
Keywords: gray matter, inferior parietal lobe, middle temporal gyrus, 2-point discrimination, VBM
Introduction
Somatosensory stimulation induces activity in various cortical areas, including the primary somatosensory cortex (S1), secondary somatosensory cortex (S2), posterior parietal cortex, and primary motor cortex (Inui et al. 2004). In addition to these areas, the premotor cortex, supplementary motor cortex, presupplementary motor cortex, dorsolateral prefrontal cortex (DLPFC), inferior frontal gyrus (IFG), insular cortex, inferior parietal lobule (IPL), supramarginal gyrus, angular gyrus, superior parietal lobule, interparietal sulcus (IPS), hMT/V5, temporoparietal junction (TPJ), and cerebellum are also activated during somatosensory discrimination tasks (Gao et al. 1996; Van Boven et al. 2005; Kitada et al. 2006; Pleger et al. 2006; Li Hegner et al. 2010; Wacker et al. 2011; van der Zwaag et al. 2013; van Kemenade et al. 2014; Li Hegner et al. 2015; Sarasso et al. 2018). The brain structure changes with training and with long-term experience. For example, the gray matter (GM) volume of the hMT/+V5 area, occipito-parietal areas, and dorsal parietal cortex increases with juggling practice (Draganski et al. 2004; Boyke et al. 2008; Gerber et al. 2014; Sampaio-Baptista et al. 2014). Meanwhile, those of the lingual gyrus and IFG increase with a prolongation of flight time in pilots (Qiu et al. 2021). Furthermore, specific areas increase in musicians (Gaser and Schlaug 2003), typists (Cannonieri et al. 2007), and athletes (Bezzola et al. 2011; Schlaffke et al. 2014). Moreover, the GM volume of the posterior hippocampus is increased and that of the anterior hippocampus is decreased in taxi drivers (Maguire et al. 2000) and dancers (Hufner et al. 2011). Additionally, shadowing, reading, and cognitive training reduce GM volume in specific areas (Takeuchi et al. 2011a, 2011b; Maruyama et al. 2018; Takeuchi et al. 2021). Collectively, these findings indicate that it may be possible to predict somatosensory function from GM volume of cortical areas involved in somatosensory information processing; however, the relationship between somatosensory function and GM volume in untrained healthy individuals has not been clarified.
Two-point discrimination (2PD) has been widely used to evaluate spatial acuity both clinically and in research on somatosensory perception. Several cortical areas, such as the IPS, IPL, supramarginal gyrus, anterior cingulate cortex, prefrontal gyrus, IFG and S1, anterior insula, and cerebellar vermis, are involved in 2PD (Akatsuka et al. 2008). Further, 2PD thresholds are declined (sensory function is improved) when transcranial alternation current stimulation is applied to the posterior parietal cortex (Yokota et al. 2021). Interestingly, Schmidt-Wilcke et al. 2018 reported that people with lower 2PD thresholds (better sensory function) have larger GM volumes in the thalamus and S1 and that repetitive electrical stimulation to the fingertip increases the volume of the parietal operculum and improves 2PD function. However, the relationship between 2PD and cortical GM volume has only been reported by Schmid-Wilcke et al., and thus, the reproducibility needs to be verified.
This study aimed to analyze the relationship between cortical GM volume and 2PD threshold in young healthy individuals and to clarify the brain structural characteristics reflecting the individual differences in somatosensory function.
Material and methods
Study design and participants
This voxel-based morphometry (VBM) study recruited 42 healthy volunteers (22 male and 20 female) aged 20–32 years (mean ± standard division [SD]: 22.1 ± 2.2 years). None of the participants reported taking any drugs or medications which could affect central nervous system function. Handedness was assessed using the Edinburgh Handedness Inventory (39 right-handed, 3 left-handed, mean ± SD: 73.2 ± 44.6) (Oldfield 1971). This study was approved by the Ethics Committee of Niigata University of Health and Welfare and was conducted in accordance with the Declaration of Helsinki. All participants provided written informed consent before participation.
2PD measurement
The 2PD of the right index finger was measured with the participants seated in a resting position on a chair with a backrest. The right shoulder and elbow joints were placed in the slightly flexed position, whereas the forearm was positioned in a pronated position. The participants were instructed to relax and look at a fixed point approximately 1.5 m in their front. A custom-made 2-point tactile stimulator (Takei-kiki, Niigata, Japan), which allows detailed control of stimulation conditions (pin elevation speed, stimulation depth, and pin distance) by a personal computer, was used to measure 2PD threshold. The stimulus conditions were set at the following parameters based on the optimal measurement conditions of 2PD obtained in our previous study (Yokota et al. 2020): speed, 10.0 mm/s; penetration depth, 1.0 mm; and presentation time, 1.0 s. We have previously confirmed that the 2PD measured using this device shows good reproducibility (Yokota et al. 2020). 2PD measurements consisted of 16 blocks, and a total of 10 types of stimuli to the right index finger pad, including 1 point (0 mm between stimulus pins) or 2 points (9 types of stimuli ranging from 1 to 5.0 mm at 0.5-mm interpin intervals), were presented randomly in each block. We explained that the 2 points should only be considered if they could be clearly identified as 2 points, whereas other vague stimuli and 1 point should be defined as 1 point. The participants were also instructed to respond by pushing the button held in their left hand when they recognized the stimulus. To analyze the data, the distance between the pins and the correct answer rate were plotted with a logistic regression line fitted using MATLAB (Matlab R2020a, MathWorks, Natick, MA). Thresholds at the correct rates of 50% as 2PD threshold were calculated based on the psychophysical curve using logistic regression analysis.
Magnetic resonance imaging data acquisition
Magnetic resonance data were acquired using a 3 T Vantage Galan magnetic resonance imaging (MRI) scanner (Canon Medical Systems, Tochigi, Japan) with a 32-channel head coil (QD coil, 32ch head SPEEDER, Atlas SPEEDER head/neck). The head was fixed using a head position pad to prevent motion artifacts. Moreover, headphones were used to reduce discomfort from loud noises. Anatomical images were acquired using a T1-weighted 3D magnetization-prepared rapid gradient echo sequence with the following parameters: inversion time = 900 ms, repetition time = 5.8 ms, echo time = 2.7 ms, flip angle = 9°, slice thickness = 1.2 mm, field of view = 23 × 23 cm2, scan matrix = 256 × 256, number of slices = 160, and slice gap = nongap.
Structural analysis
Image preprocessing and VBM were performed using SPM12 (Statistical Parametric Mapping, Wellcome Department of Imaging Neuroscience Group, London, United Kingdom; http://www.fil.ion.ucl.ac.uk/spm) implemented in Matlab R2020a (MathWorks). The T1-weighted images used for the analysis were visually checked for motion artifacts. The AC-PC line was corrected automatically using the Matlab script for automatic AC-PC setting (http://www.nemotos.net/?p=17). The T1-weighted images were segmented into GM, white matter, and cerebrospinal fluid after bias correction (bias regularization: light; bias full-width at half-maximum [FWHM] cut-off: 60 mm). The warping functions generated by the Diffeomorphic Anatomical Registration Through Exponentiated Lie Algebra (DARTEL) algorithm were used to spatially normalize to Montreal Neurological Institute space and modulate them using Jacobian determinants derived from spatial normalization (Ashburner 2007). The customized template image for DARTEL was created based on 42 participants. We applied 8-mm FWHM Gaussian kernel for spatial smoothing in the analysis. The sum of the total GM and white matter volumes was calculated as the total brain volume.
Statistical analysis
First, regression analysis was performed using the multiple regression model implemented in SPM12 to identify the brain regions associated with the independent variables (2PD). In the regression model, total brain volumes, age, and handedness were entered as covariates. The correction of the multiple comparison was carried out as follows: statistical parametric maps set thresholds at P < 0.001 (uncorrected voxel level). The whole-brain analysis was corrected for multiple comparisons (P < 0.05, correcting at cluster level, using family-wise error [FWE] correction). Voxel-by-voxel FWE corrections of statistical results are often too conservative for whole-brain analyses. Therefore, when no significant associations were found, P < 0.001 (uncorrected voxel level) and expected voxels per cluster (k) > 89 contiguous voxels were used to reduce the probability of a type II statistical error. MRIcron software (www.people.cas.sc.edu/rorden/mricron) was used to illustrate VBM results.
Second, the regional GM volume of each brain region was calculated using the mask image created with the Automatic Anatomical Labeling (AAL) atlas (Tzourio-Mazoyer et al. 2002) included in the WFU_PickAtlas software version 3.0.5 (NeuroImaging Tools & Resources Collaboratory, https://www.nitrc.org/projects/wfu_pickatlas/). All 116 mask images (54 images in the right and left hemispheres and 8 images in the cerebellar vermis) were created, and GM volume in each region was normalized to each participant’s total brain volume. The relationship between 2PD threshold and GM volume in each cortical region was analyzed with Pearson correlation analysis using IBM SPSS statistics version 24.0 (IBM, New York). Statistical significance was set at a P value of <0.01.
Results
The sigmoid curve of the 2PD test is shown in Fig. 1a. The 2PD threshold was 2.58 ± 0.54 mm (mean ± SD, Fig. 1b). There were no sex differences in 2PD thresholds (male: 2.65 ± 0.58 mm; female: 2.50 ± 0.50 mm). The left middle temporal gyrus to the IPL was positively correlated with the 2PD threshold. The lower the GM volume in this area, the lower the 2PD threshold (better sensory function) (P < 0.05, correcting at cluster level, using FWE correction, Table 1 and Fig. 2). Meanwhile, a region in the left cerebellum was found to correlate negatively with the 2PD threshold, although it could not endure multiple corrections (P = 1.51E-05, uncorrected, Table 1 and Fig. 2).
Fig. 1.
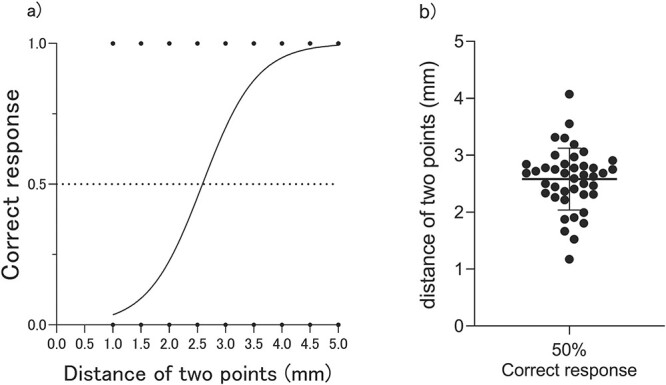
Results of 2PD measurements. (a) Mean psychophysical curve in 2PD measurement for all participants. (b) Individual 2PD threshold for all participants.
Table 1.
Cortical regions correlated with the 2PD threshold.
| Cluster level | Peak level | MNI coordinates | ||||||||
|---|---|---|---|---|---|---|---|---|---|---|
| p | KE | p | T | Z | p | x, y, z (mm) | ||||
| Anatomical region | (FWE) | size | (unc) | value | score | (unc) | x | y | z | |
| Positivea | Lt. middle temporal gyrus | 0.00 | 1679.0 | 0.00 | 4.759 | 4.177 | 0.000 | −56 | −50 | 12 |
| Lt. IPS (hIP1)-IPL | 4.702 | 4.136 | 0.000 | −42 | −53 | 38 | ||||
| Lt. IPL | 4.668 | 4.112 | 0.000 | −56 | −66 | 32 | ||||
| Negativeb | Lt. cerebellum (crus I) | 0.87 | 88.0 | 0.29 | 4.174 | 3.754 | 0.000 | −53 | −59 | −30 |
Lt, left; unc, uncorrected; MNI, Montreal Neurological Institute.
a P < 0.05, correcting at cluster level, using FWE correction.
b P < 0.001 (uncorrected voxel level) and expected voxels per cluster (k) > 89 contiguous voxels.
Fig. 2.

Association between 2PD threshold and GM volume based on VBM analysis. Clusters in green indicate a significant positive association with 2PD threshold; that is, the lower the GM volume, the lower the 2PD threshold (higher somatosensory function). Clusters are focused in the left middle temporal gyrus and IPL (P < 0.05, correcting at cluster level using FWE correction). Clusters in red indicate a negative association; that is, the higher the GM volume, the lower the 2PD threshold (higher somatosensory function). Clusters are focused in the left cerebellum crus I (P < 0.001, uncorrected voxel level, with expected voxels per cluster, k, > 89 contiguous voxels).
Table 2 shows the results of correlation analysis between the 2PD threshold and GM volume in each regional area, which were calculated using the mask image created with the AAL atlas. Overall, 6 of the 116 regions showed a positive correlation with the 2PD threshold (P < 0.01); that is, the lower the 2PD threshold (better sensory function), the lower the GM volume. These 6 regions were the left middle temporal gyrus, left superior frontal gyrus (dorsolateral), left IPL, left primary motor cortex, right middle frontal gyrus, and right middle temporal gyrus (Table 2 and Fig. 3). Meanwhile, the left cerebellar lobule VIII, right cerebellar crus II, and right cerebellar lobule VII showed a negative correlation with the 2PD threshold (P < 0.01); that is, the lower the 2PD threshold (better sensory function), the higher the GM volume (Table 2 and Fig. 3).
Table 2.
Brain regions with significant correlation between GM volume and 2PD threshold (n = 116 brain regions).
| Anatomical regionb | Left hemisphere | Right hemisphere | ||||||
|---|---|---|---|---|---|---|---|---|
| r | P | r | P | |||||
| Central region | ||||||||
| Precentral gyrus | 0.394 | a | 0.0099 | 0.080 | 0.6142 | |||
| Postcentral gyrus | 0.117 | 0.4600 | 0.305 | 0.0493 | ||||
| Rolandic operculum | 0.206 | 0.1905 | 0.219 | 0.1633 | ||||
| Frontal lobe | ||||||||
| Lateral surface | ||||||||
| Superior frontal gyrus, dorsolateral | 0.415 | a | 0.0063 | 0.377 | 0.0138 | |||
| Middle frontal gyrus | 0.292 | 0.0604 | 0.427 | a | 0.0048 | |||
| IFG, opercular part | 0.103 | 0.5179 | 0.076 | 0.6305 | ||||
| IFG, triangular part | −0.010 | 0.9513 | 0.083 | 0.6027 | ||||
| Medial surface | ||||||||
| Superior frontal gyrus, medial | 0.255 | 0.1032 | 0.115 | 0.4665 | ||||
| Supplementary motor area | 0.127 | 0.4225 | 0.199 | 0.2058 | ||||
| Paracentral lobule | 0.278 | 0.0745 | 0.185 | 0.2419 | ||||
| Orbital surface | ||||||||
| Superior frontal gyrus, orbital part | 0.069 | 0.6644 | −0.059 | 0.7114 | ||||
| Superior frontal gyrus, medial orbital | 0.001 | 0.9974 | −0.026 | 0.8679 | ||||
| Middle frontal gyrus, orbital part | −0.047 | 0.7694 | −0.089 | 0.5760 | ||||
| IFG, orbital | 0.073 | 0.6438 | 0.249 | 0.1117 | ||||
| Gyrus rectus | 0.192 | 0.2238 | 0.038 | 0.8129 | ||||
| Olfactory cortex | 0.189 | 0.2303 | 0.161 | 0.3090 | ||||
| Temporal lobe | ||||||||
| Lateral surface | ||||||||
| Superior temporal gyrus | 0.274 | 0.0787 | 0.372 | 0.0154 | ||||
| Middle temporal gyrus | 0.545 | a | 0.0002 | 0.407 | a | 0.0074 | ||
| Inferior temporal gyrus | 0.329 | 0.0334 | 0.349 | 0.0233 | ||||
| Heschl gyrus | 0.120 | 0.4476 | 0.190 | 0.2269 | ||||
| Parietal lobe | ||||||||
| Lateral surface | ||||||||
| Superior parietal gyrus | 0.331 | 0.0325 | 0.326 | 0.0352 | ||||
| Inferior parietal gyrus | 0.407 | a | 0.0074 | −0.115 | 0.4668 | |||
| Angular gyrus | 0.378 | 0.0137 | −0.040 | 0.8018 | ||||
| Supramarginal gyrus | 0.044 | 0.7844 | 0.269 | 0.0847 | ||||
| Medial surface | ||||||||
| Precuneus | 0.115 | 0.4689 | 0.022 | 0.8892 | ||||
| Occipital lobe | ||||||||
| Lateral surface | ||||||||
| Superior occipital gyrus | 0.131 | 0.4087 | −0.070 | 0.6592 | ||||
| Middle occipital gyrus | 0.105 | 0.5083 | −0.045 | 0.7784 | ||||
| Inferior occipital gyrus | 0.168 | 0.2887 | 0.044 | 0.7810 | ||||
| Medial and inferior surface | ||||||||
| Cuneus | −0.095 | 0.5506 | −0.137 | 0.3886 | ||||
| Calcarine fissure and surrounding cortex | −0.290 | 0.0626 | −0.225 | 0.1525 | ||||
| Lingual gyrus | 0.106 | 0.5055 | −0.015 | 0.9265 | ||||
| Fusiform gyrus | 0.101 | 0.5236 | 0.104 | 0.5128 | ||||
| Limbic lobe | ||||||||
| Temporal pole: superior temporal gyrus | 0.139 | 0.3784 | 0.129 | 0.4151 | ||||
| Temporal pole: middle temporal gyrus | 0.073 | 0.6473 | 0.291 | 0.0617 | ||||
| Anterior cingulate and paracingulate gyri | 0.276 | 0.0768 | 0.349 | 0.0237 | ||||
| Median cingulate and paracingulate gyri | 0.184 | 0.2439 | 0.253 | 0.1055 | ||||
| Posterior cingulate gyrus | 0.278 | 0.0743 | 0.059 | 0.7093 | ||||
| Hippocampus | 0.008 | 0.9614 | 0.102 | 0.5216 | ||||
| Para hippocampus gyrus | −0.029 | 0.8532 | 0.154 | 0.3301 | ||||
| Insula | ||||||||
| Insula | −0.027 | 0.8647 | 0.129 | 0.4169 | ||||
| Subcortical gray nuclei | ||||||||
| Amygdala | −0.019 | 0.9073 | 0.073 | 0.6455 | ||||
| Caudate nucleus | 0.002 | 0.9902 | −0.004 | 0.9797 | ||||
| Putamen | −0.013 | 0.9342 | −0.024 | 0.8793 | ||||
| Pallidum | −0.029 | 0.8559 | −0.107 | 0.4995 | ||||
| Thalamus | 0.016 | 0.9191 | −0.066 | 0.6790 | ||||
| Cerebellum | ||||||||
| Hemisphere | ||||||||
| Cerebellum crus I | −0.369 | 0.0161 | −0.243 | 0.1205 | ||||
| Cerebellum crus II | −0.275 | 0.0774 | −0.408 | a | 0.0074 | |||
| Cerebellum III | −0.050 | 0.7553 | −0.182 | 0.2490 | ||||
| Cerebellum IV–V | −0.109 | 0.4917 | −0.204 | 0.1939 | ||||
| Cerebellum VI | −0.146 | 0.3565 | −0.187 | 0.2347 | ||||
| Cerebellum VII | −0.377 | 0.0138 | −0.394 | a | 0.0097 | |||
| Cerebellum VIII | −0.492 | a | 0.0009 | −0.36 | 0.0194 | |||
| Cerebellum IX | −0.303 | 0.0514 | −0.216 | 0.1704 | ||||
| Cerebellum X | −0.187 | 0.2345 | 0.006 | 0.9683 | ||||
| Vermis | ||||||||
| Vermis I–II | 0.079 | 0.6177 | ||||||
| Vermis III | −0.190 | 0.2273 | ||||||
| Vermis IV–V | −0.234 | 0.1360 | ||||||
| Vermis VI | −0.171 | 0.2802 | ||||||
| Vermis VII | −0.141 | 0.3726 | ||||||
| Vermis VIII | −0.325 | 0.0358 | ||||||
| Vermis IX | −0.328 | 0.0342 | ||||||
| Vermis X | −0.163 | 0.3014 | ||||||
a P < 0.01.
bEach brain region is calculated using the mask image created with the AAL atlas (Tzourio-Mazoyer et al. 2002).
Fig. 3.

Relationship between 2PD threshold and GM volume at each brain region that showed significant correlations with the 2PD threshold. Each region is calculated using the mask image created with the AAL atlas. A total of 6 regions positively correlate with the 2PD threshold (P < 0.01); that is, the lower the 2PD threshold (better sensory function), the lower the GM volume. Meanwhile, 3 regions negatively correlate with the 2PD threshold (P < 0.01); that is, the lower the 2PD threshold, the higher the GM volume. All these regions are found in the cerebellum. (a) Lt. middle temporal gyrus, (b) Lt. cerebellum VIII, (c) Rt. middle frontal gyrus, (d) Lt. superior frontal gyrus (dorsolateral), (e) Rt. cerebellum crus II, (f) Rt. middle temporal gyrus, (g) Lt. IPL, (h) Rt. cerebellum VII, and (i) Lt. primary motor cortex.
Discussion
Evidence on the relationship between 2PD and cortical GM volume is limited. The results of whole-brain analysis in the current study showed that a low 2PD threshold (i.e. better sensory function) was associated with lower GM volume from the middle temporal gyrus to the IPL in the contralateral hemisphere. Furthermore, analysis of ALL labels revealed that GM volumes in the contralateral middle temporal gyrus, IPL, superior frontal gyrus (dorsolateral), primary motor cortex, ipsilateral middle temporal gyrus, and middle prefrontal cortex were significantly correlated with the 2PD threshold, indicating that the better the sensory function, the lower the GM volume. The current study findings are useful to further elucidate the relationship between individual differences in somatosensory function and brain structure and may contribute to understanding the characteristics of individuals with sharp somatosensory functions.
The middle temporal gyrus and IPL showed the strongest positive correlation with the 2PD threshold; that is, the better the performance, the smaller the GM volume in these regions. This may be due to the presence of the hMT+/V5 area and the TPJ in the posterior superior portion of the middle temporal gyrus. The hMT+/V5 area, which has been reported to be active during dynamic tactile stimulation, contributes to the performance of somatosensory function (Summers et al. 2009; Wacker et al. 2011; van Kemenade et al. 2014). In addition, the TPJ is not only activated during somatosensory discrimination tasks (Van Boven et al. 2005) but has also been reported to be associated with attentional function (Geng and Vossel 2013; Dugue et al. 2018). Given that attention alters the activity in the S2 cortex, which is involved in somatosensory information processing (Hsiao et al. 2002), it is possible that the participants with good somatosensory performance also had better attentiveness to stimulation. The IPS and angular gyrus, located postero-inferiorly to the IPL, also play important roles in attentional function (Rushworth and Taylor 2006; Chechlacz et al. 2012) and perceptual decision-making (Ploran et al. 2007; Tosoni et al. 2008; Ho et al. 2009; Studer et al. 2014; Wu et al. 2021). The 2PD test requires the test administrator’s judgment regarding to whether a given stimulus should be allotted 1 or 2 points. Therefore, the neural basis of perceptual decision-making may be involved in the 2PD threshold. Moreover, the IPL, superior frontal gurus (dorsolateral), and primary motor cortex are also activated during somatosensory stimulation or somatosensory discrimination tasks (Inui et al. 2004; Van Boven et al. 2005; Kitada et al. 2006; Pleger et al. 2006; Terumitsu et al. 2009; van Kemenade et al. 2014; Gomez et al. 2021; Jung et al. 2021).
Regarding the relationship between GM volume and performance, some reports indicate that training and specific experiences increase GM volume in certain regions, while others cause a decrease. For example, mental arithmetic training decreases the GM volume in the superior temporal gyrus and DLPFC (Takeuchi et al. 2011b), while oral reading training decreases the GM volume in the superior temporal gyrus (Takeuchi et al. 2011a; Maruyama et al. 2018). Moreover, lower GM volumes in specific areas are reportedly associated with better music perception (Hyde et al. 2007; Bermudez et al. 2009) and higher concentration (Kanai et al. 2011). Furthermore, the GM volume in the inferior temporal gyrus, middle temporal gyrus, and IPL has recently been identified as being increased in autism spectrum disorder with impaired attention (Cai et al. 2018; Kobayashi et al. 2020; Lukito et al. 2020; Yaxu et al. 2020), and this has been attributed to brain overgrowth (Kobayashi et al. 2020). Thus, lower GM volume is reportedly associated with better performance. Furthermore, healthy individuals with higher rectal sensitivity (lower threshold) to visceral pain reportedly have lower GM volumes in the thalamus, insula, amygdala, and cingulate gyrus (Elsenbruch et al. 2014). Moreover, a lower threshold to thermal stimuli (more sensitive) denotes a lower GM volume in the IPL, IPS, posterior cingulate gyrus, and S1 (Erpelding et al. 2012). Consistent with these reports, the current study found that the GM volume of the cerebral cortex involved in somatosensory information processing was smaller in individuals with more sharp somatosensory functions.
Although it is difficult to interpret the cellular and molecular events behind the GM volume calculated from human MR images, cell density, cell size, synaptic density, myelin sheath, glial cell size and number, capillaries, water content, and GABAa receptor are thought to influence GM volume (Morrison and Hof 1997; Draganski et al. 2004; Zatorre et al. 2012; Pomares et al. 2017). However, it is unclear which of these factors affect the results of the current study, and thus, the reason for the negative correlation between sensory performance and GM volume is unclear. It is possible that the GM volume declines with growth (Sowell et al. 2003; Gogtay et al. 2004), that synaptic pruning in the cerebral cortex occurs during adolescence (Huttenlocher and Dabholkar 1997; Petanjek et al. 2011), and that removing weak synapses improves the computational performance in cortical regions (Chechik et al. 1999). Furthermore, the balloon model indicates that the stretching of the GM with myelin growth and GM thinning improves the ability to distinguish signals (Harasty et al. 2003; Seldon 2005, 2007). Kanai et al. (2011) highlighted that a smaller volume as a result of pruning to remove inefficient synapses and neurons enables more efficient processing (Kanai and Rees 2011).
We agree with these ideas. However, many studies have reported increases in GM volume due to specific experiences and training, such as in taxi drivers (Maguire et al. 2000), pilots (Qiu et al. 2021), dancers (Hufner et al. 2011), and jugglers (Draganski et al. 2004). Moreover, although the cause for this difference is unclear, it may be due to nonlinear changes in the GM volume which are influenced by the length and intensity of training, which decrease following an initial increase, as advocated by Takeuchi and colleagues (Takeuchi et al. 2011b). The present study assessed healthy young adults with no special training; thus, the changes were not an effect of short-term training. Specifically, the somatosensory function in this study might have been due to growth-related loss of synapses or decrease in GM volume from myelin growth rather than a temporary change in the GM volume due to a short training period. However, these are only speculations, and they need to be verified in future animal experiments.
The present study found a negative correlation between 2PD threshold and cerebellar GM volume, indicating that the better the sensory function, the larger the cerebellar GM volume. However, the whole-brain analysis could not withstand multiple comparison correction, and thus, the results should be interpreted with caution. The cerebellum is not only important for movement and speech, but it is also activated in somatosensory stimulation or somatosensory discrimination tasks (Gao et al. 1996; Pastor et al. 2004; Kitada et al. 2006; van der Zwaag et al. 2013; van Kemenade et al. 2014). Furthermore, it is active during cognitive tasks (Stoodley and Schmahmann 2010, 2018; Stoodley et al. 2012; Guell et al. 2018). These findings indicate that the relationship between 2PD threshold and the cerebellar GM volume is reasonable. However, in contrast to the results for the cerebral cortex, there was a positive correlation between performance and GM volume in the cerebellum. The developmental process of the cerebellum differs from that of the cerebral cortex (Stoessel and Majewska 2021), which may account for this difference in 2PD threshold and GM volume relationship. However, the reason for this is unclear and requires further investigation.
Schmidt-Wilcke and others have reported that a lower 2PD threshold (better sensory function) indicates a larger thalamus and S1 volume (Schmidt-Wilcke et al. 2018); however, this was not observed in the present study. The thalamus volume calculated by VBM is somewhat less reproducible (Watanabe et al. 2021). This may explain why the results of the relationship between GM volume of the thalamus and 2PD reported by Schmidt-Wilcke et al. could not be reproduced. However, the reason for the lack of a significant correlation between S1 volume and the 2PD threshold in the current study is unclear, although this might have been due to the difference in the testing method for 2PD. Although we similarly measured 2PD with precision instruments and defined the 2PD threshold at 50%, the mean 2PD threshold was 2.58 mm in our study, whereas it was 1.59 mm in the study by Schmidt-Wilcke et al. This might have influenced the results, but the specific cause is unknown.
A limitation of this study is that although VBM is an excellent tool for analyzing minute morphological changes in the human brain, the type of morphological change induced is unclear. Moreover, the correlation analysis of ALL labels was not corrected for multiple comparisons to reduce the probability of type II statistical errors. However, all regions that correlated with the 2PD threshold (P < 0.01) are involved in somatosensory information processing, and the results are reasonable and complementary to the results of the whole-brain analysis. Furthermore, because we only included young healthy individuals, it is unclear whether similar trends exist in other age groups or in patients with neurological disorders. Further research is needed in these populations.
In conclusion, whole-brain analysis indicates that a lower GM volume in the middle temporal gyrus and IPL leads to a better somatosensory function. Thus, cortical GM volume may be a biomarker for somatosensory function. The results of this study can contribute to the understanding of individual differences in somatosensory function in young healthy subjects.
Acknowledgements
The authors would like to thank Editage (www.editage.com) for the English language review.
Contributor Information
Hideaki Onishi, Institute for Human Movement and Medical Sciences, Niigata University of Health and Welfare, 1398 Shimami-cho, Kita-Ku, Niigata City, Niigata 950-3198, Japan; Department of Physical Therapy, Niigata University of Health and Welfare, Niigata City, Niigata 950-3198, Japan.
Kazuaki Nagasaka, Institute for Human Movement and Medical Sciences, Niigata University of Health and Welfare, 1398 Shimami-cho, Kita-Ku, Niigata City, Niigata 950-3198, Japan; Department of Physical Therapy, Niigata University of Health and Welfare, Niigata City, Niigata 950-3198, Japan.
Hirotake Yokota, Institute for Human Movement and Medical Sciences, Niigata University of Health and Welfare, 1398 Shimami-cho, Kita-Ku, Niigata City, Niigata 950-3198, Japan; Department of Physical Therapy, Niigata University of Health and Welfare, Niigata City, Niigata 950-3198, Japan.
Sho Kojima, Institute for Human Movement and Medical Sciences, Niigata University of Health and Welfare, 1398 Shimami-cho, Kita-Ku, Niigata City, Niigata 950-3198, Japan; Department of Physical Therapy, Niigata University of Health and Welfare, Niigata City, Niigata 950-3198, Japan.
Ken Ohno, Institute for Human Movement and Medical Sciences, Niigata University of Health and Welfare, 1398 Shimami-cho, Kita-Ku, Niigata City, Niigata 950-3198, Japan; Department of Radiological Technology, Niigata University of Health and Welfare, Niigata City, Niigata 950-3198, Japan.
Noriko Sakurai, Institute for Human Movement and Medical Sciences, Niigata University of Health and Welfare, 1398 Shimami-cho, Kita-Ku, Niigata City, Niigata 950-3198, Japan; Department of Radiological Technology, Niigata University of Health and Welfare, Niigata City, Niigata 950-3198, Japan.
Naoki Kodama, Institute for Human Movement and Medical Sciences, Niigata University of Health and Welfare, 1398 Shimami-cho, Kita-Ku, Niigata City, Niigata 950-3198, Japan; Department of Radiological Technology, Niigata University of Health and Welfare, Niigata City, Niigata 950-3198, Japan.
Daisuke Sato, Institute for Human Movement and Medical Sciences, Niigata University of Health and Welfare, 1398 Shimami-cho, Kita-Ku, Niigata City, Niigata 950-3198, Japan; Department of Health and Sports, Niigata University of Health and Welfare, Niigata City, Niigata 950-3198, Japan.
Naofumi Otsuru, Institute for Human Movement and Medical Sciences, Niigata University of Health and Welfare, 1398 Shimami-cho, Kita-Ku, Niigata City, Niigata 950-3198, Japan; Department of Physical Therapy, Niigata University of Health and Welfare, Niigata City, Niigata 950-3198, Japan.
Funding
This work supported by the Grant-in-Aid for Scientific Research from the Japan Society for the Promotion of Science (grant numbers 19H01090 and 20 K20621) and the Grant-in-Aid program from Niigata University of Health and Welfare (grant number R03C10).
Conflict of interest statement: None declared.
Data and code availability statement
The data that support the findings of this study are available from the corresponding author upon reasonable request.
References
- Akatsuka K, Noguchi Y, Harada T, Sadato N, Kakigi R. Neural codes for somatosensory two-point discrimination in inferior parietal lobule: an fMRI study. NeuroImage. 2008:40:852–858. [DOI] [PubMed] [Google Scholar]
- Ashburner J. A fast diffeomorphic image registration algorithm. NeuroImage. 2007:38:95–113. [DOI] [PubMed] [Google Scholar]
- Bermudez P, Lerch JP, Evans AC, Zatorre RJ. Neuroanatomical correlates of musicianship as revealed by cortical thickness and voxel-based morphometry. Cereb Cortex. 2009:19:1583–1596. [DOI] [PubMed] [Google Scholar]
- Bezzola L, Merillat S, Gaser C, Jancke L. Training-induced neural plasticity in golf novices. J Neurosci. 2011:31:12444–12448. [DOI] [PMC free article] [PubMed] [Google Scholar]
- Boyke J, Driemeyer J, Gaser C, Buchel C, May A. Training-induced brain structure changes in the elderly. J Neurosci. 2008:28:7031–7035. [DOI] [PMC free article] [PubMed] [Google Scholar]
- Cai J, Hu X, Guo K, Yang P, Situ M, Huang Y. Increased left inferior temporal gyrus was found in both low function autism and high function autism. Front Psych. 2018:9:542. [DOI] [PMC free article] [PubMed] [Google Scholar]
- Cannonieri GC, Bonilha L, Fernandes PT, Cendes F, Li LM. Practice and perfect: length of training and structural brain changes in experienced typists. Neuroreport. 2007:18:1063–1066. [DOI] [PubMed] [Google Scholar]
- Chechik G, Meilijson I, Ruppin E. Neuronal regulation: a mechanism for synaptic pruning during brain maturation. Neural Comput. 1999:11:2061–2080. [DOI] [PubMed] [Google Scholar]
- Chechlacz M, Rotshtein P, Humphreys GW. Neuroanatomical dissections of unilateral visual neglect symptoms: ALE meta-analysis of lesion-symptom mapping. Front Hum Neurosci. 2012:6:230. [DOI] [PMC free article] [PubMed] [Google Scholar]
- Draganski B, Gaser C, Busch V, Schuierer G, Bogdahn U, May A. Neuroplasticity: changes in grey matter induced by training. Nature. 2004:427:311–312. [DOI] [PubMed] [Google Scholar]
- Dugue L, Merriam EP, Heeger DJ, Carrasco M. Specific visual subregions of TPJ mediate reorienting of spatial attention. Cereb Cortex. 2018:28:2375–2390. [DOI] [PMC free article] [PubMed] [Google Scholar]
- Elsenbruch S, Schmid J, Kullmann JS, Kattoor J, Theysohn N, Forsting M, Kotsis V. Visceral sensitivity correlates with decreased regional gray matter volume in healthy volunteers: a voxel-based morphometry study. Pain. 2014:155:244–249. [DOI] [PubMed] [Google Scholar]
- Erpelding N, Moayedi M, Davis KD. Cortical thickness correlates of pain and temperature sensitivity. Pain. 2012:153:1602–1609. [DOI] [PubMed] [Google Scholar]
- Gao JH, Parsons LM, Bower JM, Xiong J, Li J, Fox PT. Cerebellum implicated in sensory acquisition and discrimination rather than motor control. Science. 1996:272:545–547. [DOI] [PubMed] [Google Scholar]
- Gaser C, Schlaug G. Brain structures differ between musicians and non-musicians. J Neurosci. 2003:23:9240–9245. [DOI] [PMC free article] [PubMed] [Google Scholar]
- Geng JJ, Vossel S. Re-evaluating the role of TPJ in attentional control: contextual updating? Neurosci Biobehav Rev. 2013:37:2608–2620. [DOI] [PMC free article] [PubMed] [Google Scholar]
- Gerber P, Schlaffke L, Heba S, Greenlee MW, Schultz T, Schmidt-Wilcke T. Juggling revisited - a voxel-based morphometry study with expert jugglers. NeuroImage. 2014:95:320–325. [DOI] [PubMed] [Google Scholar]
- Gogtay N, Giedd JN, Lusk L, Hayashi KM, Greenstein D, Vaituzis AC, Nugent TF 3rd, Herman DH, Clasen LS, Toga AW, et al. Dynamic mapping of human cortical development during childhood through early adulthood. Proc Natl Acad Sci U S A. 2004:101:8174–8179. [DOI] [PMC free article] [PubMed] [Google Scholar]
- Gomez LJ, Dooley JC, Sokoloff G, Blumberg MS. Parallel and serial sensory processing in developing primary somatosensory and motor cortex. J Neurosci. 2021:41:3418–3431. [DOI] [PMC free article] [PubMed] [Google Scholar]
- Guell X, Gabrieli JDE, Schmahmann JD. Triple representation of language, working memory, social and emotion processing in the cerebellum: convergent evidence from task and seed-based resting-state fMRI analyses in a single large cohort. NeuroImage. 2018:172:437–449. [DOI] [PMC free article] [PubMed] [Google Scholar]
- Harasty J, Seldon HL, Chan P, Halliday G, Harding A. The left human speech-processing cortex is thinner but longer than the right. Laterality. 2003:8:247–260. [DOI] [PubMed] [Google Scholar]
- Ho TC, Brown S, Serences JT. Domain general mechanisms of perceptual decision making in human cortex. J Neurosci. 2009:29:8675–8687. [DOI] [PMC free article] [PubMed] [Google Scholar]
- Hsiao SS, Lane J, Fitzgerald P. Representation of orientation in the somatosensory system. Behav Brain Res. 2002:135:93–103. [DOI] [PubMed] [Google Scholar]
- Hufner K, Binetti C, Hamilton DA, Stephan T, Flanagin VL, Linn J, Labudda K, Markowitsch H, Glasauer S, Jahn K, et al. Structural and functional plasticity of the hippocampal formation in professional dancers and slackliners. Hippocampus. 2011:21:855–865. [DOI] [PubMed] [Google Scholar]
- Huttenlocher PR, Dabholkar AS. Regional differences in synaptogenesis in human cerebral cortex. J Comp Neurol. 1997:387:167–178. [DOI] [PubMed] [Google Scholar]
- Hyde KL, Lerch JP, Zatorre RJ, Griffiths TD, Evans AC, Peretz I. Cortical thickness in congenital amusia: when less is better than more. J Neurosci. 2007:27:13028–13032. [DOI] [PMC free article] [PubMed] [Google Scholar]
- Inui K, Wang X, Tamura Y, Kaneoke Y, Kakigi R. Serial processing in the human somatosensory system. Cereb Cortex. 2004:14:851–857. [DOI] [PubMed] [Google Scholar]
- Jung WB, Im GH, Jiang H, Kim SG. Early fMRI responses to somatosensory and optogenetic stimulation reflect neural information flow. Proc Natl Acad Sci U S A. 2021:118(11):e2023265118. [DOI] [PMC free article] [PubMed] [Google Scholar]
- Kanai R, Rees G. The structural basis of inter-individual differences in human behaviour and cognition. Nat Rev Neurosci. 2011:12:231–242. [DOI] [PubMed] [Google Scholar]
- Kanai R, Dong MY, Bahrami B, Rees G. Distractibility in daily life is reflected in the structure and function of human parietal cortex. J Neurosci. 2011:31:6620–6626. [DOI] [PMC free article] [PubMed] [Google Scholar]
- Kitada R, Kito T, Saito DN, Kochiyama T, Matsumura M, Sadato N, Lederman SJ. Multisensory activation of the intraparietal area when classifying grating orientation: a functional magnetic resonance imaging study. J Neurosci. 2006:26:7491–7501. [DOI] [PMC free article] [PubMed] [Google Scholar]
- Kobayashi A, Yokota S, Takeuchi H, Asano K, Asano M, Sassa Y, Taki Y, Kawashima R. Increased grey matter volume of the right superior temporal gyrus in healthy children with autistic cognitive style: a VBM study. Brain Cogn. 2020:139:105514. [DOI] [PubMed] [Google Scholar]
- Li Hegner Y, Lee Y, Grodd W, Braun C. Comparing tactile pattern and vibrotactile frequency discrimination: a human FMRI study. J Neurophysiol. 2010:103:3115–3122. [DOI] [PubMed] [Google Scholar]
- Li Hegner Y, Lindner A, Braun C. Cortical correlates of perceptual decision making during tactile spatial pattern discrimination. Hum Brain Mapp. 2015:36:3339–3350. [DOI] [PMC free article] [PubMed] [Google Scholar]
- Lukito S, Norman L, Carlisi C, Radua J, Hart H, Simonoff E, Rubia K. Comparative meta-analyses of brain structural and functional abnormalities during cognitive control in attention-deficit/hyperactivity disorder and autism spectrum disorder. Psychol Med. 2020:50:894–919. [DOI] [PMC free article] [PubMed] [Google Scholar]
- Maguire EA, Gadian DG, Johnsrude IS, Good CD, Ashburner J, Frackowiak RS, Frith CD. Navigation-related structural change in the hippocampi of taxi drivers. Proc Natl Acad Sci U S A. 2000:97:4398–4403. [DOI] [PMC free article] [PubMed] [Google Scholar]
- Maruyama T, Takeuchi H, Taki Y, Motoki K, Jeong H, Kotozaki Y, Nakagawa S, Nouchi R, Iizuka K, Yokoyama R, et al. Effects of time-compressed speech training on multiple functional and structural neural mechanisms involving the left superior temporal gyrus. Neural Plast. 2018:2018:6574178. [DOI] [PMC free article] [PubMed] [Google Scholar]
- Morrison JH, Hof PR. Life and death of neurons in the aging brain. Science. 1997:278:412–419. [DOI] [PubMed] [Google Scholar]
- Oldfield RC. The assessment and analysis of handedness: the Edinburgh inventory. Neuropsychologia. 1971:9:97–113. [DOI] [PubMed] [Google Scholar]
- Pastor MA, Day BL, Macaluso E, Friston KJ, Frackowiak RS. The functional neuroanatomy of temporal discrimination. J Neurosci. 2004:24:2585–2591. [DOI] [PMC free article] [PubMed] [Google Scholar]
- Petanjek Z, Judas M, Simic G, Rasin MR, Uylings HB, Rakic P, Kostovic I. Extraordinary neoteny of synaptic spines in the human prefrontal cortex. Proc Natl Acad Sci U S A. 2011:108:13281–13286. [DOI] [PMC free article] [PubMed] [Google Scholar]
- Pleger B, Ruff CC, Blankenburg F, Bestmann S, Wiech K, Stephan KE, Capilla A, Friston KJ, Dolan RJ. Neural coding of tactile decisions in the human prefrontal cortex. J Neurosci. 2006:26:12596–12601. [DOI] [PMC free article] [PubMed] [Google Scholar]
- Ploran EJ, Nelson SM, Velanova K, Donaldson DI, Petersen SE, Wheeler ME. Evidence accumulation and the moment of recognition: dissociating perceptual recognition processes using fMRI. J Neurosci. 2007:27:11912–11924. [DOI] [PMC free article] [PubMed] [Google Scholar]
- Pomares FB, Funck T, Feier NA, Roy S, Daigle-Martel A, Ceko M, Narayanan S, Araujo D, Thiel A, Stikov N, et al. Histological underpinnings of grey matter changes in fibromyalgia investigated using multimodal brain imaging. J Neurosci. 2017:37:1090–1101. [DOI] [PMC free article] [PubMed] [Google Scholar]
- Qiu C, Zhao C, Hu G, Zhang Y, Zhu Y, Wu X, Wang L. Brain structural plasticity in visual and sensorimotor areas of airline pilots: a voxel-based morphometric study. Behav Brain Res. 2021:411:113377. [DOI] [PubMed] [Google Scholar]
- Rushworth MF, Taylor PC. TMS in the parietal cortex: updating representations for attention and action. Neuropsychologia. 2006:44:2700–2716. [DOI] [PubMed] [Google Scholar]
- Sampaio-Baptista C, Scholz J, Jenkinson M, Thomas AG, Filippini N, Smit G, Douaud G, Johansen-Berg H. Gray matter volume is associated with rate of subsequent skill learning after a long term training intervention. NeuroImage. 2014:96:158–166. [DOI] [PMC free article] [PubMed] [Google Scholar]
- Sarasso E, Agosta F, Temporiti F, Adamo P, Piccolo F, Copetti M, Gatti R, Filippi M. Brain motor functional changes after somatosensory discrimination training. Brain Imaging Behav. 2018:12:1011–1021. [DOI] [PubMed] [Google Scholar]
- Schlaffke L, Lissek S, Lenz M, Brune M, Juckel G, Hinrichs T, Platen P, Tegenthoff M, Schmidt-Wilcke T. Sports and brain morphology - a voxel-based morphometry study with endurance athletes and martial artists. Neuroscience. 2014:259:35–42. [DOI] [PubMed] [Google Scholar]
- Schmidt-Wilcke T, Wulms N, Heba S, Pleger B, Puts NA, Glaubitz B, Kalisch T, Tegenthoff M, Dinse HR. Structural changes in brain morphology induced by brief periods of repetitive sensory stimulation. NeuroImage. 2018:165:148–157. [DOI] [PubMed] [Google Scholar]
- Seldon HL. Does brain white matter growth expand the cortex like a balloon? Hypothesis and consequences. Laterality. 2005:10:81–95. [DOI] [PubMed] [Google Scholar]
- Seldon HL. Extended neocortical maturation time encompasses speciation, fatty acid and lateralization theories of the evolution of schizophrenia and creativity. Med Hypotheses. 2007:69:1085–1089. [DOI] [PubMed] [Google Scholar]
- Sowell ER, Peterson BS, Thompson PM, Welcome SE, Henkenius AL, Toga AW. Mapping cortical change across the human life span. Nat Neurosci. 2003:6:309–315. [DOI] [PubMed] [Google Scholar]
- Stoessel MB, Majewska AK. Little cells of the little brain: microglia in cerebellar development and function. Trends Neurosci. 2021:44:564–578. [DOI] [PMC free article] [PubMed] [Google Scholar]
- Stoodley CJ, Schmahmann JD. Evidence for topographic organization in the cerebellum of motor control versus cognitive and affective processing. Cortex. 2010:46:831–844. [DOI] [PMC free article] [PubMed] [Google Scholar]
- Stoodley CJ, Schmahmann JD. Functional topography of the human cerebellum. Handb Clin Neurol. 2018:154:59–70. [DOI] [PubMed] [Google Scholar]
- Stoodley CJ, Valera EM, Schmahmann JD. Functional topography of the cerebellum for motor and cognitive tasks: an fMRI study. NeuroImage. 2012:59:1560–1570. [DOI] [PMC free article] [PubMed] [Google Scholar]
- Studer B, Cen D, Walsh V. The angular gyrus and visuospatial attention in decision-making under risk. NeuroImage. 2014:103:75–80. [DOI] [PubMed] [Google Scholar]
- Summers IR, Francis ST, Bowtell RW, McGlone FP, Clemence M. A functional-magnetic-resonance-imaging investigation of cortical activation from moving vibrotactile stimuli on the fingertip. J Acoust Soc Am. 2009:125:1033–1039. [DOI] [PubMed] [Google Scholar]
- Takeuchi H, Taki Y, Hashizume H, Sassa Y, Nagase T, Nouchi R, Kawashima R. Effects of training of processing speed on neural systems. J Neurosci. 2011a:31:12139–12148. [DOI] [PMC free article] [PubMed] [Google Scholar]
- Takeuchi H, Taki Y, Sassa Y, Hashizume H, Sekiguchi A, Fukushima A, Kawashima R. Working memory training using mental calculation impacts regional gray matter of the frontal and parietal regions. PLoS One. 2011b:6:e23175. [DOI] [PMC free article] [PubMed] [Google Scholar]
- Takeuchi H, Maruyama T, Taki Y, Motoki K, Jeong H, Kotozaki Y, Shinada T, Nakagawa S, Nouchi R, Iizuka K, et al. Effects of training of shadowing and reading aloud of second language on working memory and neural systems. Brain Imaging Behav. 2021:15:1253–1269. [DOI] [PMC free article] [PubMed] [Google Scholar]
- Terumitsu M, Ikeda K, Kwee IL, Nakada T. Participation of primary motor cortex area 4a in complex sensory processing: 3.0-T fMRI study. Neuroreport. 2009:20:679–683. [DOI] [PubMed] [Google Scholar]
- Tosoni A, Galati G, Romani GL, Corbetta M. Sensory-motor mechanisms in human parietal cortex underlie arbitrary visual decisions. Nat Neurosci. 2008:11:1446–1453. [DOI] [PMC free article] [PubMed] [Google Scholar]
- Tzourio-Mazoyer N, Landeau B, Papathanassiou D, Crivello F, Etard O, Delcroix N, Mazoyer B, Joliot M. Automated anatomical labeling of activations in SPM using a macroscopic anatomical parcellation of the MNI MRI single-subject brain. NeuroImage. 2002:15:273–289. [DOI] [PubMed] [Google Scholar]
- Van Boven RW, Ingeholm JE, Beauchamp MS, Bikle PC, Ungerleider LG. Tactile form and location processing in the human brain. Proc Natl Acad Sci U S A. 2005:102:12601–12605. [DOI] [PMC free article] [PubMed] [Google Scholar]
- van Kemenade BM, Seymour K, Wacker E, Spitzer B, Blankenburg F, Sterzer P. Tactile and visual motion direction processing in hMT+/V5. NeuroImage. 2014:84:420–427. [DOI] [PubMed] [Google Scholar]
- Wacker E, Spitzer B, Lutzkendorf R, Bernarding J, Blankenburg F. Tactile motion and pattern processing assessed with high-field FMRI. PLoS One. 2011:6:e24860. [DOI] [PMC free article] [PubMed] [Google Scholar]
- Watanabe H, Kojima S, Nagasaka K, Ohno K, Sakurai N, Kodama N, Otsuru N, Onishi H. Gray matter volume variability in young healthy adults: influence of gender difference and brain-derived neurotrophic factor genotype. Cereb Cortex. 2021:bhab370. 10.1093/cercor/bhab370. [Online ahead of print]. [DOI] [PMC free article] [PubMed] [Google Scholar]
- Wu YH, Velenosi LA, Blankenburg F. Response modality-dependent categorical choice representations for vibrotactile comparisons. NeuroImage. 2021:226:117592. [DOI] [PubMed] [Google Scholar]
- Yaxu Y, Ren Z, Ward J, Jiang Q. Atypical brain structures as a function of gray matter volume (GMV) and gray matter density (GMD) in young adults relating to autism spectrum traits. Front Psychol. 2020:11:523. [DOI] [PMC free article] [PubMed] [Google Scholar]
- Yokota H, Otsuru N, Kikuchi R, Suzuki R, Kojima S, Saito K, Miyaguchi S, Inukai Y, Onishi H. Establishment of optimal two-point discrimination test method and consideration of reproducibility. Neurosci Lett. 2020:714:134525. [DOI] [PubMed] [Google Scholar]
- Yokota H, Otsuru N, Saito K, Kojima S, Miyaguchi S, Inukai Y, Nagasaka K, Onishi H. Region-specific effects of 10-Hz transcranial alternate current stimulation over the left posterior parietal cortex and primary somatosensory area on tactile two-point discrimination threshold. Front Neurosci. 2021:15:576526. [DOI] [PMC free article] [PubMed] [Google Scholar]
- Zatorre RJ, Fields RD, Johansen-Berg H. Plasticity in gray and white: neuroimaging changes in brain structure during learning. Nat Neurosci. 2012:15:528–536. [DOI] [PMC free article] [PubMed] [Google Scholar]
- van der Zwaag W, Kusters R, Magill A, Gruetter R, Martuzzi R, Blanke O, Marques JP. Digit somatotopy in the human cerebellum: a 7T fMRI study. NeuroImage. 2013:67:354–362. [DOI] [PubMed] [Google Scholar]
Associated Data
This section collects any data citations, data availability statements, or supplementary materials included in this article.
Data Availability Statement
The data that support the findings of this study are available from the corresponding author upon reasonable request.