Abstract
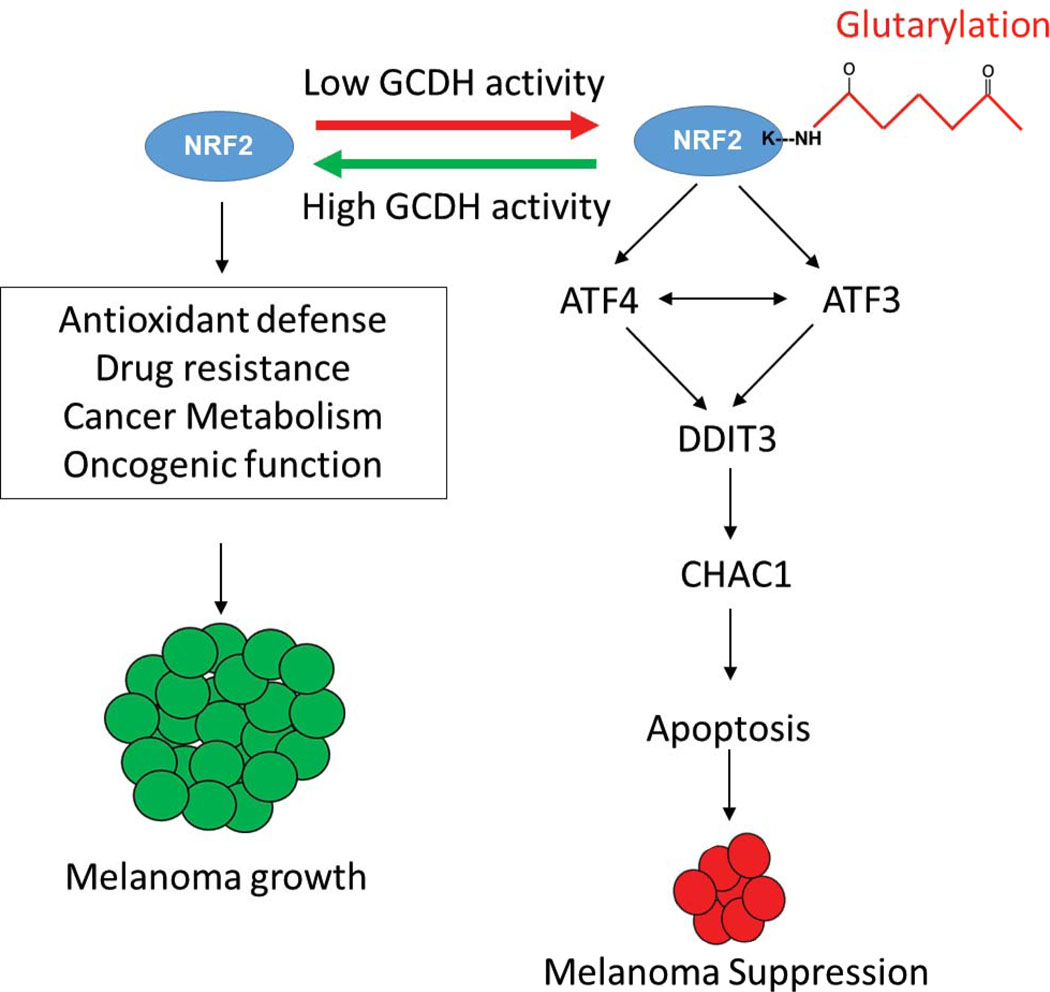
Tumor dependency on specific metabolic signals has been demonstrated and often guided numerous therapeutic approaches. We identify melanoma addiction to the mitochondrial protein Glutaryl-CoA dehydrogenase (GCDH), which functions in lysine metabolism and controls protein glutarylation. GCDH knockdown induced cell death programs in melanoma cells, an activity blocked by inhibition of the upstream lysine catabolism enzyme DHTKD1. The transcription factor NRF2 mediates GCDH-dependent melanoma cell death programs. Mechanistically, GCDH KD induces NRF2 glutarylation, increasing its stability and DNA binding activity, with a concomitant transcriptional upregulation of ATF4, ATF3, DDIT3, and CHAC1, resulting in cell death. In vivo, inducible inactivation of GCDH effectively inhibited melanoma ftumor growth. Correspondingly, reduced GCDH expression correlated with improved survival of melanoma patients. These findings identify melanoma cell addiction to GCDH, limiting apoptotic signaling by controlling NRF2 glutarylation. Inhibiting the GCDH pathway could thus represent a therapeutic approach to treat melanoma.
Keywords: GCDH, melanoma, lysine catabolism, DHTKD1, NRF2, ATF3, ATF4, DDIT3
Introduction
Metabolic pathways that supply energy to normal cells1,2 are often rewired in transformed cells to secure sufficient energy for rapid tumor cell proliferation3. As a critical source of cellular wealth, amino acid catabolism is implicated in key homeostatic activities, including redox levels, ATP production, nucleotide biosynthesis, and lipogenesis4. Common to these is tight control of signal transduction pathways by metabolites, derived from amino acid catabolism, which defines protein post-translational modification (PTM)4,5.
Addiction to a particular metabolic pathway is common to tumor cells promoting attempts to reverse tumor cell addiction by targeting a specific pathway or restricting the availability of a particular amino acid5–8. Yet, strategies to limit glutamine, asparagine, serine/glycine, or methionine had limited success, often due to compensatory signaling9–11.
Notably, metabolic cues are also critical in the tumor microenvironment12–14. Thus, manipulating glucose, glutamine, and asparagine metabolism, may limit tumor development while blunting an anti-tumor immunity15–17. Combination therapies designed to block metabolic cues while targeting oncogenic signaling8 were thus proposed. For example, limiting asparagine uptake while inhibiting MAPK signaling efficiently inhibits the growth of pancreatic and melanoma tumor cells 18, and targeting protein methyltransferase 5 (PRMT5) coupled with PD1 therapy can overcome inherent resistance seen in cold melanoma tumors19.
The essential amino acids lysine and tryptophan serve as protein building blocks and function in acetyl-CoA production and immunosuppression, critical for cancer cell survival20. Lysine and tryptophan are degraded via a common pathway in which the dehydrogenase DHTKD1 catalyzes the synthesis of the intermediate glutaryl CoA4,21. Glutaryl-CoA Dehydrogenase (GCDH) then converts glutaryl CoA to crotonyl CoA, which is metabolized to acetyl CoA to enter the TCA cycle20. Interestingly, GCDH knockout (KO) mice show elevated lysine glutarylation, primarily in the brain and liver, suggesting that GCDH functions in TCA cycle-independent pathways22,23 and that GCDH restricts lysine glutarylation by promoting glutaryl CoA breakdown. Notably, KO of genes encoding GCDH or DHTKD1 in mouse models24,25 does not affect animal viability, suggesting that the lysine catabolism pathway is dispensable for normal development and tissue homeostasis. However, when fed a high protein or high lysine diet, GCDH KO mice die within a few days, pointing to the dependence on GCDH under select metabolic conditions26. Lastly, GCDH loss and elevated lysine glutarylation22 also coincided with the avialbility of NRF227, a master transcriptional regulator of the stress response implicated in cellular oxidative, nutrient, and metabolic stress responses28–30. ER stress and unfolded protein response (UPR) genes are linked to hyperactive NRF2 in lung adenocarcinomas harboring a Keap1 mutation31. NRF2-dependent activation of one arm of the UPR, namely the ATF4/ATF3/DDIT3, has been seen in oligodendrocytes subjected to oxidative stress30,32,33. Notably, NRF2 can function either as an oncogene or as a tumor suppressor28–30,34,35 although mechanisms underlying either of these opposing functions are not well understood.
In studying lysine and tryptophan catabolism in melanoma cells, we identified their addiction to GCDH. Our studies revealed that GCDH controls NRF2 stability by regulating NRF2 glutarylation and tumor suppressor function. GCDH loss induced NRF2 glutarylation and increased its stability, which caused transcriptional upregulation of ATF4-ATF3 signaling and melanoma cell death. Correspondingly, genetic inhibition of GCDH expression effectively suppressed melanoma growth in culture and in mice.
Results
GCDH is required for melanoma cell survival
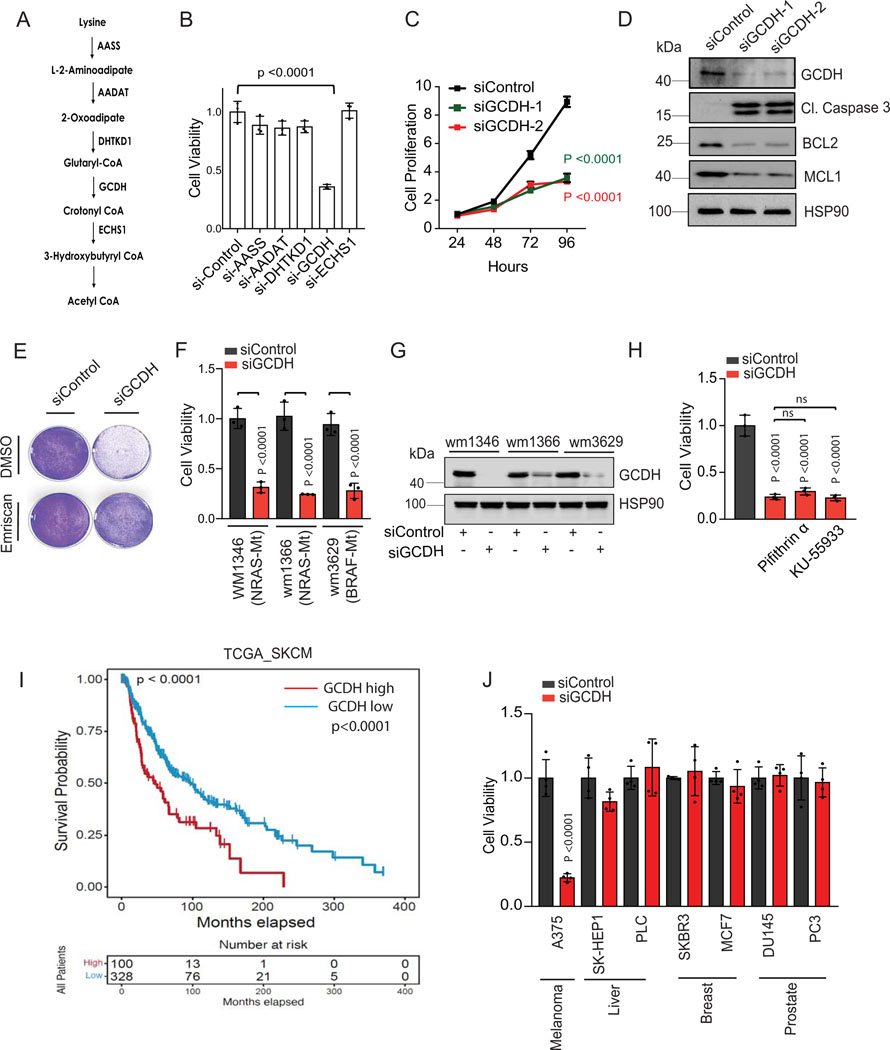
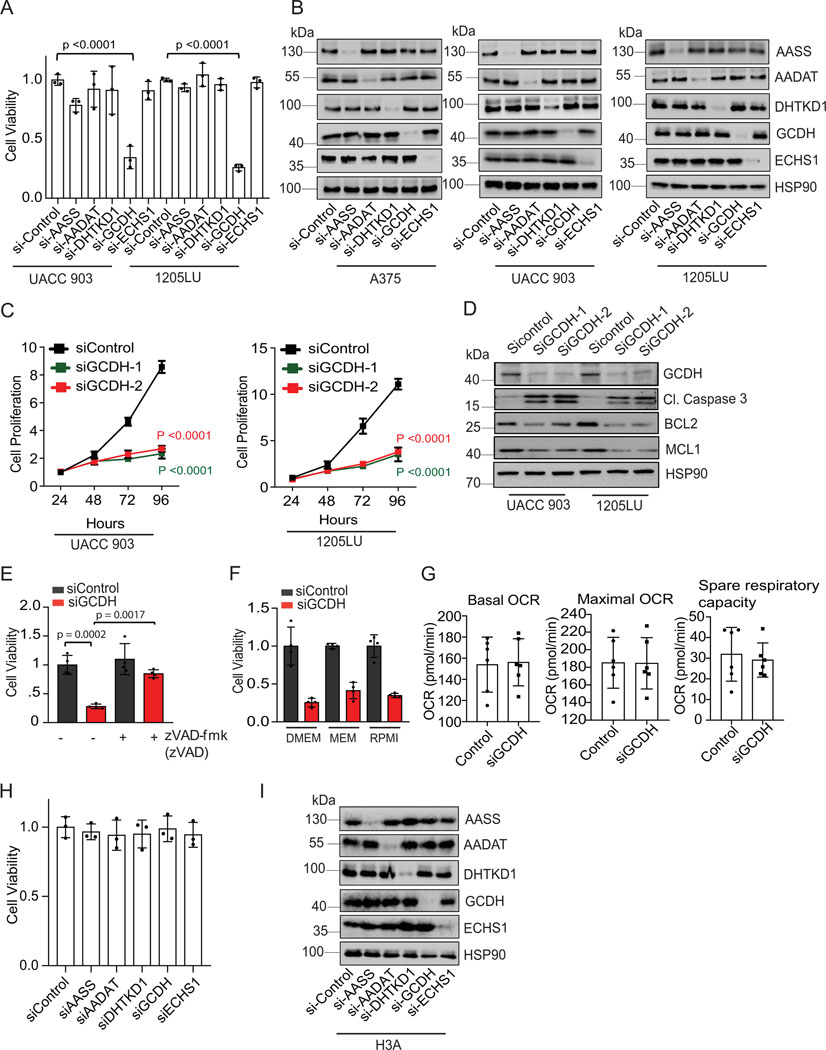
Lysine restriction inhibits colon cancer cell growth7,8, while acetyl CoA generated from lysine catabolism drives liver metastasis of colorectal tumors36. To directly assess the importance of the lysine catabolism pathway for melanoma cell viability, we assayed whether individual components of this pathway affect melanoma cell survival. Knockdown (KD) of components of the lysine catabolism pathway was mediated by siRNA against aminoadipic semialdehyde synthase (AASS), kynurenine/alpha-aminoadipate aminotransferase (AADAT), dehydrogenase E1, and transketolase domain containing 1 (DHTKD1), GCDH or enoyl-CoA hydratase, short chain 1 (ECHS1) (Figure 1A). Surprisingly, only GCDH KD resulted in marked cell death of A375, UACC903, and 1205LU melanoma lines (Figures 1B and Extended data figure 1A and 1B), findings confirmed using two independent siRNAs in all three lines (Figures 1C and Extended data figure 1C, 1D, 3E). Correspondingly, GCDH KD also upregulated cleaved caspase 3 and downregulated levels of the antiapoptotic markers BCL2/MCL1 in all three cell lines (Figure 1D and Extended data figure 1D). Apoptotic signaling induced by GCDH KD was effectively reversed by treatment with the caspase inhibitor Emriscan or with Z-VAD(OH)-FMK (Figures 1E, 2E, and Extended data figure 1E). Loss of cell viability upon GCDH KD was also seen in melanoma cells grown in RPMI or MEM medium (Extended data figure 1F), which contains lower levels of glutamine and lysine relative to DMEM37. These data establish that GCDH is required for melanoma cell survival.
Figure 1. GCDH is required for melanoma cell survival.
(A) Schematic representation of enzymes functioning in the lysine catabolic pathway. (B) A375 melanoma cells were transfected 96 hr with siRNAs targeting AASS, AADAT, DHTKD1, GCDH, ECHS1 or control sequence using Jetprime. Cell viability was then measured by quantifying crystal violet staining. (C) Growth of A375 cells upon GCDH KD with two independent siRNAs assessed over a 24–96 hr period post transfection. Growth was analyzed by cell counting at indicated time points. (D) A375 cells were transfected with siRNA against GCDH, and western blot analysis performed with indicated antibodies. (E) Cell viability assay of control or GCDH KD A375 cells treated with the caspase inhibitor Emriscan (10μM for 48 hr). (F) Cell viability assay of indicated cells 96 hr after transfection with siRNAs targeting GCDH. Cell viability was measured by quantifying crystal violet staining. (G) Western blot analysis confirming GCDH KD as described in D. (H) Analysis of A375 cell viability upon GCDH KD alone or combined with treatment with Pifithrin-α or KU-55933. (I) Comparison of patient survival based on analysis of GCDH expression in melanoma patients using TCGA (p value 7.100673e-5). Total number (n) of patients = 428; n (GCDH high) =328 and n (GCDH low) =100. (J) Cell viability was measured by quantifying crystal violet staining upon GCDH KD in indicated cancer lines. Data are representative of three experiments (D and G) and presented as mean values ± SD of n = 3 for (B, C, F, H) and n=4 for (J) independent experiments. Statistical significance (indicated p-value or ns- not significant (w.r.t si-Control) was calculated using one-way ANOVA for (B, F, H, and J) and two-way ANOVA for (C). Each p value is adjusted to account for multiple comparisons. P values in figures correspond to the comparison between siControl and siGCDH. The survival curves and p-values were computed using survfit function in R survival package (Kaplan-Meier survival curve and two-sided log rank test with no adjustments for multiple comparisons) for (I). Statistics source data for Figure 1 can be found in Source data files - Figure 1 and uncropped scans of all blots and gels for figure 1 can be found in Source data files for blot- Figure 1.
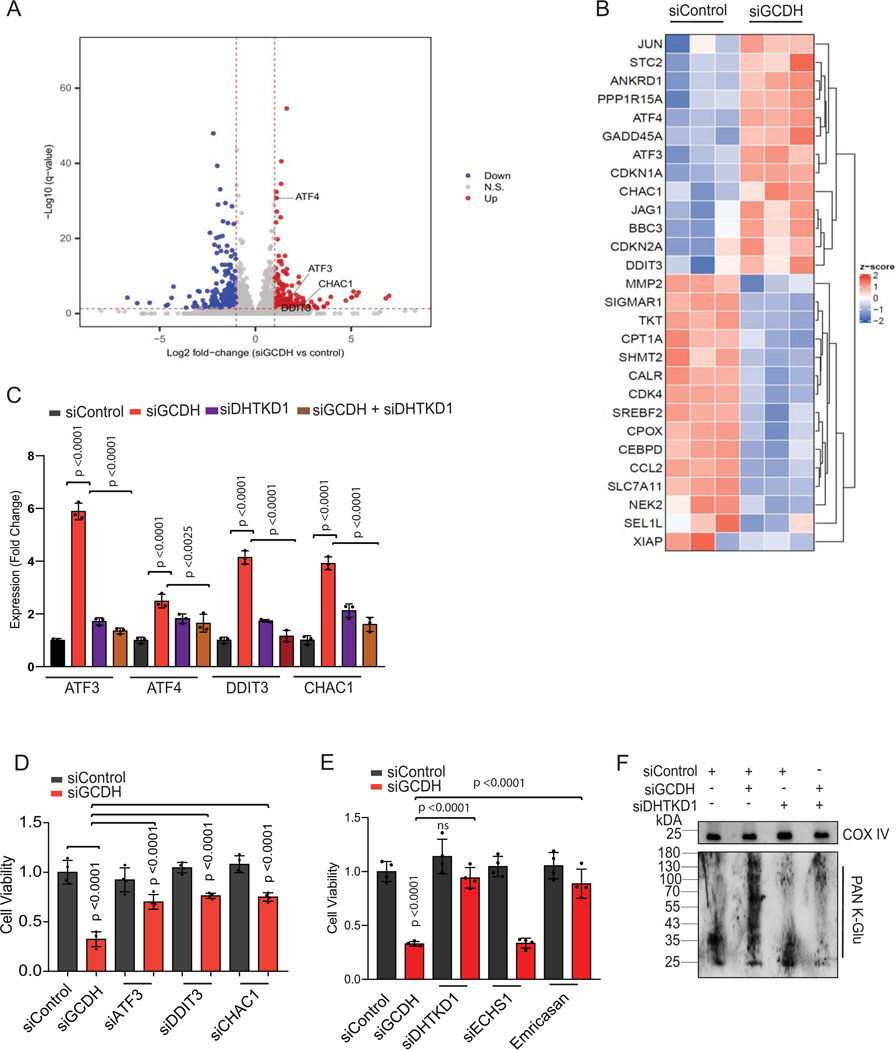
Figure 2. GCDH inhibition promotes DHTKD1-dependent cell death.
(A) Volcano plot showing elevated expression of ATF4-ATF3 targets controlling the DHTKD1-mediated cell death cascade (ATF3, ATF4, DDIT3, and CHAC1), as identified by RNA-seq analysis. (B) Heatmap showing differential expression of ATF3/4 downstream targets in GCDH KD A375 cells, as identified by RNA-seq analysis. (C) RT-qPCR validation of ATF3, ATF4, DDIT3, and CHAC1 in A375 cells transfected with indicated siRNAs. (D and E) Viability of A375 cells transfected for 96 hr with indicated siRNAs. Viability was analyzed by crystal violet staining. (F) Western blot analysis of mitochondrial extracts from A375 cells using PAN K-Glu antibody to detect lysine glutarylation 72 hr after transfection with indicated siRNAs. COX IV was used as a loading control. Data are representative of three experiments for (F) and presented as the mean values ± SD of n = 3 for (C) and n=4 for (D and E). Statistical significance (indicated p-value or ns- not significant w.r.t control) was calculated using one-way ANOVA for (C, D, and E). Each p value is adjusted to account for multiple comparisons. Statistics source data for Figure 2 can be found in Source data files - Figure 2 and uncropped scans of all blots and gels for figure 2 can be found in Source data files for blot- Figure 2.
Since >80% of mutations in melanoma are in BRAF and NRAS, we analyzed the possible relationship between GCDH addiction and these mutations. GCDH KD in either BRAF- or NRAS-mutant melanoma lines comparably blocked cell viability (Figure 1F and G), indicating that melanoma dependency on GCDH may not be associated with these mutations.
Cell death is seen in GCDH KD A375 melanoma (p53 wt) cells could not be rescued by pharmacological inhibition of either p53 (with Pifithrin-α) or ATM (with KU-55933) or by treatment with the ROS scavenger N-acetylcysteine (Figure 1H and 3E and 3F), suggesting that melanoma dependency on GCDH is independent of DNA damage or oxidative stress. Oxygen consumption rate (OCR) and spare respiratory capacity were comparable in GCDH KD and control A375 melanoma cells (Extended data figure 1G), indicating that GCDH inhibition does not affect mitochondrial biogenesis or respiration. Notably, neither GCDH nor any other component of the lysine catabolism pathway was required for cell viability in the non-transformed and immortalized melanocyte line H3A (Extended data figure 1H and 1I), consistent with viability and growth phenotypes seen in GCDH and DHTKD1-KO mice24,25.
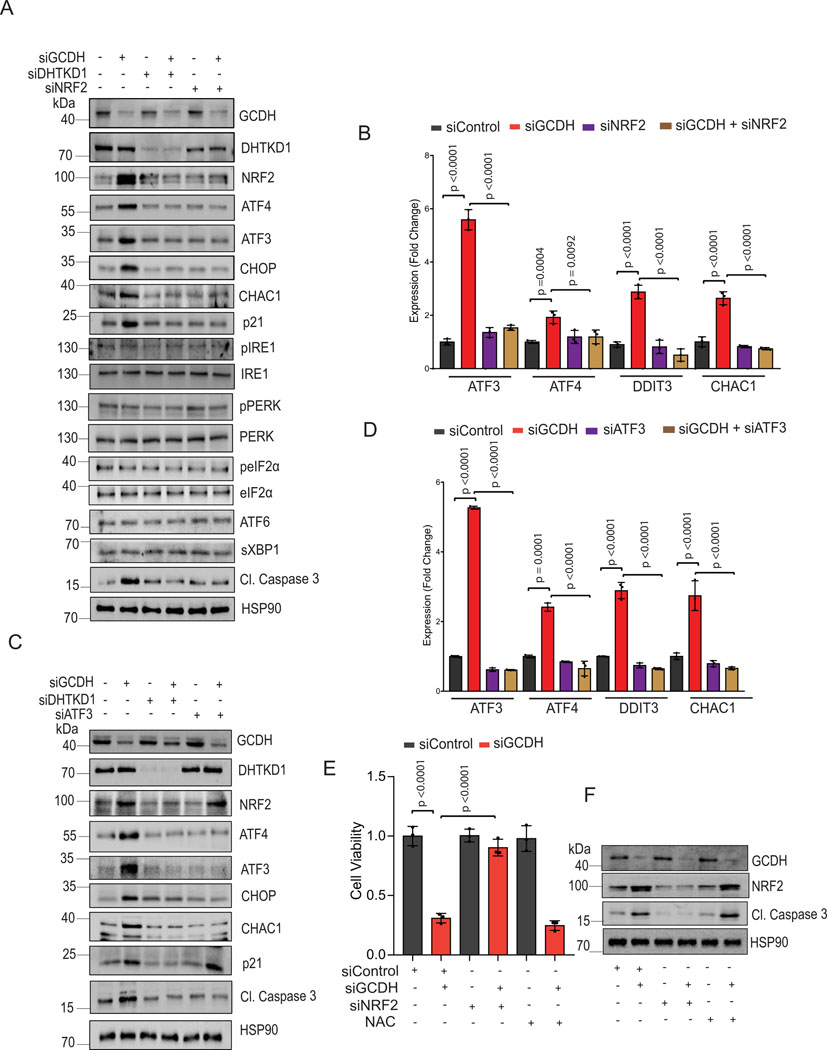
Figure 3. GCDH loss increases NRF2 levels and enhances cell death.
Western blot analysis of indicated proteins in A375 cells 72 hr following transfection with indicated siRNAs. (B) RT-qPCR analysis of ATF3, ATF4, DDIT3, and CHAC1 expression in A375 cells following transfection with indicated siRNAs. (C) Western blot analysis of indicated proteins in A375 cells 72 hr following transfection with indicated siRNAs. (D) RT-qPCR analysis of ATF3, ATF4, DDIT3, and CHAC1 expression in A375 cells following transfection with indicated siRNAs. (E) Viability assay of A375 cells transfected with indicated siRNAs for 48 hours and then treated or untreated with NAC (10mM) for 48 hours (F) Western blot analysis of indicated proteins in A375 cells 72 hr following transfection. Data are representative of three experiments for (A, C, and F) and presented as the mean values ± SD of n = 3 independent experiments for (B, D, and E). Statistical significance (indicated p-value or ns- not significant w.r.t control) was calculated using one-way ANOVA for (B), (D,) and I. Each p value is adjusted to account for multiple comparisons. Statistics source data for Figure 3 can be found in Source data files – Figure 3 and uncropped scans of all blots and gels for figure 3 can be found in Source data files for blot- Figure 3.
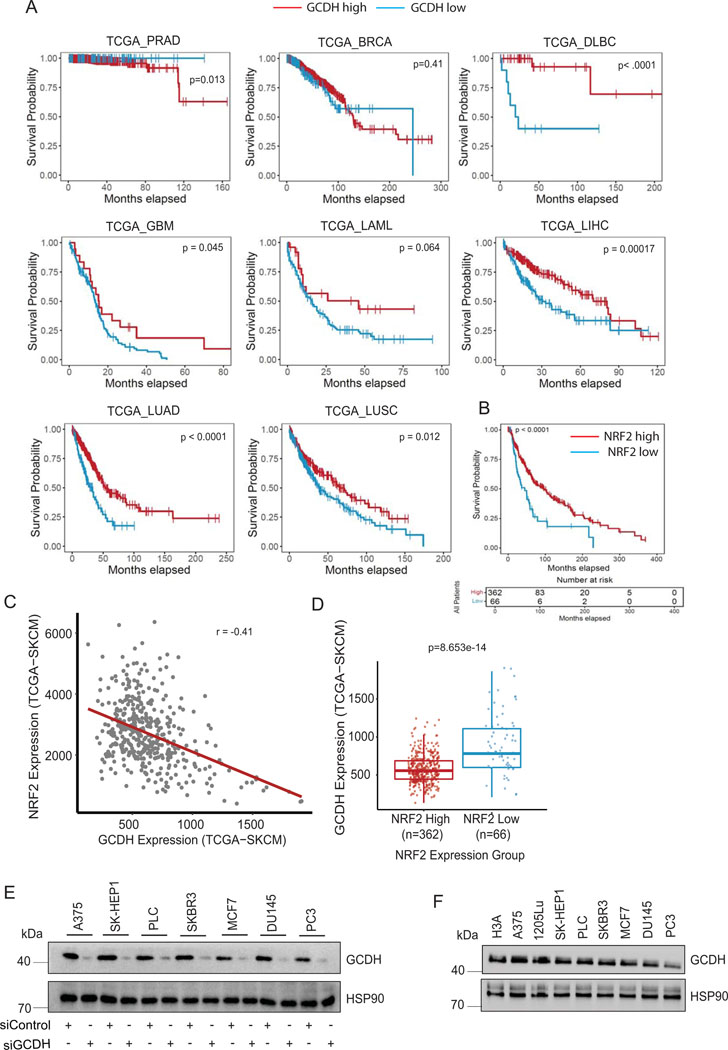
Evaluation of specimens from melanoma patients revealed that higher GCDH expression was associated with decreased patient survival (Figure 1I and Supplementary table 1), whereas patients whose specimens showed low GCDH expression exhibited a significant survival advantage. Notably, such trends were not identified in patients with other tumor types (Extended data figure 2A). Consistent with patient data, inhibiting GCDH expression in melanoma lines, but not in liver, breast, or prostate cancer cell lines, caused notable cell death (Figure 1J and Extended data figure 2E), indicating the specificity of GCDH signaling in melanoma. Interestingly, levels of GCDH expression were comparable in melanoma, breast, prostate, and liver cancer cell lines as well as in immortalized melanocytes (Extended data figure 2F), suggesting that melanoma dependency on GCDH is not related to its expression level.
GCDH inhibition promotes DHTKD1-dependent cell death
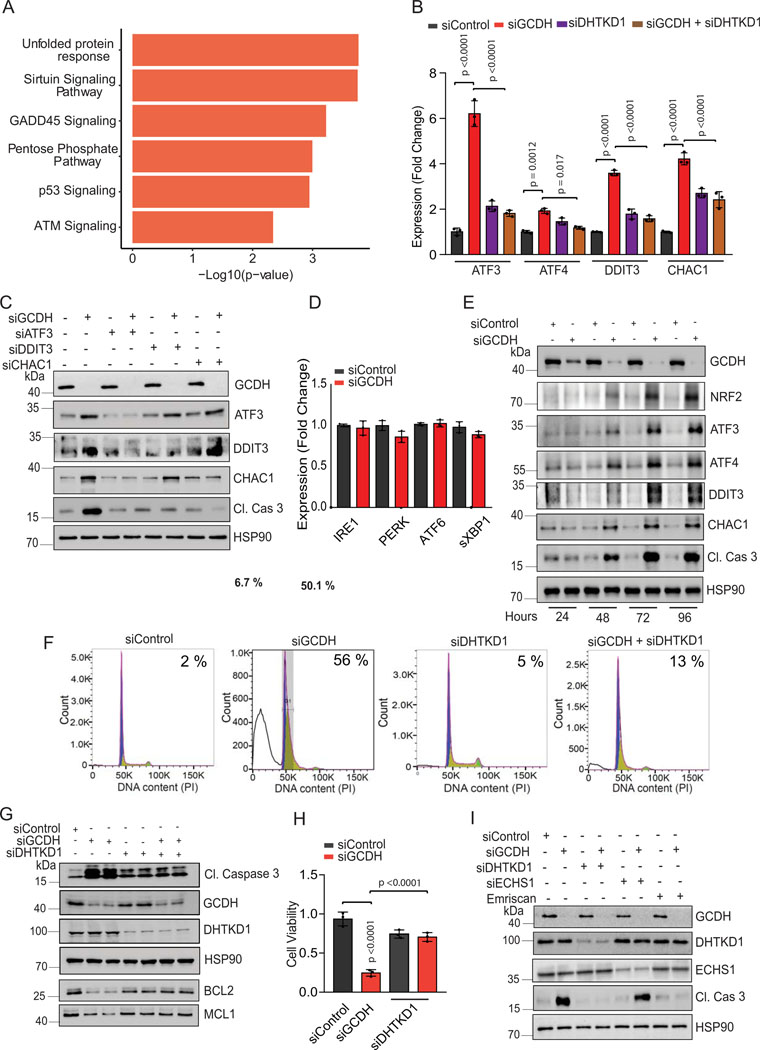
To identify possible mechanisms underlying cell death, we monitored changes in gene expression following GCDH KD in melanoma cells. RNAseq analysis followed by pathway analysis of differentially expressed genes upon GCDH KD identified changes in ATF4, ATF3, sirtuin, and GADD45 signaling, as in components implicated in the pentose phosphate, p53, and ATM regulatory axes (Extended data figure 3A and Supplementary Table 2-batch 1). Among differentially-expressed genes upregulated following GCDH KD were those controlled by ATF4 and ATF3 signaling and implicated in cell death (such as DDIT3, CHAC1, and GADD45a)38, and genes implicated in cell cycle inhibition and tumor suppression (namely, CDKN1A and CDKN2A)38,39 (Figures 2A and 2B). Upregulation of ATF4, ATF3, DDIT3, and CHAC1 transcripts upon GCDH KD was confirmed in A375 and UACC903 melanoma lines (Figures 2C and Extended data figure 3B). Inhibition of ATF3, DDIT3, or CHAC1 in A375 melanoma cells effectively attenuated cell death induced upon GCDH KD (Figure 2D and Extended data figure 3C).
Notably, neither IRE1/p-IRE1, PERK/p-PERK, eIF2α/p- eIF2α, nor ATF6/sXBP1 were upregulated following GCDH inhibition (Figures 3A, Extended data figure 3D and 4B), excluding their involvement. Notably, activation of ATF4, ATF3, DDIT3, and CHAC1 was seen as early as 48 hours (hr) post-transfection, subsequently leading to induction of apoptosis (Extended data figure 3E). We thus conclude that GCDH loss in melanoma cells induces a select subset of genes, such as ATF4 and ATF3, which serve as the main regulatory nodes that mediate activation of DDIT3 and CHAC1, culminating in programmed cell death38.
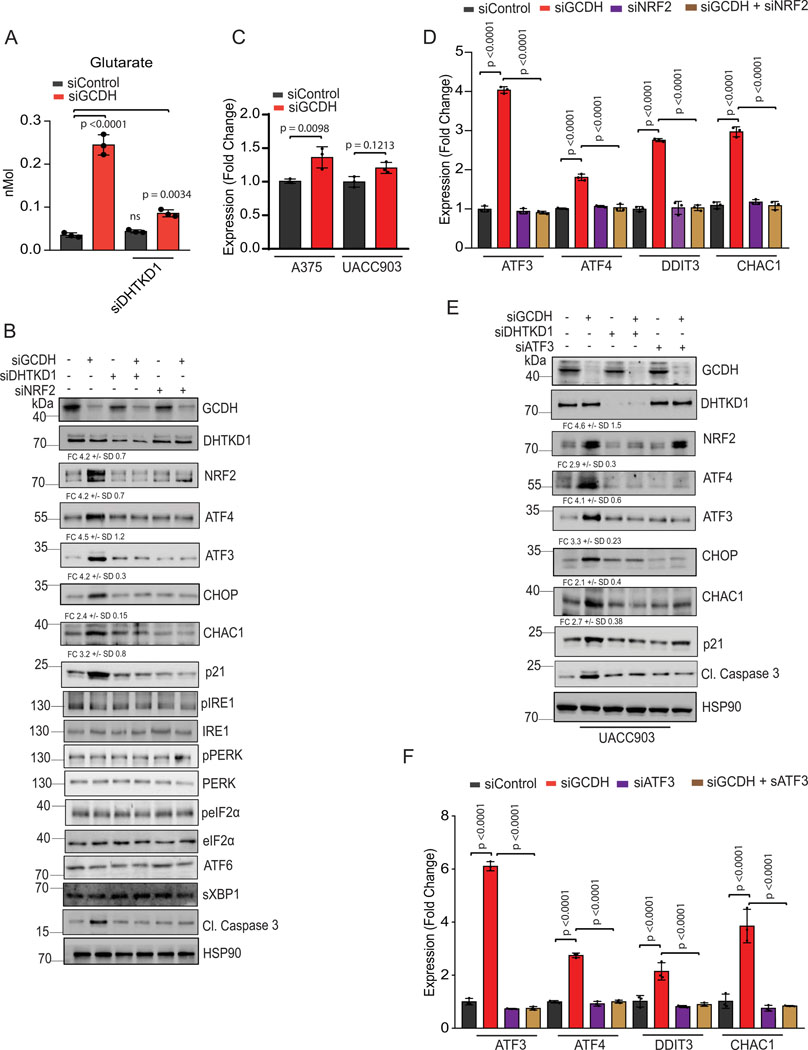
In addition to inducing apoptotic signals (Figures 1D and Extended data figure 1D), GCDH KD in A375 cells led to increased DNA fragmentation, indicative of cell death, relative to control cells (56% vs. 2%, respectively; Extended data figure 3F; supplementary figure 1). Significantly, the degree of cell death seen upon GCDH KD decreased to 13 % upon co-KD of DHTKD1, an upstream GCDH component in the lysine catabolism pathway (Figure 1A, Extended data figure 3F; Gating strategy shown in Supplemental Figure 1). The rescue of cell death seen following GCDH KD by co-KD of DHTKD1, was confirmed using two independent siRNAs (Extended data figure 3G). While DHTKD1 KD also effectively rescued the viability of 1205LU melanoma cells subjected to GCDH KD (Extended data figure 3H), co-KD of ECHS1, which is downstream of GCDH in the lysine catabolism pathway (Figure 1A), did not alter the degree of cell death seen upon GCDH KD (Figure 2E and Extended data figure 3I). Given that the cell death phenotypes were observed upon KD of GCDH and its upstream but not downstream enzymes, we assessed the possible change in lysine catabolism independent pathway, namely, protein glutarylation. Indeed, GCDH inhibition promotes glutarate accumulation and increases protein glutarylation in mitochondria22. Relative to control siRNAs, GCDH KD promoted increased glutarylation of proteins in mitochondrial extracts (Figure 2F). Accordingly, levels of glutarate, a metabolite of glutaryl-CoA, increased in GCDH KD A375 cells (Extended data figure 4A). Changes seen in both glutarylation and glutarate levels were largely rescued upon DHTKD1 KD (Figure 2F and Extended data figure 4A). ATF4, ATF3, DDIT3, and CHAC1 transcripts were downregulated by combined DHTKD1/GCDH KD (Figure 2C and Extended data figure 3B), rescuing the phenotypes seen following GCDH KD alone. These observations suggest that GCDH controls protein glutarylation, which regulates cell death programs mediated by ATF4/ATF3 signaling.
GCDH loss increases NRF2 levels and melanoma cell death
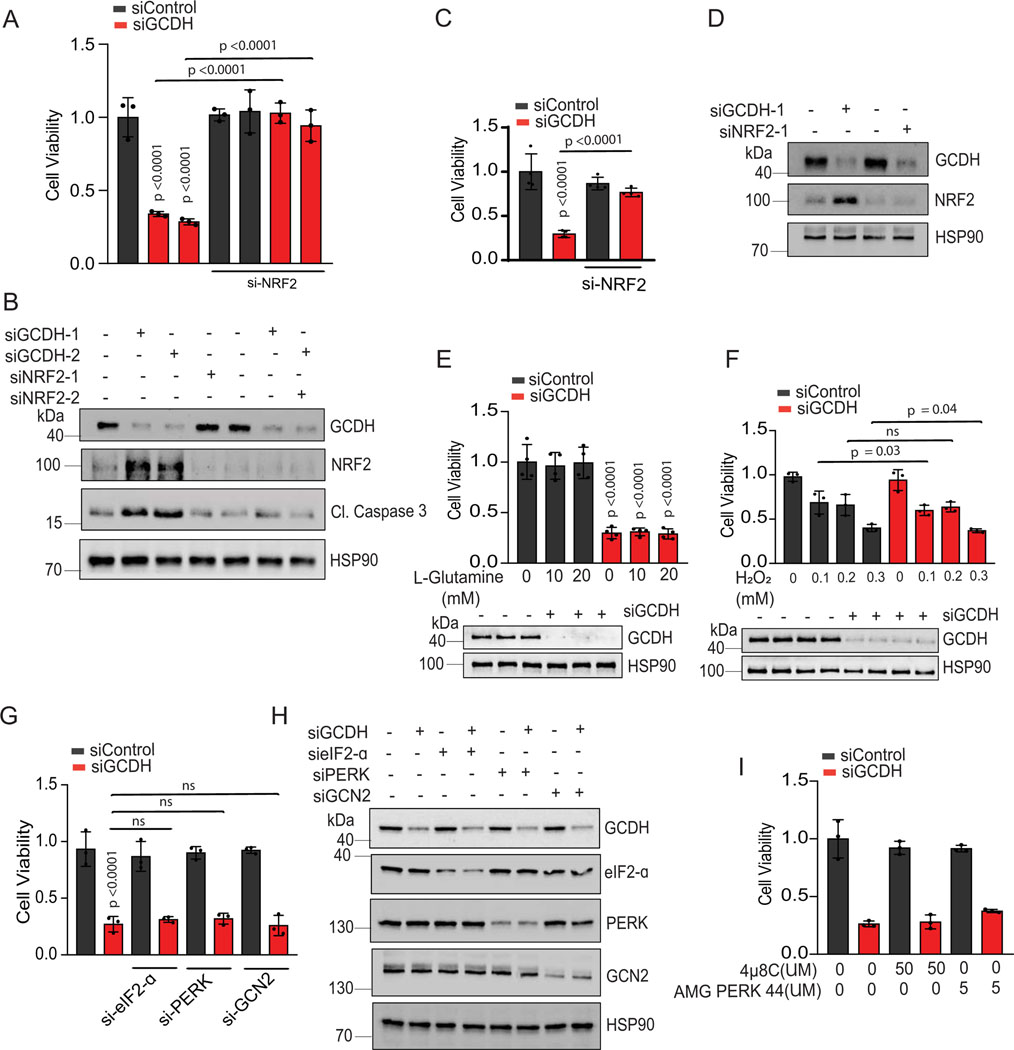
Given NRF2 upregulation in the brain of GCDH KO mice fed a high lysine diet27, and that NRF2 can be linked with ATF3 and ATF4 transcription29,32,40,41, we asked whether phenotypes seen following GCDH inhibition, are mediated by NRF2. Whereas NRF2 mRNA levels were marginally altered by GCDH KD (Extended data figure 4C), we observed an increased abundance of NRF2 protein in both lines, changes coinciding with increased levels of ATF4, ATF3, DDIT3, CHAC1, caspase 3 (cleaved) and p21 proteins (Figure 3A and Extended data figure 4B). Concomitant KD of either NRF2 or DHTKD1 in GCDH KD A375 or UACC903 lines effectively reversed apoptotic signaling seen upon GCDH KD alone, both at protein (Figure 3A and Extended data figure 4B) and transcript (Figure 3B and Extended data figure 4D) levels. Given that ATF3 has been implicated in the control of DDIT3-CHAC134,38, we asked whether ATF3 mediates phenotypes seen after GCDH loss. ATF3/GCDH double KD in A375 or UACC903 lines effectively attenuated cell death seen following GCDH KD alone (Figure 2D and Extended data figure 3C), similar to effects seen following co-DHTKD1 KD (Figure 2E and Extended data figure 3H). ATF3/GCDH double KD cells also exhibited reduced ATF4, DDIT3, CHAC1, and cleaved caspase 3 protein relative to GCDH single KD cells (Figure 3C and Extended data figure 4E). Likewise, we observed decreased ATF4, DDIT3, and CHAC1 transcripts in ATF3/GCDH KD cells compared with GCDH KD (Figure 3D and Extended data figure 4F). Changes seen upon ATF3 KD phenocopied those seen following either DHTKD1 or NRF2 KD in cells subjected to GCDH KD, which attenuated apoptotic signaling (Figures 2D and 3E). ATF3 KD alone in melanoma cells did not affect NRF2 stability or p21 expression, suggesting that following GCDH inhibition, ATF3 is the primary driver of apoptosis downstream of NRF2 (Figure 3C and Extended data figure 4D). Notably, NRF2 KD, using two independent siRNAs, decreased cell death in A375 (Figures 3E, 3F, 4A, 4B) and UACC903 cells (Figures 4C and 4D) after GCDH KD. Constitutive NRF2 activation reportedly promotes glutamine addiction and resistance to oxidative stress in some cancer cells41,42. Neither hydrogen peroxide treatment nor glutamine supplementation conferred a survival advantage to GCDH-KD relative to control cells (Figures 4E, 4F). Since NRF2 is also activated by PERK-mediated ER stress signaling43, we tested if PERK is required for GCDH addiction in melanoma cells. Knockdown of either PERK, eIF2α, or GCN2 kinase failed to prevent melanoma cell death, following GCDH inhibition (Figures 4G and 4H). Additionally, pharmacological inhibition of PERK nor IRE-1 (via AMG PERK 44 and 4μ8C, respectively) in GCDH KD cells did not attenuate cell death (Figure 4I).
Figure 4. Cell death following GCDH inhibition is NRF2 dependent.
(A) Rescue of cell death seen in GCDH-KD A375 cells by NRF2-KD using independent siRNAs. Viability was measured by quantifying crystal violet staining. (B) Western blot analysis of indicated proteins in A375 cells, 72 hr after transfection with siRNAs targeting GCDH and NRF2. (C) Rescue of cell death seen in GCDH-KD UACC903 cells by NRF2-KD. Viability was measured by quantifying crystal violet staining. (D) Western blot analysis of indicated proteins in UACC903 cells, 72 hr after transfection with siRNAs targeting GCDH and NRF2. (E and F) Cell viability assay of control or GCDH KD A375 cells treated with the L-glutamine or hydrogen peroxide (H2O2). GCDH KD was confirmed by western blot analysis. (G) Viability assay of A375 cells transfected with indicated siRNAs for 96 hr. (H) Western blot analysis of indicated proteins in A375 cells 72 hr following transfection. (I) Cell viability assay of control or GCDH KD A375 cells treated with were IRE1 inhibitor (4μ8C) or PERK inhibitor (AMG PERK 44) for 48 hr. Data are representative of three experiments and presented as the mean values ± SD of n = 3 for (A, F, and G) and n=4 for (E and C) independent experiments. Statistical significance (indicated p-value or ns- not significant w.r.t control) was calculated using one-way ANOVA. Each p value is adjusted to account for multiple comparisons. Statistics source data for Figure 4 can be found in Source data files - Figure 4 and uncropped scans of all blots and gels for figure 4 can be found in Source data files for blot- Figure 4.
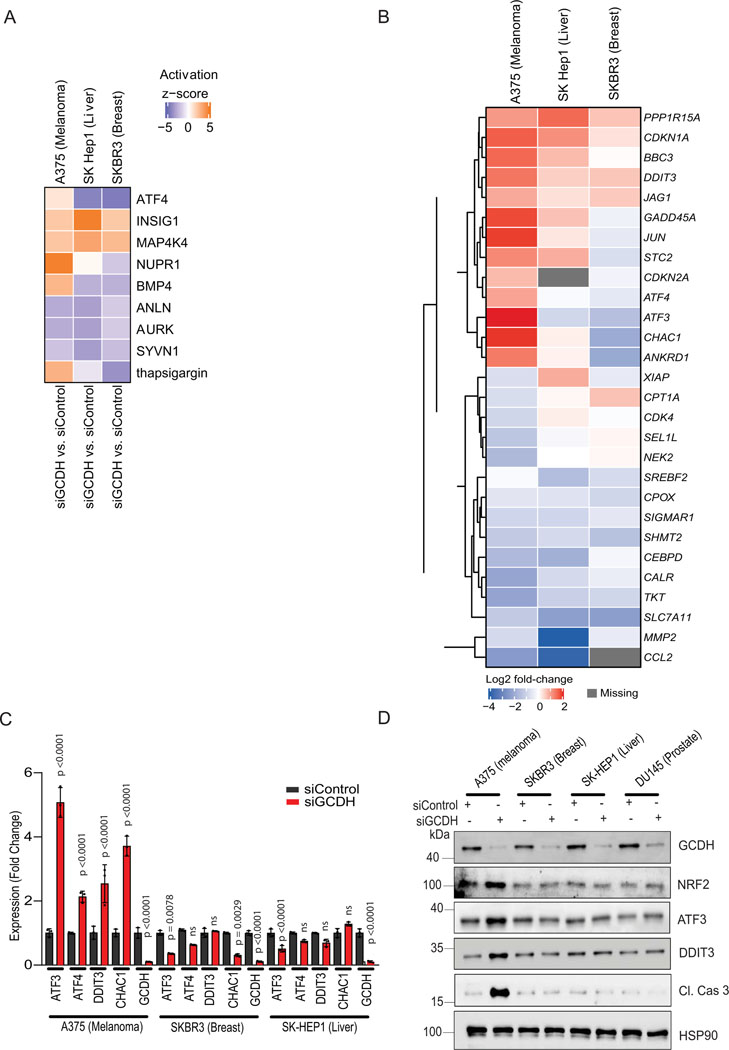
We next conducted RNAseq analysis in melanoma (batch 2), liver, and breast cancer-derived lines following GCDH knockdown to identify gene expression signatures that may distinguish melanoma from other tumor types. ATF4 and ATF3 (Extended data figure 5A, 5B, and Supplementary Table 3–5) were upregulated in melanoma but not in breast or liver cancer cell lines. Correspondingly, increased transcription of DDIT3 and CHAC1, implicated in cell death programs, coincided with elevated ATF3/ATF4 signaling and was seen in melanoma but not in liver, breast, or prostate cancer lines (Extended data figure 5C and 5D). These studies identify distinct signaling involving NRF2, ATF4, and ATF3, which underlie the selectivity of melanoma addiction to GCDH.
GCDH regulates NRF2 stability
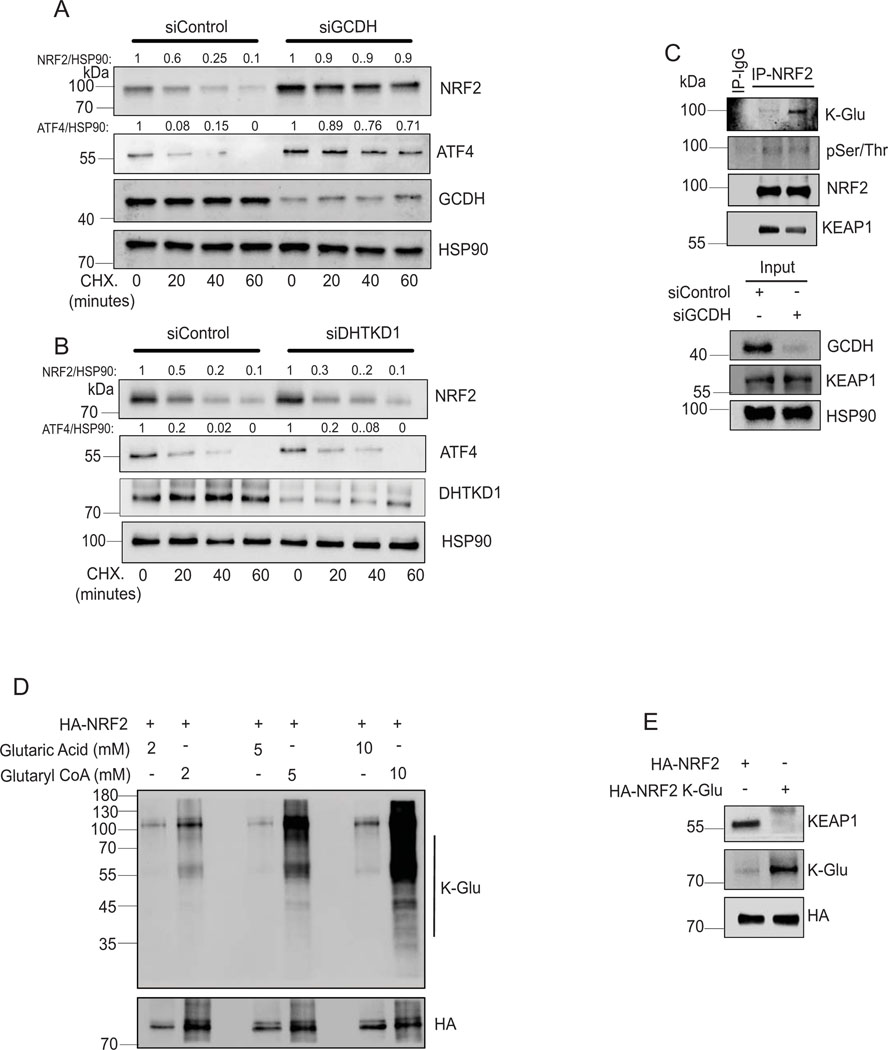
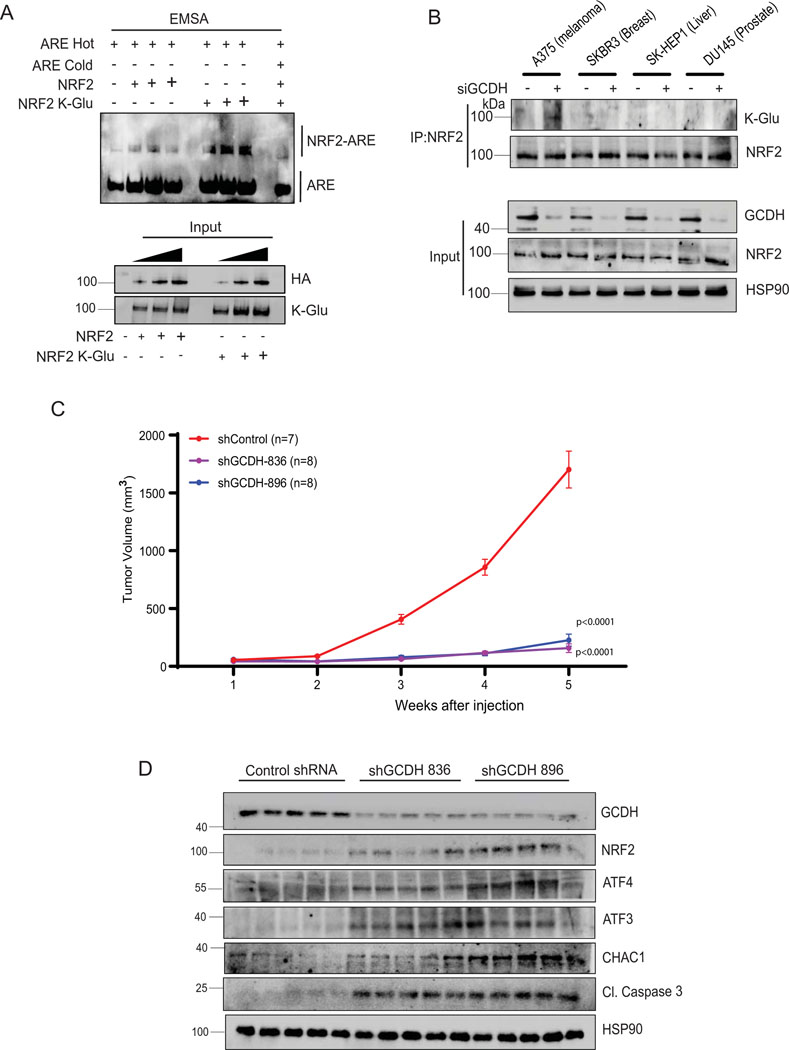
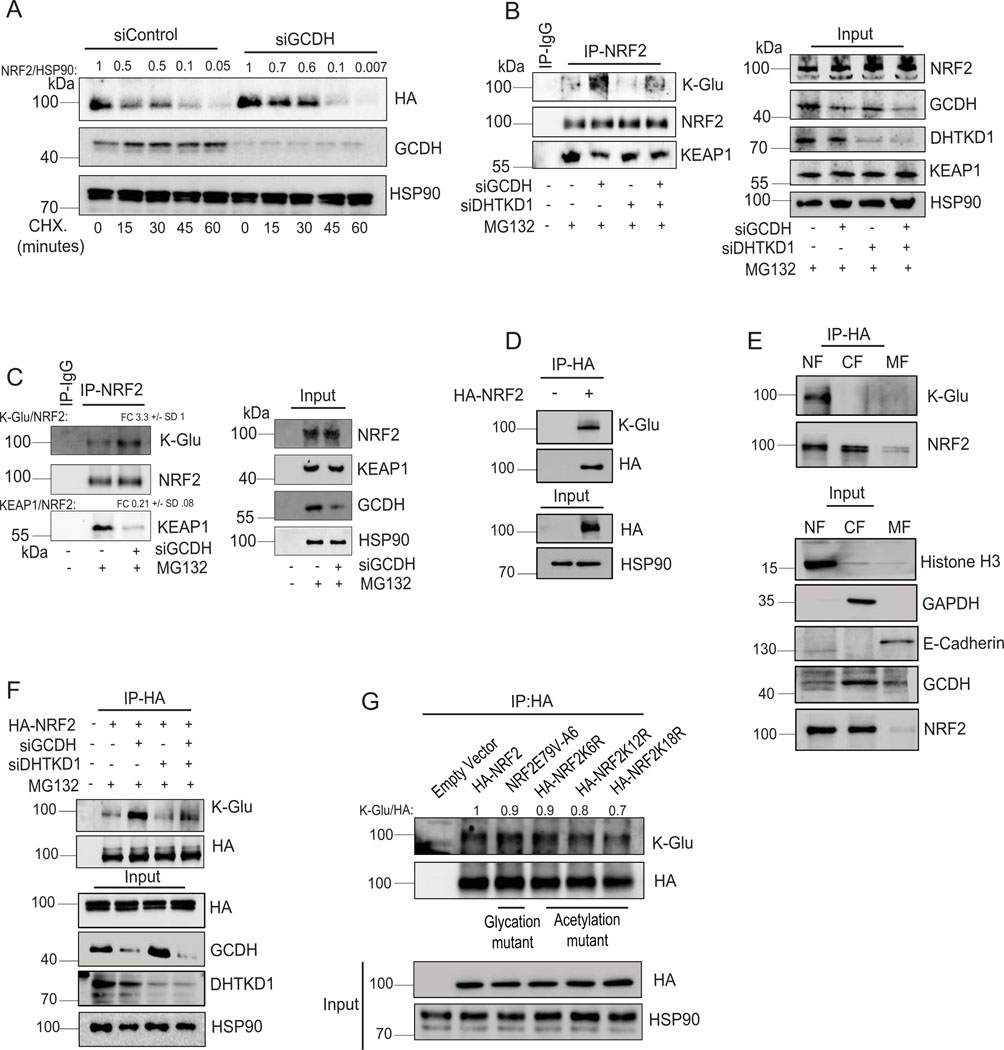
To monitor potential changes in NRF2 stability following GCDH KD, we performed cycloheximide chase assays in A375 melanoma cells. NRF2 half-life increased following GCDH KD in A375 relative to control cells (Figure 5A) and in GCDH KD HEK293T cells expressing exogenous HA-NRF2 (Extended data figure 6A). Changes in NRF2 stability were associated with a concomitant increase in ATF4 stability in A375 melanoma cells upon GCDH KD (Figure 5A). By contrast, DHTKD1 KD in A375 cells did not alter the stability of endogenous NRF2 or ATF4 (Figure 5B). As NRF2 stability is tightly controlled by the ubiquitin ligase KEAP144, we assessed possible changes in NRF2/KEAP1 interaction following GCDH KD. Immunoprecipitation (IP) of endogenous NRF2 from GCDH KD cells cultured in the presence of the proteasome inhibitor MG132 revealed lower levels of NRF2-bound KEAP1 relative to control cells (Figure 5C). Given marked increases in protein glutarylation seen upon GCDH inhibition, we asked whether NRF2 glutarylation altered its interaction with KEAP1. Immunoblotting of NRF2 immunoprecipitates with K-Glu antibodies identified low levels of NRF2 glutarylation in control A375 cells, which were notably increased following GCDH KD, without changes in NRF2 phosphorylation (Figure 5C), suggesting that glutarylation may not require changes in NRF2 phosphorylation. Consistent with our earlier findings, DHTKD1 KD rescues the effects of GCDH inhibition on glutarylation of endogenous NRF2 and its binding to KEAP1 (Extended data figure 6B). The increase in NRF2 glutarylation and reduced binding to KEAP1 upon GCDH KD was also observed in UACC903 melanoma cells (Extended data figure 6C). NRF2 glutarylation was confirmed in an in vitro glutarylation assay, in which purified HA-NRF2 was glutarylated in the presence of glutaryl-CoA harboring a reactive CoA moiety but not in the presence of control glutaric acid (K-Glu NRF2; Figure 5D). These findings suggest that NRF2 undergoes glutarylation upon increased glutaryl-CoA levels, potentially following the loss of GCDH function. In agreement, lower amounts of endogenous KEAP1 were bound to in vitro glutarylated (K-glu) versus non-glutarylated HA-tagged NRF2 protein (Figure 5E). Immunoprecipitation of overexpressed HA-tag NRF2 detected glutarylation in the eluted NRF2 fractions (Extended data figure 6D), while cell fractionation revealed that glutarylated NRF2 was primarily nuclear (Extended data figure 6E). Notably, DHTKD1 KD reduced the degree of NRF2 glutarylation seen upon GCDH KD (Extended data figure 6B and F). Electrophoretic mobility shift assay (EMSA) to monitor NRF2 binding to the antioxidant response element (ARE), one of the NRF2 targets, showed increased binding of the in vitro glutarylated HA-NRF2, relative to an HA-NRF2 control (Figure 6A), suggesting that NRF2 glutarylation increases its stability and DNA binding capacity.
Figure 5. Lysine glutarylation attenuates KEAP1 binding increasing NRF2 stability.
(A, B) Cycloheximide (CHX) chase analysis of half-life of endogenous NRF2 and ATF4 proteins in A375 cells transfected with indicated siRNAs. Western blot was performed on lysates of A375 cells transfected with siControl (A) or siGCDH (B) for 72 hr and then treated with 50 μM Cycloheximide (CHX) for indicated times. After quantification, signals obtained in panels A and B were used to calculate the NRF2/HSP90 and ATF4/HSP90 ratios and described the CHX treatment period as fold change relative to CHX treatment time = 0. (C) Immunoprecipitation and Western blot analysis of A375 transfected with indicated constructs. Cells were treated with the proteasomal inhibitor MG132 for 4 hr, followed by IP/Western blotting analysis with antibodies to detect K-Glu PTM, pSer/Thr PTM, KEAP1, and NRF2. (D) In vitro glutarylation assay on purified HA-NRF2 following incubation with the indicated concentration of glutaryl CoA. (E) In vitro KEAP1 binding analysis was performed using purified HA-NRF2 or K-Glu-NRF2 as bait on A375 cell lysates. Data are representative of three experiments. Statistics source data for Figure 5 can be found in Source data files - Figure 5 and uncropped scans of all blots and gels for figure 5 can be found in Source data files for blot- Figure 5.
Figure 6. Inducible GCDH KD decreases melanoma proliferation and tumorigenesis.
(A) Relative DNA binding activity of purified HA-NRF2 or K-Glu-NRF2, as measured in vitro by NRF2/ARE EMSA using non-denaturing PAGE followed by western blotting. Gel shifted complex of NRF2/ARE-Biotin labeled DNA probe was detected using a streptavidin-HRP antibody. (B) Immunoprecipitation and Western blot analysis of indicated cell lines using NRF2 antibody. Cells were treated with the proteasomal inhibitor MG132 for 4 hr, followed by IP/Western blotting analysis with HA/NRF2 antibody to detect K-Glu PTM and NRF2. (C) Volume of tumors in NOD/SCID (NOD.CB17-Prkdcscid/J) mice infused with 1 × 10⁶ human A375 melanoma cells harboring one of two GCDH shRNAs (836 or 896) or control shRNA sequence (shControl). Following 5 days post-injection of A375 cells, mice were fed Dox chow to induce KD. After that, tumor volume was measured every 7 days with linear calipers and calculated using the formula: (length in mm × width in mm) x ½ and plotted with respect to time. Tumors were harvested at the end of week 5 for analysis of GCDH KD. (D) Western blot analysis showing levels of indicated proteins in tumors harvested from indicated control or GCDH KD mice (n=5 each), as described in A. Data are presented as the mean values ± SEM of (n = 7 control shRNA, n=8 for shGCDH-836 and n= 8 for shGCDH-896). Each p value is adjusted to account for multiple comparisons. Statistical significance (indicated p-value relative to control) was calculated using 2-way ANOVA. Statistics source data for Figure 6 can be found in Source data files - Figure 6 and uncropped scans of all blots and gels for figure 6 can be found in Source data files for blot- Figure 6.
RNAseq analysis in melanoma cells after GCDH KD confirmed an NRF2-activated signature45, which includes ATF4 signaling32,40, which differed from that seen in breast or liver cancer cells29 (Extended data figure 5A, 5B, and Supplementary Table 3–5). NRF2 contains 39 lysine residues, most of which undergo PTM by ubiquitination, acetylation, or glycation. In efforts to map possible glutarylation sites we tested possible changes in glutarylation of NRF2 mutants not susceptible to acetylation or glycation (NRF2 K18R or NRF2E79V-A6, respectively). Both glycation46 (NRF2E79V-A6) and acetylation47 (HA-NRF2 K6R, K12R, and K18R) mutants retained partial glutarylation compared to WT NRF2 (Extended data figure 6G), suggesting that glutarylation may occur on different lysines. Notably, glutarylation of endogenous NRF2 was significantly lower in non-melanoma relative to melanoma cells following GCDH KD (Figure 6B). These observations suggest that unique to melanoma following GCDH loss, is NRF2 glutarylation, which stabilize the protein and activates cell death programs. Importantly, low GCDH or high NRF2 levels (Figure 1I and Extended data figure 2B) coincided with better patient outcomes. Furthermore, the patient cohort which exhibited high level of NRF2 and better survival also had low GCDH expression (Extended data figures 2C and 2D).
GCDH inhibition suppresses melanoma growth in vivo
We next assessed whether genetic GCDH inhibition would impact melanoma growth in vivo. Inducible inactivation of GCDH was established in A375 cells using doxycycline-inducible shRNAs (shGCDH-836 and shGCDH-896) that were inoculated in immunodeficient mice. A375 cells expressing control hairpin shRNA served as controls to exclude the effects of doxycycline on tumor growth. To induce GCDH loss, mice in both groups were fed DOX-containing chow once tumors reached a palpable size (approximately 50 mm3; 5 days post-injection). In vivo inhibition of GCDH expression effectively blocked tumor growth (Figure 6C), compared with control shRNA expressing tumors. Analysis of tumor lysates confirmed inhibition of GCDH expression, elevated expression of NRF2, and increase in the expression of ATF3, CHAC1 and cleaved caspase 3, in GCDH KD tumors relative to control groups (Figure 6D). These findings establish the importance of GCDH for melanoma growth in vivo.
Discussion
Extensive efforts have been made to identify tumor cell vulnerability to altered metabolic signaling, with the goal of blocking metabolic cues enabling tumor growth with minimal toxicity to normal cells. Here we identify melanoma cell addiction to GCDH, an enzyme in the multi-step lysine catabolism pathway, and report that blocking GCDH activity results in significant tumor cell death. Our studies define NRF2 as the principal component mediating apoptotic signaling that induces DHTKD1-dependent cell death programs. NRF2 glutarylation occurring after GCDH KD stabilizes NRF2 and enhances transcription of ATF4 and ATF3, mediating programmed cell death. KD of either NRF2, its pro-apoptotic transcriptional target ATF330,34, or the GCDH-upstream enzyme DTHKD1 effectively blocked cell death phenotypes seen upon GCDH KD, confirming the components and mechanism underlying melanoma addiction to GCDH. These observations support a model whereby NRF2 induces cell death phenotypes by activating specific members of the greater ISR/ER stress signaling pathway32, namely, ATF4 and ATF3 (Extended data figure 7). ATF4 was previously identified as an NRF2-interacting protein and implicated in the ATF4-NRF2 complex, which controls the activity of heme oxygenase-147. Our findings are consistent with the possibility that NRF2 interaction with ATF4 stabilizes and enhances its transcriptional activity.
NRF2 reportedly exhibits either oncogenic or tumor suppressor activities 28,30,33 in different cancer models. In melanoma, NRF2 was previously shown to regulate innate immune responses and responses to oxidative stress48. Additionally, high levels of NRF2 protein are associated with a poor prognosis in melanoma irrespective of oxidative stress49. Our findings show that following GCDH loss, NRF2 exhibits tumor suppressor activity due to its glutarylation, enhancing its stability and DNA binding with concomitant induction of a transcriptional program that includes ATF3, ATF4, and apoptotic genes, culminating in melanoma cell death. While subjected to several PTM on any of its lysine residues, NRF2 glutarylation is likely to substitute other PTMs (i.e., ubiquitination, acetylation), altering its conformation and heterodimeric partners, redefining its transcriptional activities. Our attempts to map glutarylation sites revealed that multiple sites may substitute each other for glutarylation.
Our findings demonstrate addiction to GCDH signaling in melanoma, but not in breast, colon, or prostate tumor cells, consistent with unique gene expression profiles seen in melanoma upon GCDH inhibition (Extended data figure 5). Correspondingly, low GCDH expression coincides with better patient outcomes in melanoma but not in other tumor types. Selective GCDH dependency may be tissue dependent whereby distinct proteins are glutarylated in tumors other than melanoma, affecting diverse signaling pathways. Indeed, levels of glutarylated NRF2 detected in melanoma cells upon GCDH inhibition were significantly higher than in breast, prostate, and liver cancer cells (Figure 6B).
Although ablation of either GCDH or other components of the lysine catabolism pathway does not significantly impact normal development or tissue homeostasis, mice deficient in GCDH are vulnerable to excessive lysine or high protein diets26, implying that select diets may enhance cell death in GCDH-low tumor cells. Our in vivo data indicates that genetic GCDH inhibition attenuates melanoma growth, suggesting that GCDH is required for tumor cell growth, and may thus serve as therapeutic target in this tumor. Melanoma addiction to GCDH well illustrates the selective advantage of select metabolic cues for distinct tumor types.
Methods
Animal studies
All animal procedures were approved by the Institutional Animal Care and Use Committee (IACUC) of Sanford Burnham Prebys Medical Discovery Institute (approval number AUF 19–082). Animal experiments were performed at Sanford Burnham Prebys Medical Discovery Institute Animal Facility in compliance with the IACUC guidelines. The study is performed with all relevant ethical regulations regarding animal research and maximal tumour size/burden permitted (2 cm3) by ethics committee was not exceeded. The xenograft model was established using A375 cells expressing either control or shRNA targeting GCDH using doxycycline inducible PLKO-1 vector. NOD/SCID (NOD.CB17-Prkdcscid/J) mice were obtained from the SBP Animal Facility. Eight-week-old male NOD/SCID (NOD.CB17-Prkdcscid/J) mice were injected subcutaneously in the flank with 1 × 10⁶ A375 cells. Animals were housed in 4 mice per cage and maintained under controlled temperature (22.5°C) and illumination (12 h dark/light cycle) conditions. For in vivo GCDH KD experiments, mice were fed rodent chow containing 200 mg/kg doxycycline (Dox diet, Envigo) to induce GCDH-KD once tumor reach palpable size (day 5 post injection at about 50mm3 size). Mice were sacrificed upon signs of morbidity resulting from tumor growth. Tumor volume was measured with linear calipers and calculated using the formula: (length in mm × width in mm) x 1/2. After the mice were sacrificed, tumors were frozen or fixed in Z-Fix (Anatech). Snap-frozen tumors were utilized for protein extraction for further analysis.
Cell culture and reagents
Cancer cell lines (breast: SKBR3 and MCF7; prostate: PC-3 and DU145; liver: SK-HEP1 and PLC and melanoma: A375 and 1205LU) were obtained from ATCC. WM1346 and WM1366 and WM3629 melanoma cell lines were a gift from M. Herlyn (Wistar Institute), and the UACC-903 melanoma line was obtained from the University of Arizona Cancer Center. All lines were cultured in Dulbecco’s modified Eagle’s medium (DMEM; GE Healthcare), Minimum Essential Media (MEM) or RPMI 1640 Medium supplemented with 5% fetal bovine serum and penicillin–streptomycin. All cells were grown at 37 °C in a humidified atmosphere containing 5% carbon dioxide. Amino acids (L-lysine, L-arginine), the proteasome inhibitor MG132, the ATM Inhibitor KU-55933, the p53 inhibitor Pifithrin-α, IRE1 inhibitor 4μ8C, PERK inhibitor AMG PERK 44, hydrogen peroxide, glutamine and Emriscan, HA-agarose Affinity Gel and Z-VAD(OH)-FMK were purchased from Sigma-Aldrich.
siRNA, DNA constructs, transfection, and transduction.
Cells (1×10⁵) were seeded overnight (O/N) per well in 6-well plates. Negative control (NT-siRNA) or si-RNA targeting the transcript of interest was transfected utilizing jetPRIME® transfection reagent, as per manufacturer’s instructions (Polyplus, NY, USA). Following siRNAs were used: si-GCDH (SASI_Hs01_00246318 and SASI_Hs01_00246319), siDHTKD1 (SASI_Hs02_00352234 and SASI_Hs02_00352235), si-ATF4 (SASI_Hs02_00332313), si-ATF3 (NM_001030287), si-DDIT3 (SASI_Hs01_00153013), si-CHAC1 (SASI_Hs01_00146246), si-NRF2 (SASI_Hs01_00182393 and SASI_Hs02_00341015), si-AASS (SASI_Hs02_00340239 and SASI_Hs01_00016127) si-ADAT (SASI_Hs01_00091485 and SASI_Hs01_00091486) siECHS1 (SASI_Hs01_00085563 and SASI_Hs02_00336896), si-PERK (SASI_Hs01_00096844), si-eIF2α (SASI_Hs01_00202426), si-GCN2 (SASI_Hs01_00097889) and the negative control si-RNA (NT-siRNA; SIC001) were purchased from Sigma-Aldrich. Plasmid encoding HA-NRF2 (pLV-mCherry-CMV HA-NRF2) was synthesized by Vector builder, USA). Constructs expressing acetylation (HA-NRF2 K6R, K12R and K18R) and glycation mutants of NRF2(NRF2E79V-A6) were described previously46,47.
Cell proliferation and viability
For cell proliferation, 0.3–0.5×10⁵ cells were seeded O/N in triplicate in 6-well plate. Following treatment for the specified duration, cells were trypsinized and the cell count was determined with Neubauer hemocytometer (Celeromics, Cambridge, UK). To measure cell viability, cells were washed twice with cold PBS and fix for 10 minutes with ice-cold 100% methanol. Cells were then incubated with 0.5% crystal violet solution in 25% methanol for 10 minutes at room temperature. Crystal violet solution was removed, and cells washed in water several times, until the dye stops coming off. The culture plates were then dry at room temperature. For quantitation, 2 ml 10% acetic acid to each well (6 well) was incubate for 20 min with shaking (extraction). 0.5–1 ml of extracted stain was diluted 1:4 in water (dilution flexible based on signal intensity) followed by quantifying absorbance at 590 nm. The resulting reading were normalized as compared to absorbance from respective control cells.
SubG1 DNA content analysis to quantify apoptotic population
SubG1 DNA content analysis was performed for determination of apoptotic population, analyzed by propidium iodide staining (Sigma Aldrich). Briefly, 1 × 10⁶ cells were washed twice with cold PBS and fixed in 70% ethanol in PBS at 4°C overnight. Cells were washed, pelleted by centrifugation, and treated with RNase A (100 μg/mL) and propidium iodide (40 μg/mL) at room temperature for 30 min. Cell cycle distribution was assessed by flow cytometry (BD LSRFortessa™, BD Biosciences), and data was analyzed using Data was collected and analyzed using BD FACSDiva 8.0.1 and FlowJo 10.8.0 software.
Immunoblotting
Total protein was extracted in Laemmli buffer, fractionated by SDS polyacrylamide gels and transferred to PVDF membranes (Millipore Sigma, MA, USA). After blocking with 5% non-fat dry milk (BD Biosciences, CA, USA), the membranes were incubated with primary antibodies overnight at 4 °C. Afterwards, 2 hr incubation with HRP-conjugated secondary antibodies was performed. Following chemiluminescence reaction, the protein signal was visualized using the ChemiDoc imaging system (Bio-Rad, Hercules, CA) according to the manufacturer’s instructions. Antibodies used in this study are provided in Supplementary Table 3.
qPCR Analysis
1×10⁵ cells were seeded O/N per well in 6-well plates. Following treatment for 72 hr, total RNA was extracted using RNeasy Mini Kit (Qiagen, Hilden, Germany). cDNA was synthesized using oligo(dT) and random primers (AB Bioscience, MA, USA), and qPCR analysis was performed with SYBR Green (Roche, NJ, USA). Primers were designed using the PrimerQuest tool (Integrated DNA Technologies, CA, USA) and Primer Bank (https://pga.mgh.harvard.edu/primerbank/). β-Actin was used as an internal control. Primer efficiency was measured in preliminary experiments, and amplification specificity was confirmed by dissociation curve analysis. Sequence of the primers used in this study are provided in supplementary table 2.
Intracellular Glutarate Quantification
Cell extraction and GC-MS analysis for Glutarate quantification was performed as described in50. Intracellular metabolite amounts are expressed in nmol per cell sample (cells from one well of six-well plates; approximately 0.5 × 10⁶–1.0 × 10⁶ cells).
Cycloheximide chase assay
Cycloheximide chase was performed to measure relative stability of proteins. Briefly, cycloheximide (50 μg/ml) was added to cells for indicated times, and cell lysates were harvested and analyzed with the indicated antibodies51.
Immunoprecipitation
Protein–protein interactions of endogenous proteins was analyzed using a Co-Immunoprecipitation Kit (Thermo Scientific). For overexpressed HA-tag proteins, HEK293T cells were transfected with plasmids encoding the HA-NRF2 (pLV-mCherry-CMV HA-NRF2, Vector builder, USA). After 48 hr of transfection, cells were treated with MG132 for 4 hr and washed with PBS. Cells were lysed in IP milder Lysis/Wash Buffer (0.025M Tris, 0.15M NaCl, 0.001M EDTA, 1% NP-40, 5% glycerol; pH 7.4) and HA-antibody-conjugated agarose resin (Life technology) was added. It was rotated overnight at 4 °C. After incubation, resin was pelleted and washed with IP Lysis/Wash Buffer. It was boiled in 2 × SDS–PAGE loading buffer for 5 min and analysed by western blotting. For detection of glutarylated NRF2 from cell fractions (MF-membrane, NF-nuclear and CF-cytoplasmic), first cell fractionation was carried out using Cell Fractionation Kit (CST #9038). Equal amount of protein from purified fractions were incubated with HA beads overnight at 40 C.
In vitro glutarylation, KEAP1 binding and ARE-EMSA
HEK293T cells expressing HA-NRF2 were lysed in RIPA buffer (20mM Tris-HCl (pH 7.5), 150 mM NaCl, 1 mM Na2 EDTA, 1 mM EGTA, 1% NP-40, 1% sodium deoxycholate, 2.5 mM sodium pyrophosphate, 1 mM b-glycerophosphate, 1 mM Na3 VO4, 1 μg/ml leupeptin) containing N-Ethylmaleimide (NEM). The lysates were incubated with HA binding beads and washed with RIPA lysis buffer to retain HA-NF2 on beads and subjected to in vitro glutarylation reaction. For in Vitro Glutarylation of NRF2, purified HA-NRF2 in glutarylation buffer (50 mM HEPES [pH 8.0], 150 mM NaCl, and protease inhibitors) were mixed with different concentration of glutaryl-CoA or gluataric acid to form glutaryl-NRF2 (K Glu-NRF2) and control HA-NRF2 respectively. The reactions were incubated in an Eppendorf Thermomixer for 4 hr at 37°C at 400 rpm. To minimize condensation, samples were briefly centrifuged every hr during incubation. The washed HA-beads (described above) were then used for KEAP1 binding or EMSA directly. For KEAP1 binding assay, beads were incubated with cell extract (for KEAP1 binding) in IP lysis/wash buffer. After subsequent washing steps beads were boiled in 2X SDS sample buffer, the proteins were separated on SDS/PAGE and immunoblotted with indicated antibodies as described. For ARE-EMSA, equal amount of HA-NRF2 and K-Glu NRF2 were subjected to binding with ARE-Biotin labelled DNA probe (NRF2(ARE) EMSA Kit, Signosis) according to manufacturer instructions.
RNA extraction and RNA-seq library construction
For RNA-seq library construction, 0.3–0.5×10⁵ cells were seeded O/N in triplicate in 6-well plate before transfection. Cells were harvested 48 hr after siGCDH transfection for analysis of altered gene expression upon GCDH inhibition. Forty-eight h following transfection, total RNA was extracted using RNeasy Mini Kit (Qiagen, Hilden, Germany). For batch 1 of A375 siControl and siGCDH RNA-seq (Figure 2), libraries were prepared from total RNA using the QuantSeq 3′ mRNA-Seq Library Prep Kit FWD for Illumina from Lexogen. Barcoded libraries were pooled and single end sequenced (1×75) on the Illumina NextSeq 500 using the High output V2.5 kit (Illumina Inc., San Diego CA). For second batch of A375, SK-Hep1, and SKBR3 (Figure S6), RNA-seq, polyA RNA was isolated using the NEBNext® Poly(A) mRNA Magnetic Isolation Module and barcoded libraries were made using the NEBNext® Ultra II™ Directional RNA Library Prep Kit for Illumina®(NEB, Ipswich MA). Libraries were pooled and single end sequenced (1X75) on the Illumina NextSeq 500 using the High output V2 kit (Illumina Inc., San Diego CA).
RNA-Seq data analysis
For RNA-seq analysis, 0.3–0.5×10⁵ cells were seeded O/N in triplicate in 6-well plate before transfection. Cells were harvested 48 hr after siGCDH transfection for studies designed to analyze gene expression changes upon inhibition of GCDH protein expression. Illumina Truseq adapter, polyA, and polyT sequences were trimmed with cutadapt v2.3 using parameters “cutadapt -j 4 -m 20 --interleaved -a AGATCGGAAGAGCACACGTCTGAACTCCAGTCAC -A AGATCGGAAGAGCGTCGTGTAGGGAAAGAGTGT Fastq1 Fastq2 | cutadapt --interleaved -j 4 -m 20 -a “A{100}” -A “A {100}” - | cutadapt -j 4 -m 20 -a “T{100}” -A “T{100}” -”. Trimmed reads were aligned to human genome version 38 (hg38) using STAR aligner v2.7.0d52 with parameters according to ENCODE long RNA-seq pipeline (https://github.com/ENCODE-DCC/long-rna-seq-pipeline). Gene expression levels were quantified using RSEM v1.3.153 Ensembl gene annotation version 84 was used in the alignment and quantification steps. RNA-seq sequence, alignment, and quantification quality was assessed using FastQC v0.11.5 (https://www.bioinformatics.babraham.ac.uk/projects/fastqc/) and MultiQC v1.854. Biological replicate concordance was assessed using principal component analysis (PCA) and pair-wise pearson correlation analysis. Low-expressed genes were filtered out by applying the following criterion: estimated counts (from RSEM) ≥ number of samples * 5. Filtered estimated read counts from RSEM were compared using the R Bioconductor package DESeq2 v1.22.2 based on generalized linear model and negative binomial distribution55. Genes with Benjamini-Hochberg corrected p-value < 0.05 and fold change ≥ 2.0 or ≤ −2.0 were selected as differentially expressed genes. Differentially expressed genes were analyzed using Ingenuity Pathway Analysis (Qiagen, Redwood City, USA). RNA-seq main and supplemental figures were plotted using ggplot2 version 3.3.5 (H. Wickham. ggplot2: Elegant Graphics for Data Analysis. Springer-Verlag New York, 2016) and ComplexHeatmap56.
TCGA survival analysis
Gene expression (RNA-seq) and clinical data from TCGA Pan-Cancer 201857 were downloaded from cBioPortal58. Survival analysis was performed in R version 4.0.2 using survival (Therneau T (2020). A Package for Survival Analysis in R. R package version 3.2–7, URL: https://CRAN.R-project.org/package=survival.), survminer (Alboukadel Kassambara, Marcin Kosinski and Przemyslaw Biecek (2020). survminer: Drawing Survival Curves using ‘ggplot2’. R package version 0.4.8.999. http://www.sthda.com/english/rpkgs/survminer/), and maxstat (Torsten Hothorn (2017). maxstat: Maximally Selected Rank Statistics. R package version 0.7–25. https://CRAN.R-project.org/package=maxstat) packages. Optimal cutpoint for the categorization of TCGA samples as ‘high’ and ‘low’ GCDH expressors in each cancer type was determined using surv_cutpoint() and surv_categorize() functions from survminer package.
Measurement of cellular respiration
siRNA transfected A375 cells were plated at a density of 10,000 per well in a Seahorse XFp culture plate and cultured overnight before changing the medium to Seahorse XF base medium containing 1 g/l glucose and 2 mM glutamine, pH 7.4, and assaying oxygen consumption and extracellular acidification rates in the Seahorse XFp with successive additions of 1.5 mM oligomycin and 1.0 mM FCCP.
Statistical Analysis
Statistical significance between two groups was assessed by the unpaired Student’s t-test. Ordinary one-way ANOVA was used to analyze more than two groups. Two-way ANOVA was utilized to analyze cell proliferation and tumor volumes at multiple timepoints. GraphPad Prism version 8.0.0 (224), La Jolla, CA) was used for to perform all statistical calculations.
Data availability
RNA–seq data that support the findings of this study have been deposited in the Gene Expression Omnibus (GEO) under accession code GSE200424. The pan-cancer data were derived from the TCGA Research Network: http://cancergenome.nih.gov/. The data-set derived from this resource that supports the findings of this study is available in cBioPortal (https://www.cbioportal.org/). Databases/datasets used in the study for human genome and gene annotations: Human genome hg38, http://ftp.ensembl.org/pub/release-84/fasta/homo_sapiens/dna/; Ensembl human gene annotations version 84, http://ftp.ensembl.org/pub/release-84/gtf/homo_sapiens/. Source data for all the figures are provided as Statistics Source Data. All other data supporting the findings of this study are available from the corresponding author on reasonable request.
Extended Data
Extended Data Fig. 1.
GCDH inhibition promotes apoptosis of melanoma cells (A) UACC903 and 1205LU melanoma cells were transduced with siRNAs targeting AASS, AADAT, DHTKD1, GCDH, or ECHS1 or with a control sequence using Jetprime for 96 hr, followed by an analysis of cell viability. (B) Various melanoma cells were transfected with siRNAs targeting AASS, AADAT, DHTKD1, GCDH, or ECHS1 or with a control sequence for 72 hr, and then lysates were subjected to western analysis with indicated antibodies. (C) Cell growth after GCDH KD with two independent siRNAs for 0–96 hr in UACC903 or 1205LU cells. Proliferation was analyzed by counting cells at indicated time points. (D) UACC903 or 1205LU cells were transfected with GCDH siRNA for 72 hr, and then lysates were subjected to western analysis with indicated antibodies. (E) Viability assay of control or GCDH KD A375 cells treated with the caspase inhibitor Z-VAD(OH)-FMK (10μM for 48 hr). (F) A375 cells transfected with GCDH siRNA were grown in the indicated growth medium, and then viability was determined 96 hr-post transfections. (G) Measurement of basal, maximum oxygen consumption rate (OCR), and spare respiratory capacity using Agilent Seahorse XF Analyzers. A375 cells were transfected with GCDH siRNA for 48 hours before analysis. (H) Viability assay of immortalized H3A cells, 96 hr after transfection with indicated constructs. Viability was measured by quantifying crystal violet staining. (I) Immortalized H3A cells were transfected with siRNAs targeting AASS, AADAT, DHTKD1, GCDH, or ECHS1 or with a control sequence for 72 hours, then lysates were subjected to western analysis with indicated antibodies. Data are representative of three experiments for (B, D, and I) and presented as the mean values ± SD of n = 3 (A, C, and H), n= 4 (E and F) independent experiments and mean values ± SD of n = 6 technical replicates for (G). Each p value is adjusted to account for multiple comparisons. Statistical significance (indicated p-value or ns- not significant w.r.t control) was calculated using One-way ANOVA for (B, E ,F and H) and two-way ANOVA for (C). Statistics source data for Extended data figure 1 can be found in Source data files - Extended data figure 1 and uncropped scans of all blots and gels for Extended data figure 1 can be found in Source data files for blots - Extended figure 1.
Extended Data Fig. 2.
GCDH expression correlates with melanoma patients outcome (A) Survival correlation analysis of GCDH expression in various cancer subtypes (prostate adenocarcinoma (PRAD), breast cancer (BRCA), diffuse large B-cell lymphoma (DLBC), glioblastoma (GBM), acute myeloid leukemia (LAML), liver hepatocellular carcinoma (LIHC), lung adenocarcinoma (LUAD), and lung squamous cell carcinoma (LUSC), using TCGA. (B) Comparison of patient survival based on analysis of NRF2 expression in melanoma patients using TCGA. Total number (n) of patients = 428; n (NRF2 high) =362 and n (NRF2 low) =66. (C) Scatterplot depicting a comparison of GCDH and NRF2 expression levels in TCGA-SKCM (melanoma) patient cohort. GCDH and NRF2 expressions are anti-correlated (Spearman correlation coefficient = −0.41). (D) Boxplots depicting GCDH expression in NRF2 high (n=362) and NRF2 low (n=66) patient samples stratified according to survival analysis of TCGA-SKCM patient cohort based on NRF2 expression (refer to NRF2 survival analysis in (B). The difference in expression of GCDH between NRF2 high and low groups is statistically significant (p-value = 8.653e-14, calculated using two-sided Wilcoxon Rank Sum test). NRF2 low group minimum = 242.2, maximum = 1907, median = 815.6, 1st quartile (25th percentile) = 633 and 3rd quartile (75th percentile) = 1142.5. NRF2 high group minimum = 132.8, maximum =1242.4, median =556.4, 1st quartile (25th percentile) = 446 and 3rd quartile (75th percentile) = 686.6. (E) Various cancer cells were transfected with siRNAs targeting GCDH or with a control sequence for 72 hr, and then lysates were subjected to confirm GCDH-KD. (F) GCDH expression was compared among various cancer cells and immortalized H3A cells. HSP90 was used as a loading control. Data are representative of three experiments. Uncropped scans of all blots and gels for Extended data figure 2 can be found in Source data files for blots - Extended figure 2.
Extended Data Fig. 3.
DHTKD1 KD rescues GCDH KD- induced phenotypes. (A) Selected enriched canonical pathways from Ingenuity Pathway Analysis (IPA) of siGCDH vs. siControl differentially expressed genes. Shown pathways were selected from the top 20 canonical pathways based on enrichment p-value (p-value < 5.14e-3). (B) RT-qPCR analysis of UACC903 cells for relative expression of indicated transcripts following GCDH-KD or DHTKD1-KD alone or GCDH/DHTKD1 double KD. (C) Western blot analysis with indicated antibodies of lysates from A375 cells transfected with indicated siRNA for 96 hr. (D) RT-qPCR analysis of A375 cells for relative expression of indicated transcripts following GCDH-KD. (E) Western blot analysis on A375 cells after GCDH KD for 24–96 hr in A375 cells. Cells were transfected with siRNA targeting GCDH, and cell lysates were prepared at indicated time points. (F) SubG0 DNA content analysis by flow cytometry to evaluate A375 cell apoptosis. A375 cells were transfected for 72 hr with indicated siRNAs, harvested and fixed in ethanol, and stained with propidium iodide (PI). (G) Western blot analysis of indicated proteins in A375 cells following GCDH-KD or DHTKD1-KD alone or GCDH/DHTKD1 double KD. (H) Rescue of cell death seen in GCDH-KD 1205LU by DHTKD1-KD. Viability was measured by quantifying crystal violet staining. (I) Western blot analysis of indicated proteins in A375 lines. Data are representative of three experiments (C, E, G, and I), n= 1 experiment for F and presented as the mean values ± SD of n = 3 independent experiments for B, D and H. Statistical significance (indicated p-value or ns- not significant w.r.t control) was calculated using one-way ANOVA. Each p value is adjusted to account for multiple comparisons. Statistics source data for Extended data figure 3 can be found in Source data files - Extended data figure 3 and uncropped scans of all blots and gels for Extended data figure 3 can be found in Source data files for blots - Extended figure 3.
Extended Data Fig. 4.
GCDH antagonizes NRF2-mediated activation of ATF3/4-dependent apoptotic signaling (A) GC-MS analysis of glutarate concentrations in A375 cells. (B) Western blot analysis of indicated proteins in UACC903 cells, 72 hr after transfection with siRNAs targeting GCDH, NRF2, or DHTKD1 or combinations thereof. (C) RT-qPCR analysis of NRF2 transcript levels in A375 and UACC903 cells, 72 hr following transfection with GCDH siRNAs. (D) RT-qPCR analysis of ATF3, ATF4, DDIT3, and CHAC1 transcript levels in UACC903 cells, 72 hr following transfection with indicated siRNAs. (E) Western blot analysis of indicated proteins in UACC903 cells 72 hr following transfection with siRNAs targeting GCDH, ATF3, or DHTKD1 or combinations thereof. After quantification, signals obtained in panels B and E for 3 independent experiments were used to calculate the ratio of the indicated protein relative to HSP90 levels, described as fold change (FD) +/−SD for indicated proteins. (F) RT-qPCR analysis of ATF3, ATF4, DDIT3, and CHAC1 expression levels in UACC903 following transfection with indicated siRNAs. Data are representative of three experiments for (B and E), presented as the mean values ± SD of n = 3 independent experiments for C, D and F and mean values ± SD of n = 3 technical replicates for A. Statistical significance (indicated p-value or ns- not significant w.r.t control) was calculated using one-way ANOVA. Each p value is adjusted to account for multiple comparisons. Statistics source data for Extended data figure 4 can be found in Source data files - Extended data figure 4 and uncropped scans of all blots and gels for Extended data figure 4 can be found in Source data files for blots - Extended figure 4.
Extended Data Fig. 5.
Cell death upon GCDH KD in melanoma is ATF3/4-dependent (A) Selected upstream regulators and their activation z-scores obtained from Ingenuity Pathway Analysis (IPA) of differentially expressed (DE) genes in siGCDH vs. siControl comparisons in A375 (melanoma), SK-Hep1 (liver cancer), and SKBR3 (breast cancer). (B) Heatmap of log2 fold-changes of selected targets of ATF4-ATF3 computed from siGCDH vs. siControl comparisons in melanoma (A375), liver cancer (SK-Hep1), and breast cancer (SKBR3). Rows (genes) were hierarchically clustered. Missing values correspond to genes that were not expressed in the given samples. (C) RTqPCR analysis of ATF3, ATF4, DDIT3 and CHAC1 expression in various cancer cells transfected with indicated siRNAs. (D) Western blot analysis of indicated proteins in indicated cells 72 hr following transfection with control or GCDH siRNAs. Data are representative of three experiments for (D) and presented as the mean values +/− SD of n = 3 independent experiments for (C). Statistical significance (indicated p-value or ns- not significant w.r.t control) was calculated using one-way ANOVA. Each p value is adjusted to account for multiple comparisons. Statistics source data for Extended data figure 5 can be found in Source data files - Extended data figure 5 and uncropped scans of all blots and gels for Extended data figure 5 can be found in Source data files for blots - Extended figure 5.
Extended Data Fig. 6.
Lysine glutarylation antagonizes KEAP1 binding, increasing NRF2 stability (A) Cycloheximide (CHX) chase analysis of HA-NRF2 stability in control and GCDH KD HEK-293T cells ectopically expressing HA-NRF2. HEK293T cells were transfected for 72 hr with indicated constructs and treated with 50 μM Cycloheximide (CHX) for different time periods, followed by western blotting with indicated antibodies. After quantification, signals obtained were used to calculate HA-NRF2/HSP90 ratios and described as fold change relative to CHX treatment time = 0. (B) Immunoprecipitation and Western blot analysis of A375 transfected with indicated constructs. Cells were treated with the proteasomal inhibitor MG132 for 4 hr, followed by IP/Western blotting analysis with antibodies to detect K-Glu PTM, KEAP1, and NRF2. (C) Immunoprecipitation and Western blot analysis of UACC903 cells transfected with indicated constructs as described in (B). (D) HEK293T cells were transfected with HA-NRF2 for 72 hr, and NRF2 glutarylation was measured in HA-NRF2 pull-downs fractions using HA-binding beads. (E) Enrichment of NRF2 glutarylation in nuclear fractions was measured in HA-NRF2 pull-downs from HEK293T cells transfected with HA-NRF2 after an initial cell fractionation step to isolate membrane (MF), cytoplasmic (CF), and nuclear (NF) fractions. Successful fractionation was confirmed by immunoblotting with indicated markers: MF (E-cadherin), CF (GAPDH), and NF (Histone H3). (F) HEK293T cells transfected with indicated constructs and IP of indicated HA-NRF2 mutants using HA-affinity beads were performed, followed by Western blot analysis using K-Glu and HA-tag antibodies. (G) HEK293T cells were transfected with indicated constructs and IP of various HA-NRF2 mutants using HA-affinity beads, followed by Western blot analysis using K-Glu and HA-tag antibodies. After quantification, signals obtained were used to calculate K-Glu/HA-NRF2 ratios and described as fold change relative to HA-NRF2 control. After quantification, signals obtained in panels C for 3 independent experiments were used to calculate the ratio of the indicated protein relative to NRF2 levels in IP samples, described as fold change (FD) +/−SD for indicated proteins. Data are representative of three experiments. Statistics source data for Extended data figure 6 can be found in Source data files - Extended data figure 6 and uncropped scans of all blots and gels for Extended data figure 6 can be found in Source data files for blots - Extended figure 6.
Extended Data Fig. 7.
Melanoma Addiction to GCDH is mediated by NRF2 The model shows GCDH control of NRF2 glutarylation and the implications for ATF4-ATF3-DDIT3-CHAC1 signaling culminating in apoptosis of melanoma cells subjected to GCDH inhibition.
Supplementary Material
Supplemental Table 1. Patient survival based on GCDH expression in TCGA of melanoma specimens (relate to Figure 1I).
Supplemental Table 2. Differential gene expression in melanoma A375 cells subjected to siGCDH compared with siControl (batch1).
Supplemental Table 3-5. Differential gene expression in breast cancer SKBR3 (Table 3) liver cancer SK-HEP1 (Table 4) and melanoma A375 cells (Table 5-batch 2), based on RNAseq analyses of siGCDH compared with. siControl treated cells.
Supplementary Table 6. Sequence of the primers used in this study.
Supplementary Table 7. Complete list of antibodies used in this study.
Supplemental Figure 1. Gating strategy shown for FACS analysis shown in Extended Figure 3F.
Acknowledgments
We thank Donna D Zhang (University of Arizona) and Viraj R. Sanghvi (University of Miami) for providing us with the NRF2 mutants (HA-NRF2 K6R, K12R, and K18R) and Hans-Guido Wendel for providing us with NRF2-glycation mutant (NRF2E79V-A6), Yoav Altman for help with flow cytometry analysis, members of the Prebys Center for Chemical Genomics for help with the screen for GCDH inhibitors and members of the Ronai lab for discussions. NCI support (R35CA197465) to ZR and SBP support for translational initiatives (to ES and ZAR) is gratefully acknowledged. Sanford Burnham Prebys Shared Resources are supported by an NCI Cancer Center Support Grant (P30 CA030199). The funders had no role in study design, data collection and analysis, decision to publish or preparation of the manuscript.
Footnotes
Author Contributions Statement
SV, GP, AK, DS and YF performed experiments; DC, ER, and RM performed bioinformatic analyses; ZAR and SV designed the studies; ES, CTM, SHO, MJ designed GCDH targeting studies, and ZAR, SV, and ES wrote the manuscript.
Competing Interests Statement
ZAR and ER (fully divested) are founders and scientific advisors for Pangea Therapeutics. All other authors declare no conflict of interest.
Statistics Source Data. Consist of the actual values for each of the experiments performed and presented in the main and extended data figures, as referred to in Figure Legends.
Editor summary:
Verma et al demonstrate that GCDH depletion in melanoma cells induces NRF2 glutarylation, upregulates ATF4 and ATF3 signaling and promotes cell death, thereby suppressing tumour growth.
Peer review information:
Nature Cell Biology thanks Afshin Samali, Thales Papagiannakopoulos and the other, anonymous, reviewer for their contribution to the peer review of this work.
References
- 1.Palm W. & Thompson CB Nutrient acquisition strategies of mammalian cells. Nature 546, 234–242 (2017). [DOI] [PMC free article] [PubMed] [Google Scholar]
- 2.Zhu J. & Thompson CB Metabolic regulation of cell growth and proliferation. Nat Rev Mol Cell Biol 20, 436–450 (2019). [DOI] [PMC free article] [PubMed] [Google Scholar]
- 3.Vander Heiden MG & DeBerardinis RJ Understanding the Intersections between Metabolism and Cancer Biology. Cell 168, 657–669 (2017). [DOI] [PMC free article] [PubMed] [Google Scholar]
- 4.Lieu EL, Nguyen T, Rhyne S. & Kim J. Amino acids in cancer. Exp Mol Med 52, 15–30 (2020). [DOI] [PMC free article] [PubMed] [Google Scholar]
- 5.Hirschey MD & Zhao Y. Metabolic Regulation by Lysine Malonylation, Succinylation, and Glutarylation. Mol Cell Proteomics 14, 2308–2315 (2015). [DOI] [PMC free article] [PubMed] [Google Scholar]
- 6.Altman BJ, Stine ZE & Dang CV From Krebs to clinic: glutamine metabolism to cancer therapy. Nat Rev Cancer 16, 619–634 (2016). [DOI] [PMC free article] [PubMed] [Google Scholar]
- 7.Butler M, van der Meer LT & van Leeuwen FN Amino Acid Depletion Therapies: Starving Cancer Cells to Death. Trends Endocrinol Metab 32, 367–381 (2021). [DOI] [PubMed] [Google Scholar]
- 8.Lukey MJ, Katt WP & Cerione RA Targeting amino acid metabolism for cancer therapy. Drug Discov Today 22, 796–804 (2017). [DOI] [PMC free article] [PubMed] [Google Scholar]
- 9.Chaturvedi S, Hoffman RM & Bertino JR Exploiting methionine restriction for cancer treatment. Biochem Pharmacol 154, 170–173 (2018). [DOI] [PubMed] [Google Scholar]
- 10.Knott SRV et al. Asparagine bioavailability governs metastasis in a model of breast cancer. Nature 554, 378–381 (2018). [DOI] [PMC free article] [PubMed] [Google Scholar]
- 11.Maddocks ODK et al. Modulating the therapeutic response of tumours to dietary serine and glycine starvation. Nature 544, 372–376 (2017). [DOI] [PubMed] [Google Scholar]
- 12.Chang CH et al. Metabolic Competition in the Tumor Microenvironment Is a Driver of Cancer Progression. Cell 162, 1229–1241 (2015). [DOI] [PMC free article] [PubMed] [Google Scholar]
- 13.Nakaya M. et al. Inflammatory T cell responses rely on amino acid transporter ASCT2 facilitation of glutamine uptake and mTORC1 kinase activation. Immunity 40, 692–705 (2014). [DOI] [PMC free article] [PubMed] [Google Scholar]
- 14.Cruzat V, Macedo Rogero M, Noel Keane K, Curi R. & Newsholme P. Glutamine: Metabolism and Immune Function, Supplementation and Clinical Translation. Nutrients 10 (2018). [DOI] [PMC free article] [PubMed] [Google Scholar]
- 15.O’Neill LA, Kishton RJ & Rathmell J. A guide to immunometabolism for immunologists. Nat Rev Immunol 16, 553–565 (2016). [DOI] [PMC free article] [PubMed] [Google Scholar]
- 16.Ananieva E. Targeting amino acid metabolism in cancer growth and anti-tumor immune response. World J Biol Chem 6, 281–289 (2015). [DOI] [PMC free article] [PubMed] [Google Scholar]
- 17.Pathria G. & Ronai ZA Harnessing the Co-vulnerabilities of Amino Acid-Restricted Cancers. Cell Metab 33, 9–20 (2021). [DOI] [PMC free article] [PubMed] [Google Scholar]
- 18.Pathria G. et al. Translational reprogramming marks adaptation to asparagine restriction in cancer. Nat Cell Biol 21, 1590–1603 (2019). [DOI] [PMC free article] [PubMed] [Google Scholar]
- 19.Kim H. et al. PRMT5 control of cGAS/STING and NLRC5 pathways defines melanoma response to antitumor immunity. Sci Transl Med 12 (2020). [DOI] [PMC free article] [PubMed] [Google Scholar]
- 20.Leandro J. & Houten SM The lysine degradation pathway: Subcellular compartmentalization and enzyme deficiencies. Mol Genet Metab 131, 14–22 (2020). [DOI] [PubMed] [Google Scholar]
- 21.Fallarino F. et al. Modulation of tryptophan catabolism by regulatory T cells. Nat Immunol 4, 1206–1212 (2003). [DOI] [PubMed] [Google Scholar]
- 22.Schmiesing J. et al. Disease-Linked Glutarylation Impairs Function and Interactions of Mitochondrial Proteins and Contributes to Mitochondrial Heterogeneity. Cell Rep 24, 2946–2956 (2018). [DOI] [PubMed] [Google Scholar]
- 23.Tan M. et al. Lysine glutarylation is a protein posttranslational modification regulated by SIRT5. Cell Metab 19, 605–617 (2014). [DOI] [PMC free article] [PubMed] [Google Scholar]
- 24.Biagosch C. et al. Elevated glutaric acid levels in Dhtkd1-/Gcdh- double knockout mice challenge our current understanding of lysine metabolism. Biochim Biophys Acta Mol Basis Dis 1863, 2220–2228 (2017). [DOI] [PubMed] [Google Scholar]
- 25.Wajner M, Amaral AU, Leipnitz G. & Seminotti B. Pathogenesis of brain damage in glutaric acidemia type I: Lessons from the genetic mice model. Int J Dev Neurosci 78, 215–221 (2019). [DOI] [PubMed] [Google Scholar]
- 26.Zinnanti WJ et al. A diet-induced mouse model for glutaric aciduria type I. Brain 129, 899–910 (2006). [DOI] [PubMed] [Google Scholar]
- 27.Seminotti B. et al. Oxidative Stress, Disrupted Energy Metabolism, and Altered Signaling Pathways in Glutaryl-CoA Dehydrogenase Knockout Mice: Potential Implications of Quinolinic Acid Toxicity in the Neuropathology of Glutaric Acidemia Type I. Mol Neurobiol 53, 6459–6475 (2016). [DOI] [PubMed] [Google Scholar]
- 28.Rojo de la Vega M, Chapman E. & Zhang DD NRF2 and the Hallmarks of Cancer. Cancer Cell 34, 21–43 (2018). [DOI] [PMC free article] [PubMed] [Google Scholar]
- 29.Malhotra D. et al. Global mapping of binding sites for Nrf2 identifies novel targets in cell survival response through ChIP-Seq profiling and network analysis. Nucleic Acids Res 38, 5718–5734 (2010). [DOI] [PMC free article] [PubMed] [Google Scholar]
- 30.Hoetzenecker W. et al. ROS-induced ATF3 causes susceptibility to secondary infections during sepsis-associated immunosuppression. Nat Med 18, 128–134 (2011). [DOI] [PMC free article] [PubMed] [Google Scholar]
- 31.Romero R. et al. Keap1 mutation renders lung adenocarcinomas dependent on Slc33a1. Nat Cancer 1, 589–602 (2020). [DOI] [PMC free article] [PubMed] [Google Scholar]
- 32.Teske N. et al. Chemical hypoxia-induced integrated stress response activation in oligodendrocytes is mediated by the transcription factor nuclear factor (erythroid-derived 2)-like 2 (NRF2). J Neurochem 144, 285–301 (2018). [DOI] [PubMed] [Google Scholar]
- 33.Wakabayashi N. et al. Keap1-null mutation leads to postnatal lethality due to constitutive Nrf2 activation. Nat Genet 35, 238–245 (2003). [DOI] [PubMed] [Google Scholar]
- 34.Menegon S, Columbano A. & Giordano S. The Dual Roles of NRF2 in Cancer. Trends Mol Med 22, 578–593 (2016). [DOI] [PubMed] [Google Scholar]
- 35.Sporn MB & Liby KT NRF2 and cancer: the good, the bad and the importance of context. Nat Rev Cancer 12, 564–571 (2012). [DOI] [PMC free article] [PubMed] [Google Scholar]
- 36.Wu Z. et al. TPO-Induced Metabolic Reprogramming Drives Liver Metastasis of Colorectal Cancer CD110+ Tumor-Initiating Cells. Cell Stem Cell 17, 47–59 (2015). [DOI] [PubMed] [Google Scholar]
- 37.Cantor JR et al. Physiologic Medium Rewires Cellular Metabolism and Reveals Uric Acid as an Endogenous Inhibitor of UMP Synthase. Cell 169, 258–272 e217 (2017). [DOI] [PMC free article] [PubMed] [Google Scholar]
- 38.Mungrue IN, Pagnon J, Kohannim O, Gargalovic PS & Lusis AJ CHAC1/MGC4504 is a novel proapoptotic component of the unfolded protein response, downstream of the ATF4-ATF3-CHOP cascade. J Immunol 182, 466–476 (2009). [DOI] [PMC free article] [PubMed] [Google Scholar]
- 39.Cazzalini O, Scovassi AI, Savio M, Stivala LA & Prosperi E. Multiple roles of the cell cycle inhibitor p21(CDKN1A) in the DNA damage response. Mutat Res 704, 12–20 (2010). [DOI] [PubMed] [Google Scholar]
- 40.Afonyushkin T. et al. Oxidized phospholipids regulate expression of ATF4 and VEGF in endothelial cells via NRF2-dependent mechanism: novel point of convergence between electrophilic and unfolded protein stress pathways. Arterioscler Thromb Vasc Biol 30, 1007–1013 (2010). [DOI] [PubMed] [Google Scholar]
- 41.Kim KH, Jeong JY, Surh YJ & Kim KW Expression of stress-response ATF3 is mediated by Nrf2 in astrocytes. Nucleic Acids Res 38, 48–59 (2010). [DOI] [PMC free article] [PubMed] [Google Scholar]
- 42.Romero R. et al. Keap1 loss promotes Kras-driven lung cancer and results in dependence on glutaminolysis. Nat Med 23, 1362–1368 (2017). [DOI] [PMC free article] [PubMed] [Google Scholar]
- 43.Cullinan SB et al. Nrf2 is a direct PERK substrate and effector of PERK-dependent cell survival. Mol Cell Biol 23, 7198–7209 (2003). [DOI] [PMC free article] [PubMed] [Google Scholar]
- 44.Kobayashi A. et al. Oxidative stress sensor Keap1 functions as an adaptor for Cul3-based E3 ligase to regulate proteasomal degradation of Nrf2. Mol Cell Biol 24, 7130–7139 (2004). [DOI] [PMC free article] [PubMed] [Google Scholar]
- 45.He F. et al. NRF2 activates growth factor genes and downstream AKT signaling to induce mouse and human hepatomegaly. J Hepatol 72, 1182–1195 (2020). [DOI] [PMC free article] [PubMed] [Google Scholar]
- 46.Sanghvi VR et al. The Oncogenic Action of NRF2 Depends on De-glycation by Fructosamine-3-Kinase. Cell 178, 807–819 e821 (2019). [DOI] [PMC free article] [PubMed] [Google Scholar]
- 47.Sun Z, Chin YE & Zhang DD Acetylation of Nrf2 by p300/CBP augments promoter-specific DNA binding of Nrf2 during the antioxidant response. Mol Cell Biol 29, 2658–2672 (2009). [DOI] [PMC free article] [PubMed] [Google Scholar]
- 48.He CH et al. Identification of activating transcription factor 4 (ATF4) as an Nrf2-interacting protein. Implication for heme oxygenase-1 gene regulation. J Biol Chem 276, 20858–20865 (2001). [DOI] [PubMed] [Google Scholar]
- 49.Fujita K, Maeda D, Xiao Q. & Srinivasula SM Nrf2-mediated induction of p62 controls Toll-like receptor-4-driven aggresome-like induced structure formation and autophagic degradation. Proc Natl Acad Sci U S A 108, 1427–1432 (2011). [DOI] [PMC free article] [PubMed] [Google Scholar]
- 50.Ratnikov B. et al. Glutamate and asparagine cataplerosis underlie glutamine addiction in melanoma. Oncotarget 6, 7379–7389 (2015). [DOI] [PMC free article] [PubMed] [Google Scholar]
- 51.Verma S, Ali A, Arora S. & Banerjea AC Inhibition of beta-TrcP-dependent ubiquitination of p53 by HIV-1 Vpu promotes p53-mediated apoptosis in human T cells. Blood 117, 6600–6607 (2011). [DOI] [PubMed] [Google Scholar]
- 52.Dobin A. et al. STAR: ultrafast universal RNA-seq aligner. Bioinformatics 29, 15–21 (2013). [DOI] [PMC free article] [PubMed] [Google Scholar]
- 53.Li B. & Dewey CN RSEM: accurate transcript quantification from RNA-Seq data with or without a reference genome. BMC Bioinformatics 12, 323 (2011). [DOI] [PMC free article] [PubMed] [Google Scholar]
- 54.Ewels P, Magnusson M, Lundin S. & Kaller M. MultiQC: summarize analysis results for multiple tools and samples in a single report. Bioinformatics 32, 3047–3048 (2016). [DOI] [PMC free article] [PubMed] [Google Scholar]
- 55.Love MI, Huber W. & Anders S. Moderated estimation of fold change and dispersion for RNA-seq data with DESeq2. Genome Biol 15, 550 (2014). [DOI] [PMC free article] [PubMed] [Google Scholar]
- 56.Gu Z, Eils R. & Schlesner M. Complex heatmaps reveal patterns and correlations in multidimensional genomic data. Bioinformatics 32, 2847–2849 (2016). [DOI] [PubMed] [Google Scholar]
- 57.Hoadley KA et al. Cell-of-Origin Patterns Dominate the Molecular Classification of 10,000 Tumors from 33 Types of Cancer. Cell 173, 291–304 e296 (2018). [DOI] [PMC free article] [PubMed] [Google Scholar]
- 58.Cerami E. et al. The cBio cancer genomics portal: an open platform for exploring multidimensional cancer genomics data. Cancer Discov 2, 401–404 (2012). [DOI] [PMC free article] [PubMed] [Google Scholar]
Associated Data
This section collects any data citations, data availability statements, or supplementary materials included in this article.
Supplementary Materials
Supplemental Table 1. Patient survival based on GCDH expression in TCGA of melanoma specimens (relate to Figure 1I).
Supplemental Table 2. Differential gene expression in melanoma A375 cells subjected to siGCDH compared with siControl (batch1).
Supplemental Table 3-5. Differential gene expression in breast cancer SKBR3 (Table 3) liver cancer SK-HEP1 (Table 4) and melanoma A375 cells (Table 5-batch 2), based on RNAseq analyses of siGCDH compared with. siControl treated cells.
Supplementary Table 6. Sequence of the primers used in this study.
Supplementary Table 7. Complete list of antibodies used in this study.
Supplemental Figure 1. Gating strategy shown for FACS analysis shown in Extended Figure 3F.
Data Availability Statement
RNA–seq data that support the findings of this study have been deposited in the Gene Expression Omnibus (GEO) under accession code GSE200424. The pan-cancer data were derived from the TCGA Research Network: http://cancergenome.nih.gov/. The data-set derived from this resource that supports the findings of this study is available in cBioPortal (https://www.cbioportal.org/). Databases/datasets used in the study for human genome and gene annotations: Human genome hg38, http://ftp.ensembl.org/pub/release-84/fasta/homo_sapiens/dna/; Ensembl human gene annotations version 84, http://ftp.ensembl.org/pub/release-84/gtf/homo_sapiens/. Source data for all the figures are provided as Statistics Source Data. All other data supporting the findings of this study are available from the corresponding author on reasonable request.


