

Abstract
Alanine–serine–cysteine transporter 2 (ASCT2) is reported to participate in the progression of tumors and metabolic diseases. It is also considered to play a crucial role in the glutamate-glutamine shuttle of neuroglial network. However, it remains unclear the involvement of ASCT2 in neurological diseases such as Parkinson's disease (PD). In this study, we demonstrated that high expression of ASCT2 in the plasma samples of PD patients and the midbrain of MPTP mouse models is positively correlated with dyskinesia. We further illustrated that ASCT2 expressed in astrocytes rather than neurons significantly upregulated in response to either MPP+ or LPS/ATP challenge. Genetic ablation of astrocytic ASCT2 alleviated the neuroinflammation and rescued dopaminergic (DA) neuron damage in PD models in vitro and in vivo. Notably, the binding of ASCT2 to NLRP3 aggravates astrocytic inflammasome-triggered neuroinflammation. Then a panel of 2513 FDA-approved drugs were performed via virtual molecular screening based on the target ASCT2 and we succeed in getting the drug talniflumate. It is validated talniflumate impedes astrocytic inflammation and prevents degeneration of DA neurons in PD models. Collectively, these findings reveal the role of astrocytic ASCT2 in the pathogenesis of PD, broaden the therapeutic strategy and provide a promising candidate drug for PD treatment.
KEY WORDS: ASCT2, NLRP3, Astrocytes, Inflammation, Neurodegeneration, Drug screening, Talniflumate, Parkinson's disease
Graphical abstract
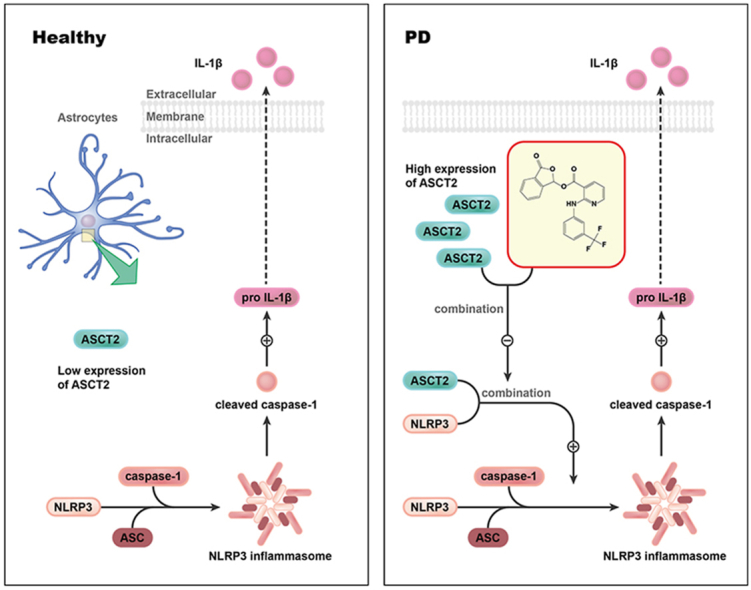
The binding of ASCT2 to NLRP3 aggravates astrocytic inflammasome-triggered neuroinflammation and talniflumate selected from a panel of 2513 drugs impedes ASCT2–NLRP3 complex and prevents dopaminergic neuron loss in Parkinson's disease models.
1. Introduction
Parkinson's disease (PD) is considered to be the most common neurodegenerative movement disorder, which is characterized by classical motor features of parkinsonism associated with loss of dopaminergic (DA) neurons in the substantia nigra pars compacta (SNpc) and accumulation of Lewy bodies1. Although l-DOPA replacement therapy improves the symptoms of most patients, it failed to effectively reverse the progressive loss of DA neurons in the SNpc. Emerging evidence has demonstrated that neuroinflammation contributes to the progression of PD2,3. The altered inflammatory response in immunosenescent glia cells may predispose the brain to neurodegenerative conditions such as PD, in which IL-1β and inflammasome signaling are characteristically observed4. Since glia cells-triggered neuroinflammation directly provokes the degeneration of DA neurons, exploring new therapeutic targets in neuro-glial networks to alleviate neuroinflammation may be promising for PD treatment.
NLRP3, the most commonly studied inflammasome in the brain, is widely located in microglia5, oligodendrocytes6 and astrocytes7. As an intracellular sensor, NLRP3 recognizes pathogen-associated molecular patterns (PAMPs) and damage-associated molecular patterns (DAMPs), resulting in assembly and activation of NLRP3 inflammasome. Upon activation, NLRP3 inflammasome triggers production of various pro-inflammatory cytokines, and creates an inflammatory microenvironment in the brain, leading to the degeneration of DA neurons8. Pharmacological inhibition of NLRP3 inflammasome activation has been proved to provide potent therapeutic effects in a wide variety of rodent models of inflammatory diseases9. These findings suggest that NLRP3 inflammasome is the foremost executor of neuroinflammation and it could be the potential therapeutic target of PD.
As the most abundant cell type in the brain, astrocytes perform many functions supporting neurons10. For example, astrocytes produce a variety of neurotrophins and glial transmitters which are involved in synaptic remodeling and nerve regeneration11,12. Emerging evidence also shows an association between astrocyte dysfunction and PD13. Glutamate–glutamine shuttle is crucial to maintaining the balance of neurotransmitters in the neuro–glial network. ASCT2 (alanine–serine–cysteine transporter 2, Slc1a5), a Na+-dependent neutral amino acid transporter encoded by the gene Slc1a5, is discovered to mediate the exchange of amino acid substrates and uptake of glutamine14. ASCT2 has been well studied in cancer research, and the high expression of ASCT2 is recognized as a promising prognostic marker in various cancers15, 16, 17, 18. Nevertheless, on the basis of the expression of ASCT2 in the brain19,20, data supported the hypothesis that ASCT2 could be responsible for glutamate reuptake in astrocytes in exchange for glutamine21. In the brain, the function of ASCT2 was mainly investigated in neurons22, while the role of ASCT2 in astrocytes remains unknown. Moreover, astrocytic ASCT2 in the pathogenesis and progression of PD is poorly documented.
In this study, we performed RNA sequencing in the plasma samples of PD patients and demonstrated abnormally upregulated expression of ASCT2. Notably, the expression of ASCT2 was strongly associated with Hohen-Yahr staging (H-Y staging) and unified Parkinson's disease rating scale-motor score (UPDRS-III) of PD patients. We illustrated that genetic ablation of astrocytic ASCT2 alleviated the neuroinflammation and promoted DA neuron recovery. In contrast, overexpression of ASCT2 aggravated neuroinflammation and contributed to DA neuron loss. Moreover, the binding of ASCT2 to NLRP3 aggravated astrocytic NLRP3 inflammasome activation. Furthermore, a panel of 2513 FDA-approved drugs were screened via virtual molecular docking with ASCT2. Through computational drug discovery strategy and target validation, we explored ASCT2 inhibitors and found anti-inflammatory and neuroprotective effects of talniflumate in PD models. Mechanistically, talniflumate inhibited the interaction between ASCT2 and NLRP3, counteracting the neuroinflammation induced by the activation of NLRP3 inflammasome. Taken together, these findings provide a new perspective on the importance of ASCT2 in mediating PD pathogenesis and treatment.
2. Material and methods
2.1. Animals
Adult or neonatal C57BL/6 mice were purchased from the Model Animal Research Center of Nanjing Medical University. Nlrp3−/− mice (male, 3-month-old) were obtained from Prof. Honghong Yao's laboratory. All animal care and procedures were performed following national and international guidelines and were approved by the Animal Resource Centre, Nanjing Medical University, Nanjing, China. Mice were housed in groups at 22–24 °C with a 12 h light–dark cycle and ad libitum access to regular chow diet and water. NLRP3-knockout mice on a C57BL/6 (inbred) genetic background were generated by 10 backcrosses. Three-month-old WT and Nlrp3−/− mice were used to generate a subacute MPTP-induced PD model. They were injected hypodermically (i.h.) with 20 mg/kg MPTP (Sigma–Aldrich, M0896) dissolved in saline once a day for 5 consecutive days and then left alone for 3 days. Mice in the treatment groups received 75 mg/kg GPNA (Macklin, N862159) or 50 mg/kg talniflumate (Sellect, S6439) i.g. daily starting 3 days before MPTP administration and continuing over the 5 MPTP injection days and the 3 subsequent days. Three days after the last MPTP injection, the mouse striatum was dissected and processed for immunoblotting and HPLC assay. In some cases, animals were perfused with 4% paraformaldehyde in 0.1 mol/L phosphate buffer (pH 7.4), and coronal cryo-sections at a thickness of 20 μm were prepared for immunohistochemistry.
All animal experiments were approved by the Institutional Animal Care and Use Committee of Nanjing Medical University (1601246-2) and complied with institutional guidelines. Patient experiments were approved by the Committee of Nanjing University of Chinese Medicine (2020NL-KS001).
2.2. Stereotaxic surgery
The stereotaxic surgery is under sodium pentobarbital anesthesia (40 mg/kg, sigma). AAV experiment: The AAV knockdown ASCT2 (AAV-shASCT2) and the empty vector (AAV-shCon) were injected into the mice's midbrain. Each mouse was microinjected with either AAV-shASCT2 or AAV-shCon (1 μL of 2 × 10¹³ viral genome/μL, Hanbio). The three-dimensional coordinates of the mice's midbrain are as follows: A/P −3.0 mm, R/L ±1.3 mm, and D/V −4.5 mm. To evaluate the effects of astrocytic ASCT2 on the mouse MPTP model, mice were divided into the following four groups 2 weeks after AAV microinjection: AAV-shCon + Saline, AAV-shASCT2 + Saline, AAV-shCon + MPTP, AAV-shASCT2 + MPTP. LV experiment: The lentivirus (LV) overexpressing ASCT2 (ASCT2 OE) and the empty vector (ASCT2 vec) were injected into the mice's midbrain. Each mouse was microinjected with either ASCT2 vec LV or ASCT2 OE LV (1.5 μL of 2 × 10⁹ viral genome/μL, Hanbio). To investigate whether NLRP3 rescued the effects of ASCT2 on the mouse MPTP model, mice were divided into the following four groups 2 weeks after LV microinjection: WT-ASCT2 vec + MPTP, WT-ASCT2 OE + MPTP, Nlrp3−/−-ASCT2 vec + MPTP, Nlrp3−/−-ASCT2 OE + MPTP.
2.3. Reagents
LPS (L-3129), Nigericin (N-7143) and ATP (A1852) were purchased from Sigma–Aldrich. Poly(dA:dt) (tlrl-patn), Flagellin (tlrl-stfla) and Pam3CSK4 (tlrl-pms) were purchased from Invivogen. MPTP (S4732), dihydroergotamine mesylate (S5751), fluocinolone acetonide (S2470), azilsartan medoxomil (S3057), vorapaxar (S8067), astemizole (S0398), eplerenone (S1707), drospirenone (S1377), ciclesonide (S4646) and talniflumate (S6439) were purchased from Selleck.
2.4. Primary cultures and transfection
Briefly, the midbrain of neonatal mice was separated from meninges and basal ganglia. Tissues were dissociated with 0.25% trypsin at 37 °C and terminated by DMEM supplemented with 10% FBS and 1% penicillin/streptomycin. Cells were plated on flasks, and the culture medium was replaced with fresh medium 24 h later. Then media were replaced every 3 days. DMEM medium was replaced before transfection. The ASCT2 siRNA purchased from GenePharma (Shanghai, China) were transfected into astrocytes using Lipofectamine 3000 reagent (Invitrogen, L3000015) according to the manufacturer's protocol. A control siRNA was used as a negative control. The plasmid overexpression of ASCT2 was purchased from Public Protein/Plasmid Library (Nanjing, China). The sequences of ASCT2 siRNA and plasmids were performed in Supporting Information Table S1.
2.5. Immunofluorescence assay
The process of preparing the brain section was the same as immunohistochemistry. Incubating with primary antibody (TH, 1:1000, Millipore, MAB318; Na-K-ATP, 1:100, #ab7671, Abcam; Tom20, 1:200, Abcam, ab56783; ASC, 1:100, AdipoGen, AG-25B-0006; ASCT2, 1:100, NBP1-89327, Novus) overnight. The secondary antibodies: Alexa Fluor 555 goat anti-mouse IgG (1:1000, Thermo), Alexa Fluor 488 goat anti-rabbit IgG (1:1000, Thermo) and Alexa Fluor 647 goat anti-rabbit IgG (1:1000, Thermo) for 1 h at room temperature. Finally, the sections were rinsed with PBS and sealed with ProLong™ Gold Antifade Mountant with DAPI (Lifetech). Fluorescently labeled sections were visualized with the confocal scanning laser microscope (Carl Zeiss, Germany).
2.6. QT-PCR
Total RNA was extracted from cells using TRIzol reagent (Invitrogen, Carlsbad, CA, USA). Reverse transcription of total RNA was carried out using TaKaRa Master Mix (TaKaRa, Japan). The primers were purchased and validated from Genescript (Nanjing, China). Real-time qPCR was carried out using SYBR Green Master Mix (Applied Biosystems) in a StepOnePlus instrument (Applied Biosystems). qPCR primers were designed using a primer design tool, and the sequences were in Table S1.
2.7. Western blot
The method was described in our previous publication23. Different antibody: mouse anti-TH (1:1000, Millipore, MAB318), rabbit anti-ASCT2 (1:1000, NBP1-89327, Novus), goat anti-IL-1β (1:1000, I-3767, Sigma), mouse anti-caspase-1 (1:1000, AG-20B-0042, Millipore), rabbit anti-NLRP3 (1:1000, AG-20B-0014-C100, AdipoGen), rabbit anti-p65 (1:1000, #3033, CST), rabbit anti-p-p65 (1:1000, #8242, CST), mouse anti-β-actin (1:1000, A5441, Sigma), mouse anti-GAPDH (1:1000, #97166S, CST), rabbit anti-GFAP (1:1000, MAB360, Millipore).
2.8. Immunohistochemistry
Brain slices were rinsed carefully in phosphate buffered saline (PBS) followed by 3% H2O2 for 30 min to quench the endogenous peroxidase activity then incubated with 0.3% Triton X-100 in PBS supplemented with 5% bovine serum albumin (BSA), for 1 h. After that, the sections were incubated with specific primary antibodies (mouse anti-TH Ab, 1:3000, #T1299, Sigma; mouse anti-GFAP Ab, 1:800, #MAB360, Millipore) in PBS containing 5% BSA at 4 °C overnight. After extensive washing, brain slices were incubated with secondary antibodies for 1 h at room temperature. Finally, the slides were incubated with diaminobenzidine (DAB) for 5 min. For Nissl staining, the slides were soaked in CV solution (0.1 g cresyl violet, 99 mL H2O and 1% acetic acid 1 mL) for 30 min at room temperature then dehydrated with alcohol and xylene. The brain slices were observed under stereomicroscope (Olympus). Stereo Investigator was used for the assessment of TH+ neurons, GFAP+ astrocytes and nissl+ cells in the SNpc.
2.9. Behavioral assays
Behavioral assays were performed 3 days after the final injection of MPTP or saline. For the locomotor activity test, mice were placed in an activity monitor chamber (20 cm × 20 cm × 15 cm) to acclimatize for 15 min before the start of the test. The track of the mice was recorded in 5 min and the speed was calculated using Open field software (Clever Sys Inc., VA, USA). For rotarod test, mice were placed in a separate compartment on the rod and tested at 6 × g for 5 min before being acclimatized to the rod with a fixed speed of 3.5 × g for 5 min for 2 consecutive days. The latency to fall was recorded using Rotarod Analysis System (Jiliang, Shanghai, China). For the pole test, mice were placed on the top of the wooden pole (diameter 1 cm, height 50 cm, rough surface). The time taken by the mice to reach the floor with their four paws was recorded as locomotion activity time T-total and the time taken by the mice to turn completely heads downward was recorded as T-turn time. Each mouse was accustomed to the apparatus on the day before testing. The test was performed three times to ensure accuracy.
2.10. Co-IP assay
Cell samples were harvested with lysis buffer (1% Triton X-100, 150 mmol/L NaCl, 50 mmol/L Tris, pH 8.0) containing protease inhibitors. Equal amounts of protein were then incubated with anti-NLRP3 flag or ASCT2 antibody at 4 °C overnight. Protein A/G PLUS-Agarose (Santa Cruz Biotechnology, SC-2003) was added to incubate with samples for 4 h at room temperature. The IP complexes were washed three times with lysis buffer and denatured by adding 2.5 × loading buffer, followed by boiling for 5 min. Western blotting analysis was used to detect the IP complexes further.
2.11. Label-free mass spectrometry
The method was described in a previous publication24. Anti-NLRP3 immunoprecipitated protein (500 μg for each sample) was digested according to the FASP procedure. Briefly, the detergent, DTT and other low-molecular-weight components were removed using 200 μL UA buffer by repeated ultrafiltration facilitated by centrifugation. The protein suspension was digested with 3 μg trypsin in 40 μL 25 mmol/L NH4HCO3 overnight at 37 °C. After digestion, the peptides in each sample were desalted on C18 cartridges, concentrated by vacuum centrifugation and reconstituted in 40 μL of 0.1% (v/v) trifluoroacetic acid. MS experiments were performed on a Q Exactive mass spectrometer coupled to an Easy nLC. Five micrograms of the peptide were loaded onto a C18-reversed-phase column in buffer A (2% acetonitrile and 0.1% formic acid) and separated with a linear gradient of buffer B (80% acetonitrile and 0.1% formic acid) at a flow rate of 250 nL/min controlled by IntelliFlow technology over 120 min. MS data were acquired using a data-dependent top10 method, which dynamically chooses the most abundant precursor ions from the survey scan (m/z 300–1800) for HCD fragmentation. Determination of the target value is based on predictive automatic gain control. Survey scans were acquired at a resolution of 70,000 at m/z 200, and the resolution for HCD spectra was set to 17,500 at m/z 200. The instrument was run with peptide recognition mode enabled. MS experiments were performed in triplicate for each sample. MS data were analyzed using MaxQuant software version 1.3.0.5 and were searched against the UniProtKB database.
2.12. Proximity ligation assay (PLA)
Protein interactions in astrocytes were detected using the Duolink PLA assay kit (Sigma–Aldrich, DUO92101) following the manufacturer's protocol. After treatments, cells on slides were fixed with 4% paraformaldehyde and permeabilized with 0.3% Triton X-100 in PBS. Blocking solution was added to the slides, which were incubated at 37 °C for 1 h. Then, the slides were incubated with rabbit primary ASCT2 antibody (Novus, NBP1-89327) and mouse primary NLRP3 antibody (AdipoGen, G-20B-0014-C10) at 4 °C overnight and then with PLA probe solution for 1 h at 37 °C. After being washed, the slides were incubated for 30 min at 37 °C and then incubated with the amplification solution at 37 °C for 100 min protected from light. Finally, cell nuclei were stained with DAPI (Invitrogen, D1306), and the slides were imaged using the confocal laser scanning microscopy platform Leica TCS SP8.
2.13. 3H-l-glutamine uptake assay
Cells (1 × 10⁵ cell/well) were incubated with [3H]-l-glutamine (400 nmol/L, Perkin Elmer) in MEM media (Life) for 15 min at 37 °C in the presence or absence of inhibitors. The cells were collected, transferred to 24-well plate harvester (PerkinElmer) and analyzed using a liquid scintillation counter (PerkinElmer).
2.14. Surface plasmon resonance (SPR)
SPR was performed using a BIAcore T200 instrument (GE Healthcare). ASCT2 protein (SL5-H5149) was purchased from ACRO Biosystems. NLRP3 protein was purchased from CUSBIO (#CSB-EP822275HU3). Different concentrations of ASCT2 (0.078–5 μmol/L) were run over SPR with the CM5 chip (GE, USA) using the running buffer containing 1.8 mmol/L KH2PO4, 10 mmol/L Na2HPO4, 137 mmol/L NaCl, 2.7 mmol/L KCl, and 0.005% Tween-20 (pH 7.8). The binding and dissociation rates were measured at a flow rate of 25 μL/min. The injection of the ligands was done for 1.5 min followed by a flow with ligand-free buffer to analyze the dissociation for 2.5 min. Curves were corrected for nonspecific ligand binding by subtracting the signal obtained for the negative control flow cell. The equilibrium dissociation constant (Kd) was derived from a simple 1:1 interaction model using the Reichert data evaluation software.
2.15. Microscale thermophoresis (MST)
Monolith Protein Labeling Kit RED-NHS labeling kit (L001) was purchased from NanoTemper Technologies (USA). In the NT.115 NanoTemper measurement, an infrared laser (IR laser) beam couples into the path of light (i.e., fluorescence excitation and emission) with a dichroic mirror and is focused into the sample fluid through the same optical element used for fluorescence imaging. The IR laser is absorbed by the aqueous solution in the capillary and locally heats the sample with a 1/e2 diameter of 25 μm. Up to 24 mW of laser power was used to heat the sample, without damaging the biomolecules. Thermophoresis of the protein in the presence of varying concentrations of drugs (50 nmol/L to 25 μmol/L) was analyzed for 30 s. Measurements were performed at room temperature and SD was calculated from three independent experiments. Data were normalized to either ΔForm [‰] (10×(Form (bound) − Form (unbound))) or Fraction bound (ΔForm [‰]/amplitude).
2.16. Ultra-performance liquid chromatography–mass spectrum (UPLC–MS)
The concentrations of analytes in human plasma were quantified using liquid chromatography–mass spectrometry with a Thermo TSQ Quantis LC–MS/MS System equipped with an electrospray ionization interface used to generate positive ions [M+H]+ for talniflumate and IS (Ramipril). The compounds were separated on a reversed-phase column (BEH C18, 100 mm × 2.1 mm internal diameter, 1.7 μm particle size; Waters, USA) with a mobile phase consisting of acetonitrile (B)/0.1% formic acid (A). An elution gradient was used as follows (0.0–1.0 min, B 10%; 1.0–3.0 min, B 10%–50%; 3.0–5.0 min, B 50%–100%; 5.0–6.0 min, B 100%). The mobile phase was eluted using an HP 1100 series pump (Agilent, Wilmington, DE, USA) at 0.2 mL/min, and the pressure was ∼60 psi. The turbo ion spray interface was operated in the positive ion mode at 3500 V and 350 °C. The operating conditions were optimized by the flow injection of a mixture of all analytes and were determined as follows: sheath gas (Arb), 50 L/min; auxiliary gas, 10.0 L/min; sweep gas (Arb), 1.0 L/min. Quantitation was performed by multiple reaction monitoring (MRM) of the precursor ions and the related product ions for talniflumate using the internal standard method with the peak–area ratios. The mass transition used for talniflumate and IS was m/z 415.05 → 132.9 (RF lens, 174 eV; collision energy, 55 eV) and 417.2 → 234.1 (RF lens, 147 eV; collision energy, 21.15 eV), respectively. The analytical data were processed by Analyst software (Ver. 1.4.1, Applied Biosystems).
2.17. Statistical analysis
Statistical analyses were performed using SPSS version 22.0 or GraphPad Prism 8.0 software, and all data were presented as mean ± standard error of mean (SEM) of at least three independent experiments; statistically significant by Student t-test. For comparisons, two-way ANOVA was assessed with Dunnett's multiple comparisons test, and detailed information was presented in figure legends.
3. Results
3.1. ASCT2 is upregulated in the plasma samples of PD patients
To study the function of ASCT2 in PD, we performed RNA sequencing in 4 pairs of PD patients and normal controls (Fig. 1A). The demographics and clinical characteristics of patients with PD and matched controls were performed in Supporting Information Tables S2 and S3. Volcano map and pathway enrichment analysis showed that genes were significantly correlated with neuroactive ligand-receptor interaction, cAMP signaling pathway, calcium signaling pathway, protein digestion and absorption, and glutamatergic synapse (P < 0.01, Fig. 1B). In the pathway analysis of the glutamatergic synapses, 8 of 30 genes closely related to PD were selected for further research (Fig. 1C). RT-PCR results validated that only Slc1a2 and Slc1a5 were significantly changed (P < 0.001) in the plasma samples of PD patients (Fig. 1D). Next, the ROC curve showed that the expression level of Slc1a5 was significantly correlated with dyskinesia in PD patients (AUC = 0.8633, P < 0.0001) which was better than Slc1a5 (AUC = 0.8056, P < 0.0001) (Fig. 1E and F and Supporting Information Fig. S1). More importantly, high expression of Slc1a5 was associated with the stage of PD as reflected by H-Y rating scale stage (R2 = 0.2607, P = 0.0039) and UPDRS score (R2 = 0.6747, P < 0.0001) (Fig. 1G and H). Collectively, the expression of ASCT2 is upregulated in PD patients and may be a potential biomarker for the diagnosis of PD.
Figure 1.

ASCT2 is upregulated in the plasma samples of PD patients compared with normal controls. (A) Heatmap and (B) Volcano map of relative expression (compared with the healthy people group) for each gene was generated. n = 4 samples/group. (C) Pathway enrichment analysis (KEGG) for genes expressed preferentially is shown. (D) Slc1a5 (gene-encoded ASCT2) was upregulated in the plasma samples of PD patients (n = 30 individuals/group) compared with those in normal controls (n = 30 individuals/group). Data represent the means ± SEM statistically significant by Student's t-test. ROC curve for diagnosis of Slc1a5 (E) and Slc1a2 (F). (G, H) Correlation analysis (Hoehn-Yahr and UPDRS) for individual ASCT2 to separate PD patients from normal controls.
3.2. Knockdown of astrocytic ASCT2 alleviates neuroinflammation in MPTP-induced PD mouse model
ASCT2 is expressed in both neurons and astrocytes as reported previously25. Here, we examined the expression of ASCT2 in brain slices by multi-immunohistochemical fluorescent staining. In the midbrain, ASCT2 was expressed at a low level in both neurons and astrocytes of saline group, while it was increased notably in astrocytes rather than neurons in MPTP-treated group, indicating astrocytic ASCT2 may play an important role in the PD model (Fig. 2A and B). In addition, increased expression of ASCT2 was found in the homogenate of midbrain samples in MPTP and LPS models (Fig. 2C and D and Supporting Information Fig. S2A and S2B). Interestingly, the expression of ASCT2 in the cortex and hippocampus was inconsistent with that in the midbrain, showing no alteration in the cortex and downregulated in the hippocampus (Supporting Information Fig. S2C–S2F). Then, we validated the expression and response pattern of ASCT2 in primary neurons and astrocytes treated with MPP+ or LPS/ATP. Consistent with the findings of brain slices, the expression of ASCT2 in astrocytes rather than neurons was elevated significantly in response to MPP+ or LPS/ATP stimulation (Fig. 2E and F and Supporting Information Fig. S2G–S2N). Meanwhile, co-localization of ASCT2/Tom20 and ASCT2/Na-K-ATP in astrocytes showed ASCT2 was evenly distributed in the cytoplasm, not in the mitochondrial (Fig. 2G and H). Moreover, it was generally considered that astrocytes undergo changes suffering diseases and injuries in the central nervous system, and transform good “resting astrocytes” into abnormal “reactivity astrocytes”26. In our study, it was observed after treatment with MPP+ or LPS/ATP, the morphology of astrocytes changed, and it showed upregulation and nuclear translocation of ASCT2 (Fig. 2I). Moreover, co-localization of ASCT2/MAP2 showed that ASCT2 was distributed mainly in neuronal cell bodies and it has no significant difference after MPP+ challenge (Fig. 2J).
Figure 2.

MPTP and LPS mediate the up-regulation of ASCT2 in primary astrocytes and mouse midbrain. (A) Representative images of immunofluorescence three-labeling GFAP/ASCT2 in saline and MPTP mice model. Red: GFAP; Green: ASCT2; Blue: DAPI. Scale bar: 100 μm. (B) Representative images of immunofluorescence three-labeling TH/ASCT2 in saline and MPTP mice model. Red: TH. Green: ASCT2. Blue: DAPI. Scale bar: 100 μm. Expression of ASCT2 in the midbrain of MPTP (C)/LPS-treated (D) PD mouse model was detected. Immunoblot analysis of ASCT2 in astrocytes after being treated with MPP+/LPS-treated was detected (E). Immunoblot analysis of ASCT2 in neurons after being treated with MPP+/LPS plus ATP was detected (F). (G, H) Representative images of immunofluorescence double-labeling ASCT2/Tom20 and ASCT2/Na-K-ATP. (I) Co-localization of ASCT2/Na-K-ATP in the astrocytes after treatment with LPS/ATP or MPP+-treated. Red, ASCT2; Green, Na-K-ATP; Blue, DAPI. (J) Co-localization of ASCT2/MAP2 in the astrocytes after treatment with LPS/ATP or MPP+-treated. Red, ASCT2; Green, MAP2; Blue, DAPI. Scale bar, 20 μm.
To further determine whether the upregulation of ASCT2 in astrocytes is responsible for PD progression, ASCT2 shRNA adeno-associated virus (AAV) which contains glial fibrillary acidic protein (GFAP) promoter was injected into the midbrain. The procedure of the experiment is shown in Fig. 3A. The shASCT2-GFAP-AAV injection reduced the expression of ASCT2 in the midbrain detected by qRT-PCR and immunoblotting (Fig. 3B). In behavioral tests, both movement distance and latency to fall were significantly decreased in MPTP-treated mice, which was obviously improved by knockdown of ASCT2 (Fig. 3C and D). In the rotarod test, MPTP-treated mice showed reduced latencies to fall, while this deficit was significantly ameliorated by ASCT2 knockdown (Fig. 3E). However, the increased retention period in the pole test was not affected by ASCT2 knockdown in the MPTP group (Supporting Information Fig. S3A). Besides, we also found that astrocytic ASCT2 knockdown prevented MPTP-induced loss of striatal dopaminergic fibers (Fig. 3F). Meanwhile, knockdown of ASCT2 rescued nissl positive (Fig. 3G and H) and TH positive neuron loss in the SNpc (Fig. 3J and K). HPLC analysis showed that the level of dopamine in the striatum was significantly decreased after MPTP injections, but ASCT2 knockdown mice exhibited higher level of dopamine than that in MPTP-treated mice (Fig. 3I and Supporting Information Fig. S3B–S3E). Furthermore, knockdown of ASCT2 alleviated GFAP+ astrocytes activation in vivo (Fig. 3L, M and Supporting Information Fig. S3J) and reduced neuroinflammation as reflected by decreased protein levels of caspase-1, IL-1β, and p-p65 in the striatum of ASCT2 shRNA-injected mice (Fig. 3N and Supporting Information Fig. S3F–S3I). Thus, these data indicate that specific downregulation of ASCT2 in astrocytes protects against DA neuron damage in PD mouse model, which may be attributed to the anti-inflammatory mechanism.
Figure 3.

Knockdown of astrocytic ASCT2 provides anti-inflammatory and neuroprotective effects in MPTP-induced PD mouse model. (A) A schematic diagram of the model injected AAV-GFAP-shASCT2 into the midbrain of mice. Immunoblot and co-localization of ASCT2 and GFAP after the AAV-GFAP-shASCT2 microinjection into the midbrain. Green, GFAP-shASCT2; Red, GFAP; Blue, DAPI. Scale bar, 50 μm. (B) Schematic diagram of MPTP-induced subacute PD mouse model. (C) Representative motor performance in the open field test. Mice were in an open field within 5 min and recorded simultaneously movement distance by the Top View Animal Behavior Analyzing System produced in the USA. (D) Movement distance in the open field test. (E) Time taken for mice residence in the bar (latency to fall). (F) Immunohistochemical staining of TH+ neuron in the striatum after sub-acute MPTP treatment (20 mg/kg i.h., q.d., 5 days). Scale bar, 200 μm. (G) Nissl staining of neuron in the SNpc after sub-acute MPTP treatment (20 mg/kg i.h., q.d., 5 days). (H) Counting nissl positive neuron cells in the SNpc. (I) The level of dopamine in mouse striatum homogenate was detected by HPLC analysis (n = 8). (J) Immunohistochemical staining of TH+ neuron in the SNpc after sub-acute MPTP treatment (20 mg/kg i.h., q.d., 5 days). (K) Counting TH+ neuron cells in the SNpc. (L) Immunohistochemical staining of GFAP positive astrocytes in the SNpc. (M) Counting GFAP positive astrocytes in the SNpc. Scale bar represents 200 μm (upper). Enlarge vision. Scale bar represents 80 μm (lower). (N) Immunoblot analysis of IL-1β, caspase-1, p65, p-p65 and TH. n = 6 mice per group. Scale bar, 200 μm. Data are presented as the mean ± SEM. ∗P < 0.05; ∗∗∗P < 0.001 vs. sh control, &P < 0.05; &&P < 0.01; &&&P < 0.001 vs. sh control + MPTP. Two-way ANOVA with Dunnett's multiple comparisons test.
3.3. ASCT2 knockdown inhibits NLRP3 inflammasome activation
Our previous study illustrated that suppression of NLRP3 inflammasome-derived IL-1β production is beneficial for PD patients and targeting the astrocyte-mediated inflammatory response is a promising strategy for PD treatment27. Considering that astrocytic ASCT2 knockdown alleviated GFAP+ astrocytes activation and neuroinflammation, the role of ASCT2 in neuroinflammation was further studied. It was shown that the mRNA levels of IL-1β, IL-6 and TNF-α were significantly increased after LPS/ATP stimulation, while overexpression of ASCT2 further increased IL-1β mRNA level (Fig. 4A, B and Supporting Information Fig. S4C). Then, we investigated the components of NLRP3 inflammasome and found that overexpression of ASCT2 aggravated the activation of NLRP3 inflammasome indicated by upregulation of caspase-1 and IL-1β after LPS/ATP incubation (Fig. 4C and Fig. S4E–S4G). Consistent with the results of immunoblotting, ASCT2 overexpression further increased the release of IL-1β but not IL-6 or TNF-α in LPS/ATP-stimulated astrocytes by ELISA (Fig. 4D). The phenomenon was also replicable in the LPS/nigericin stimulated model (Fig. 4E, F and Fig. S4H–S4J). Besides, overexpression of ASCT2 had no effect on AIM2 inflammasome activation (Fig. 4G, Fig. S4K and S4L). Given the low abundance of NLRP1 and NLRC4 in primary astrocytes (Fig. S4A and S4B), we only investigated the effect of ASCT2 on AIM2 and NLRP3 inflammasomes. It was reported that different types of inflammasomes were expressed in bone marrow-derived macrophages (BMDMs)28. Then we also confirmed that ASCT2 overexpression exclusively aggravated the activation of NLRP3 inflammasome in BMDMs, which had no effect on other inflammasomes (Supporting Information Fig. S5). Intracellular ASC specks are indicators of NLRP3 inflammasome activation28. As shown in Fig. 4H, ASCT2 overexpression facilitated the accumulation of ASC specks in astrocytes. On the contrary, downregulation of ASCT2 by small interfering RNA (siRNA) suppressed the activation of NLRP3 inflammasome and reduced the release of IL-1β significantly (Fig. 5A–C, Fig. S4D, S6A–S6F). Besides, ASC specks induced by LPS/ATP in the cytosol were diminished after being transfected with ASCT2 siRNA (Fig. 5D).
Figure 4.

Overexpression of ASCT2 aggravates NLRP3 inflammasome activation. (A) A series of cytokines were detected by QT-PCR while astrocytes were stimulated with LPS/ATP. (B) LPS (100 ng/mL) primed-primary astrocytes were transfected with ASCT2 overexpression plasmids and then stimulated with ATP (5 mM). Il-1β, Tnf-α, Il-6, Il-18, Il-10 and Nlrp3 were detected by QT-PCR. Data are presented as the mean ± SEM; statistically significant by Student t-test; ∗∗∗P < 0.001 vs. ASCT2 vec; ns, P > 0.05; ###P < 0.001 vs. ASCT2 vec + LPS/ATP; (C) IL-1β and caspase-1 from medium supernatants (SN) and pro-IL-1β and pro-caspase-1 from cell extracts (Lysates) were analyzed by immunoblotting while astrocytes were stimulated with LPS/ATP. (D) Secretions of IL-1β, IL-6, and TNF-α in supplement of astrocytes stimulated with LPS/ATP were detected by ELISA. (E) LPS (100 ng/mL) primed-primary astrocytes were transfected with ASCT2 overexpression plasmids and then stimulated with nigericin (5 μmol/L). IL-1β and caspase-1 from medium supernatants (SN) and pro-IL-1β and pro-caspase-1 from cell extracts (Lysates) were analyzed by immunoblotting while astrocytes were stimulated with LPS/nigericin. (F) Secretions of IL-1β, IL-6 and TNF-α in supplement of astrocytes stimulated with LPS/nigericin were detected by Elisa. (G) LPS (100 ng/mL) primed-primary astrocytes were transfected with ASCT2 overexpression plasmids and then stimulated with poly (dA:dT) (1.5 μg/mL). IL-1β and caspase-1 from medium supernatants (SN) and pro-IL-1β and pro-caspase-1 from cell extracts (Lysates) were analyzed by immunoblotting while astrocytes were stimulated with poly (dA:dT). (H) Cells were analyzed by immunostaining after being stimulated with LPS/ATP. The white arrow represents ASC specks. Data shown represent results from three independent experiments in which more than 300 cells were counted in each experiment. Scale bar: 20 μm (upper). Enlarge vision. Scale bar: 5 μm (lower). Data are presented as the mean ± SEM. ###P < 0.001 vs. ASCT2 vec; ns, P > 0.05; ∗P < 0.05; ∗∗P < 0.01 vs. ASCT2 vec + LPS/ATP. Two-way ANOVA with Dunnett's multiple comparisons test.
Figure 5.

Pharmacological and genetic inhibition of ASCT2 prevents NLRP3 inflammasome activation. (A) LPS (100 ng/mL) primed-primary astrocytes were transfected with ASCT2 siRNA (siASCT2#707 and siASCT2#1120) and then stimulated with ATP (5 mmol/L). IL-1β and caspase-1 from medium supernatants (SN) and pro-IL-1β and pro-caspase-1 from cell extracts (Lysates) were analyzed by immunoblotting while astrocytes were stimulated with LPS/ATP or LPS/nigericin (C). Secretions of IL-1β, IL-6 and TNF-α in supplement of astrocytes stimulated with LPS/ATP were detected by ELISA (B). (D) Primary astrocytes were transfected with ASCT2 siRNA (siASCT2#1120) and then stimulated with LPS/ATP. Cells were analyzed by Immunostaining. The white arrow represents ASC specks. Scale bar: 20 μm (upper). Enlarge vision. Scale bar: 5 μm (lower). Data are presented as the mean ± SEM; statistically significant by Student's t-test; ###P < 0.001 vs. siASCT2 nc; ns, P > 0.05; ∗∗∗P < 0.001 vs. siASCT2 nc + LPS/ATP. (E) LPS (100 ng/mL)-primed primary astrocytes were treated with GPNA (0.5 and 1 mmol/L) and then stimulated with ATP (5 mmol/L). IL-1β and caspase-1 from medium supernatants (SN) and pro-IL-1β and pro-caspase-1 from cell extracts (Lysates) were analyzed by immunoblotting. (F) WT mice were made MPTP (20 mg/kg i.h., q.d., 5 days)-induced PD model with GPNA (75 mg/kg i.g., q.d., 11 days) administration or not. Immunofluorescence staining of TH+ neuron in the SNpc after sub-acute MPTP treatment. Scale bar represents 200 μm. (G) Counting TH+ neuron cells in the SNpc (n = 4). (H) Immunohistochemical staining of GFAP+ astrocytes in the SNpc. Scale bar represents 200 μm (upper). Enlarge vision: Scale bar represents 80 μm (lower). (I) Counting GFAP+ astrocytes in the SNpc (n = 4). (J) NLRP3, p65, p-p65, caspase-1 and TH from mouse mesencephalon homogenate were analyzed by immunoblotting. Data are presented as the mean ± SEM. ∗P < 0.05; ∗∗∗P < 0.001 vs. saline group, &P < 0.05; &&P < 0.01 vs. MPTP group. Two-way ANOVA with Dunnett's multiple comparisons test.
Subsequently, ASCT2 inhibitor GPNA was used to confirm the regulatory role of ASCT2 in NLRP3 inflammasome activation. As shown in Fig. 5E, Fig. S6G and S6H, GPNA treatment can also inhibit NLRP3 inflammasome activation in primary astrocytes. In the PD mice model, mice that were dosed with GPNA rescued the loss of TH+ neurons markedly (Fig. 5F, G and Fig. S6I) and decreased the number of GFAP positive astrocytes (Fig. 5H and I) compared to MPTP-treated PD mice. Furthermore, caspase-1 expression was also altered by GPNA treatment (Fig. 5J and Fig. S6J–S6M). These results confirm a positive regulatory effect of ASCT2 on NLRP3 inflammasome activation in astrocytes.
3.4. ASCT2 knockdown inhibits NLRP3 inflammasome activation
As it was found that ASCT2 facilitated the activation of NLRP3, we sought to explore the interaction between ASCT2 and NLRP3 activation. Then we used 4D label-free mass spectrometry to detect proteins that bound to ASCT2. The volcano map showed that LPS activation enhances the binding of NLRP3 to ASCT2 (Fig. 6A, B and Supporting Information Fig. S7). Co-transfection of NLRP3 and ASCT2 in HEK-293T cells displayed an interaction between these two proteins (Fig. 6C and D). Then, we also validated this interaction in astrocytes. Activating NLRP3 inflam-masome by LPS/ATP stimulation engaged the interaction between ASCT2 and NLRP3, while ASCT2 inhibitor GPNA blocked this interaction (Fig. 6E). Subsequently, results of PLA indicated that LPS/ATP stimulation-induced cytoplasmic localized ASCT2–NLRP3 interactions (Fig. 6F). Moreover, virtual docking (Fig. 6G) and SPR (Fig. 6H) showed a strong binding between NLRP3 and ASCT2 (Kd ∼3.448 μmol/L). Then we used the primary astrocytes isolated from wild-type (WT) and NLRP3 knockout (Nlrp3−/−) mice to confirm the interaction. Results indicate that overexpression of ASCT2 could aggravate the production of IL-1β while this phenomenon could be abolished by knockout of Nlrp3 (Fig. 6I and J).
Figure 6.

Glutamine transporter activates astrocytic NLRP3 inflammasome activation via enhancing the interaction of ASCT2 and NLRP3. (A) Volcano plot of 4D label-free mass spectrometry-quantified proteins that bound ASCT2 with a significant fold change after LPS/ATP activation. (B) Representative fragmentation spectrum of GDILLSSLIR in NLRP3. (C) Immunofluorescent histochemical staining for ASCT2 and NLRP3 in HEK-293T cells. Red, NLRP3; Green, ASCT2; Blue, DAPI. Scale bar, 20 μm. (D) Flag-tagged NLRP3 construct and ASCT2 pcDNA3.1 construct was co-transfected in HEK-293T cells. Cell lysates were immunoprecipitated with anti-Flag antibody and then the samples were analyzed by immunoblotting. (E) Cell lysates of primary astrocytes treated with LPS/ATP and GPNA or not were immunoprecipitated with anti-ASCT2 antibody, and then the samples were analyzed by immunoblotting. (F) ASCT2 and NLRP3 proximity ligation signals. Primary astrocytes were stimulated with LPS/ATP for 6 h. Red, ASCT2-NLRP3; Green, phalloidin; Blue, DAPI. Scale bar, 20 μm. (G) ASCT2 (PDB: 5llm) was docked with NLRP3 (PDB: 5NPY), the lowest binding position (−7.6 kcal/mol) was selected, and all amino acids within 1 Å of ASCT2 were displayed by PyMOL software. (H) SPR was used to detect the equilibrium dissociation constant (Kd) between ASCT2 and NLRP3. (I) LPS (100 ng/mL) primed-primary astrocytes isolated from WT and Nlrp3−/− mice that were transfected with ASCT2 overexpression plasmids and then stimulated with ATP (5 mmol/L). Scale bar, 100 μm. IL-1β and caspase-1 from SN and pro-IL-1β and pro-caspase-1 from cell extracts (Lysates) were analyzed by immunoblotting. (J) Secretion of IL-1β in supplement of astrocytes stimulated with LPS/ATP was detected by ELISA. Data are presented as the mean ± SEM; statistically significant by Student's t-test; ∗P < 0.05 vs. WT ASCT2 vec + LPS/ATP group; ns, P > 0.05 vs. Nlrp3−/− ASCT2 vec + LPS/ATP group.
3.5. Knockout of NLRP3 abolishes ASCT2-aggravated DA neuron damage and astrocyte activation in vivo
As it was demonstrated that ASCT2 had an interaction with NLRP3, WT and Nlrp3−/− mice were used to confirm the regulatory role of ASCT2 in NLRP3 inflammasome activation. The LV-GFP-ASCT2 injection elevated the expression of ASCT2 in the midbrain reflected by immunofluorescence and immunoblotting experiments (Fig. 7A and Supporting Information Fig. S8A–S8C). The overexpression of ASCT2 (ASCT2 OE) aggravated movement disorders in the MPTP-treated WT but not in Nlrp3−/− mice by decreasing movement distance in the open field test and increasing the duration of immobility in the pole test (Fig. 7B–D). As shown in Fig. 7E and F, TH+ neurons in the SNpc were further lost with ASCT2 OE in the MPTP-treated WT but not in Nlrp3−/− mice. HPLC analysis showed that the level of dopamine in the striatum was decreased in ASCT2 OE compared with ASCT2 vector group after MPTP injections. However, Nlrp3−/− knockout abolished the decrease of dopamine induced by ASCT2 OE in MPTP model mice (Fig. 7I and Fig. S8D–S8H). Similarly, immunohistochemistry staining of DAT and TH in the striatum and Nissl staining confirmed the loss of dopamine and DA neurons exacerbated by ASCT2 OE in the WT but not in Nlrp3−/− mice administrated with MPTP (Fig. 7J and Fig. S8I–S8K). Besides, NLRP3 deficiency also attenuated ASCT2 OE-intensified astrocytes activation after MPTP injections evidenced by the decreased number of GFAP+ cells (Fig. 7G and H). Subsequently, microinjection of ASCT2 lentivirus increased MPTP-induced neuroinflammation in the midbrain of WT mice, as reflected by the higher levels of NLRP3, pro-IL-1β, caspase-1, IL-1β. And this aggravated inflammatory effect was abolished in Nlrp3−/− mice (Fig. 7K and Fig. S8L–S8P). These results suggest that NLRP3 is a critical molecule in mediating ASCT2 upregulation-induced astrocytic inflammatory reaction.
Figure 7.

Knockout of NLRP3 abolishes ASCT2-induced activation of neuroinflammation. (A) A schematic diagram of the model injected ASCT2 overexpression LV to the midbrain of mice. Immunoblot and co-localization of ASCT2 and GFAP after LV-GFP-ASCT2 microinjection into the midbrain. (B) Representative motor performance in the open field test. Mice were in an open field within 5 min, and recorded simultaneously movement distance by the Top View Animal Behavior Analyzing System produced in the USA. (C) Movement distance in the open field test. (D) Time is taken for mice residence in the bar (T-TLA). (E) Immunohistochemical staining of TH+ neuron in the SNpc after sub-acute MPTP treatment (20 mg/kg i.h., q.d., 5 days). (F) Counting TH+ neuron cells in the SNpc. (G) Immunohistochemical staining of GFAP+ astrocytes in the SNpc. (H) Counting GFAP+ astrocytes in the SNpc. (I) The level of dopamine in mouse striatum homogenate was detected by HPLC analysis. (J) Immunohistochemical staining of TH+ neuron in the striatum after sub-acute MPTP treatment (20 mg/kg i.h., q.d., 5 days). (K) Immunoblot analysis of NLRP3, IL-1β, caspase-1, p-p65, p65 and TH. n = 10–12 mice per group. Scale bar, 200 μm. Data are presented as the mean ± SEM. ∗P < 0.05; ∗∗P < 0.05 vs. WT ASCT2 vec + MPTP group; ns, P > 0.05 vs. Nlrp3−/− ASCT2 vec + MPTP group. Two-way ANOVA with Dunnett's multiple comparisons test.
3.6. Pharmacological inhibition of ASCT2 impedes NLRP3 inflammasome activation and protects DA neurons in PD models
As we understand the pro-inflammatory effect of ASCT2, seeking effective ASCT2 inhibitors is promising to alleviate neuroinflam-mation in PD. However, available ASCT2 inhibitors are non-selective and inefficient, such as GPNA29. Then we performed a panel of 2513 FDA-approved drugs via virtual molecular screening. Nine drugs were selected that probably bind with ASCT2 (Fig. 8A and Supporting Information Fig. S9A). As ASCT2 is a glutamine transporter, the effects of the 9 drugs on relative glutamine uptake were detected. 4 in 9 drugs (S8067, S6439, S0398, and S4646) showed similar inhibitory effects as ASCT2 inhibitor GPNA on glutamine uptake which excluded the possibility of off-target (Fig. 8B). Then the anti-inflammatory effect of these 9 drugs was validated by western blotting and ELISA in BMDMs. Results reveal that 3 of 9 drugs (S8067, S6439 and S4646) remarkably reduced the levels of caspase-1 and IL-1β in the supernatant (Fig. 8C, D and Fig. S9C–S9E). Consistently, S8067, S6439 and S4646 also significantly inhibited ATP-induced cleavage of caspase-1 and IL-1β production in astrocytes (Fig. 8E). Astrocytes treated with the 4 compounds (S4646, S6439, S8067 and S0398) at 10 μmol/L concentration exhibited normal cell morphology and cell viability, indicating that these compounds at 10 μmol/L are non-toxic for astrocytes (Fig. S9B). Then, microscale thermophoresis (MST) was designed to explore 4 molecules directly bind with ASCT2 (Fig. 8F and Fig. S9F–S9H). According to Kd values, all of these 4 drugs have a good combination with ASCT2. Considering the poor anti-inflammatory activity (Fig. 8D, P > 0.05), S0398 was excluded for further study. Subsequently, immunoprecipitation and proximity ligation assay illustrated talniflumate (S6439) as the best ASCT2 inhibitor which can strongly inhibit the combination between ASCT2 and NLRP3 (Fig. 8G and H). Moreover, while astrocytes were transfected with siRNA of ASCT2, the anti-inflammation effect of talniflumate was abolished (Fig. 8I and J). We further treated PD model mice with talniflumate so as to evaluate the neuroprotective effect of this potent compound. UPLC–MS showed that talniflumate could pass through the BBB (Supporting Information Figs. S10A–S10C). Both movement distances and latency to fall were significantly decreased in MPTP mice, which was obviously ameliorated by talniflumate treatment (Fig. 8K–N). Subsequently, mice that were dosed with talniflumate exhibited significantly more TH+ neurons and lower GFAP+ astrocytes in the MPTP group (Fig. 8O–R and Fig. S10D). As shown in Fig. 8S and Fig. S10E, pretreatment of talniflumate decreased caspase-1 and IL-1β levels in the striatum of MPTP-treated mice. These results reveal that interrupting ASCT2–NLRP3 combination suppresses neuroinfla-mmation and provides neuroprotection in the MPTP mouse model, indicating ASCT2 as a promising target for the anti-inflammatory treatment of PD.
Figure 8.

Talniflumate reduces dopaminergic neuron loss and inhibits neuroinflammation via ASCT2 in the PD mouse model. (A) ASCT2 was docked with 2513 drugs in FDA approved drug database. Nine drugs were selected for further study. (B) Relative glutamine uptake was detected after being pretreated with these drugs for 12 h at a concentration of 10 μmol/L. (C) LPS (100 ng/mL) primed-primary astrocytes were treated with these 9 drugs and then stimulated with ATP (5 mmol/L). IL-1β and caspase-1 from SN and pro-IL-1β and pro-caspase-1 from cell extracts (Lysates) were analyzed by immunoblotting while astrocytes were stimulated with LPS/ATP. (D) Secretion of IL-1β in supplement of astrocytes stimulated with LPS/ATP and these 9 drugs were detected by ELISA. (E) S4646, S8067 and S6439 were selected to validate the anti-inflammatory effect in astrocytes. (F) Purified recombinant ASCT2 was mixed with S6439 and detected by MST. (G) Cell lysates of primary astrocytes treated with LPS/ATP and S4646/S8067/S6439 or not were immunoprecipitated with anti-ASCT2 antibody, and then the samples were analyzed by immunoblotting. (H) Primary astrocytes were pretreated with LPS (100 ng/mL) and 10 μmol/L S6439 (talniflumate) for 2 h and then stimulated with ATP (5 mmol/L). ASCT2 and NLRP3 proximity ligation signals. Scale bar, 20 μm. LPS (100 ng/mL) primed-primary astrocytes were transfected with ASCT2 siRNA#1120 or negative control for 48 h, pretreatment with talniflumate (10 μmol/L), and then stimulated with ATP (5 mmol/L). IL-1β and caspase-1 from SN and pro-IL-1β and pro-caspase-1 from cell extracts (Lysates) were analyzed by immunoblotting (I). Secretion of IL-1β in supplement of astrocytes stimulated with LPS/ATP was detected by ELISA (J). Data are presented as the mean ± SEM; statistically significant by Student's t-test; ∗∗P < 0.01 vs. PBS group; ns, P > 0.05; ##P < 0.01 vs. LPS/ATP group. (K) WT mice were made MPTP (20 mg/kg i.h., q.d., 5 days)-induced PD model with Talniflumate (50 mg/kg i.g., q.d., 11 days) administration or not. Immunohistochemical staining of TH+ neuron in the SNpc after sub-acute MPTP treatment. (L) Mice were in an open field within 5 min and recorded movement distance (n = 6). (M, N) Movement distance in open field test, latency to fall, time is taken for mice residence in the bar (T-TLA) were detected. (O, P) Immunohistochemical staining of TH+ neuron in the SNpc after sub-acute MPTP treatment and counting TH+ neuron in the SNpc. (Q, R) Immunohistochemical staining of GFAP positive astrocytes in the SNpc and counting GFAP positive astrocytes in the SNpc. Scale bar, 200 μm. (S) Immunoblot analysis of NLRP3, IL-1β, caspase-1, p-p65, p65, and TH. n = 6 mice per group. ∗P < 0.05; ∗∗P < 0.01; ∗∗∗P < 0.001 vs. saline group, &P < 0.05; &&P < 0.01; &&&P < 0.001 vs. MPTP group. Two-way ANOVA with Dunnett's multiple comparisons test.
4. Discussion
ASCT2 was firstly reported to exhibit Na+-dependent uptake of neutral amino acids such as l-alanine, l-serine, and l-glutamine about two decades ago20. Since then, most studies showed that ASCT2 was a potential therapeutic target for various cancers30,31 and immune diseases32. However, little was known about the role of ASCT2 in PD pathogenesis. In this study, we identified that ASCT2 was upregulated in the plasma samples of PD patients and its expression level was correlated with H-Y staging/UPDRS score of PD patients. It was demonstrated that ASCT2 increased predominantly in mesencephalic astrocytes of MPTP-treated PD mouse model and overexpression of ASCT2 promoted NLRP3 inflammasome activation, caspase-1 cleavage and IL-1β release in primary astrocytes. Interestingly, we noticed that the expression of ASCT2 was decreased in the hippocampus. We speculated there were two possible reasons. ASCT2 was significantly upregulated in astrocytes while treated with MPP+. Moreover, significant activation of astrocytes mainly occurred in the SNpc. In the MPTP mouse model, it did not exist the proliferation and activation of astrocytes in the hippocampus markedly. Moreover, Due to discrepancies in the preferred substrate, we speculated that the expression and functions of ASCT2 may be dynamically changing as the metabolic substrate alteration in different brain regions related to the disease models33, 34, 35. Reversely, knockdown of astrocytic ASCT2 inhibited NLRP3 inflammasome activation in the SNpc of MPTP-treated PD mice. Interestingly, the binding of ASCT2 to NLRP3 aggravated astrocytic NLRP3 inflammasome activation. Therefore, a panel of FDA-approved drugs was docked with ASCT2 using virtual screening and it was validated that talniflumate protected DA neurons by interrupting ASCT2–NLRP3 combination in PD models. Our study demonstrates the role of astrocytic ASCT2 in PD pathogenesis for the first time and provides experimental evidence supporting ASCT2 as a potential molecular target for PD therapeutics.
As we know, ASCT2 mediated the exchange of amino acid substrates, which was crucial for the uptake of glutamine by rapidly growing tumor cells. Therefore, knockdown of ASCT2 induced glutamine starvation so it can interfere with tumor metabolism, inhibit tumor proliferation and survival36. In this study, we found knockdown of astrocytic ASCT2 abolishes the GFAP+ astrocytes activation which was mainly distributed to the NLRP3 inflammasome activation (Fig. 7G–K). Also, it had been demonstrated in Nlrp3−/− primary astrocytes and Nlrp3−/− mice model (Figure 6, Figure 7). Previously it had been reported that ASCT2 was mainly located on the plasma membrane of cancer cells and associated with membrane transport systems37. In our study, it was identified that ASCT2 was also expressed both on the plasma membrane and in the cytoplasm of primary astrocytes. Intriguingly, MPP+ or LPS/ATP treatment increased the expression of ASCT2 and triggered the nucleus translocation of ASCT2 in astrocytes. These results suggest that there may exist a new mechanism regulating NLRP3 inflammation independent of the function of membrane transporter. Since our data suggested that overexpression of ASCT2 protected DA neurons and aggravated the activation of GFAP+ astrocytes in the MPTP model, the effect of ASCT2 on neuroinflammation might be overlooked formerly. Therefore, gain and loss of function studies were used to validate the role of ASCT2 in NLRP3 inflammasome activation. Besides, a series of methods (SPR, co-localization and PLA) were used to verify that ASCT2 was directly combined with NLRP3. Then the spatial conformation of NLRP3 changed, facilitated assemble and activate with ASC. Virtual docking and database (Uniport) predicted that domain (106–482) of ASCT2 was the potential binding site with NLRP3. Next, we further illustrated the mechanism that ASCT2 is an endogenous “danger” molecular sensing intracellular metabolic stress and activating NLRP3 mediated neuroinflammation.
Based on the above studies, ASCT2 was expected to be a promising target for PD therapeutics. However, inhibitors currently in use had the disadvantage of low selectivity, high toxicity, difficulty penetrating the blood–brain barrier (BBB) and drug resistance etc. Besides the tool drug GPNA, several compounds such as compound 12 and V-9302 which were identified as ASCT2 inhibitors were reported that they inhibited not only ASCT2 but also SLC38A2 and SLC7A529,37,38. So, it was crucially important to obtain efficient ASCT2 inhibitors from drug screening. In order to improve safety, a panel of 2513 FDA-approved drugs were screened via virtual docking. Then it was demonstrated nine compounds had potential binding with ASCT2. Thus, uptake of 3H-glutamine assay was used to validate the target ASCT2. Our data show that these 8 compounds in 9 (except S3057) inhibited the uptake of 3H-glutamine significantly. Furthermore, 3 drugs of 9 (S8067, S6439, and S4646) remarkably reduced the levels of caspase-1 and IL-1β in the supernatant. Finally, S6439 (talniflumate) was selected as the best ASCT2 inhibitor for further research by MST and PLA.
Talniflumate, a prodrug of niflumic acid, is a potent analgesic and anti-inflammatory drug that has been widely used for the treatment of rheumatoid diseases. Notably, it was developed as a mucin regulator for the treatment of cystic fibrosis, chronic obstructive pulmonary disease and asthma38,39. It was suggested that it worked in the peripheral nervous system, but whether it can pass through BBB had not been reported. In our study, UPLC–MS was used to demonstrate that the drug talniflumate could pass through BBB (Figs. S10B and S10C) and behavior tests indicate that talniflumate has no toxic effects on mouse cognitive function (Supporting Information Fig. S11). And we found talniflumate inhibited neuroinflammation by directly targeting ASCT2 to disrupt ASCT2–NLRP3 complex formation for NLRP3 inflammasome activation. Talniflumate also exhibited more TH positive neurons and lower GFAP positive astrocytes significantly in the MPTP group. All these results reveal that “conventional drugs in new use” may be promising to develop the new therapeutic strategies and talniflumate would be raising the hope for PD treatment.
5. Conclusions
Our study demonstrates that astrocytic ASCT2 is involved in the glial inflammatory response and the progression of PD. It illustrates a novel mechanism of NLRP3 inflammasome activation, which extends our insight into the function of ASCT2. Screening based on this target, talniflumate is obtained as the potent ASCT2 inhibitor. It impedes NLRP3 inflammasome activation and protects DA neurons in PD models which provide a new strategy and candidate drug for PD therapy.
Acknowledgments
We would like to thank Prof. Honghong Yao from the Department of Pharmacology, Southeast University, for the gift of Nlrp3−/− mice. We thank Dr. Lei Cao from the Department of Pharmacology, National University of Singapore, for his helpful suggestions on the manuscript. We also thank Yi Liu for the help in the experiment of UPLC–MS. The authors are grateful for the support of the Experiment Center for Science and Technology, Nanjing University of Chinese Medicine (Nanjing, China). The work was supported by grants from the National Key R&D Program of China (No. 2021ZD0202903) and the National Natural Science Foundation of China (Nos. 81922066, 82173797, 82003725, 81991523, and 82003722).
Footnotes
Peer review under responsibility of Chinese Pharmaceutical Association and Institute of Materia Medica, Chinese Academy of Medical Sciences.
Supporting data to this article can be found online at https://doi.org/10.1016/j.apsb.2022.07.021.
Contributor Information
Gang Hu, Email: ghu@njmu.edu.cn.
Ming Lu, Email: lum@njmu.edu.cn.
Author contributions
Yang Liu acquired and analyzed data, drafted the figures, and wrote the manuscript; Ting Liu, Yuanzhang Zhou, Wenjie Li, and Nanshan Song conducted the experimental operations and assisted in statistical analysis; Min Wang and Weibin Zhang provided the plasma sample of PD patients and analyzed the data; Jingwei Jiang and Shengtao Yuan provided virtual drug screening support. Jianhua Ding provided technical support; Ming Lu and Gang Hu designed the study and revised the manuscript. All authors have read and approved the final manuscript.
Conflicts of interest
The authors declare no conflicts of interest.
Appendix A. Supporting information
The following is the Supplementary data to this article:
References
- 1.Przedborski S. The two-century journey of Parkinson disease research. Nat Rev Neurosci. 2017;18:251–259. doi: 10.1038/nrn.2017.25. [DOI] [PubMed] [Google Scholar]
- 2.Walsh J.G., Muruve D.A., Power C. Inflammasomes in the CNS. Nat Rev Neurosci. 2014;15:84–97. doi: 10.1038/nrn3638. [DOI] [PubMed] [Google Scholar]
- 3.Schwartz M., Baruch K. The resolution of neuroinflammation in neurodegeneration: leukocyte recruitment via the choroid plexus. EMBO J. 2014;33:7–22. doi: 10.1002/embj.201386609. [DOI] [PMC free article] [PubMed] [Google Scholar]
- 4.Heneka M.T., McManus R.M., Latz E. Inflammasome signalling in brain function and neurodegenerative disease. Nat Rev Neurosci. 2018;19:610–621. doi: 10.1038/s41583-018-0055-7. [DOI] [PubMed] [Google Scholar]
- 5.Kaushik D.K., Gupta M., Kumawat K.L., Basu A. NLRP3 inflammasome: key mediator of neuroinflammation in murine Japanese encephalitis. PLoS One. 2012;7 doi: 10.1371/journal.pone.0032270. [DOI] [PMC free article] [PubMed] [Google Scholar]
- 6.Maturana C.J., Aguirre A., Saez J.C. High glucocorticoid levels during gestation activate the inflammasome in hippocampal oligodendrocytes of the offspring. Dev Neurobiol. 2017;77:625–642. doi: 10.1002/dneu.22409. [DOI] [PubMed] [Google Scholar]
- 7.Freeman L., Guo H., David C.N., Brickey W.J., Jha S., Ting J.P. NLR members NLRC4 and NLRP3 mediate sterile inflammasome activation in microglia and astrocytes. J Exp Med. 2017;214:1351–1370. doi: 10.1084/jem.20150237. [DOI] [PMC free article] [PubMed] [Google Scholar]
- 8.Thundyil J., Lim K.L. DAMPs and neurodegeneration. Ageing Res Rev. 2015;24:17–28. doi: 10.1016/j.arr.2014.11.003. [DOI] [PubMed] [Google Scholar]
- 9.Mangan M.S.J., Olhava E.J., Roush W.R., Seidel H.M., Glick G.D., Latz E. Targeting the NLRP3 inflammasome in inflammatory diseases. Nat Rev Drug Discov. 2018;17:688. doi: 10.1038/nrd.2018.149. [DOI] [PubMed] [Google Scholar]
- 10.Freeman M.R. Specification and morphogenesis of astrocytes. Science. 2010;330:774–778. doi: 10.1126/science.1190928. [DOI] [PMC free article] [PubMed] [Google Scholar]
- 11.Araque A., Carmignoto G., Haydon P.G., Oliet S.H., Robitaille R., Volterra A. Gliotransmitters travel in time and space. Neuron. 2014;81:728–739. doi: 10.1016/j.neuron.2014.02.007. [DOI] [PMC free article] [PubMed] [Google Scholar]
- 12.Clarke L.E., Barres B.A. Emerging roles of astrocytes in neural circuit development. Nat Rev Neurosci. 2013;14:311–321. doi: 10.1038/nrn3484. [DOI] [PMC free article] [PubMed] [Google Scholar]
- 13.Kam T.I., Hinkle J.T., Dawson T.M., Dawson V.L. Microglia and astrocyte dysfunction in Parkinson's disease. Neurobiol Dis. 2020;144 doi: 10.1016/j.nbd.2020.105028. [DOI] [PMC free article] [PubMed] [Google Scholar]
- 14.Kekuda R., Prasad P.D., Fei Y.J., Torres-Zamorano V., Sinha S., Yang-Feng T.L., et al. Cloning of the sodium-dependent, broad-scope, neutral amino acid transporter Bo from a human placental choriocarcinoma cell line. J Biol Chem. 1996;271:18657–18661. doi: 10.1074/jbc.271.31.18657. [DOI] [PubMed] [Google Scholar]
- 15.Liu Y., Zhao T., Li Z., Wang L., Yuan S., Sun L. The role of ASCT2 in cancer: a review. Eur J Pharmacol. 2018;837:81–87. doi: 10.1016/j.ejphar.2018.07.007. [DOI] [PubMed] [Google Scholar]
- 16.Ye J., Huang Q., Xu J., Huang J., Wang J., Zhong W., et al. Targeting of glutamine transporter ASCT2 and glutamine synthetase suppresses gastric cancer cell growth. J Cancer Res Clin Oncol. 2018;144:821–833. doi: 10.1007/s00432-018-2605-9. [DOI] [PMC free article] [PubMed] [Google Scholar]
- 17.Masle-Farquhar E., Broer A., Yabas M., Enders A., Broer S. ASCT2 (SLC1A5)-deficient mice have normal B-cell development, proliferation, and antibody production. Front Immunol. 2017;8:549. doi: 10.3389/fimmu.2017.00549. [DOI] [PMC free article] [PubMed] [Google Scholar]
- 18.Shimizu K., Kaira K., Tomizawa Y., Sunaga N., Kawashima O., Oriuchi N., et al. ASC amino-acid transporter 2 (ASCT2) as a novel prognostic marker in non-small cell lung cancer. Br J Cancer. 2014;110:2030–2039. doi: 10.1038/bjc.2014.88. [DOI] [PMC free article] [PubMed] [Google Scholar]
- 19.McGivan J.D., Bungard C.I. The transport of glutamine into mammalian cells. Front Biosci. 2007;12:874–882. doi: 10.2741/2109. [DOI] [PubMed] [Google Scholar]
- 20.Utsunomiya-Tate N., Endou H., Kanai Y. Cloning and functional characterization of a system ASC-like Na+-dependent neutral amino acid transporter. J Biol Chem. 1996;271:14883–14890. doi: 10.1074/jbc.271.25.14883. [DOI] [PubMed] [Google Scholar]
- 21.Leke R., Schousboe A. The glutamine transporters and their role in the glutamate/GABA-glutamine cycle. Adv Neurobiol. 2016;13:223–257. doi: 10.1007/978-3-319-45096-4_8. [DOI] [PubMed] [Google Scholar]
- 22.Heckel T., Broer A., Wiesinger H., Lang F., Broer S. Asymmetry of glutamine transporters in cultured neural cells. Neurochem Int. 2003;43:289–298. doi: 10.1016/s0197-0186(03)00014-7. [DOI] [PubMed] [Google Scholar]
- 23.Han X., Sun S., Sun Y., Song Q., Zhu J., Song N., et al. Small molecule-driven NLRP3 inflammation inhibition via interplay between ubiquitination and autophagy: implications for Parkinson disease. Autophagy. 2019;15:1860–1881. doi: 10.1080/15548627.2019.1596481. [DOI] [PMC free article] [PubMed] [Google Scholar]
- 24.Wei Y., Lu M., Mei M., Wang H., Han Z., Chen M., et al. Pyridoxine induces glutathione synthesis via PKM2-mediated Nrf2 transactivation and confers neuroprotection. Nat Commun. 2020;11:941. doi: 10.1038/s41467-020-14788-x. [DOI] [PMC free article] [PubMed] [Google Scholar]
- 25.Broer A., Brookes N., Ganapathy V., Dimmer K.S., Wagner C.A., Lang F., et al. The astroglial ASCT2 amino acid transporter as a mediator of glutamine efflux. J Neurochem. 1999;73:2184–2194. [PubMed] [Google Scholar]
- 26.Escartin C., Galea E., Lakatos A., O'Callaghan J.P., Petzold G.C., Serrano-Pozo A., et al. Reactive astrocyte nomenclature, definitions, and future directions. Nat Neurosci. 2021;24:312–325. doi: 10.1038/s41593-020-00783-4. [DOI] [PMC free article] [PubMed] [Google Scholar]
- 27.Zhu J., Hu Z., Han X., Wang D., Jiang Q., Ding J., et al. Dopamine D2 receptor restricts astrocytic NLRP3 inflammasome activation via enhancing the interaction of beta-arrestin2 and NLRP3. Cell Death Differ. 2018;25:2037–2049. doi: 10.1038/s41418-018-0127-2. [DOI] [PMC free article] [PubMed] [Google Scholar]
- 28.Guo C., Xie S., Chi Z., Zhang J., Liu Y., Zhang L., et al. Bile acids control inflammation and metabolic disorder through inhibition of NLRP3 inflammasome. Immunity. 2016;45:802–816. doi: 10.1016/j.immuni.2016.09.008. [DOI] [PubMed] [Google Scholar]
- 29.Broer A., Fairweather S., Broer S. Disruption of amino acid homeostasis by novel ASCT2 inhibitors involves multiple targets. Front Pharmacol. 2018;9:785. doi: 10.3389/fphar.2018.00785. [DOI] [PMC free article] [PubMed] [Google Scholar]
- 30.Wang L., Liu Y., Zhao T.L., Li Z.Z., He J.Y., Zhang B.J., et al. Topotecan induces apoptosis via ASCT2 mediated oxidative stress in gastric cancer. Phytomedicine. 2019;57:117–128. doi: 10.1016/j.phymed.2018.12.011. [DOI] [PubMed] [Google Scholar]
- 31.Schulte M.L., Fu A., Zhao P., Li J., Geng L., Smith S.T., et al. Pharmacological blockade of ASCT2-dependent glutamine transport leads to antitumor efficacy in preclinical models. Nat Med. 2018;24:194–202. doi: 10.1038/nm.4464. [DOI] [PMC free article] [PubMed] [Google Scholar]
- 32.Song W., Li D., Tao L., Luo Q., Chen L. Solute carrier transporters: the metabolic gatekeepers of immune cells. Acta Pharm Sin B. 2020;10:61–78. doi: 10.1016/j.apsb.2019.12.006. [DOI] [PMC free article] [PubMed] [Google Scholar]
- 33.Lee N.Y., Kim Y., Ryu H., Kang Y.S. The alteration of serine transporter activity in a cell line model of amyotrophic lateral sclerosis (ALS) Biochem Biophys Res Commun. 2017;483:135–141. doi: 10.1016/j.bbrc.2016.12.178. [DOI] [PubMed] [Google Scholar]
- 34.Maucler C., Pernot P., Vasylieva N., Pollegioni L., Marinesco S. In vivod-serine hetero-exchange through alanine–serine–cysteine (ASC) transporters detected by microelectrode biosensors. ACS Chem Neurosci. 2013;4:772–781. doi: 10.1021/cn4000549. [DOI] [PMC free article] [PubMed] [Google Scholar]
- 35.Wang J., Zhang K., Chen X., Liu X., Teng H., Zhao M., et al. Epigenetic activation of ASCT2 in the hippocampus contributes to depression-like behavior by regulating d-serine in mice. Front Mol Neurosci. 2017;10:139. doi: 10.3389/fnmol.2017.00139. [DOI] [PMC free article] [PubMed] [Google Scholar]
- 36.Ni F., Yu W.M., Li Z., Graham D.K., Jin L., Kang S., et al. Critical role of ASCT2-mediated amino acid metabolism in promoting leukaemia development and progression. Nat Metab. 2019;1:390–403. doi: 10.1038/s42255-019-0039-6. [DOI] [PMC free article] [PubMed] [Google Scholar]
- 37.Scalise M., Pochini L., Console L., Losso M.A., Indiveri C. The human SLC1A5 (ASCT2) amino acid transporter: from function to structure and role in cell biology. Front Cell Dev Biol. 2018;6:96. doi: 10.3389/fcell.2018.00096. [DOI] [PMC free article] [PubMed] [Google Scholar]
- 38.Knight D. Talniflumate (Genaera) Curr Opin Investig Drugs. 2004;5:557–562. [PubMed] [Google Scholar]
- 39.Walker N.M., Simpson J.E., Levitt R.C., Boyle K.T., Clarke L.L. Talniflumate increases survival in a cystic fibrosis mouse model of distal intestinal obstructive syndrome. J Pharmacol Exp Ther. 2006;317:275–283. doi: 10.1124/jpet.105.094847. [DOI] [PubMed] [Google Scholar]
Associated Data
This section collects any data citations, data availability statements, or supplementary materials included in this article.