

Abstract
Friedreich’s ataxia (FRDA) is caused primarily by expanded GAA repeats in intron 1 of both alleles of the FXN gene, which causes transcriptional silencing and reduced expression of frataxin mRNA and protein. FRDA is characterized by slowly progressive ataxia and cardiomyopathy. Symptoms generally appear during adolescence, and patients slowly progress to wheelchair dependency usually in the late teens or early twenties with death on average in the 4th decade. There are two known mature proteoforms of frataxin. Mitochondrial frataxin (frataxin-M) is a 130-amino acid protein with a molecular weight of 14,268 Da, and there is an alternatively spliced N-terminally acetylated 135-amino acid form (frataxin-E) with a molecular weight of 14,953 Da found in erythrocytes. There is reduced expression of frataxin in the heart and brain, but frataxin is not secreted into the systemic circulation, so it cannot be analyzed in serum or plasma. Blood is a readily accessible biofluid that contains numerous different cell types that express frataxin. We have found that pig blood can serve as an excellent surrogate matrix to validate an assay for frataxin proteoforms because pig frataxin is lost during the immunoprecipitation step used to isolate human frataxin. Frataxin-M is expressed in blood cells that contain mitochondria, whereas extra-mitochondrial frataxin-E is found in erythrocytes. This means that the analysis of frataxin in whole blood provides information on the concentration of both proteoforms without having to isolate the individual cell types. In the current study, we observed that the distributions of frataxin levels for a sample of 25 healthy controls and 50 FRDA patients were completely separated from each other, suggesting 100% specificity and 100% sensitivity for distinguishing healthy controls from FRDA cases, a very unusual finding for a biomarker assay. Additionally, frataxin levels were significantly correlated with the GAA repeat length and age of onset with higher correlations for extra-mitochondrial frataxin-E than those for mitochondrial frataxin-M. These findings auger well for using frataxin levels measured by the validated stable isotope dilution ultrahigh-performance liquid chromatography–multiple reaction monitoring/mass spectrometry assay to monitor therapeutic interventions and the natural history of FRDA. Our study also illustrates the utility of using whole blood for protein disease biomarker discovery and validation.
Friedreich’s ataxia (FRDA) is an autosomal recessive disease, caused by mutations in the FXN gene that affect approximately 1 in 50,000 of the US population.1 The disease is caused primarily by expanded GAA repeats (up to 1300) in intron 1 of both alleles of the FXN gene, leading to transcriptional silencing and reduced expression of frataxin mRNA and protein.2,3 FRDA is characterized by slowly progressive ataxia4 and cardiomyopathy.5 Symptoms generally appear during adolescence, and patients slowly progress to wheelchair dependency within 15 years.6 Patients with FRDA on average die most commonly in their 30s7 from heart disease.8 There are no approved treatments for FRDA, although numerous therapeutic approaches are being developed that involve replacement of the frataxin protein1 or up-regulation of its expression using gene therapy9 or pharmacological approaches such as by administration of synthetic transcription factors2 now known as gene-targeted chimera or (gene-TAC) and nrf-2 activators.10 Thus, there is a compelling need to monitor frataxin protein levels as FRDA disease biomarkers so that the efficacy of various therapeutic regimens can be assessed and the potential over-expression of toxic levels of frataxin can be monitored.11 Full-length (FL) frataxin is a protein of 210 amino acids (MW = 23,135 Da), which contains a mitochondrial targeting sequence at its amino terminus. Therefore, when FL frataxin is expressed in the cytosol, it rapidly translocates into the mitochondria where it undergoes a two-step cleavage process mediated by mitochondrial processing peptidase (MPP), which removes the mitochondrial targeting sequence and yields mature mitochondrial frataxin (frataxin-M) as a 130-amino acid protein (MW = 14,268 Da, Figure 1).12 We discovered an alternatively spliced N-terminally acetylated 135-amino acid form of frataxin in erythrocytes (MW = 14,953 Da) that was named isoform-E (frataxin-E).13 This proteoform lacks a mitochondrial targeting sequence and remains an extra-mitochondrial form of frataxin, analogous to the cytosolic form of frataxin identified in mouse tissues.14
Figure 1.

Sequences of frataxin proteoforms. FL frataxin (1–210) expressed in the cytosol translocates to the mitochondria where it undergoes sequential MPP-mediated cleavages at the N-terminal side of leucine-42 and then at the N-terminal side of serine-81 to give frataxin-M (81–210). Alternative splicing leads to the expression of N-terminally acetylated frataxin-E (76–210) that lacks a mitochondrial targeting sequence.
Protein biomarkers of human diseases are typically analyzed in serum, plasma, or urine, an approach that is only useful for biomarkers that are secreted into the systemic circulation. Whole blood contains many different cell types (including reticulocytes, erythrocytes, platelets, granulocytes, and peripheral blood mononuclear cells, Figure 2)15,16 that might contain dysregulated proteins resulting from the disease process. Erythrocytes are the only cells that lack mitochondria,17 so they cannot express mitochondrial proteins such as frataxin-M; however, they contain substantial quantities of extra-mitochondrial frataxin-E. Reticulocytes are relatively short-lived cells (half-life 1–2 days) that are formed from erythroblasts18 and are the immediate precursors of erythrocytes (Figure 2).16 Platelets, which have a longer half-life (10 days),19 are derived for megakaryocytes, which in turn arise from megakaryoblasts in the bone marrow (Figure 2).16 Reticulocytes and platelets contribute approximately 96% of the mitochondria that are present in blood (Figure 2), and so, they are thought to be the major cell types contributing to cell-associated frataxin-M.20
Figure 2.

Formation of blood cells in the bone marrow,16 their half-lives,17−19,21 sizes,22 and the relative number of mitochondria in each cell type.22
Quantification of frataxin proteoforms in whole blood presents a significant analytical challenge due to the high levels of erythrocyte hemoglobin (typically 120–150 mg/mL)17 and other high-abundance plasma proteins such as albumin (typically 35–54 mg/mL).23 Protein disease biomarkers, which are generally present at 10- to 100 million lower concentrations, can noncovalently bind to these high-abundance proteins; therefore, simply removing them by immunoaffinity columns often also removes the disease biomarker of interest.24 Stable isotopically labeled protein internal standards prepared using stable isotope labeling by amino acids in cell culture (SILAC) can serve as carriers through immunoaffinity purification and prevent losses of protein biomarkers as we have demonstrated for human amyloid-β,25 human frataxin-M,20 mouse frataxin-M,14 human frataxin-E,13 apolipoprotein A1,26 and high-mobility group box-1.27
Frataxin proteoforms are not secreted into the circulation, which means that a method was required for the quantification of frataxin proteoforms present in blood cells rather than in the plasma (Figure 2). The requirement for a surrogate matrix for the preparation of standard curves, quality control (QC) samples, inter- and intraday samples, and freeze–thaw samples during the validation process presented an additional challenge.28 In our earlier studies with human platelets, endogenous platelet frataxin-M was removed by immunoprecipitation (IP) to provide a suitable surrogate matrix.20 However, it was not addressed in our previous studies with whole blood29 because it is impossible to remove the endogenous frataxin proteoforms. One approach would be to use whole blood from a mammal that expresses frataxin proteoforms with sequences that are significantly different from human frataxin. Such forms could then be differentiated from the human proteoforms by ultrahigh-performance liquid chromatography–multiple reaction monitoring/mass spectrometry (UHPLC-MRM/MS) analysis. Alternatively, they would not be substrates for the immobilized monoclonal antibody (mAb) used for IP of the whole blood. We successfully used this approach previously to analyze amyloid-β proteoforms in human cerebrospinal fluid using rat cerebrospinal fluid as the surrogate matrix.25 Rat and human amyloid-β proteoforms were then readily distinguished by LC-MRM/MS from human proteoforms as a result of their different amino acid sequences.24 In order to find frataxin proteoforms from an animal model that differ from human frataxin, alignment of the amino acid sequences from 14 mammalian species was conducted. This analysis revealed that pig frataxin was significantly different from human frataxin-M and frataxin-E when compared with other species (Figure S1). Therefore, pig blood could potentially provide a relatively inexpensive and readily accessible surrogate matrix with all the characteristics of human blood30 but with no endogenous interference in the analysis of human frataxin. We report the validation of stable isotope dilution UHPLC-MRM/MS assays for frataxin-M and frataxin-E using pig blood as the surrogate matrix. We also report use of the validated assay for frataxin levels to analyze blood samples from 25 healthy controls, 25 carriers of FRDA with GAA repeats on intron-1 of a single allele of the FXN gene, and 50 homogeneous cases of FRDA with GAA repeats on intron-1 of both alleles of the FXN gene.
Experimental Section
Chemicals and Materials
Reagents and solvents were LC–MS-grade quality unless otherwise noted. [13C615N2]-lysine and [13C615N1]-leucine were obtained from Cambridge Isotope Laboratories (Andover, MA, USA). Antifrataxin mouse mAb (17A11, Ab113691) was from Abcam (Waltham, MA). Beta mercaptoethanol (BME), dimethyl pimelimidate dihydrochloride (DMP), ethylenediaminetetraacetic acid (EDTA)-free protease inhibitor cocktail, d,l-dithiothreitol (DTT), isopropyl-β-d-thiogalactoside, bovine serum albumin, imidazole, triethanolamine, ethanolamine, M9, minimal salts, 5X powder, and minimal microbial growth medium (M9 media) were purchased from MilliporeSigma (Billerica, MA). Ni-NTA Agarose resin was purchased from Qiagen (Germantown, MD). LC-grade water and acetonitrile were from Burdick and Jackson (Muskegon, MI, USA). SuperSignal West femto stable peroxide buffer and luminol enhancer solution were obtained from ThermoFisher Scientific (Waltham, MA). Dynabeads Protein G were obtained from Invitrogen (Oslo, Norway). The goat antimouse HRP Ab was supplied by Jackson Immuno Research Laboratories (West Grove, PA, USA). The Zorbax Rapid Resolution High Definition Eclipse Plus C18 column (2.1 × 50 mm, 1.8 μm particle size) was supplied by Agilent Technologies Inc. (Santa Clara, CA; catalog: 959757-902). Innovative-Grade US Origin Porcine Whole blood (pig blood) was obtained from Innovative Research Inc. (Novi, MI; catalog IGPCWBK2E50ML).
Clinical Samples
Blood samples were obtained from 25 healthy controls, 25 heterozygous carriers of the FXN gene with GAA-repeats, and 25 FRDA patients. Informed written consent was obtained from each subject who participated in the study. For subjects who were under 18 years of age, written informed consent was obtained from a legal guardian and/or a parent. The clinical study was approved by the Institutional Review Board (IRB) of the Children Hospital of Philadelphia (IRB Protocol no. 01-002609).
Blood Sample Collection
Venous blood from each subject was drawn into purple-cap Vacutainer EDTA tubes (8.5 mL). The tubes were gently inverted before transferring the blood into Eppendorf tubes (2.4 mL). Blood samples were immediately frozen at −80 °C and stored at this temperature until they were analyzed.
Expression and Purification of Unlabeled and SILAC-Labeled Frataxin Proteoforms
Expression of unlabeled frataxin-M and SILAC-frataxin-M was performed in Escherichia coli BL21 DE3.20 Expression of unlabeled frataxin-E and SILAC-frataxin-E was performed in human HEK 293 kidney cells.13 Purity of the unlabeled frataxin-M, frataxin-E, SILAC-frataxin-M, and SILAC-frataxin-E was confirmed to be >95% by sodium dodecyl sulfate-polyacrylamide gel electrophoresis (SDS-PAGE) and Coomassie blue staining.
DMP Cross-Linking of mAb with Magnetic Beads
Mouse antifrataxin mAb (Abcam 17A11, Ab113691) was cross-linked to protein G beads through DMP as described.20 Briefly, the mAb (4 μg) was first incubated with protein G magnetic Dynabeads (0.5 mg) overnight at 4 °C to form the antibody-coupled beads. The mAb-coupled beads were incubated with 13 mg/mL DMP solution for 1 h at room temperature to form the stable cross-linked antifrataxin protein G magnetic Dynabeads. The cross-linked protein G beads can be kept in phosphate-buffered saline (PBS) at 4 °C for a week.
Preparation of Whole Blood for IP
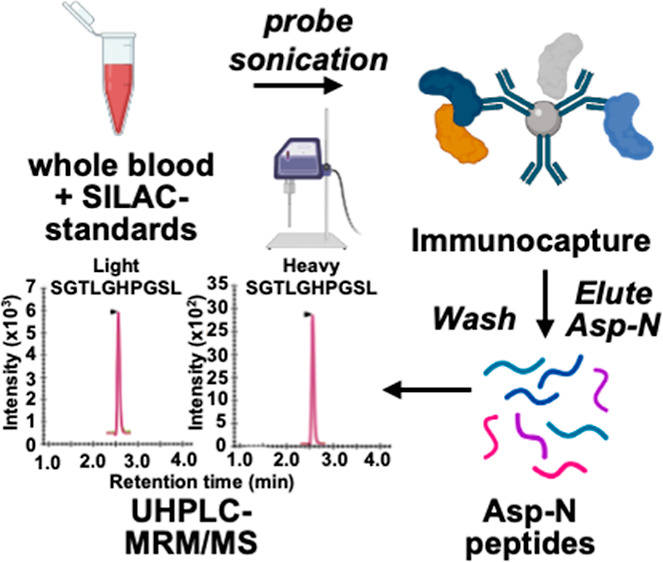
Human and pig blood samples were thawed at room temperature, and 500 μL of each sample was mixed with 750 μL of NP-40 lysis buffer (150 mM NaCl, 50 mM Tris/HCl pH 7.5, 0.5% Triton X-100, 0.5% NP-40, 1 mM DTT, 1 mM EDTA) containing protease inhibitor cocktail. The same amount of SILAC-frataxin-M (40 ng) and SILAC-frataxin-E (40 ng) was spiked in each sample (pig blood calibrator, pig blood QC, and human blood) as internal standards. Samples were lysed by probe sonication on ice for 30 pulses at power 5 using a sonic dismembrator (Fisher, Pittsburgh, PA), followed by centrifugation at 17,000g for 15 min at 4 °C. The supernatant was transferred from the pellet and incubated with premade DMP-crosslinked antifrataxin protein G Dynabeads for IP (Figure 3).
Figure 3.

Scheme showing the method for IP of frataxin proteoforms in whole blood and analysis by stable isotope dilution UHPLC-MRM/MS.
IP and Asp-N Digestion
Supernatants from human or pig blood samples were incubated with 0.3 mg of DMP cross-linked antifrataxin protein beads at 4 °C overnight in protein LoBind tubes (Figure 3). The unbound supernatants were removed, and the beads were resuspended in 500 μL of IP lysis buffer and then transferred to clean LoBind tubes. Samples were washed three times with 1 mL of PBS, and frataxin proteoforms were eluted by incubating the beads with 100 μL of elution buffer (300 mM acetic acid/10% acetonitrile) with shaking for 15 min. The elutes were transferred to deactivated glass inserts (Waters, Milford, MA) and dried under nitrogen flow. Samples were then dissolved in 50 μL of 25 mM aqueous ammonium bicarbonate containing 100 ng of Asp-N and incubated at 37 °C overnight before UHPLC-MRM/MS analysis (Figure 3).
Western Blot Analysis
The frataxin-M standard (2 ng), frataxin-E standard (2 ng), and a portion from two human and two pig whole blood eluates (20 μL) were mixed separately with 5 μL of NuPAGE LDS sample buffer (4×) containing 8% BME. The samples were then heated to 95 °C for 10 min before loading on a 12% NuPAGE Bis-Tris protein gel. NuPAGE MES SDS buffer was used for optimal separation of proteins in the 10–30 kDa range. The gel was run under 150 V for 1.5 h until the blue dye ran to the bottom of the gel. The proteins were transferred to a nitrocellulose membrane using the iBlot 2 gel transfer device and an iBlot 2 transfer stack. The membrane was probed with Abcam mouse mAb diluted 1:1000 with 5% milk in PBS containing 0.1% Tween-20. A goat antimouse HRP Ab (Jackson Immuno Research Laboratories), diluted 1:5000, was used as the secondary antibody for chemiluminescence detection. Chemiluminescence was generated using a 1:1 mixture of SuperSignal West femto stable peroxide buffer and luminol enhancer solution. Western blot images were captured on an ImageQuant LAS 4000 (GE Healthcare, Piscataway, NJ).
Method Validation
Pig blood was used for the preparation of calibration standards and QCs. Calibration standards were prepared by spiking appropriate amounts of the frataxin standard to pig blood to make the final concentrations of 0.5, 2.0, 4.0, 6.0, 8.0, 10.0, 12.0, 16.0, 20.0, 30.0, 40.0, and 80.0 ng/mL. Assay validation was conducted according to US FDA guidelines.28,31 Linearity of standard curves was evaluated from 0.5 to 80 ng/mL using the least-squared fitted linear regression line. The lower limit of quantification (LLOQ) of 1.0 ng/mL was defined as the lowest concentration in QC samples with a precision <10% and accuracy between 90 and 100% based on three fitted calibration curves. The accuracy and precision for intraday and interday assays and freeze–thaw samples were determined based on five replicates of each four QC samples: LLOQ, low-QC (LQC), middle-QC (MQC), and high-QC (HQC) samples; the interday assay was evaluated on 5 different days for a total of 25 replicates.
UHPLC-MRM/MS
Analyses were conducted using an Agilent 1290 Infinity II UHPLC system interfaced with a 6495C triple-quadruple mass spectrometer (Agilent Technologies Inc., Santa Clara, CA). Injections of 2 μL were made, the injector was held at 4 °C, and the needle was flushed for 5 s with 30% methanol. Solvent A was water containing 0.1% formic acid, and solvent B was acetonitrile containing 0.1% formic acid. The Zorbax Rapid Resolution High Definition (2.1 × 50 mm, 1.8 μm particle size) UHPLC column was maintained at 35 °C with a flow rate of 0.4 mL/min. Analytes were eluted with the following linear gradient: 5% B at 0 min, 5% B at 1 min, 24% B at 2.75 min, 36% B at 3.50 min, 95% B at 5.0 min, 95% B at 6.50 min, 5% B at 7.0 min, and 5% B at 8.5 min ready for the next injection. Ionization was conducted using the Agilent Jet Stream electrospray ionization (ESI) source. Mass spectrometer operating conditions were as follows: nitrogen gas flow 13 L/min, gas temperature 230 °C, nebulizer gas 40 psi, sheath gas temperature 300 °C, sheath gas flow 10 L/min, capillary voltage 4500 V, and nozzle voltage 500 V.
Data Analysis
Peptide quantification was performed using Skyline (MacCoss Laboratory, University of Washington, Seattle, WA).32 The peak area ratio of each MRM transition for each unlabeled/light (L) peptide to labeled/heavy (H) peptide was calculated by Skyline software and used for absolute quantification. The peptide ratios were calculated from the sum of L/H ratios of the MRM transitions of the y6+ and y4 ions of the S81GTLGHPGSL90 frataxin-M N-terminal Asp-N peptide and the b112+ and y4+ ions of the acetyl-M76NLRKSGTLGHPGSL90 frataxin-E N-terminal Asp-N peptide (Table S1). Frataxin-M and frataxin-E amounts were calculated from the standard curves for each peptide. Three other peptides were monitored to provide additional confirmation that frataxin-M and frataxin-E were present (Table S1). Distributions of frataxin-E, frataxin-M, and total frataxin levels between subject groups were compared using nonparametric Wilcoxon rank sum tests after checking the normality of the data with Shapiro–Wilk tests. Scatter plots and simple linear regression models were fitted to evaluate the relationships between frataxin levels (frataxin-M, frataxin-E, and total) and the GAA repeat lengths and age of onset in FRDA cases, respectively. R-squared of the fitted lines and Spearman rank correlation coefficients were calculated and compared. Prism for macOS Version 9.3.1 (GraphPad Software, LLC) and R Version 4.2.1 were used for statistical analysis with two-sided p-value <0.05 to be considered as statistically significant.
Results
Western Blot Analysis of Human and Pig Blood
The protein eluates from IP of duplicate samples of human and pig blood were separated by PAGE. Western blot analysis with a mouse antifrataxin antibody revealed two closely eluting bands in the human blood samples corresponding to endogenous frataxin-E (MW = 14,953 Da) and frataxin-M (MW = 14,268), respectively (Figure 4). His-tagged authentic standards ran slightly slower with bands corresponding to His-frataxin-E (MW = 15,947) and His-frataxin-M (MW = 15,262 Da). No bands were detected for pig frataxin-E or pig frataxin-M at the predicted MWs of 20,807 and 20,149 Da, respectively (Figure 4, red arrows). Therefore, IP of pig blood with mouse antifrataxin mAb removes both proteoforms of pig frataxin making pig blood an ideal surrogate matrix for validation of a method for analyzing frataxin proteoforms in human blood samples.
Figure 4.
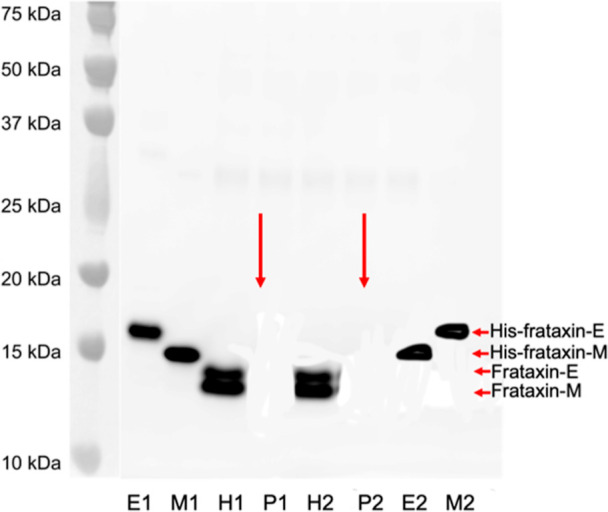
Western blot analysis of frataxin proteoforms in human and pig blood. E1 and E2 = duplicate His-Frataxin-E; M1 and M2 = duplicate His-frataxin-M; H1 and H2 = duplicate human blood after IP; and P1 and P2 = duplicate pig blood after IP. Red arrows show the predicted mobility of pig frataxin-E and pig frataxin-M. Protein plus protein dual-color standards were run on the same gel and visualized in black and white by an ImageQuant LAS 4000 camera and then combined with the Western blot image.
UHPLC-MRM/MS Analysis of Frataxin Asp-N Peptides
Five of the Asp-N peptides from frataxin-M and frataxin-E were well separated within the 8.5 min total run time (Figure 5). Peaks were symmetrical and <0.2 min wide. The N-terminal methionine-76 residue of frataxin-E is readily oxidized in both the endogenous protein and the SILAC-frataxin-E internal standard. The resulting oxidized N-terminal Asp-N peptide [acetyl-M(O)NLRKSGTLGHPGSL 3.48 min] eluted well ahead of the nonoxidized form (5.08 min).
Figure 5.
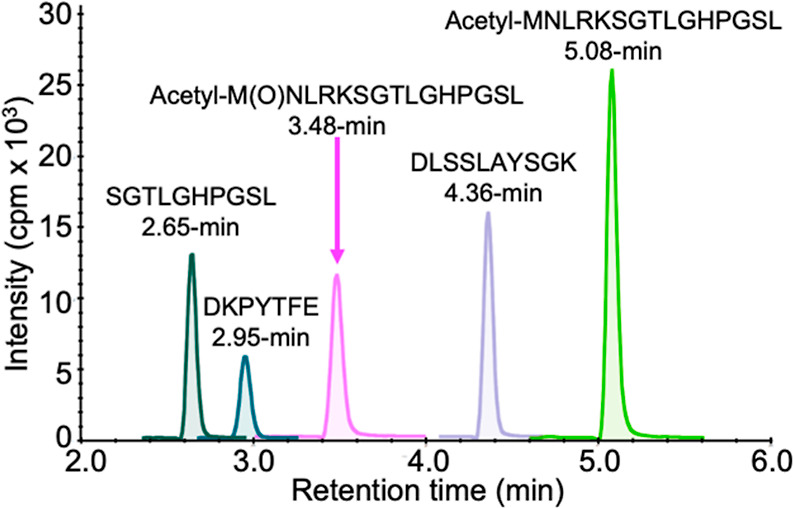
UHPLC separation of Asp-N peptides from frataxin-M and frataxin-E. The chromatogram was obtained by monitoring the parent ions of the individual peptides (Table S1).
Standard Curves for Human Frataxin-M and Frataxin-E in Pig Blood
Three standard curves for frataxin-M and frataxin-E in the range of 0.5–80 ng/mL were prepared in pig blood and analyzed by UHPLC-MRM/MS using the transitions for SGTLGHPGSL, acetyl-MNLRKSGTLGHPGSL, and acetyl-M(O)NLRKSGTLGHPGSL shown in Table S1. Linear standard curves were obtained for frataxin-M using SGTLGHPGSL (Figure S2A and Table S2) and frataxin-E using acetyl-MNLRKSGTLGHPGSL (Figure S2B and Table S2) or acetyl-M(O)NLRKSGTLGHPGSL (data not shown). The back-calculated concentrations for frataxin-M had a precision of better than ±5% and an accuracy between 89 and 103% (Table S3A). The back-calculated concentrations for frataxin-E using acetyl-MNLRKSGTLGHPGSL had a precision of better than ±15% and an accuracy between 87 and 106% (Table S3B). Essentially identical results for frataxin-E were obtained using either the oxidized peptide acetyl-M(O)NLRKSGTLGHPGSL or a combination of acetyl-MNLRKSGTLGHPGSL and acetyl-M(O)NLRKSGTLGHPGSL (data not shown). Therefore, further validation of the frataxin-E assay used only the nonoxidized N-terminal acetyl-MNLRKSGTLGHPGSL Asp-N peptide.
Assay Intra- and Interday Variation
Five replicates of four pig blood QC samples (n = 5) at 1 ng/mL (LLOQ), LQC (2 ng/mL), MQC (4 ng/mL), and HQC (60 ng/mL) were analyzed on the same day (intraday). The MQC was chosen to be close to the expected midrange of the FRDA patients (approximately 4 ng/mL) rather than that of the healthy controls. Frataxin-M had a precision of better than ±5% and an accuracy between 98 and 102% (Table S4). Frataxin-E had a precision of better than ±10% and an accuracy between 97 and 109% (Table S4). The values were essentially identical if samples were allowed to sit on the UHPLC analyzer sample tray overnight at 4 °C (data not shown). Five replicates of four pig blood QC samples (n = 5) at 1 ng/mL (LLOQ), LQC (2 ng/mL), MQC (4 ng/mL), and HQC (60 ng/mL) were analyzed on five different days (interday, n = 25). Frataxin-M had a precision of better than ±8% and an accuracy between 98 and 104% (Table S5). Frataxin-E had a precision of better than ±5% and an accuracy between 96 and 109% (Table S5).
Effect of Freeze/Thawing Blood Samples
Five replicates of four pig blood QC samples (n = 5) at 1 ng/mL (LLOQ), LQC (2 ng/mL), MQC (4 ng/mL), and HQC (60 ng/mL) were analyzed after freezing for 1 week at −80 °C and thawing to room temperature. Frataxin-M had a precision of better than ±8% and an accuracy between 97 and 113% (Table S6). Frataxin-E had a precision of better than ±10% and an accuracy between 95 and 119% (Table S6).
Analysis of Frataxin Proteoforms in Human Blood
Typical UHPLC-MRM/MS chromatograms obtained during the analysis of frataxin-M from the (a) blank human blood sample, (b) FRDA case, (c) carrier, and (d) heathy control are shown in Figure 6A. The upper chromatogram shows the MRM signals for the N-terminal SGTLGHPGSL Asp-N peptide from endogenous frataxin-M, and the lower chromatogram shows the signals from the SILAC internal standard. Typical chromatograms obtained during the analysis of frataxin-E from the (a) blank human blood sample, (b) FRDA case, (c) carrier, and (d) control are shown in Figure 6B. The upper chromatogram shows the MRM signals for the N-terminal acetyl-MNLRKSGTLGHPGSL Asp-N peptide from endogenous frataxin-E, and the lower chromatogram shows the signals from the SILAC internal standard. Similar chromatograms for the N-terminal acetyl-M(O)NLRKSGTLGHPGSL Asp-N peptide from frataxin-E are shown in Figure S3.
Figure 6.

(A) LC-MRM/MS chromatograms for SGTLGHPGSL; y6+, m/z = 567.29, red line; y4+, m/z = 373.21, green line; (light, upper) and SGTLGHPGSL; y6+, m/z = 573.23, red line; y4+, m/z = 379.23, green line; (heavy, lower) used in the quantification of frataxin-M. (a) Blank. (b) Typical Friedreich’s’ ataxia case (2.4 ng/mL, 733 GAA repeats) and (c) typical carrier (9.4 ng/mL). (d) Typical control (10.7 ng/mL). (B) LC-MRM/MS chromatograms for acetyl-MNLRKSGTLGHPGSL; b112+, m/z = 619.33, red line; y4+, m/z = 373.21, green line; (light, upper) and acetyl-MNLRKSGTLGHPGSL; b112+, m/z = 628.36, red line; y4+, m/z = 379.23, green line; (heavy, lower) used in the quantification of frataxin-E. (a) Blank. (b) Typical Friedreich’s’ ataxia case (1.3 ng/mL, 733 repeats). (c) Typical carrier (13.3 ng/mL). (d) Typical control (22.0 ng/mL). K = [13C615N2]-lysine. L = [13C6]-leucine.
Quantification of Frataxin Proteoforms in Blood from 25 Controls, 25 Heterozygous Carriers, and 50 FRDA Patients
The levels of frataxin-M found in healthy control blood ranged from 6.01 to 14.47 ng/mL with a mean (±SD) of 10.73 ± 1.97 ng/mL (Figure 7A). The levels of frataxin-M in carrier blood ranged from 3.63 to 13.15 ng/mL with a mean of 7.53 ± 2.14 ng/mL (Figure 7A). The levels of frataxin-M in blood from FRDA cases ranged from 1.03 to 5.47 ng/mL with a mean of 3.11 ± 1.14 ng/mL (Figure 7A). The levels of frataxin-E in healthy control blood ranged from 13.04 to 25.35 ng/mL with a mean of 20.61 ± 2.66 ng/mL (Figure 7B). The levels of frataxin-E found in carrier blood ranged from 7.68 to 36.86 ng/mL with a mean of 14.11 ± 5.77 ng/mL (Figure 7B). The levels of frataxin-E found in blood from FRDA cases ranged from 0.54 to 8.55 ng/mL with a mean of 3.69 ± 2.04 ng/mL (Figure 7B). The levels of total frataxin in healthy control blood ranged from 19.05 to 36.31 ng/mL with a mean of 31.34 ± 3.29 ng/mL (Figure 7C). The levels of total frataxin found in carrier blood ranged from 13.26 to 42.81 ng/mL with a mean of 21.64 ± 6.62 ng/mL (Figure 7C). The levels of total frataxin found in blood from FRDA cases ranged from 1.67 to 13.37 ng/mL with a mean of 6.82 ± 3.05 ng/mL (Figure 7C). The distribution of frataxin-E, frataxin-M, and total frataxin levels differed significantly between healthy controls and carriers (all p < 0.0001), between healthy controls and FRDA cases (all p < 0.0001), and between carriers and FRDA cases (all p < 0.0001). The difference between the mean frataxin levels for cases and controls was −7.6 ng/mL (95% CI −8.3, −6.9) for frataxin-M, −17.7 ng/mL (95% CI -18.9, −16.5) for frataxin-E, and −25.3 ng/mL (95% CI -26.8, −23.7) for total frataxin. There was no overlap for the distributions of frataxin-M, frataxin-E, or total frataxin levels between controls and FRDA cases, suggesting that a threshold can be selected to provide 100% sensitivity and 100% specificity in separating controls from FRDA cases.
Figure 7.
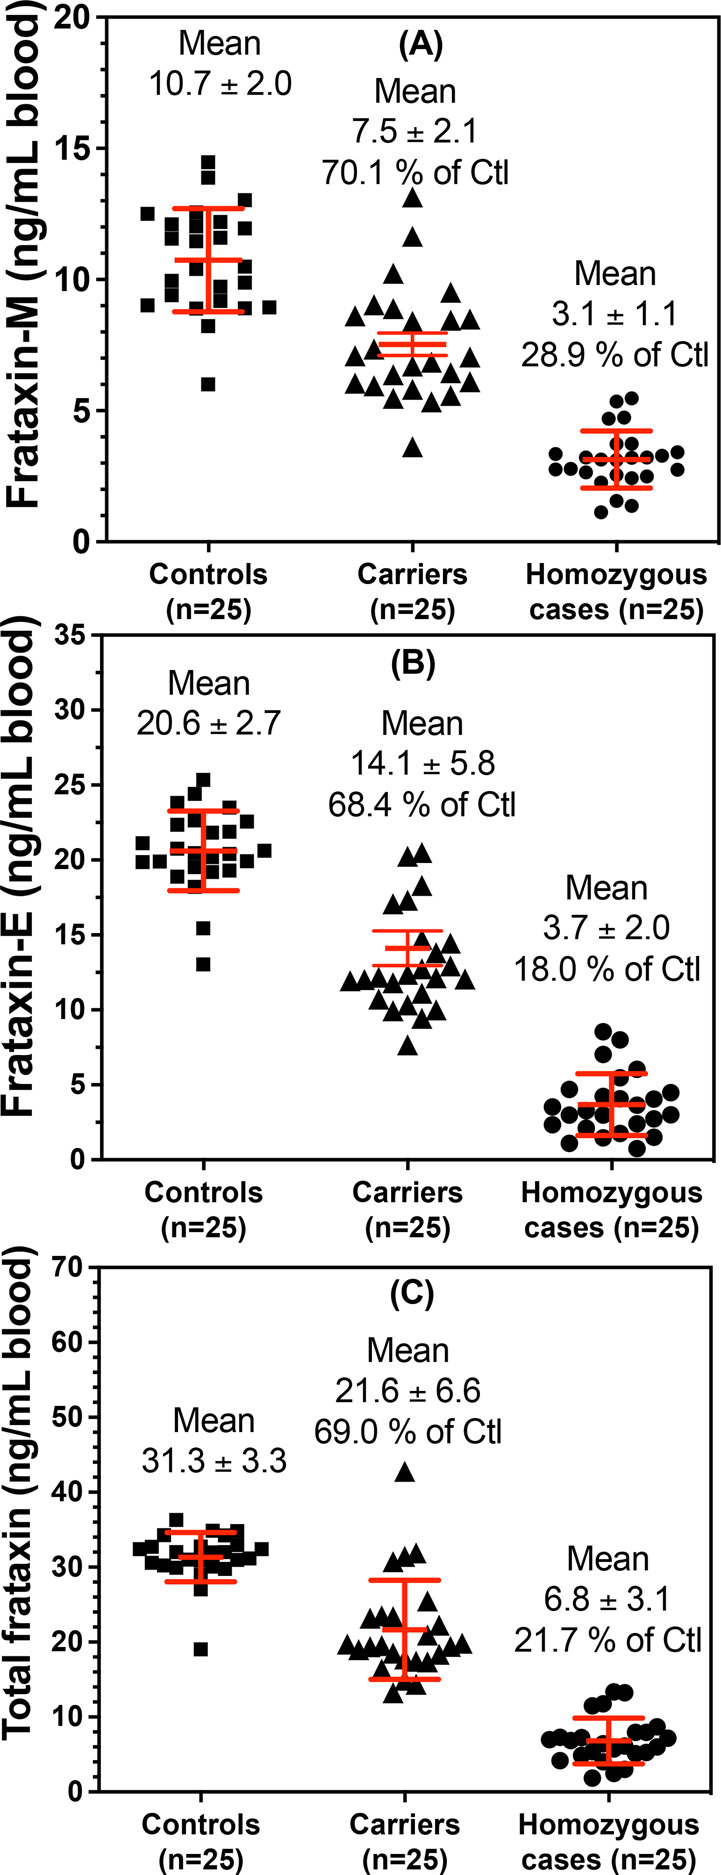
Concentrations of frataxin proteoforms in whole blood from controls, carriers, and cases. (A) Frataxin-M. (B) Frataxin-E. (C) Total frataxin. Ctl = controls.
Blood Frataxin Proteoform Levels and FRDA Disease Severity
Age at onset was positively correlated with frataxin-M and frataxin-E, and total frataxin levels with Spearman rank correlations were 0.28, 0.88, and 0.53, respectively. Frataxin-E was more strongly correlated with the age of onset than frataxin-M (p < 0.0001). The percent variances explained by the age of onset (i.e., R-squared for the fitted lines) were 7.2, 29.1, and 21.8% for frataxin-M, frataxin-E, and total frataxin, respectively (Figure S4). Additionally, the GAA repeat length was negatively correlated with frataxin-M and frataxin-E, and total frataxin levels with Spearman rank correlations were −0.15, −0.40, and −0.34, respectively. Frataxin-E was more strongly correlated with the GAA repeat length than frataxin-M (p = 0.011). The percent variances explained by the GAA repeat length were 4.6, 20.2, and 14.8% for frataxin-M, frataxin-E, and total frataxin, respectively (Figure S5).
Discussion
There is a compelling need for protein biomarkers to monitor the natural history of diseases as well as the effect of therapeutic interventions on protein targets involved in the disease. This is particularly relevant to genetic diseases where it is necessary to increase, replace, or remove the dysregulated protein.1,2,33,34 There are >7000 rare diseases with dysregulated protein expression that affect >30 million people in the US population.33 There is also accumulating evidence that dysregulated protein expression is responsible for neurodegenerative diseases such as Alzheimer’s disease,35 which has been estimated to affect 13.8 million people in the United States by 2050 and 152.8 million worldwide.36 Numerous pharmacological approaches have been developed to inhibit protein expression including the recently introduced novel proteolysis-targeting chimera (PROTAC) approach that can “drug the undruggable” proteins.34 Up-regulation of protein expression is much more challenging; the two methods that show promise are gene therapy,33 which can induce protein expression in target tissues, and gene-TAC, which can unblock epigenetically blocked transcription.2,37 Ideally, the dysregulated protein biomarker should be quantified in specific target tissues. However, this is generally not possible in human subjects particularly in neurodegenerative diseases such as Alzheimer’s disease that affect the brain. Therefore, it is necessary to conduct biomarker studies in readily accessible biological fluids where samples can be collected noninvasively. CSF has been used as a source of biomarkers derived from the brain,25 but CSF sampling is not readily accepted by patients and so is rarely used. Consequently, blood-based proteins have become the target of numerous biomarker studies.38
Typically, whole blood is not used in biomarker discovery and validation; instead, serum and plasma are isolated, and the blood cells are discarded either by allowing the blood to clot (serum) or by centrifugation (plasma). For this approach to be successful, it is necessary for the protein of interest to be secreted from the target tissue into the circulation. Unfortunately, key proteins involved in the disease process might not be secreted into the circulation, and so, the use of serum or plasma would not then be viable. FRDA, caused by a deficiency in frataxin protein, is a representative of this type of neurodegenerative disease. The frataxin-M proteoform is found in mitochondria, whereas frataxin-E, an extra-mitochondrial proteoform, is only found in erythrocytes, a cell that lacks mitochondria. This suggested that whole blood might be a suitable matrix for monitoring the natural history of FRDA, as well as the effect of therapeutic interventions, because it contains eight different cell types with significant numbers of mitochondria as well as erythrocytes that lack mitochondria (Figure 2). Platelets and reticulocytes with half-lives of 2 and 10 days, respectively, contain some 96.3% of the mitochondria that are present in a whole blood sample (Figure 2). Therefore, it should be possible to quantify modulation of dysregulated protein expression in these blood cells during relatively short-term phase I clinical trials that could serve as a proof of concept that the therapeutic approach is effective and nontoxic, an important consideration given the toxicity of elevated levels of the frataxin protein.11 For extra-mitochondrial proteins, the situation is more complex as it will depend on whether the protein is present in all the blood cells, just the erythrocytes, or just the reticulocytes, platelets, granulocytes, monocytes, and lymphocytes (Figure 2). Frataxin-E is an unusual protein where it is mainly found in erythrocytes so that most of the protein can be quantified by analyzing a whole blood sample.13
The impact of surrogate matrix selection on successful protein biomarker qualification is sometimes overlooked but probably accounts, in part, for the relatively few protein biomarkers that have been approved by the FDA.39 The most difficult requirement is that the biological matrix used to prepare calibration standards must be similar to the study samples.28 This is particularly challenging for whole blood biomarkers where the surrogate matrix must have no measurable endogenous analyte and no matrix effect or interference when compared to healthy control human blood. An additional challenge is to be able to conduct freeze–thawing validation in the surrogate matrix. Realistically, the only matrix that could meet these criteria is mammalian blood containing frataxin proteoforms different from human proteoforms. The mammalian frataxin proteoforms would have to be sufficiently different so that they would not be isolated by the IP procedure and/or the peptides derived from the subsequent protease digestion would not interfere in the UHPLC-MRM/MS assay (Figure 3). Pig blood, which contains all the cell types found in human blood,30 was found to meet these criteria. Pig (Sus scrofa) frataxin-M and frataxin-E proteoforms are 67 amino acids longer than the corresponding human proteoforms and only 64% identical (Figure S1). Furthermore, the carboxy terminal sequences of pig frataxin-M and frataxin-E corresponding to amino acids 171–210 of the human proteoforms are only 16% identical (Figure S1). Western blot analysis revealed that pig frataxin proteoforms were not isolated using the mouse antifrataxin mAb IP procedure (Figure 4). In addition, UHPLC-MRM/MS analysis showed that there was minimal interference in the chromatograms at the retention times for Asp-N peptides generated from human frataxin-M and frataxin-E (Figure 5). Validation was conducted using pig blood as the surrogate matrix so that it met the criteria stipulated by the FDA. The resulting validated method shows that there was no overlap between the two human frataxin proteoforms and total frataxin in whole blood from healthy controls and FRDA cases (Figure 7). Although there was some overlap between controls and carriers and between carriers and FRDA cases, levels in each of the three groups were significantly different from each other with a p-value of <0.0001 (Figure 7). In previous studies of frataxin levels, we have used high-resolution MS coupled with nano-UHPLC,13,14,20,29 which is extremely time-consuming due to the long chromatographic run times. We reasoned that the use of IP would remove interfering substances from the whole blood matrix allowing a triple-quadrupole instrument to be used instead. We found that assay specificity and sensitivity were essentially identical but that the run times were reduced by an order of magnitude, significantly improving the turn-around time for sample analysis.
FRDA disease severity is predicted by the number of GAA repeats in intron-1 of the FXN gene with more repeats leading to more severe disease and earlier onset.8,40 There was a linear relationship between the two proteoforms and total frataxin with GAA repeats (Figure S5) and with the age of onset (Figure S4). Intriguingly, the correlations with the GAA repeat length and age of onset were higher for extra-mitochondrial frataxin-E than those for mitochondrial frataxin-M. Frataxin-E has thus far only been found in cells lacking mitochondria, whereas frataxin-M is only found in cells with mitochondria. It is conceivable that frataxin-E is converted into frataxin-M in some cell types, but no evidence for this proteolytic conversion has been reported. FRDA patients do not suffer from any defects in erythrocyte formation or erythrocyte lifetime, which makes it unlikely that frataxin-E plays a role in erythrocyte biology. Intriguingly, frataxin-E is expressed in all mammals that live longer than would be predicted from their weights such as monkeys, naked mole rats, and bats; whereas, those that live shorter than would be predicted from their weights (such as mice and rats) do not express frataxin-E.13 Therefore, further investigations are under way to understand the role of extra-mitochondrial frataxin-E in normal biology as well as the etiology of FRDA. It is noteworthy that in the mouse, which lacks the methionine-76 start codon (AUG) for alternative splicing found in human frataxin, significant amounts of extra-mitochondrial frataxin can be detected in the brain, heart, and liver tissue. Mouse extra-mitochondrial frataxin is thought to arise from the proteolysis of frataxin14 rather than by the alternative splicing pathway that gives rise to human frataxin-E.3,13
Conclusions
Blood is a readily accessible biofluid that contains numerous different cell types that are a rich source of potential protein disease biomarkers that might be reflective of dysregulated protein expression in target tissues. This would be particularly useful when the proteins of interest are not secreted into the circulation and thus not found in the serum or plasma. FRDA, in which there is reduced expression of frataxin in the heart and brain, is a rare genetic disease that provides an example of this situation. We have found that pig blood can serve as an excellent surrogate matrix to validate an assay for frataxin proteoforms. Frataxin-M is expressed in blood cells that contain mitochondria, whereas extra-mitochondrial frataxin-E is found in erythrocytes. Neither proteoform is found in serum or plasma. This means that the analysis of whole blood provides information on the concentration of both proteoforms without having to isolate the individual cell types. The validated UHPLC-MRM/MS assay revealed that there was no overlap in frataxin proteoform levels between healthy controls and FRDA patients, and so, it had 100% specificity and 100% sensitivity for distinguishing healthy controls from FRDA cases, a very unusual finding for a biomarker assay. There was a linear correlation between frataxin levels and the GAA repeat length as well as the age of onset, although the correlations were better for extra-mitochondrial frataxin-E than those for mitochondrial frataxin-M. Although platelet and erythrocyte counts are remarkably stable, clearly diseases such as anemia and thrombocytopenia would alter the whole blood levels of frataxin-E and frataxin-M, respectively. Therefore, if aberrant levels are observed, these possibilities should be assessed by examining the individual’s complete blood count.
These findings auger well for using the assay to monitor therapeutic interventions that are targeted to up-regulate frataxin levels as well as for monitoring the natural history of the disease. Furthermore, the ability to use a triple-quadrupole mass spectrometer rather than a high-resolution instrument will greatly facilitate these studies.
Acknowledgments
We thank Agilent Technologies Inc for the loan of an Agilent 1290 Infinity II UHPLC system interfaced with a 6495C triple-quadruple mass spectrometer and Dr. Leah Gottlieb for the preparation of Frataxin-E and SILAC-frataxin-E proteins. We acknowledge the Hamilton and Finneran families and NIH grants U01NS114143, P30ES013508, and R21TR003035 and FDA grant FD-R-0006029 for financial support.
Supporting Information Available
The Supporting Information is available free of charge at https://pubs.acs.org/doi/10.1021/acs.analchem.3c00091.
MRM transitions used in the UHPLC-MS analysis, linear regression equations, back-calculated values for standards, intraday validation, interday validation, effect of freeze–thawing, alignment of amino acids in frataxin proteoforms from 15 mammalian species, standard curves for frataxin analysis, UHPLC-MRM/MS chromatograms from light and heavy acetyl-M(O)NLRKSGTLGHPGSL Asp-N peptides, frataxin levels versus age of onset in FRDA cases, and frataxin levels versus GAA repeat length in FRDA cases (PDF)
The authors declare no competing financial interest.
Supplementary Material
References
- Keita M.; McIntyre K.; Rodden L. N.; Schadt K.; Lynch D. R. Friedreich ataxia: clinical features and new developments. Neurodegener. Dis. Manage. 2022, 12, 267–283. 10.2217/nmt-2022-0011. [DOI] [PMC free article] [PubMed] [Google Scholar]
- Erwin G. S.; Grieshop M. P.; Ali A.; Qi J.; Lawlor M.; Kumar D.; Ahmad I.; McNally A.; Teider N.; Worringer K.; et al. Synthetic transcription elongation factors license transcription across repressive chromatin. Science 2017, 358, 1617–1622. 10.1126/science.aan6414. [DOI] [PMC free article] [PubMed] [Google Scholar]
- Rodden L. N.; Gilliam K. M.; Lam C.; Rojsajjakul T.; Mesaros C.; Dionisi C.; Pook M.; Pandolfo M.; Lynch D. R.; Blair I. A.; et al. DNA methylation in Friedreich ataxia silences expression of frataxin isoform E. Sci. Rep. 2022, 12, 5031. 10.1038/s41598-022-09002-5. [DOI] [PMC free article] [PubMed] [Google Scholar]
- Patel M.; Isaacs C. J.; Seyer L.; Brigatti K.; Gelbard S.; Strawser C.; Foerster D.; Shinnick J.; Schadt K.; Yiu E. M.; et al. Progression of Friedreich ataxia: quantitative characterization over 5 years. Ann. Clin. Transl. Neurol. 2016, 3, 684–694. 10.1002/acn3.332. [DOI] [PMC free article] [PubMed] [Google Scholar]
- Chiang S.; Kalinowski D. S.; Jansson P. J.; Richardson D. R.; Huang M. L.-H. Mitochondrial dysfunction in the neuro-degenerative and cardio-degenerative disease, Friedreich’s ataxia. Neurochem. Int. 2018, 117, 35–48. 10.1016/j.neuint.2017.08.002. [DOI] [PubMed] [Google Scholar]
- Kearney M.; Orrell R. W.; Fahey M.; Brassington R.; Pandolfo M. Pharmacological treatments for Friedreich ataxia. Cochrane Database Syst. Rev. 2016, 2016, CD007791. 10.1002/14651858.CD007791.pub4. [DOI] [PMC free article] [PubMed] [Google Scholar]
- Tsou A. Y.; Paulsen E. K.; Lagedrost S. J.; Perlman S. L.; Mathews K. D.; Wilmot G. R.; Ravina B.; Koeppen A. H.; Lynch D. R. Mortality in Friedreich ataxia. J. Neurol. Sci. 2011, 307, 46–49. 10.1016/j.jns.2011.05.023. [DOI] [PubMed] [Google Scholar]
- Pousset F.; Legrand L.; Monin M. L.; Ewenczyk C.; Charles P.; Komajda M.; Brice A.; Pandolfo M.; Isnard R.; Tezenas du Montcel S.; et al. A 22-Year Follow-up Study of Long-term Cardiac Outcome and Predictors of Survival in Friedreich Ataxia. JAMA Neurol. 2015, 72, 1334–1341. 10.1001/jamaneurol.2015.1855. [DOI] [PubMed] [Google Scholar]
- a Ocana-Santero G.; Díaz-Nido J.; Herranz-Martín S. Future Prospects of Gene Therapy for Friedreich’s Ataxia. Int. J. Mol. Sci. 2021, 22, 1815. 10.3390/ijms22041815. [DOI] [PMC free article] [PubMed] [Google Scholar]; b Sivakumar A.; Cherqui S. Advantages and Limitations of Gene Therapy and Gene Editing for Friedreich’s Ataxia. Front. genome ed. 2022, 4, 903139. 10.3389/fgeed.2022.903139. [DOI] [PMC free article] [PubMed] [Google Scholar]
- Lynch D. R.; Farmer J.; Hauser L.; Blair I. A.; Wang Q. Q.; Mesaros C.; Snyder N.; Boesch S.; Chin M.; Delatycki M. B.; et al. Safety, pharmacodynamics, and potential benefit of omaveloxolone in Friedreich ataxia. Ann. Clin. Transl. Neurol. 2019, 6, 15–26. 10.1002/acn3.660. [DOI] [PMC free article] [PubMed] [Google Scholar]
- Huichalaf C.; Perfitt T. L.; Kuperman A.; Gooch R.; Kovi R. C.; Brenneman K. A.; Chen X.; Hirenallur-Shanthappa D.; Ma T.; Assaf B. T.; et al. In vivo overexpression of frataxin causes toxicity mediated by iron-sulfur cluster deficiency. Mol. Ther.—Methods Clin. Dev. 2022, 24, 367–378. 10.1016/j.omtm.2022.02.002. [DOI] [PMC free article] [PubMed] [Google Scholar]
- a Condò I.; Ventura N.; Malisan F.; Rufini A.; Tomassini B.; Testi R. In vivo maturation of human frataxin. Hum. Mol. Genet. 2007, 16, 1534–1540. 10.1093/hmg/ddm102. [DOI] [PubMed] [Google Scholar]; b Schmucker S.; Argentini M.; Carelle-Calmels N.; Martelli A.; Puccio H. The in vivo mitochondrial two-step maturation of human frataxin. Hum. Mol. Genet. 2008, 17, 3521–3531. 10.1093/hmg/ddn244. [DOI] [PubMed] [Google Scholar]
- Guo L.; Wang Q.; Weng L.; Hauser L. A.; Strawser C. J.; Mesaros C.; Lynch D. R.; Blair I. A. Characterization of a new N-terminally acetylated extra-mitochondrial isoform of frataxin in human erythrocytes. Sci. Rep. 2018, 8, 17043. 10.1038/s41598-018-35346-y. [DOI] [PMC free article] [PubMed] [Google Scholar]
- Weng L.; Laboureur L.; Wang Q.; Guo L.; Xu P.; Gottlieb L.; Lynch D. R.; Mesaros C.; Blair I. A. Extra-mitochondrial mouse frataxin and its implications for mouse models of Friedreich’s ataxia. Sci. Rep. 2020, 10, 15788. 10.1038/s41598-020-72884-w. [DOI] [PMC free article] [PubMed] [Google Scholar]
- Dean L.Blood and the cells it contains. Blood Groups and Red Cell Antigens; National Center for Biotechnology Information: USA, 2005. [Google Scholar]
- Mahalingaiah P. K.; Palenski T.; Van Vleet T. R. An In Vitro Model of Hematotoxicity: Differentiation of Bone Marrow-Derived Stem/Progenitor Cells into Hematopoietic Lineages and Evaluation of Lineage-Specific Hematotoxicity. Curr. Protoc. Toxicol. 2018, 76, e45 10.1002/cptx.45. [DOI] [PubMed] [Google Scholar]
- Franco R. S. Measurement of red cell lifespan and aging. Transfus. Med. Hemotherapy 2012, 39, 302–307. 10.1159/000342232. [DOI] [PMC free article] [PubMed] [Google Scholar]
- Skadberg O.; Brun A.; Sandberg S. Human reticulocytes isolated from peripheral blood: maturation time and hemoglobin synthesis. Lab. Hematol. 2003, 9, 198–206. [PubMed] [Google Scholar]
- Nayak M. K.; Kulkarni P. P.; Dash D. Regulatory role of proteasome in determination of platelet life span. J. Biol. Chem. 2013, 288, 6826–6834. 10.1074/jbc.m112.403154. [DOI] [PMC free article] [PubMed] [Google Scholar]
- Guo L.; Wang Q.; Weng L.; Hauser L. A.; Strawser C. J.; Rocha A. G.; Dancis A.; Mesaros C.; Lynch D. R.; Blair I. A. Liquid chromatography-high resolution mass spectrometry analysis of platelet frataxin as a protein biomarker for the rare disease Friedreich’s Ataxia. Anal. Chem. 2018, 90, 2216–2223. 10.1021/acs.analchem.7b04590. [DOI] [PMC free article] [PubMed] [Google Scholar]
- a Patel A. A.; Ginhoux F.; Yona S. Monocytes, macrophages, dendritic cells and neutrophils: an update on lifespan kinetics in health and disease. Immunology 2021, 163, 250–261. 10.1111/imm.13320. [DOI] [PMC free article] [PubMed] [Google Scholar]; b Park Y. M.; Bochner B. S. Eosinophil survival and apoptosis in health and disease. Allergy, Asthma Immunol. Res. 2010, 2, 87–101. 10.4168/aair.2010.2.2.87. [DOI] [PMC free article] [PubMed] [Google Scholar]; c Wakahara K.; Baba N.; Van V. Q.; Bégin P.; Rubio M.; Ferraro P.; Panzini B.; Wassef R.; Lahaie R.; Caussignac Y.; et al. Human basophils interact with memory T cells to augment Th17 responses. Blood 2012, 120, 4761–4771. 10.1182/blood-2012-04-424226. [DOI] [PubMed] [Google Scholar]; d Westera L.; Drylewicz J.; den Braber I.; Mugwagwa T.; van der Maas I.; Kwast L.; Volman T.; van de Weg-Schrijver E. H.; Bartha I.; Spierenburg G.; et al. Closing the gap between T-cell life span estimates from stable isotope-labeling studies in mice and humans. Blood 2013, 122, 2205–2212. 10.1182/blood-2013-03-488411. [DOI] [PubMed] [Google Scholar]
- a Hoffman R.Hemotology: Basic Principles and Practice; Elsevier, 2022. [Google Scholar]; b Selak M. A.; Lyver E.; Micklow E.; Deutsch E. C.; Önder O.; Selamoglu N.; Yager C.; Knight S.; Carroll M.; Daldal F.; et al. Blood cells from Friedreich ataxia patients harbor frataxin deficiency without a loss of mitochondrial function. Mitochondrion 2011, 11, 342–350. 10.1016/j.mito.2010.12.003. [DOI] [PMC free article] [PubMed] [Google Scholar]
- Anderson N. L.; Polanski M.; Pieper R.; Gatlin T.; Tirumalai R. S.; Conrads T. P.; Veenstra T. D.; Adkins J. N.; Pounds J. G.; Fagan R.; et al. The Human Plasma Proteome. Mol. Cell. Proteomics 2004, 3, 311–326. 10.1074/mcp.m300127-mcp200. [DOI] [PubMed] [Google Scholar]
- Yocum A. K.; Yu K.; Oe T.; Blair I. A. Effect of immunoaffinity depletion of human serum during proteomic investigations. J. Proteome Res. 2005, 4, 1722–1731. 10.1021/pr0501721. [DOI] [PubMed] [Google Scholar]
- Oe T.; Ackermann B. L.; Inoue K.; Berna M. J.; Garner C. O.; Gelfanova V.; Dean R. A.; Siemers E. R.; Holtzman D. M.; Farlow M. R.; et al. Quantitative analysis of amyloid beta peptides in cerebrospinal fluid of Alzheimer’s disease patients by immunoaffinity purification and stable isotope dilution liquid chromatography/negative electrospray ionization tandem mass spectrometry. Rapid Commun. Mass Spectrom. 2006, 20, 3723–3735. 10.1002/rcm.2787. [DOI] [PubMed] [Google Scholar]
- Wang Q.; Guo L.; Strawser C. J.; Hauser L. A.; Hwang W. T.; Snyder N. W.; Lynch D. R.; Mesaros C.; Blair I. A. Low apolipoprotein A-I levels in Friedreich’s ataxia and in frataxin-deficient cells: Implications for therapy. PLoS One 2018, 13, e0192779 10.1371/journal.pone.0192779. [DOI] [PMC free article] [PubMed] [Google Scholar]
- Weng L.; Guo L.; Vachani A.; Mesaros C.; Blair I. A. Quantification of Serum High Mobility Group Box 1 by Liquid Chromatography/High-Resolution Mass Spectrometry: Implications for Its Role in Immunity, Inflammation, and Cancer. Anal. Chem. 2018, 90, 7552–7560. 10.1021/acs.analchem.8b01175. [DOI] [PMC free article] [PubMed] [Google Scholar]
- Food and Drug Administration . Bioanalytical Method Validation: Guidance for Industry, 2018. https://www.fda.gov/media/70858/download; accessed 01-05-2023.
- Wang Q.; Laboureur L.; Weng L.; Eskenazi N. M.; Hauser L. A.; Mesaros C.; Lynch D. R.; Blair I. A. Simultaneous Quantification of Mitochondrial Mature Frataxin and Extra-Mitochondrial Frataxin Isoform E in Friedreich’s Ataxia Blood. Front. Neurosci. 2022, 16, 874768. 10.3389/fnins.2022.874768. [DOI] [PMC free article] [PubMed] [Google Scholar]
- Bai X.; Yang T.; Putz A. M.; Wang Z.; Li C.; Fortin F.; Harding J. C. S.; Dyck M. K.; Dekkers C.; Field J. C. M.; et al. Investigating the genetic architecture of disease resilience in pigs by genome-wide association studies of complete blood count traits collected from a natural disease challenge model. BMC Genomics 2021, 22, 535. 10.1186/s12864-021-07835-4. [DOI] [PMC free article] [PubMed] [Google Scholar]
- Viswanathan C. T.; Bansal S.; Booth B.; DeStefano A. J.; Rose M. J.; Sailstad J.; Shah V. P.; Skelly J. P.; Swann P. G.; Weiner R. Quantitative bioanalytical methods validation and implementation: best practices for chromatographic and ligand binding assays. Pharm. Res. 2007, 24, 1962–1973. 10.1007/s11095-007-9291-7. [DOI] [PubMed] [Google Scholar]
- MacLean B.; Tomazela D. M.; Shulman N. J.; Chambers M.; Finney G. L.; Frewen R.; Kern D. L.; Tabb D. C.; Liebler M. J.; MacCoss M. J. Skyline: an open source document editor for creating and analyzing targeted proteomics experiments. Bioinformatics 2010, 26, 966–968. 10.1093/bioinformatics/btq054. [DOI] [PMC free article] [PubMed] [Google Scholar]
- Mendell J. R.; Al-Zaidy S. A.; Rodino-Klapac L. R.; Goodspeed K.; Gray S. J.; Kay C. N.; Boye S. L.; Boye S. E.; George L. A.; Salabarria S.; et al. Current Clinical Applications of In Vivo Gene Therapy with AAVs. Mol. Ther. 2021, 29, 464–488. 10.1016/j.ymthe.2020.12.007. [DOI] [PMC free article] [PubMed] [Google Scholar]
- Hu Z.; Crews C. M. Recent Developments in PROTAC-Mediated Protein Degradation: From Bench to Clinic. Chembiochem 2022, 23, e202100270 10.1002/cbic.202100270. [DOI] [PMC free article] [PubMed] [Google Scholar]
- a Hebert L. E.; Weuve J.; Scherr P. A.; Evans D. A. Alzheimer disease in the United States (2010-2050) estimated using the 2010 census. Neurology 2013, 80, 1778–1783. 10.1212/wnl.0b013e31828726f5. [DOI] [PMC free article] [PubMed] [Google Scholar]; b Swanson C. J.; Zhang Y.; Dhadda S.; Wang J.; Kaplow J.; Lai R. Y. K.; Lannfelt L.; Bradley H.; Rabe M.; Koyama A.; et al. A randomized, double-blind, phase 2b proof-of-concept clinical trial in early Alzheimer’s disease with lecanemab, an anti-Aβ protofibril antibody. Alzheimer’s Res. Ther. 2021, 13, 80. 10.1186/s13195-021-00813-8. [DOI] [PMC free article] [PubMed] [Google Scholar]
- Dementia Forecasting CollaboratorsNichols E.; Steinmetz J. D.; Vollset S. E.; Fukutaki K.; Chalek J.; Abd-Allah F.; Abdoli A.; Abualhasan A.; Abu-Gharbieh E.; Akram T. T.; Al Hamad H. Estimation of the global prevalence of dementia in 2019 and forecasted prealence in 2050: an analysis for the Global Burden of Disease Study 2019. Lancet Public Health 2022, 7, e105–e125. 10.1016/S2468-2667(21)00249-8. [DOI] [PMC free article] [PubMed] [Google Scholar]
- Powers A.; Rinkoski T. A.; Katie Cheung K.; Schehr H.; Osgood N.; Livelo C.; Levin N.; Safadi M.; Kerr J.; Zhang C.; et al. GeneTAC small molecules reduce toxic nuclear foci and restore normal splicing in corneal endothelial cells derived from patients with Fuchs endothelial corneal dystrophy (FECD) harboring repeat expansions in transcription factor 4 (TCF4). Invest. Ophthalmol. Visual Sci. 2022, 63, 2753. [Google Scholar]
- Borrebaeck C. A. Precision diagnostics: moving towards protein biomarker signatures of clinical utility in cancer. Nat. Rev. Cancer 2017, 17, 199–204. 10.1038/nrc.2016.153. [DOI] [PubMed] [Google Scholar]
- Zhao Y.; Brasier A. R. Qualification and Verification of Protein Biomarker Candidates. Adv. Exp. Med. Biol. 2016, 919, 493–514. 10.1007/978-3-319-41448-5_23. [DOI] [PubMed] [Google Scholar]
- Rodden L. N.; Rummey C.; Dong Y. N.; Lynch D. R. Clinical Evidence for Variegated Silencing in Patients With Friedreich Ataxia. Neurol.: Genet. 2022, 8, e683 10.1212/nxg.0000000000000683. [DOI] [PMC free article] [PubMed] [Google Scholar]
Associated Data
This section collects any data citations, data availability statements, or supplementary materials included in this article.