Abstract
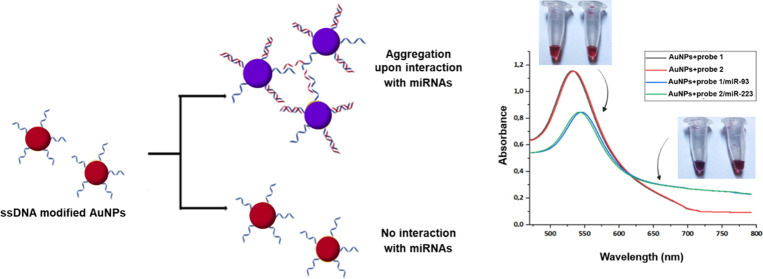
Recently, miRNAs have been established as promising, specific biomarkers for the diagnosis of many diseases, including osteoarthritis. Herein, we report a ssDNA-based detection method for miRNAs implicated in osteoarthritis, specifically, miR-93 and miR-223. In this study, gold nanoparticles (AuNPs) were modified with oligonucleotide ssDNA to detect miRNAs circulating in the blood in healthy subjects and patients suffering from osteoarthritis. The detection method was based on the colorimetric and spectrophotometric assessment of biofunctionalized AuNPs upon interaction with the target and their subsequent aggregation. Results showed that these methods could be used to detect easily and rapidly miR-93 but not miR-223 in osteoarthritic patients, and they could potentially be used as a diagnostic tool for blood biomarkers. Visual-based detection as well as spectroscopic methods are simple, rapid, and label-free, due to which they can be used as a diagnostic tool.
1. Introduction
Osteoarthritis (OA) is a progressive joint disease that mainly affects adults over 60 years of age and has been associated with pain, disability, and decreased quality of life. It gradually leads to articular cartilage degeneration and, in severe cases, to subchondral bone structure alteration.1 The onset of the disease has been associated with a variety of genetic and nongenetic risk factors, including age, obesity, diabetes, lifestyle, joint disease, etc. The etiopathology of OA is not fully understood, and as a result, diagnostic and therapeutic tools are limited.2
Currently, the gold standard for the diagnosis of the disease remains radiography, while clinical examination includes the evaluation of pain by the clinician. As a tool, radiography is not very sensitive, and disease detection is feasible when the articular cartilage has already started to degrade.3 Therefore, there is an imperative need for new diagnostic tools based on biomolecular changes in body fluids. Because of the difficulties in synovial fluid sample collection, many researchers placed their interest in blood as a source for biomarker investigation. As proposed by Bauer et al., biomarkers can be classified into one or more of the five categories: burden of disease, investigative, prognostic, efficacy of intervention, and diagnostic (BIPED).4,5
Among the potential biological molecules, microRNAs (miRNAs or miRs) hold great promise as novel circulating biomarkers. miRNAs are small, single-stranded, noncoding RNAs composed of 22–28 nucleotides with a crucial role in post-transcriptional gene silencing.6−9 They are encoded by miRNA genes or by introns located on genes, bind to complementary mRNAs, and inhibit their translation.10,11 Besides functioning intracellularly, miRNAs can be transferred extracellularly by being packaged in membranous vesicles, such as exosomes, or bound to lipoproteins or other RNA-binding proteins.8 Until now, several studies have explored the role of miRNAs in OA, and about 80 of them have been associated with the underlying stage of the disease.9 As proposed, miRNAs regulate the expression of both catabolic and anabolic genes and target different signaling pathways involved in the progression of the disease. The main biological functions that are regulated include chondrocyte proliferation and apoptosis, extracellular matrix synthesis, degradation, and inflammation.10,11
Besides their potential role as therapeutic tools, miRNAs have been studied as potential prognostic and diagnostic biomarkers that can be used at early stages where other methods fail to succeed.12 Cuadra et al., in a comparative study on healthy subjects and OA patients, revealed plasma differences in the expression levels of 12 miRNAs, and among them, miR-93 (microRNA-93) was overexpressed in OA patients.13 Recently, Rousseau et al. showed that miR-93 is implicated in chondrocyte apoptosis by inhibiting the process and by downregulating inflammation. Another miRNA, miR-223 (microRNA-223), is also associated with chondrocyte apoptosis through peroxosomal regulation and is overexpressed in the synovial fluid of OA patients.14,15
Novel methods for miRNA detection include the development of nanobiosensors based on aptamers. Aptamers (Apt) are single-stranded nucleic acids (DNA or RNA) with a small size—usually consisting of 15–120 nucleotides—and can bind a wide variety of ligands ranging from small solutes to peptides and proteins, cells, viruses, and parasites.16 Among the developed aptamer-based nanosensors (aptasensors), gold nanoparticles (AuNPs) and silver nanoparticles (AgNPs) are the most used. AuNPs, because of their significant chemical and physical properties such as light-scattering properties and strong optical absorption, have been increasingly used for the fabrication of miniature optical devices, sensors, and photonic circuits as well as for medical diagnostic and therapeutic applications.17,18
The aim of the present study is the qualitative detection of miR-93 and miR-223 with ssDNA-modified AuNPs on blood serum samples and the evaluation of the difference between healthy subjects and OA patients so as to develop a simple, rapid, and specific sensor.
2. Materials and Methods
2.1. Materials
Gold nanoparticles were purchased from US Research Nanomaterials Inc. ssDNA probes were chemically synthesized and provided by Aptagen. Oligonucleotides were purchased from GeneCrust. All reagents were supplied by Sigma-Aldrich and were of HPLC grade.
2.2. Blood Sample Collection
Blood samples were kindly provided by the 424 Military Hospital at Thessaloniki. After collection, the samples were centrifuged for 10 min at 4000g, and serum was collected and preserved at −4 °C.
2.3. Modification of Gold Nanoparticles with ssDNA Probes
To be functionalized on AuNPs, the designed ssDNA probes, hereafter cited as probes 1 and probe 2, were modified with a thiol group at the 3′-end. Their nucleotide sequences and targets are provided in Table 1.
Table 1. Sequence of the Nucleotide Probes and miRNAs.
| name | nucleotide sequence | target |
|---|---|---|
| probe 1 | 5′-CACGAACAGCACUUUG/3ThioMC3-D-3′ | miR-93 |
| probe 2 | 5′-CAUAAACUGUUCGACUC/3ThioMC3-D-3′ | miR-223 |
| miRNA-93 | 5′-CUGGGGGCUCCAAAGUGCUGUUCGUGCAGGUAGUGUGAUUACCCAACCUACUGCUGAGCUAGCACUUCCCGAGCCCCCGG-3′ | |
| miRNA-223 | 5′-CCUGGCCUCCUGCAGUGCCACGCUCCGUGUAUUUGACAAGCUGAGUUGGACACUCCAUGUGGUAGAGUGUCAGUUUGUCAAAUACCCCAAGUGCGGCACAUGCUUACCAG-3′ |
The activation of sulfhydryl groups of the ssDNA probes was achieved after treatment with 0.1 M DTT and incubation for 1 h at room temperature. DTT was removed with 3K Millipore dialysis filters.
To immobilize the ssDNA probes on colloidal AuNPs, the method proposed by Turkevich et al. was used. An appropriate amount of 14 nm AuNPs was mixed with a 100 μM solution of ssDNA probes, which were previously activated, for 16 h. Then, phosphate solution and 2 M NaCl were added. NaCl was added gradually, increasing from 0.05 M to a final concentration of 0.3 M NaCl. This was followed by centrifugation at 13 000g for 15 min to remove the excess of the ssDNA probes, and the pellet was resuspended in phosphate buffer.20,25
2.4. Incubation of Modified AuNPs with the Samples
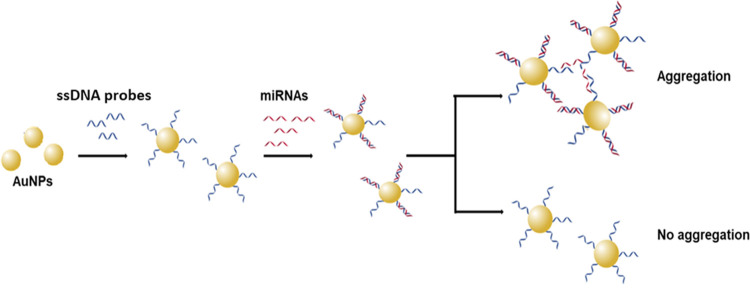
An appropriate amount of the modified AuNPs was mixed with the blood serum sample of a patient or a healthy donor, from which miRNAs were first extracted as described by Vahed et al.21 The result was evaluated by observing the color of the nanoparticles and by measuring the absorbance. Visible color changes of AuNPs in the colloidal form are due to the properties of localized surface plasmons. Aggregation of the modified nanoparticles after interacting with the target leads to surface plasmon coupling between the particles, resulting in a shift of the characteristic surface plasmon band (∼520 nm) to longer wavelengths (∼650 nm). For this reason, AuNPs exhibit a reddish color when in suspension, which changes to a violet color when aggregated. Figure 1 describes the basic principle of the method used.
Figure 1.
Schematic diagram of the design of the method. Upon hybridization with the target (miRNAs), modified AuNPs aggregate and change color from reddish to purple-blue. Also, a characteristic shift to longer wavelengths is detected in the UV–Vis spectra.
3. Results and Discussion
3.1. Retardation Assay for the Biofunctionalization of AuNPs with ssDNA Probes
According to previous studies, biofunctionalization of AuNPs with ssDNA can be detected by agarose gel electrophoresis as their binding does not change their color, so they can be observed with the naked eye.18,19 As a result of the negative charge of the DNA phosphate groups, the ssDNA-modified AuNPs move toward the anode and separate from those without ssDNA. To rule out any possible adsorption on the surface and prove that the displayed changes are due to the binding of the ssDNA to the AuNPs alone through thiol groups, AuNPs not treated with ssDNA probes and AuNPs not treated with the phosphate solutions but with added ssDNA probes were used as control samples.
Successful modification of the AuNPs with the ssDNA probes was evaluated by agarose gel electrophoresis (1% w/v in 0.5× TAE). As seen in Figure 2, AuNPs modified with ssDNA probes move faster toward the anode (lanes 2 and 3) than AuNPs without ssDNA probes.
Figure 2.

1% w/v agarose gel electrophoresis in 0.5X TAE of AuNPs, without UV light (A) and with UV light (B). Lane 1: AuNPs; lane 2: AuNPs with ssDNA probe 1 but not treated with the modification solutions; lane 3: AuNPs with ssDNA probe 2 but not treated with the modification solutions; lane 4: AuNPs modified with ssDNA probe 1; lane 5: AuNPs modified with ssDNA probe 2; lane 6: supernatant from AuNPs with untreated ssDNA probe 1; lane 7: supernatant from AuNPs with untreated ssDNA probe 2.
3.2. Colorimetric Assessment of Biofunctionalized AuNPs
3.2.1. Interaction of ssDNA-Biofunctionalized AuNPs with miRs
Biofunctionalized AuNPs were treated with their complementary miR-93 and miR-223 counterparts (control samples) to assess the color change after the interaction. As mentioned above, a color change from red to violet indicates the interaction/generation of AuNPs–ssDNA probe–miRs.
Figure 3 shows the color change of AuNPs–ssDNA probe–miRs (4 and 5). Tubes 1, 2, and 3 contain AuNPs without any treatment, AuNPs with probe 1, and AuNPs with probe 2, respectively. The AuNPs carrying only the ssDNA probes retain the red color (tubes 2 and 3), while they change color from red to violet when they interact with the corresponding miR-93 and miR-223 (tubes 4 and 5, respectively) because of aggregation due to the binding of the complementary sequences. The intensity of the color depends on the binding rate of the complementary sequence.
Figure 3.
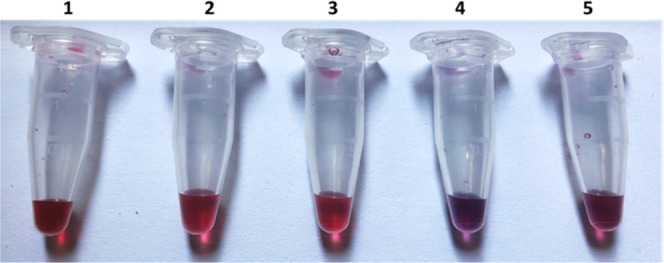
Color change of AuNPs after modification and incubation with the complementary sequences. (1) AuNPs (control sample), (2) AuNPs + probe 1, (3) AuNPs + probe 2, (4) AuNPs + probe 1/miR-93, and (5) AuNPs + probe 2/miR-223.
3.2.2. Incubation of ssDNA-Biofunctionalized AuNPs with Blood Serum Samples
Blood sera of healthy donors and OA patients were incubated for 16 h with ssDNA-biofunctionalized AuNPs, and then the color change was visually examined. Also, the spectrophotometric properties of miR-93 are displayed in Figure 4A. In the case of OA patients (tube 4), the AuNPs aggregate and their color changes, indicating the presence of miR in this group, while in healthy subjects, its presence is not visually detected, and no color change is observed (tube 3). In contrast, for miR-223 detection, as seen in Figure 4B, in the case of healthy subjects (tube 3), the AuNPs aggregate and their color changes, indicating the presence of miR in this group, while in OA patients, its presence is not visually detected, and no color change is observed. This may also be due to the fact that all patients were female, and the miR-223 gene is located on the X chromosome; so far, there is no information on how it is affected by the inactivation of the X chromosome. Also, the percentage of patients and healthy subjects is small, so it is possible that miR-93 is absent and subsequently not detectable.
Figure 4.
Color change of ssDNA-biofunctionalized AuNPs after incubation with blood serum samples for the detection of (A) miR-93 and (B) miR-223. (1) ssDNA-biofunctionalized AuNPs (control sample), (2) biofunctionalized AuNPs after incubation with miR-93, (3) biofunctionalized AuNPs after incubation with blood serum from healthy subjects, and (4) biofunctionalized AuNPs after incubation with the blood serum of OA patients.
3.3. Spectroscopic Assessment of Biofunctionalized AuNPs by UV–Vis Spectroscopy
AuNPs with a diameter of 14 nm absorb at ∼530 nm (with variations depending on the manufacturer), and their biofunctionalization with ssDNA can be detected by a shift of the absorption peak and a decrease in its intensity.
3.3.1. Interaction of ssDNA-Biofunctionalized AuNPs with miRs
To assess the modification of AuNPs with ssDNA probes, the absorbance spectrum from 450 to 750 nm was recorded (Figure 5). The modification of AuNPs with ssDNA (red and blue line) shifts the peak to a higher wavelength and decreases its intensity. Unmodified AuNPs (black line) show the maximum absorption at 527 nm, while AuNPs modified with probes 1 and 2 show the maximum absorptions at 530 and 532 nm, respectively (Table 2). Spectra after the biofunctionalization show the same shape but have different intensities compared with the control sample due to a layer formed on the cell after the biofunctionalization.22
Figure 5.
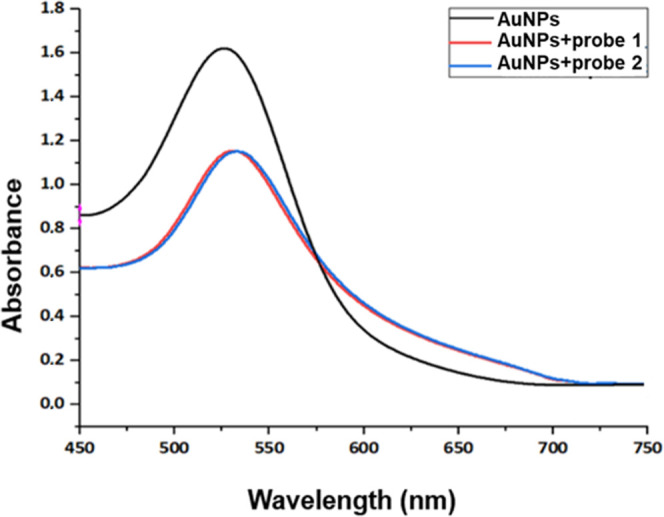
UV–Vis absorption spectra of AuNPs before and after their modification with ssDNA probes. The unmodified AuNPs (control sample) are represented by a black line, while AuNPs modified with the two different probes are represented by red and blue lines, respectively.
Table 2. Maximum Absorbance Values and Wavelengths for the Unmodified AuNPs and the ssDNA-Modified AuNPs.
| sample | maximum absorbance | wavelength (nm) |
|---|---|---|
| AuNPs | 1.622 | 527 |
| AuNPs + probe 1 | 1.140 | 530 |
| AuNPs + probe 2 | 1.154 | 532 |
After biofunctionalization, spectroscopic changes of the AuNPs incubated with the miR controls were further evaluated. As shown in Figure 6, after the binding of miRs (blue and green lines), a shift of the peak to ∼540 nm is observed, and from 700 nm onward, the absorbance continues to decrease progressively and no plateau is observed, which also indicates the aggregation of AuNPs (Table 3).
Figure 6.
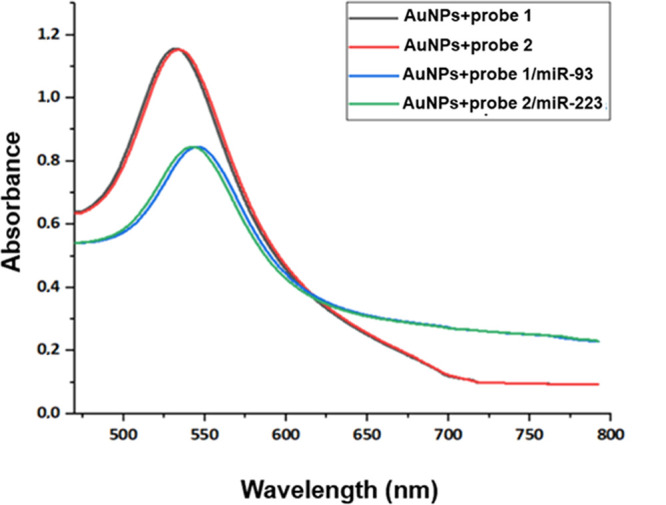
UV–Vis absorption spectra of the modified AuNPs before and after incubation with the complementary miRs. Black and red lines represent the ssDNA-modified AuNPs, while blue and green lines represent the modified AuNPs incubated with the target miRNAs.
Table 3. Maximum Absorbance Values and Wavelengths for the ssDNA-Modified AuNPs Incubated with the Control miRs.
| sample | maximum absorbance | wavelength (nm) |
|---|---|---|
| AuNPs + probe 1 | 1.140 | 530 |
| AuNPs + probe 2 | 1.154 | 532 |
| AuNPs + probe 1/miR-93 | 0.845 | 541 |
| AuNPs + probe 2/miR-223 | 0.844 | 544 |
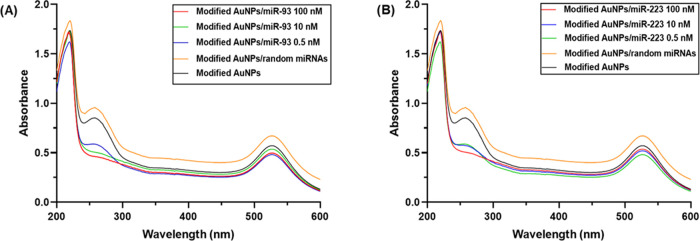
To investigate the applicability of the sensor, its specificity was examined toward miRNAs isolated from the epithelial tissue. Also, the sensitivity of the developed modified AuNPs was evaluated using different concentrations of the target probes. Figure 7 shows the UV–Vis spectrum from 200 to 600 nm. Interaction of the ssDNA probe with the target probe exhibits the characteristic hypochromic effect, while the incubation of the modified AuNPs with miRNAs extracted from the epithelial tissue shows no characteristic effect. As a result, no hybridization is observed.
Figure 7.
UV–Vis absorption spectra of modified AuNPs with different concentrations of the target probe: (A) miR-93 and (B) miR-223. Also, the incubation of the modified AuNPs with random miRs (orange line) was recorded.
3.3.2. Incubation of ssDNA-Biofunctionalized AuNPs with Blood Serum Samples
After the spectroscopic evaluation of the ssDNA-modified AuNPs, they were incubated for 16 h with the blood serum samples of healthy subjects and OA patients.23−26
As shown in Figure 8, in the case of AuNPs modified with the ssDNA for miR-93, in healthy subjects, the absorption spectrum was similar to that of the modified AuNPs to which the miR-control was attached (blue line), with a difference observed at ∼720 nm, which may also be due to the aggregation of AuNPs. For OA patients, it seems that the modified AuNPs bound a small percentage of miR-93 because a small difference in absorption intensity at 530 nm and a difference at ∼720 nm is observed, which may be due to the aggregation of some AuNPs (Table 4).
Figure 8.
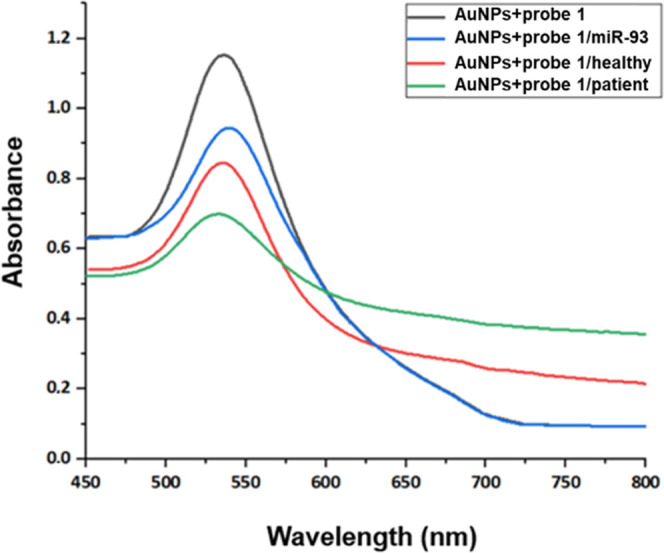
UV–Vis absorption spectra of AuNPs modified with probe 1 before and after incubation with the blood serum samples of healthy donors and OA patients. The black line represents the absorption spectrum of the modified AuNPs, the red line represents the modified AuNPs with the control miR, the blue line represents the modified AuNPs incubated with the healthy sample, and the green line represents the modified AuNPs incubated with the patient sample.
Table 4. Maximum Absorbance Values and Wavelengths for the ssDNA-Modified AuNPs Incubated with the Blood Serum Samples of Healthy Donors and OA Patients for the Detection of miR-93.
| sample | maximum absorbance | wavelength (nm) |
|---|---|---|
| AuNPs + probe 1 | 1.140 | 530 |
| AuNPs + probe 1/miR-93 | 0.845 | 541 |
| AuNPs + probe 1/healthy | 0.945 | 539 |
| AuNPs + probe 1/patient | 0.699 | 533 |
Similarly, for miR-223, modified AuNPs incubated with the healthy sample (Figure 9, black line) show a change in the absorbance at ∼720 nm, which is not as pronounced as that of the control sample. In the patient samples, a change is observed at ∼710 nm, which may be due to nanoparticle aggregation, which was not visible with the colorimetric assay as described above (Table 5).
Figure 9.
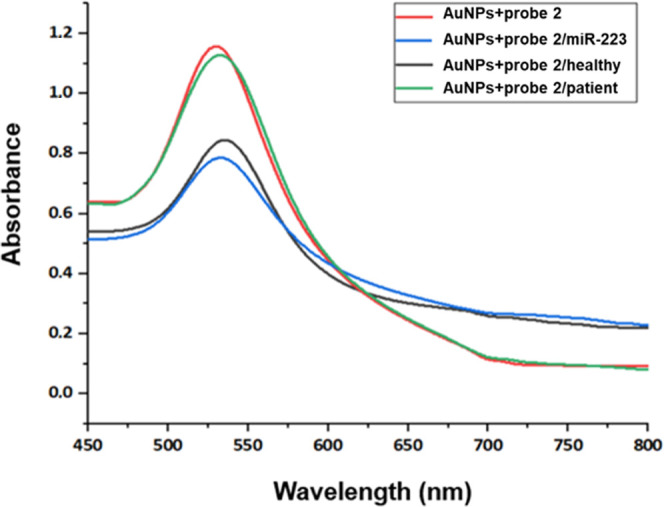
UV–Vis absorption spectra of AuNPs modified with probe 2 before and after incubation with the blood serum samples of healthy donors and OA patients. The black line represents the absorption spectrum of the modified AuNPs, the red line represents the modified AuNPs with the control miR, the blue line represents the modified AuNPs incubated with the healthy sample, and the green line represents the modified AuNPs incubated with the patient sample.
Table 5. Maximum Absorbance Values and Wavelengths for the ssDNA-Modified AuNPs Incubated with the Blood Serum Samples of Healthy Donors and OA Patients for the Detection of miR-223.
| sample | maximum absorbance | wavelength (nm) |
|---|---|---|
| AuNPs + probe 2 | 1.154 | 532 |
| AuNPs + probe 2/miR-223 | 0.844 | 544 |
| AuNPs + probe 2/healthy | 0.845 | 535 |
| AuNPs + probe 2/patient | 1.127 | 533 |
4. Conclusions
In conclusion, a versatile sensor for targeting miR-93 and miR-223 detection was developed based on the precipitation of AuNPs. miR-93 was detected by both methods in patient samples, while miR-223 was detected in healthy samples and not in patients, as it was expected. The modification of AuNPs with ssDNA probes that target miRNAs circulating in the blood was achieved and tested as a potential tool to qualitatively evaluate the differences between healthy subjects and patients. The main advantage of the developed method is the in situ observation for routine and simple tests due to the color change and also the quantitative evaluation of specific targets via a UV–Vis spectrophotometer. These devices are also cost-effective and have a simple design compared with traditional ones. Nevertheless, the main disadvantage is the specific recognition of the target in a pool of biomolecules present in the biological sample.
Acknowledgments
This study has been co-financed by the European Regional Development Fund of the European Union and the Greek National Funds through the Operational Program Competitiveness, Entrepreneurship and Innovation, under the call RESEARCH–CREATE–INNOVATE (Project Code: T1EDK-04567).
Author Contributions
M.P.: investigation, methodology, validation, formal analysis, resources, data curation, writing—original draft, visualization. R.M.P.: investigation, methodology, validation. A.-N.T.: resources. T.C.-P.: conceptualization, supervision, project administration, funding acquisition, writing—review and editing.
The authors declare no competing financial interest.
References
- Onishi K.; Utturkar A.; Chang E.; Panush R.; Hata J.; Perret-Karimi D. Osteoarthritis: A Critical Review. Crit. Rev. Phys. Rehab. Med. 2012, 24, 251–254. 10.1615/CritRevPhysRehabilMed.2013007630. [DOI] [PMC free article] [PubMed] [Google Scholar]
- Kloppenburg M.; Berenbaum F. Osteoarthritis year in review 2019: epidemiology and therapy. Osteoarthritis Cartilage 2020, 28, 242–248. 10.1016/j.joca.2020.01.002. [DOI] [PubMed] [Google Scholar]
- Braun H. J.; Gold G. E. Diagnosis of osteoarthritis: imaging. Bone 2012, 51, 278–288. 10.1016/j.bone.2011.11.019. [DOI] [PMC free article] [PubMed] [Google Scholar]
- Bauer D. C.; Hunter D.; Abramson S.; et al. Classification of osteoarthritis biomarkers: a proposed approach. Osteoarthritis Cartilage 2006, 14, 723–727. 10.1016/j.joca.2006.04.001. [DOI] [PubMed] [Google Scholar]
- Lotz M.; Martel-Pelletier J.; Christiansen C.; et al. Value of biomarkers in osteoarthritis: current status and perspectives. Ann. Rheum. Dis. 2013, 72, 1756–1763. 10.1136/annrheumdis-2013-203726. [DOI] [PMC free article] [PubMed] [Google Scholar]
- Condrat C. E.; Thompson D. C.; Barbu M. G.; Bugnar O. L.; Boboc A.; Cretoiu D.; Suciu N.; Cretoiu S. M.; Voinea S. C. miRNAs as Biomarkers in Disease: Latest Findings Regarding Their Role in Diagnosis and Prognosis. Cells 2020, 9, 276. 10.3390/cells9020276. [DOI] [PMC free article] [PubMed] [Google Scholar]
- Gareev I.; Beylerli O.; Yang G.; et al. The current state of MiRNAs as biomarkers and therapeutic tools. Clin. Exp. Med. 2020, 20, 349–359. 10.1007/s10238-020-00627-2. [DOI] [PubMed] [Google Scholar]
- Zhang K.; Shuzhen Q.; Tang D. CoOOH nanosheets-coated g-C3N4/CuInS2 nanohybrids for photoelectrochemical biosensor of carcinoembryonic antigen coupling hybridization chain reaction with etching reaction. Sens. Actuators, B 2019, 307, 127631 10.1016/j.snb.2019.127631. [DOI] [Google Scholar]
- Qiu Z.; Shu J.; Tang D. Bioresponsive Release System for Visual Fluorescence Detection of Carcinoembryonic Antigen from Mesoporous Silica Nanocontainers Mediated Optical Color on Quantum Dot-Enzyme-Impregnated Paper. Anal. Chem. 2017, 89, 5152–5160. 10.1021/acs.analchem.7b00989. [DOI] [PubMed] [Google Scholar]
- Gong H.; Hu X.; Zeng R.; Li Y.; Xu J.; Li M.; Tang D. CRISPR/Cas12a-based photoelectrochemical sensing of microRNA on reduced graphene oxide-anchored Bi2WO6 coupling with catalytic hairpin assembly. Sens. Actuators, B 2022, 369, 132307 10.1016/j.snb.2022.132307. [DOI] [Google Scholar]
- Zeng R.; Xu J.; Lu L.; Lin Q.; Huang X.; Huang L.; Li M.; Tang D. Photoelectrochemical bioanalysis of microRNA on yolk-in-shell Au@CdS based on the catalytic hairpin assembly-mediated CRISPR-Cas12a system. Chem. Commun. 2022, 58, 7562–7565. 10.1039/D2CC02821B. [DOI] [PubMed] [Google Scholar]
- Boon R. A.; Vickers K. C. Intercellular transport of microRNAs. Arteriosclerosis, Thrombosis, Vasc. Biol. 2013, 33, 186–192. 10.1161/ATVBAHA.112.300139. [DOI] [PMC free article] [PubMed] [Google Scholar]
- Murata K.; Yoshitomi H.; Tanida S.; Ishikawa M.; Nishitani K.; Ito H.; Nakamura T. Plasma and synovial fluid microRNAs as potential biomarkers of rheumatoid arthritis and osteoarthritis. Arthritis Res. Ther. 2010, 12, R86. 10.1186/ar3013. [DOI] [PMC free article] [PubMed] [Google Scholar]
- Rousseau J. C.; Millet M.; Croset M.; et al. Association of circulating microRNAs with prevalent and incident knee osteoarthritis in women: the OFELY study. Arthritis Res. Ther. 2020, 22, 2. 10.1186/s13075-019-2086-5. [DOI] [PMC free article] [PubMed] [Google Scholar]
- Panagopoulos P. K.; Lambrou G. I. The Involvement of MicroRNAs in Osteoarthritis and Recent Developments: A Narrative Review. Mediterr. J. Rheumatol. 2018, 29, 67–79. 10.31138/mjr.29.2.67. [DOI] [PMC free article] [PubMed] [Google Scholar]
- Aae T. F.; Karlsen T. A.; Haugen I. K.; Risberg M. A.; Lian Ø. B.; Brinchmann J. E. Evaluating plasma extracellular vesicle microRNAs as possible biomarkers for osteoarthritis. Osteoarthritis Cartilage Open 2020, 1, 100018 10.1016/j.ocarto.2019.100018. [DOI] [PMC free article] [PubMed] [Google Scholar]
- Cuadra V. M. B.; Gonzalez-Huerta N. C.; Romero-Cordoba S.; Hidalgo-Miranda A.; Miranda-Duarte A. Altered expression of circulating microRNA in plasma of patients with primary osteoarthritis and in silico analysis of their pathways. PLoS One 2014, 9, e97690 10.1371/journal.pone.0097690. [DOI] [PMC free article] [PubMed] [Google Scholar]
- Keefe A. D.; Pai S.; Ellington A. Aptamers as therapeutics. Nat. Rev. Drug Discovery 2010, 9, 537–550. 10.1038/nrd3141. [DOI] [PMC free article] [PubMed] [Google Scholar]
- Ning Y.; Hu J.; Lu F. Aptamers used for biosensors and targeted therapy. Biomed. Pharmacother. 2020, 132, 110902 10.1016/j.biopha.2020.110902. [DOI] [PMC free article] [PubMed] [Google Scholar]
- Hanif A.; Farooq R.; Rehman M. U.; Khan R.; Majid S.; Ganaie M. A. Aptamer based nanobiosensors: Promising healthcare devices. Saudi Pharm. J. 2019, 27, 312–319. 10.1016/j.jsps.2018.11.013. [DOI] [PMC free article] [PubMed] [Google Scholar]
- Zahra Q. A.; Luo Z.; Ali R.; Khan M. I.; Li F.; Qiu B. Advances in Gold Nanoparticles-Based Colorimetric Aptasensors for the Detection of Antibiotics: An Overview of the Past Decade. Nanomaterials 2021, 11, 840. 10.3390/nano11040840. [DOI] [PMC free article] [PubMed] [Google Scholar]
- Kimling J.; Maier M.; Okenve B.; Kotaidis V.; Ballot H.; Plech A. Turkevich method for gold nanoparticle synthesis revisited. J. Phys. Chem. B 2006, 110, 15700–15707. 10.1021/jp061667w. [DOI] [PubMed] [Google Scholar]
- Zhang X.; Servos M. R.; Liu J. Surface science of DNA adsorption onto citrate-capped gold nanoparticles. Langmuir 2012, 28, 3896–3902. 10.1021/la205036p. [DOI] [PubMed] [Google Scholar]
- Yao H.; Changqing Y.; Tzang C.; Zhu J.; Yang M. DNA-directed self-assembly of gold nanoparticles into binary and ternary nanostructures. Nanotechnology 2007, 18, 015102. 10.1088/0957-4484/18/1/015102. [DOI] [Google Scholar]
- Vahed S. Z.; Barzegari A.; Rahbar Saadat Y.; Mohammadi S.; Samadi N. A microRNA isolation method from clinical samples. BioImpacts 2016, 6, 25–31. 10.15171/bi.2016.04. [DOI] [PMC free article] [PubMed] [Google Scholar]
- Iarossi M.; Schiattarella C.; Rea I.; De Stefano L.; Fittipaldi R.; Vecchione A.; Velotta R.; Ventura B. D. Colorimetric Immunosensor by Aggregation of Photochemically Functionalized Gold Nanoparticles. ACS Omega 2018, 3, 3805–3812. 10.1021/acsomega.8b00265. [DOI] [PMC free article] [PubMed] [Google Scholar]


