

Abstract

Titania–silica nanocomposites (TiO2–SiO2) show outstanding performance and is very well applied in photocatalysis. In this research, SiO2 extracted from Bengkulu beach sand will be used as a supporting material of the TiO2 photocatalyst for application to polyester fabrics. TiO2–SiO2 nanocomposite photocatalysts were synthesized using the sonochemical method. The coating of the TiO2–SiO2 material on polyester was carried out using the sol–gel-assisted sonochemistry method. The method of determining self-cleaning activity uses a digital image-based colorimetric (DIC) method, which is much simpler than using an analytical instrument. The scanning electron microscopy–energy dispersive X-ray spectroscopy results showed that the sample particles adhered to the fabric surface and the best particle distribution was shown in pure SiO2 and 1:0.5 TiO2–SiO2 nanocomposites. Analysis of Fourier-transform infrared (FTIR) spectroscopy proved the presence of Ti–O and Si–O bonds as well as the typical spectrum of polyester, which indicated that the fabric had been successfully coated with nanocomposite particles. The analysis of the contact angle of the liquid on the polyester surface showed a significant change in the properties of the TiO2 and SiO2 pure coated fabrics, but changes occur only slightly in the other samples. Self-cleaning activity against the degradation of methylene blue dye has been successfully carried out using DIC measurement. The test results showed that the best self-cleaning activity was shown by TiO2–SiO2 nanocomposite with a ratio of 1:0.5 with the degradation ratio reaching 96.8%. Furthermore, the self-cleaning property remains after the washing process, which shows excellent washing resistance.
Introduction
Recently, the application of nanoparticles to textiles is becoming an extensive research topic worldwide.1 Textiles are flexible materials made from interlocking bundles of yarn or yarn, produced by spinning raw fibers.2 One type of textile that is widely used is polyester fabric. This fabric is a type of synthetic fabric that is strong, durable, and does not wrinkle. Polyester fabrics are often used in the manufacture of sportswear, underwear, bed linen, and medical clothing.3 This type of clothing needs to have sufficient quality of resistance to dirt. Commercially, soiling substances on clothes need to be removed by using detergents. However, excessive use of detergents can cause various problems, such as generating wastes that pollute the aquatic environment,4 cause poisoning in aquatic organisms,5 cause disease,1 and produce water insufficient for consumption.6 One of the efforts that can be done to minimize the use of detergents is to bring up self-cleaning properties on the surface of textile fabrics.
Self-cleaning in the fabric is one of the characteristics that attracts the attention of the textile industry.7 This property maintains the clean condition of the fabric resulting to protect the body from dirt and reducing the amount of use of chemical disinfectants.8 Modification of textile surfaces by coating or coating using certain materials is a simple and effective way that can be done to bring out these properties. However, the fabric coating process needs to meet several requirements for the functionalization of textiles including technological efficiency, high stability against washing, inexpensive cost, and the utilization of nontoxic materials.9 Several methods of coating self-cleaning materials on fabrics have been carried out such as sol–gel, sputtering, electrochemical, and spraying.10 Among these technologies, the sol–gel-assisted sonochemistry-based coating method is known to meet the requirement for the functionalization of all kinds of textiles.11 Ultrasonic radiation in the liquid causes the process of acoustic cavitation, namely, the formation, growth, and collapse of bubbles implosively.12 Under these conditions, chemical reactions occur and new products are created very quickly and efficiently. Thus, the process becomes faster and can produce the expected product.
One of the appropriate materials that enable self-cleaning properties on fabrics is the metal oxide photocatalyst material.13 Photocatalytic activity allows the material to interact with the environment and produce the reactive oxygen species (ROS).14 These species are able to decompose organic pollutant compounds into simple inorganic compounds that are finally removed from the living environment by the effects of heat, wind, or rain.8 So far, metal oxide materials have been proven to exhibit such properties on textile surfaces, including water repellence, antibacterial activity, UV protection, and self-cleaning.15 One of the most widely used materials for self-cleaning applications is TiO2. This material is a semiconductor material that is widely applied as a photocatalyst.16 This is because TiO2 has many advantages such as high photocatalytic activity, sufficient chemical stability, high oxidizing power, low toxicity, and abundance on the earth.17,18
Various studies testing self-cleaning have been reported. Methylene blue (MB) dye is often used as an example of chemicals that needs to be removed for environmental protection. These dyes have the characteristics of poor biodegradability so they are suitable for self-cleaning testing. A digital image-based colorimetry (DIC) method has been utilized in this study for easier and simpler measurement of substance concentration. This method can determine the sample concentration by referring to the dynamic range of the digital image represented by the red–green–blue or RGB color space (that is, from 0 to 255). This color space is much wider than conventional colorimetric or spectrophotometric methods (that is, from an absorbance of 0 to 2.0), thus increasing the sensitivity of detection.19 The value of the sample concentration is obtained by following the equation, resulting from the standard curve. This method is a promising alternative new technique with various advantages. Firdaus et al. demonstrated several advantages of this method, such as the analytical procedure, which is environmentally friendly, inexpensive, portable, and simple to analyze various chemical compounds.20 This method is carried out with the help of the ImageJ application to measure the red–green–blue (RGB) color which is able to increase the detection sensitivity.21,22
Research studies conducted by Li et al.11 and Ojstršek and Fakin23 has coated TiO2 nanoparticles with SiO2 synthesized from TEOS precursors on polyester/cotton fabrics with repeated washings, resulting in good washing durability and photostability. The decolorization process of MB dye in the presence of a photocatalyst was monitored under UV illumination using synthetic TiO2 and TiO2/SiO2 which showed selective adsorption and good photocatalytic activity.24 The use of a natural SiO2 supporting material for the TiO2 photocatalyst has produced excellent results in the remediation of Cr(VI) and Pb(II) metals.25 Research related to the photocatalytic activity and photo-induced superhydrophilicity of TiO2–SiO2 nanocomposites as well as their characterization on the molecular level has been reported.26−28 In our previous work, the TiO2 photocatalyst has been successfully combined with natural SiO2 supporting material from beach sand and has produced better photocatalytic performance than TiO2 alone.29 Based on this context, this study focuses on the sustainable use of titania–natural silica nanocomposite (TiO2–SiO2) as a functional material for coating polyester fabrics using the sol–gel assisted sonochemistry method in its application as a self-cleaning cloth. The self-cleaning activity test of MB dye on the fabric was analyzed using a simpler renewable calorimetry analysis, namely, the image-based colorimetry method.
Experimental Section
Materials
The main material used in this study consisted of 100% white microfiber polyester fabric with a density of 30 threads/cm and a fabric weight of 108 g/m2 supplied by TJ textile Co., Ltd. Titanium–silica nanocomposites (TiO2–SiO2) were synthesized. Other supporting materials in this study consist of distilled water (Merck), aquabides (Merck), hydrochloric acid (HCl, 37%, Merck), nonionic detergent (Tween 80), absolute ethanol (C2H5OH, 100%, Merck), extract silica from beach sand (from Bengkulu, Indonesia), methylene blue (Merck), and titanium dioxide (TiO2, P25 Degussa, Merck). All materials used are pro analysts.
Polyester Fabric Coating
The nanocomposite synthesis method is the sol–gel assisted sonochemistry method that has been reported in our previous study.29 In addition, the selection of variations, composition, and sample precursors are also different from reference studies. The coating method on the fabric using the sol–gel assisted sonochemistry method refers to the research method of Li et al.11 modified. Polyester fabric is washed with a nonionic detergent at 50 and rinsed using aquabides. The cloth was immersed in the ethanol–water solvent with a volume ratio of 3:4. Then, the HCl catalyst was added (Table 1) and sonicated. Sample variations were added slowly and resonicated. Fabric was dried at 65 °C for 2 h, then 80 °C for 5 min, and 120 °C for 3 min. The procedure is repeated three times and then heated for 2 h at 100. The variation of samples is shown in Table 1.
Table 1. Variation of Samples Coat Polyester Fabrica.
| sample | filler | sample code | mass (mg) | volume H2O (mL) | volume C2H5OH (mL) | volume HCl (mL) |
|---|---|---|---|---|---|---|
| polyester 30 × 30 cm2 | P | without treatment | ||||
| TiO2 | P-TiO2 | 42 | 58 | 0.5 | ||
| natural SiO2 | P-SiO2 | 42 | 58 | 0.5 | ||
| NC-TS-1:0.5 | P-TS1:0.5 | 100 | 42 | 58 | 0.5 | |
| NC-TS-1:1 | P-TS1:1 | 100 | 42 | 58 | 0.5 | |
| NC-TS-1:2 | P-TS1:2 | 100 | 42 | 58 | 0.5 | |
NC-TS = TiO2-SiO2 nanocomposite. P-TS = Polyester coated TiO2-SiO2 nanocomposite.
Polyester Fabric Characterization
Characterization analysis on polyester fabric was carried out by the optical angle test, SEM, and FTIR analysis. Analysis of the optical angle test was carried out with (Specification) functioned to determine the contact angle on the fabric. The resulting data will be used to determine the surface properties of the material. The distilled water is dripped at a distance of 1 cm from the surface of the cloth. Next, the contact angle on the fabric was determined. Scanning electron microscopy (SEM, Hitachi SU-3500, Tokyo, Japan) analysis with a voltage of 3.00 kV at a magnification of 2000× was performed to determine the surface morphology of the fabric. The photocatalysts were further characterized using Fourier-transform infrared spectroscopy (FTIR, PerkinElmer Spectrum 100, Massachusetts, USA) to determine the functional groups in the composites. In determining this performance, a solution of methylene blue dye is needed, which is prepared with various concentrations of 30 and 300 ppm. The dye was then dripped one drop of methylene blue solution each vertically using a 1 cm burette on a cloth on a flat surface and allowed to stand for 3 min. The cloth was then irradiated with a mercury lamp (HPL-N 125 W Philips) at a distance of 10 cm and a sample image was taken every 60 min for 6 h using a smartphone camera. Furthermore, the percentage decrease in the dye concentration was calculated using a calorimetry-based digital image method. The camera Redmi Note 10 (Xiaomi Inc.), with the characteristics of Table 2, was used to record images for viewing color-based digital images. ImageJ 1.52a (NIH image), Excel 2019 (Microsoft Inc.), and Minitab 19 (Minitab Inc.) were used for digital image data processing.
Table 2. Characteristics of Digital Cameras.
| digital camera | Redmi Note 10, Xiaomi Inc. |
| camera maximum resolution | 48 megapixels |
| sensor size | 6.4 × 4.8 mm |
| pixel size | 0.8 μm |
| conditions to take pictures | |
| exposure mode | AI portrait mode with blur and depth control, f/1.79 |
| focal length | 26 mm |
| metering mode | spot metering |
| image format | JPEG, 2604 × 4624 pixels |
| color representation | sRGB (standard RGB) |
| software for image computation | |
| RGB color measurement | ImageJ 1.52a |
| image data processing | Excel 2019, Minitab 19 |
Digital Image Capture Method
The method of determining the concentration of the dye on standard solution fabrics and samples placed under constant ambient light and photographic conditions (Figure 1). Details of camera settings are shown in Table 2. Colors are obtained from the surrounding representative circle region 1000 pixels located in each sample. Average RGB values were measured with the ImageJ 1.52a (NIH Image) image processing toolbox (Figure 2).
Figure 1.
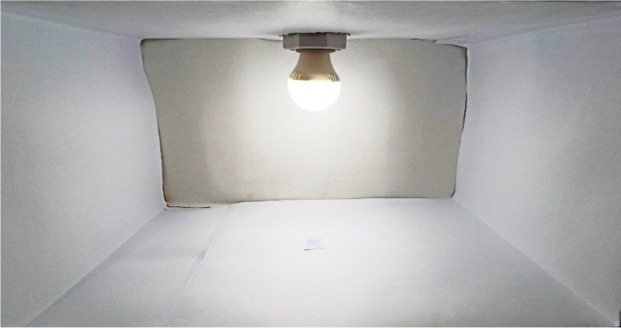
Shooting studio for the image to be captured RGB values.
Figure 2.

Sample operation using ImageJ 1.52a application.
Digital image retrieval and ImageJ sample processing were carried out in three replicates. Further analysis of the RGB data was performed by Excel 2019 (Microsoft Inc.) and Minitab 19 software (Minitab Inc.) for simple linear regression and partial least squares, respectively. RGB color values are converted to a logarithmic scale to obtain color intensity, following the Lambert–Beer law equation.30
Quantification of Digital Images
The average color values of R, G, and B were analyzed using ImageJ 1.52a software. A specific image area is selected. The RGB color value is selected in a certain area consisting of several important pixels to get accurate results. To obtain a linear line for further simple uses, such as a standard calibration curve, the initial RGB color value is converted to the intensity obtained using Lambert–Beer’s law as follows (1):
| 1 |
I(R,G,B)is the effective intensity of the respective color, A0(R,G,B) and As(R,G,B) are the red, green, and blue color values of the blank and sample, respectively. The digital camera functions as a spectrophotometer that analyzes light from methylene blue. The intensity shown is the sum of the R, G, and B color values of the digital image.19,20
Washing Resistance Test
The endurance test method refers to the research method of Petkova et al.42 The cloth is soaked in distilled water. The cloth was shaken at 30 rpm for 15 min and dried.
Results and Discussion
Scanning Electron Microscopy Analysis
The material characteristics of TiO2–natural SiO2 nanoparticles have been described in our previous study.29 SEM analysis at 2000× magnification showed particle dispersion and sample agglomeration on the polyester fabric surface. Figure 3a shows the smooth surface of the polyester fabric before coating with the sample. Meanwhile, the sample particles coated on the surface of the fabric form a rough surface which can be seen clearly in Figure 3b–f.
Figure 3.

SEM data of polyester fabric of sample (a) polyester (P); (b) P-TiO2; (c) P-SiO2; (d) P-TS1:0.5; (e) P-TS1:1; (f) P-TS1:2.
Sonochemical TiO2 tends to aggregate and does not coat well (Figure 3b).32 The particle size of TiO2 on the fabric surface was significantly larger (mode range: 60–70 nm; Figures 3b and 4a) than that of the natural SiO2 sample (mode range: 30–35 nm; Figure 3b). The reason is that only the SiO2 extraction process from sand goes through a top–down method based on the literature procedure.29 The porous structure of SiO2 suited well for the dispersion on the fabric surface especially when the ratio of TiO2 was greater compared to SiO2 (Figure 3d–f), probably because relatively smaller TiO2 nanoparticles were well filled in the pores of SiO2 during the sol–gel synthesis of TiO2–SiO2 composites.
Figure 4.

Result of the distribution size of particles in the polyester surface with (a) TiO2, (b) natural SiO2, (c) TiO2–SiO2 1:0.5, (d) TiO2–SiO2 1:1, (e) TiO2–SiO2 1:2.
In clear contrast, Figure 3d shows good particle distribution with minimal agglomeration. Meanwhile, P-TS1:1 still showed some agglomerated particles and uneven coating (Figure 3e). P-TS1:2 shows agglomeration that dominates with a fairly even coating (Figure 3f). Luthfiah et al. showed the differences in the particle size of each sample in the powder form.29Figure 4c–e shows the increase in the particle size along with the addition of natural SiO2 to the composite. This proves that the samples coated tend to agglomerate at a larger powder particle size. Sonochemical TiO2–natural SiO2’s is relatively homogeneous size distribution and nicely coat on polyester. Furthermore, TiO2 shows hydrophilic properties; thus, the coating at the ratio TiO2–SiO2 of 1:0.5 was the best. Sonochemistry involves administering ultrasonic waves which produce an acoustic cavitation process. This method is capable of producing smaller particle sizes and more regular crystal shapes.33
FTIR Analysis
FTIR analysis was carried out to identify the functional groups of the polyester fabric before and after the coating process from TiO2–SiO2 with a molar ratio of 1:0.5; 1:1; and 1:2 in the wave number range of 500–3500 cm–1.31
Figure 5a shows the types of bonds in polyester fabrics in the form of C=O, C=C aromatic, and C=C bonds which are thought to indicate the presence of ester, alcohol, anhydride, aromatic ring, and heterocyclic aromatic ring functional groups. Figure 5b shows absorption at a wave number of 856 cm–1 which proves the existence of Ti–O bonds. While on the sample, P-SiO2 (Figure 5c) shows a peak at the wavenumber 798 cm–1, which proves the existence of Si–O bonds. In the sample of cloth coated with the TiO2–SiO2 nanocomposite (Figure 5d–f), there is a signal spectrum of Si–O and Ti–O which proves that the sample contains these two functional groups. Table 3 shows the wavenumbers of the types of bonds present in the sample. It was found that the sample was successfully coated on the surface of the polyester fabric based on the Ti–O and/or Si–O stretching vibration peaks.34
Figure 5.

FTIR spectrum of sample (a) P; (b) P-TiO2; (c) P-SiO2; (d) P-TS1:0.5; (e) P-TS1:1; (f) P-TS1:2.
Table 3. Wavenumber of the Sample.
| type of bond | wavenumber (cm–1) | |||||
|---|---|---|---|---|---|---|
| P | P-TiO2 | P-SiO2 | P-TS1:0.5 | P-TS1:1 | P-TS1:2 | |
| Csp2–H | 3063 | 3069 | 3070 | 3063 | 3056 | 3063 |
| Csp3–H | 2968 | 2981 | 2975 | 2961 | 2968 | 2964 |
| C=O | 1731 | 1712 | 1717 | 1717 | 1724 | 1709 |
| C=C aromatic | 1454 | 1408 | 1420 | 1400 | 1406 | 1394 |
| C=C stretching | 703 | 715 | 710 | 717 | 723 | 696 |
| Ti–O | 856 | 865 | 858 | 876 | ||
| Si–O–H | 798 | 823 | ||||
| Si–O | 527 | 541 | 580 | 547 | ||
Fabric Surface Contact Angle
In this study, the water contact angle of the coated sample was measured (Figure 6). The results show that the polyester fabric has hydrophobic properties. This property needs to be maintained in self-cleaning applications because water can be a medium for impurities to absorb into the fabric. The addition of silica to the titania photocatalyst managed to maintain the hydrophilicity of the fabric and tended to increase. Meanwhile, the application of pure TiO2 and SiO2 to the fabric makes the fabric superhydrophilic (Figure 6b,c). It was observed that the water contact angle decreased drastically to zero after applying pure TiO2 and SiO2 to the polyester fabric samples, resulting in fast water absorption. Basically, the surface energy of solids in general and of fabrics in particular is highly dependent on the surface area and the intermolecular forces present on the surface.35 The content of hydroxyl groups in pure samples can be produced higher. This causes charge imbalance that provides Lewis acid sites, thereby absorbing more hydroxyl groups on the surface of the photocatalyst.36 Several studies have also revealed that nano-SiO2 is extremely hydrophilic due to the presence of a large number of hydroxyl groups on its surface. The higher density of silanol tends to make the surface hydrophilic.37
Figure 6.

Contact angle of sample (a) P; (b) P-TiO2; (c) P-SiO2; (d) P-TS1:0:5; (e) P-TS1:1; (f) P-TS1:2.
In addition, the wettability behavior can be greatly influenced by the formulation of the sample that is coated on the fabric.38 This trend can be attributed to the increasing number of Ti–O–Si physical bonds at the TiO2–SiO2 granular interface (Figure 6d–f). This is in line with the research of Houmard and Riassetto36 which explains that interactions at the granular TiO2–SiO2 interface can cause certain wettability behaviors.39 In addition, according to De Gennes et al.,38 morphological properties, such as surface roughness or exposed porosity, affect the measurement of the water contact angle by increasing the wettability of the water. Then, the variety of composites synthesized showed that an appropriate amount of TiO2 was able to fill the pores in SiO2 so that it was able to provide hydrophobic properties to the fabric layered material.40
Self-Cleaning Activity Tests
Standard Curve
The accuracy of the proposed method was evaluated by replicating the image capture analysis and RGB calculations of the same sample. In addition, three tests were also carried out to determine the accuracy of the measurement of methylene blue degradation. The relative standard deviation (RSD) was evaluated as 3.6 × 10⁻³, 2.1 × 10⁻³, and 1.4 × 10⁻³ for R, G, and B, respectively. These results indicate a good reproducibility of the proposed method.
The slope of the calibration curve is 1.46 × 10⁻⁴, 2.11 × 10⁻⁴, and 2.23 × 10⁻⁴ for R, G, and B, respectively (Figure 7). This shows that blue has the highest sensitivity compared to red and green. This is because the transmitted color in methylene blue is dominated by blue, which causes a larger and more sensitive gradient slope.
Figure 7.

Standard curve of the variation of methylene blue concentration against RGB calculated using univariate simple linear regression.
The three colors of the resulting standard have good linearity. Therefore, calculations were carried out to determine the effect of three variables R, G, and B on the concentration of methylene blue. Simple linear regression provided the easiest calculation. On the other hand, the partial least squares (PLS regression) calculated using Minitab 19 software (Minitab Inc.) was a better calculation method by treating RGB data as multivariate, resulting in a new linear regression shown in eq 2. The resulting equation has linearity which is good with a correlation coefficient of 0.9974. The measurement of significance was also carried out using this application by looking at the p-value for each variable (Table 4). This equation was then applied to a sample of methylene blue that was degraded from the photocatalyst material that had been coated to polyester.
| 2 |
Table 4. Average RGB Color Values of MB.
| conc. MB (ppm) | color value | color intensity | ||||
|---|---|---|---|---|---|---|
| R | G | B | R | G | B | |
| 0 | 106.30 | 116.36 | 148.21 | 0 | 0 | 0 |
| 50 | 104.04 | 114.83 | 140.44 | 0.009 | 0.005 | 0.023 |
| 100 | 102.57 | 110.31 | 136.69 | 0.015 | 0.023 | 0.035 |
| 150 | 101.92 | 108.16 | 131.01 | 0.018 | 0.032 | 0.053 |
| 200 | 99.41 | 106.74 | 129.24 | 0.029 | 0.037 | 0.059 |
| 250 | 98.49 | 102.61 | 128.40 | 0.030 | 0.054 | 0.062 |
| 300 | 95.69 | 102.49 | 123.23 | 0.045 | 0.055 | 0.080 |
| 350 | 94.19 | 97.46 | 123.02 | 0.052 | 0.077 | 0.081 |
RGB color value (A(R,G,B)) is obtained from ImageJ software analysis. The color value is used to determine the color intensity (I(R,G,B)) with eq 3.
| 3 |
I(R,G,B) are the effective intensity of the respective colors, A0(R,G,B) and As(R,G,B) are the red, green, and blue color values of the blank and samples, respectively.
Validate Method
The DIC method was validated by comparison with the UV/vis spectrophotometric method. Using a UV–vis spectrophotometer, methylene blue showed a maximum peak at the wavelength of 665 nm (Figure 8a). The peak intensity change as a function of the concentration of MB was obtained (Figure 8b). The results of the accuracy test are shown in Table 5. The ratio was calculated using eq 4.
| 4 |
where CDIC is the concentration of methylene blue calculated using a digital image and CSpectro is the concentration of methylene blue calculated from a UV–Vis spectrophotometer. The percentage ratio shows the accuracy of the concentration analysis results using the DIC method with the commonly used method, namely, UV/Vis spectrophotometry. From the proposed digital image-based colorimetric method, the univariate results gave 108.40%. Then, multivariate results gave 97.17%. These results were close to 100% and showed the closeness of the sample concentration values using the DIC method compared to UV/vis spectrophotometry. Therefore, this method has satisfactory accuracy and precision.
Figure 8.

(a) Determination of the maximum wavelength of methylene blue (the samples for this study were diluted 100 times using mess flask and mess pipette for UV–visible measurements), (b) calibration curve of the external standard method.
Table 5. Comparison of the Concentration Evaluation MB Based on DIC and the Spectroscopy Method (n = 3).
| concentration (ppm) | univariate = blue | multivariate | UV–vis spec. (ppm) | ||
|---|---|---|---|---|---|
| DIC (ppm) | ratio (%) | DIC (ppm) | ratio (%) | ||
| 300 | 317.31 ± 3.07 | 109.49 | 301.31 ± 4.87 | 96.20 | 289.79 |
Methylene Blue Dye Degradation
The photodegradation test using samples against methylene blue solution was carried out using the DIC method. The activity time course trend using samples with different MB concentrations gave similar decomposition rate constant. This shows that self-cleaning was effective even though there were a difference in the concentration of the substance tested for the color. The C/C0 value of the MB dye solution was plotted against time to observe the degradation rate of MB, where C is the concentration of the target dye solution at the irradiation interval and C0 is the initial concentration of the dye. All samples including negative control in the form of untreated polyester fabric still experienced a decrease in the concentration of MB. This is due to the effect of dye adsorption on the polyester fabric which decreased the MB concentration.41 Self-cleaning properties of MB stains were tested with two concentration variations before and after being irradiated with a UV lamp for 6 h, as shown in Figures 9 and 10.
Figure 9.

Decrease in the concentration of methylene blue with variations in concentrations of (a) 30 ppm and (b) 300 ppm.
Figure 10.

Methylene blue stain on polyester fabric before and after irradiation for 6 h (a) P; (b) P-TiO2; (c) P-SiO2; (d) P-TS1:0:5; (e) P-TS1:1; and (f) P-TS1:2.
MB is relatively stable under UV lamp irradiation when only a noncomposite substance is used to coat the polyester fabric. The time course change using the untreated polyester (Figure 6a,b, black lines) was due to adsorption, and further deviation using the TiO2–SiO2-treated polyester was due to photocatalysis. However, when MB was adsorbed on the nanocomposite-coated polyester fabric, MB decreased in concentration at different rates depending on the variation of the molar ratio used. It can be noted from the degradation curve that the P-TS1:1 sample decreased the MB degradation rate. The reason for the lower degradation rate of MB can be attributed to the agglomeration at the active site of the sample, as evidenced from the previous SEM analysis shown in Figure 3e. The results showed that the sample P-TS1:0.5 gave the best results in the degradation of methylene blue. This result is supported by an even distribution of particles and minimal agglomeration in the SEM data and the ability of the sample to maintain hydrophobic properties to optimize the self-cleaning activity of the fabric. The decrease in stain concentration every hour for 6 h is shown in Table 1S.
Washing Test Results on Fabric
As shown in Figure 11, it is known that after the washing test in water at room temperature for 15 min, polyester fabric that has been coated with the TiO2–SiO2 composite (1:0.5) still has good degradation activity, which is around 72 and 82% for MB concentrations of 30 and 300 ppm, respectively. Meanwhile, in pure TiO2, there was a significant decrease which means that the bond between TiO2 and polyester fabric was not formed strongly. On the other hand, SiO2 showed a slight decrease in activity which means that the presence of SiO2 plays an important role in strengthening the bond between the composite and the polyester fabric.42 However, the effect of the amount of SiO2 on the composite in the resistance to washing is different depending on the composition. The TS1:1 composite has the most minor decrease in activity after washing compared to other compositions, showing a synergistic effect of TiO2 and SiO2 in bonding with the polyester fabric.43,44 When the amount of SiO2 or TiO2 is an imbalance in the composite, this synergistic effect tends to decrease evidenced by the decrease in activity after washing. According to previous reports, hydrophilic SiO2 and TiO2 nanoparticles have many OH– groups which cause the nanoparticles to aggregate.45 Thus, the appropriate ratio of nanoparticles will cause hydrophilic nanoparticles to form microstructural aggregations, which can create strong bonds with polyester fabrics which make it resistant to washing. In addition, the effect of the amount of SiO2 on the composite in resistance to washing is different depending on the composition. The TS1:0.5 composite which has a small amount of SiO2 provides the best resistance compared to TS1:2 composite which has more SiO2 than TiO2. The reason is because of the high hydrophobicity of the TS1:0.5 composite, making it resistant to washing.
Figure 11.

Graph of decreasing degradation activity of methylene blue with concentration before and after the washing test to the fabric (a) 30 ppm and (b) 300 ppm.
Conclusions
The addition of natural silica to the titania photocatalyst increases the distribution of particles evenly on the surface of the fabric in the process of coating or coating polyester fabrics with the sol–gel-assisted sonochemistry method. However, the addition of SiO2 with a ratio equal to or greater than the TiO2 photocatalyst increased the occurrence of agglomeration on the surface, as seen from the SEM image. These results affect the surface properties and the self-cleaning activity of the fabric. The success in the coating process is evidenced by the presence of titania and silica bonds on the surface of the fabric based on the results of FTIR data analysis. Nanocomposite coatings on fabrics are able to maintain the hydrophobic properties of polyester fabrics needed to support self-cleaning activities. Tests in the degradation of dye stuffs gave significant results reaching 96.8% and the test results after washing were quite good (not changed significantly).
Acknowledgments
Authors are grateful for the facilities from Universitas Padjadjaran, Indonesia, by Academic Leadership Grant (ALG), Prof. Iman Rahayu (ID: 2203/UN6.3.1/PT.00/2022), Indonesian Ministry of Research by Penelitian Dasar Unggulan Perguruan Tinggi (PDUPT ID: 2064/UN6.3.1/PT.00/2022), and World Class Professor (WCP) 2022 grant.
Glossary
Abbreviations
- DIC
Digital Image-based Colorimetry
Supporting Information Available
The Supporting Information is available free of charge at https://pubs.acs.org/doi/10.1021/acsomega.2c07606.
Fabric on the color stain self-cleaning testing process (PDF)
Author Contributions
Conceptualization, D.R.E. and M.L.F.; methodology, A.L.; software, A.L.; validation, D.R.E., M.L.F. and Y.I.; formal analysis, A.L.; investigation, A.L.; resources, A.L.; data curation, A.L.; writing original draft preparation, A.L.; writing, review, and editing, A.L., Y.D., D.R.E., M.L.F., M.D.P., and Y.I.; visualization, M.D.P.; supervision, D.R.E., Y.D., M.L.F., and Y.I.; project administration, D.R.E. and Y.I.; funding acquisition, D.R.E., I.R., and Y.I. All authors have read and agreed to the published version of the manuscript.
This research was funded by Academic Leadership Grant (ALG) Prof. Iman Rahayu, Universitas Padjadjaran, grant number ID: 2203/UN6.3.1/PT.00/2022.
The authors declare no competing financial interest.
Supplementary Material
References
- Sugiyana D.; Septiani W.; Mulyawan A. S.; Wahyudi T. Sintesis Nanopartikel ZnO dan Immobilisasinya Pada Kain Kapas Sebagai Absorber Ultraviolet. Arena Tekst. 2018, 32, 59–66. 10.31266/at.v32i2.3539. [DOI] [Google Scholar]
- Rohaeti E.; Rakhmawati A. The Hydrophobicity and the Antibacterial Activity of Polyester Modified With Silver Nanoparticle and Hexadecyltrimethoxysilane. Molekul 2017, 12, 78. 10.20884/1.jm.2017.12.1.295. [DOI] [Google Scholar]
- Hassan M.; Qashqary K.; Hassan H. A.; Shady E.; Alansary M. Influence of Sportware Fabrics Properties on the Health and Performance of Athlete. Fibers Text. East. Eur. 2012, 3, 82–88. 10.1016/j.jgo.2012.09.125. [DOI] [Google Scholar]
- Dampak Negatif Deterjen, Bisa Sebabkan Banyak Masalah Kesehatan Hingga Mencemarkan Lingkungan. Gridhealth [Online], Posted August 16, 2019. https://health.grid.id/read/351819963/dampak-negatif-deterjen-bisa-sebabkan-banyak-masalah-kesehatan-hingga-mencemarkan-lingkungan?page=all (accessed Nov 7, 2021)
- Effendy. Logam, Aloi, Semikonduktor, dan Superkonduktor; Bayumedia Publishing: Malang, 2010. [Google Scholar]
- Sugiyana D.; Notodarmojo S. Studi Mekanisme Degradasi Fotokatalitik Zat Warna Azo Menggunakan Katalis Mikropartikel TiO2. Arena Tekst. 2015, 30, 83–94. [Google Scholar]
- Gao J.; Li W.; Zhao X.; Wang L.; Pan N. Durable visible light self-cleaning surfaces imparted by TiO2/SiO2/GO photocatalyst. Text. Res. J. 2019, 89, 517–527. 10.1177/0040517517750647. [DOI] [Google Scholar]
- John H.; Banerjee S.; Dionysiou D. D.; Pillai S. C. Self-cleaning Photocatalytic Activity: Materials and Applications Applied Catalysis B: Environmental Self-cleaning applications of TiO2 by photo-induced hydrophilicity and photocatalysis. Appl. Catal., B 2016, 176–177, 396–428. 10.1016/j.apcatb.2015.03.058. [DOI] [Google Scholar]
- Perelshtein I., Perkas N.; Gedanken A.; Gan R.. Handbook of Antimicrobial Coatings: The Sonochemical Coating of Textiles With Antibacterial Nanoparticles; Elsevier Inc: Amsterdam, 2018. [Google Scholar]
- Ahmad I.; Kan C. W.; Yao Z. Photoactive cotton fabric for UV protection and self-cleaning. RSC Adv. 2019, 9, 18106–18114. 10.1039/C9RA02023C. [DOI] [PMC free article] [PubMed] [Google Scholar]
- Li W. D.; Gao J.; Wang L. Enhancement of durable photocatalytic properties of cotton/polyester fabrics using TiO2/SiO2 via one step sonosynthesis. J. Ind. Text. 2017, 46, 1633–1655. 10.1177/1528083716629138. [DOI] [Google Scholar]
- Doktycz S. J.; Suslick K. S. Interparticles collisions driving by ultrasound. Science 1990, 247, 1067–1069. 10.1126/science.2309118. [DOI] [PubMed] [Google Scholar]
- Ahmad I.; Kan C. W. Visible-light-driven, dye-sensitized TiO2 photo-catalyst for self-cleaning cotton fabrics. Coatings 2017, 7, 192. 10.3390/coatings7110192. [DOI] [Google Scholar]
- Chen Y.; Tang X.; Gao X.; Zhang B.; Luo Y.; Yao X. Antimicrobial property and photocatalytic antibacterial mechanism of the TiO2-doped SiO2 hybrid materials under ultraviolet-light irradiation and visible-light irradiation. Ceram. Int. 2109, 45, 15505–15513. 10.1016/j.ceramint.2019.05.054. [DOI] [Google Scholar]
- Veronovski N.; Rudolf A.; Smole M. S.; Kreže T.; Geršak J. Self-cleaning and handle properties of TiO2-modified textiles. Fibers Polym. 2009, 10, 551–556. 10.1007/s12221-009-0551-5. [DOI] [Google Scholar]
- Richards B. S. Photocatalytic degradation of organic dye via atomic layer deposited TiO2 on ceramic membranes in single-pass flow-through operation. J. Membr. Sci. 2020, 604, 118015 10.1016/j.memsci.2020.118015. [DOI] [Google Scholar]
- Leong S.; Razmjou A.; Wang K.; Hapgood K.; Zhang X.; Wang H. TiO2 based photocatalytic membranes: a review. J. Membr. Sci. 2014, 472, 167–184. 10.1016/j.memsci.2014.08.016. [DOI] [Google Scholar]
- Besançon M.; Michelin L.; Josien L.; Vidal L.; Assaker K.; Bonne M.; Lebeau B.; Blin J. L. Influence of the porous texture of SBA-15 mesoporous silica on the anatase formation in TiO2-SiO2 nanocomposites. New J. Chem. 2016, 40, 4386–4397. 10.1039/C5NJ02859K. [DOI] [Google Scholar]
- Chanla J.; Kanna M.; Jakmunee J.; Somnam S. Application of smartphone as a digital image colorimetric detector for batch and flow-based acid-base titration. Chiang Mai J. Sci. 2019, 46, 975–986. [Google Scholar]
- Firdaus M. L.; Angga A.; Nessi M.; Marti H.; Rina E.; Lena R.; Renat K. Smartphone coupled with a paper-based colorimetric device for sensitive and portable mercury ion sensing. Chemosensors 2019, 7, 25. 10.3390/chemosensors7020025. [DOI] [Google Scholar]
- Firdaus M. L.; Alwi W.; Trinoveldi F.; Rahayu I.; Rahmidar L.; Warsito K. Determination of Chromium and Iron Using Digital Image-based Colorimetry. Procedia Environ. Sci. 2014, 20, 298–304. 10.1016/j.proenv.2014.03.037. [DOI] [Google Scholar]
- Firdaus M. L.; Saputra E.; Ginting S. M.; Wyantuti S.; Eddy D. R.; Rahmidar L.; Yuliarto B. Smartphone-based digital image colorimetry for non-enzymatic detection of glucose using gold nanoparticles. Sens. Bio-Sensing Res. 2022, 35, 100472 10.1016/j.sbsr.2022.100472. [DOI] [Google Scholar]
- Ojstršek A.; Fakin D. Washing durability and photo-stability of Nano TiO2-SiO2 coatings exhausted onto cotton and cotton/polyester fabrics. Coatings 2019, 9, 545. 10.3390/coatings9090545. [DOI] [Google Scholar]
- Pakdel E.; Daoud W. A.; Seyedina S.; Wanga J.; Razala J. M.; Suna L.; Wanga X. Tunable photocatalytic selectivity of TiO2/SiO2 nanocomposites: Effect of silica and isolation approach. Colloids Surf., A 2018, 552, 130–141. 10.1016/j.colsurfa.2018.04.070. [DOI] [Google Scholar]
- Eddy D. R.; Ishmah S. N.; Permana M. D.; Firdaus M. L. Synthesis of Titanium Dioxide/Silicon Dioxide from Beach Sand as Photocatalyst for Cr and Pb Remediation. Catalysts 2020, 10, 1248. 10.3390/catal10111248. [DOI] [Google Scholar]
- Negishi N.; Fujino M.; Yamashita H.; Fox M. A.; Anpo M. Photophysical Properties and Photochemical Stability of Rhodamine B Encapsulated in SiO2 and Si-Ti Binary Oxide Matrices by the Sol-Gel Method. Langmuir 1994, 10, 1772. 10.1021/la00018a025. [DOI] [Google Scholar]
- Yamashita H.; Honda M.; Harada M.; Ichihashi Y.; Anpo M.; Hirao T.; Itoh N.; Wamoto N. Preparation of titanium oxide photocatalysts anchored on porous silica glass by a metal ion-implantation method and their photocatalytic reactivities for the degradation of 2-propanol diluted in water. J. Phys. Chem. B 1998, 102, 10707–10711. 10.1021/jp982835q. [DOI] [Google Scholar]
- Takeuchi M.; Dohshi S.; Eura T.; Anpo M. Preparation of Titanium-Silicon Binary Oxide Thin Film Photocatalysts by an Ionized Cluster Beam Deposition Method. Their Photocatalytic Activity and Photoinduced Super-Hydrophilicity. J. Phys. Chem. B 2003, 107, 14278–14282. 10.1021/jp0308514. [DOI] [Google Scholar]
- Luthfiah A.; Permana M.; Deawati Y.; Firdaus M. L.; Rahayu I.; Eddy D. R. Photocatalysis of nanocomposite titania–natural silica as antibacterial against Staphylococcus aureus and Pseudomonas aeruginosa. RSC Adv. 2021, 11, 38528–38536. 10.1039/D1RA07043F. [DOI] [PMC free article] [PubMed] [Google Scholar]
- Eddy D. R.; Puri F. N.; Noviyanti A. R. Synthesis and Photocatalytic Activity of Silica-based Sand Quartz as the Supporting TiO2 Photocatalyst. Procedia Chem. 2015, 17, 55–58. 10.1016/j.proche.2015.12.132. [DOI] [Google Scholar]
- Bhattacharya S. S.; Chaudhari S. S. B.; Bhattacharya S. S.; Chaudhari S. S. B. Study on Structural, Mechanical and Functional Properties of Polyester Silica Nanocomposite Fabric Nanocomposites View project Mechanical Crimp Texturising View project Study on Structural, Mechanical and Functional Properties of Polyester Silica Nanocomp. Int. J. Pure Appl. Sci. Technol. 2014, 21, 43–52. [Google Scholar]
- Kale K. H.; Desaia A. N. Atmospheric pressure plasma treatment of textiles using non-polymerising gases. Indian J. Fibre Text. Res. 2011, 3, 289–299. [Google Scholar]
- Seok S.; Hussain M. A.; Park K. J.; Kim J. W.; Kim D. H. Sonochemical synthesis of PdO@silica as a nanocatalyst for selective aerobic alcohol oxidation. Ultrason. Sonochem. 2016, 28, 178–184. 10.1016/j.ultsonch.2015.07.020. [DOI] [PubMed] [Google Scholar]
- Zhang F.; Wu X.; Chen Y.; Lin H. Application of silver nanoparticles to cotton fabric as an antibacterial textile finish. Fibers Polym. 2009, 10, 496–501. 10.1007/s12221-009-0496-8. [DOI] [Google Scholar]
- Pakdel E.; Daoud W. A.; Wang X. Self-cleaning and superhydrophilic wool by TiO2/SiO2 nanocomposite. Appl. Surf. Sci. 2013, 275, 397–402. 10.1016/j.apsusc.2012.10.141. [DOI] [Google Scholar]
- Houmard M.; Riassetto D.; Roussel F.; Bourgeois A.; Berthomé G.; Joud J. C.; Langlet M. Enhanced persistence of natural super-hydrophilicity in TiO2–SiO2 composite thin films deposited via a sol–gel route. Surf. Sci. 2008, 602, 3364–3374. 10.1016/j.susc.2008.09.016. [DOI] [Google Scholar]
- Xu B.; Zhang Q. Preparation and Properties of Hydrophobically Modified Nano-SiO2 with Hexadecyltrimethoxysilane. ACS Omega 2021, 6, 9764–9770. 10.1021/acsomega.1c00381. [DOI] [PMC free article] [PubMed] [Google Scholar]
- De Gennes Q. D.; Brochard-Wyart F.. Capillarity and Wetting Phenomena: Drops, Bubbles, Pearls, Waves; Springer: New York, 2004. [Google Scholar]
- Landi S.; Joaquim C.; Stanislav F.; António F. M.; Isabel N. C.; Marta F.; Pier P.; Olivia S.; Pereira S. G. P.; Manuel F. R. Photocatalytic degradation of Rhodamine B dye by cotton textile coated with SiO2-TiO2 and SiO2-TiO2-HY composites. J. Photochem. Photobiol., A 2017, 346, 60–69. 10.1016/j.jphotochem.2017.05.047. [DOI] [Google Scholar]
- Li W.; Gao J.; Wang L. Preparation of TiO2-coated polyester fiber filter by spray-coating and its photocatalytic degradation of gaseous formaldehyde. Aerosol Air Qual. Res. 2012, 12, 1327–1335. 10.7312/li--16274-013. [DOI] [Google Scholar]
- Firdaus M. L.; Madina F. E.; Yulia S.; Elvia R.; Ishmah S. N.; Eddy D. R. Silica extraction from beach sand for dyes removal: Isotherms, kinetics and thermodynamics. Rasayan J. Chem. 2020, 13, 249–254. 10.31788/RJC.2020.1315496. [DOI] [Google Scholar]
- Petkova P.; Francesko A.; Perelshtein I.; Gedanken A.; Tzanov T. Simultaneous sonochemical-enzymatic coating of medical textiles with antibacterial ZnO nanoparticles. Ultrason. Sonochem. 2016, 29, 244–250. 10.1016/j.ultsonch.2015.09.021. [DOI] [PubMed] [Google Scholar]
- Yuranova T.; Mosteo R.; Bandara J.; Laub D.; Kiwi J. Self-cleaning cotton textiles surfaces modified by photoactive SiO2/TiO2 coating. J. Mol. Catal. A: Chem. 2006, 244, 160–167. 10.1016/j.molcata.2005.08.059. [DOI] [Google Scholar]
- Guan K. Relationship between photocatalytic activity, hydrophilicity and self-cleaning effect of TiO2/SiO2 films. Surf. Coat. Technol. 2005, 191, 155–160. 10.1016/j.surfcoat.2004.02.022. [DOI] [Google Scholar]
- Gong X.; He S. Highly durable superhydrophobic polydimethylsiloxane/silica nanocomposite surfaces with good self-cleaning ability. ACS Omega 2020, 5, 4100–4108. 10.1021/acsomega.9b03775. [DOI] [PMC free article] [PubMed] [Google Scholar]
Associated Data
This section collects any data citations, data availability statements, or supplementary materials included in this article.