Abstract
Quantifying the full 3-D shape of the human crystalline lens is important for improving intraocular lens power or sizing calculations in treatments of cataract and presbyopia. In a previous work we described a novel method for the representation of the full shape of the ex vivo crystalline lens called eigenlenses, which proved more compact and accurate than compared state-of-the art methods of crystalline lens shape quantification. Here we demonstrate the use of eigenlenses to estimate the full shape of the crystalline lens in vivo from optical coherence tomography images, where only the information visible through the pupil is available. We compare the performance of eigenlenses with previous methods of full crystalline lens shape estimation, and demonstrate an improvement in repeatability, robustness and use of computational resources. We found that eigenlenses can be used to describe efficiently the crystalline lens full shape changes with accommodation and refractive error.
1. Introduction
The human crystalline lens is a sophisticated optical element in the eye with rather unique properties. In the young eye, the crystalline lens is able to change its shape dynamically to focus near and far objects onto the retina (accommodation) [1]. With aging, the crystalline lens loses its accommodation capacity (presbyopia) and transparency (cataract). Standard treatment for the correction of these conditions involve the replacement of the crystalline lens material by an artificial intraocular lens (IOLs) that is placed inside the capsular bag [2]. Accurate quantification of the shape of the crystalline lens is important to help selection of the IOL. For instance, selecting the power of standard and of emerging accommodating IOLs requires an accurate estimation of the IOL position after surgery which is related to lens shape [3–5]. Also, selecting the size of accommodating IOLs can be critical for its correct mechanism of action [5].
Magnetic Resonance Imaging (MRI) [6–9] and Ultrasound Biomicroscopy (UBM) [10] techniques have been demonstrated to image the full shape of the lens including the peripheral region behind the iris. However, typically the resolution of these techniques is low (approximately 100 µm in MRI and 40 µm in UBM versus <10 µm in Optical Coherence Tomography, OCT) and the MRI acquisition time is long (several minutes in MRI versus miliseconds in UBM and OCT). Furthermore, UBM requires contact with the eye, and MRI is costly and not available in a typical ophthalmology clinic setting. Optical imaging techniques, including Purkinje imaging [11,12], Scheimpflug imaging [13–16] and OCT [17–20] have been demonstrated for quantification of crystalline lens geometrical parameters. Optical techniques, however, have two main drawbacks: (i) they suffer from refraction distortions from preceding surfaces, which need to be corrected, and (ii) the iris blocks the incident light and thus only the shape of the lens within the pupil is available.
Refraction correction has been successfully achieved using ray tracing methods [21,22]. On the other hand, extrapolation of the surfaces blocked by the iris from data visible through the pupil has often been achieved using the so-called intersection approach, which extrapolates the lens periphery using circle fitting of the anterior and posterior surfaces of the lens, with the equatorial diameter obtained from their intersection. This approach has been reported in some lens studies [23–26] and is used in some commercial OCT systems such as the CASIA2 (Tomey, Nürenberg, Germany) and the Catalys laser (Johnson & Johnson Vision, Santa Ana, CA, USA). In a previous work on ex vivo lenses we showed that the intersection approach overestimates the equatorial diameter and the volume of the lens, and underestimates (anterior shift) the equatorial plane position [27].
In that earlier study [27] we proposed a 2-region parametric model (2RM) to estimate realistically the full lens shape in vivo from OCT images. In brief, the method was trained and validated using OCT images from ex vivo isolated lenses, in which the full shape of the lens is visible because the iris is removed before the measurements [28]. The method was demonstrated in vivo on accommodating young subjects [29], and in cross-sectional studies where the crystalline lens was quantified as a function of age [30] or refractive errors [31]. The method has also been used to improve the estimation of the intraocular position in a cataract surgery [3] and to quantify the crystalline lens in a guinea pig myopia model in vivo [32]. While the 2RM method allowed us to fully quantify the crystalline lens in human and animal models, the description of the lens required merging a set of parametric surfaces that described anterior, posterior and peripheral parts of the lens, making its practical implementation complicated and requiring additional user interaction to monitor the constructed models.
Recently [33] we have presented a new method for the representation of the full shape of the crystalline lens ex vivo that we called eigenlenses. Briefly, eigenlenses represent the most common “deformation patterns” (with respect to an average lens shape) among the human crystalline lens shapes that can be found in nature. Thus, for example, the first eigenlens (the most “common” deformation) is related with changes in the size of the lens, while the second eigenlens is related with changes in the aspect ratio (i.e., lenses more rounded or “stretched”). Eigenlenses representation is compact, capturing the 96% of the variance in shape of the training set of lenses with only 6 coefficients.
In this manuscript we demonstrate the use of eigenlenses to estimate the full shape of the lens in vivo, which is made possible thanks to the compaction ability of eigenlenses. Unlike the 2RM, eigenlenses method provides, by construction, a meaningful shape, is more repeatable and robust, and requires lower computational resources. We also demonstrate eigenlenses ability to describe the full shape crystalline lens changes with accommodation and its dependence on refractive error.
2. Method
2.1. Subjects
Seventeen eyes from 17 young human subjects (6/11 males/females; mean age: 28.6 ± 3 y/o, age range: 22 to 30 y/o; spherical error range: -6.75 to + 0.75 D) were studied. Subjects signed a consent form approved by the Institutional Review Boards after they had been informed on the nature and possible consequences of the study, in accordance with the tenets of the Declaration of Helsinki.
2.2. Optical coherence tomography imaging system and experimental protocol
Images of the anterior segment of the eye were acquired with a custom swept-source optical coherence tomography (SS-OCT) system employing a MEMS-based vertical-cavity surface-emitting laser (VCSEL) swept-source (SL132120, Thorlabs, USA), centered at 1300 nm and a fiber-optics based Mach-Zender interferometer configuration. The system had been described in an earlier publication [34]. The acquisition speed was 200000 A-Scans/s. The axial depth range was 15.95 mm in air, sampled by 1920 pixels, resulting in a pixel size of 8.3 µm. The measured axial resolution was 16 µm in air. The transverse field-of-view was 15 mm × 15 mm, sampled by 300 and 150 pixels in the horizontal and vertical (fast and slow) directions, resulting in a pixel size 50 µm × 100 µm, respectively.
Images of the cornea and crystalline lens were acquired for relaxed accommodation (0 D) and 4.5 D of accommodative demand. To induce accommodation and compensate defocus, an external accommodative channel, based on a Badal system mounted on a manual stage and a Digital-Light-Processing (DLP) pico projector (PicoPix, 854 × 480 pixels, Philips NV, Amsterdam, Netherlands; 55 lum), was incorporated into the OCT system through a dichroic mirror. The fixation stimulus consisted of a white Snellen E-letter presented on a black background. The subject’s spherical error was corrected using a trial lens placed on a pupil conjugate plane and subject’s stabilization was guaranteed using a bite bar. Prior to imaging, the subject’s eye pupillary axis was aligned to the optical axis of the instrument following the procedure explained in prior work [19]. Repeated 3D-OCT measurements of the right eye of each subject (around five per subject) were acquired for each accommodative demand.
2.3. Eigenlenses and eigencenters
The eigenlenses approach describes the shape of any crystalline lens as an average lens plus a linear combination of a K number of eigenlenses (“deformation patterns”) [33]:
| (1) |
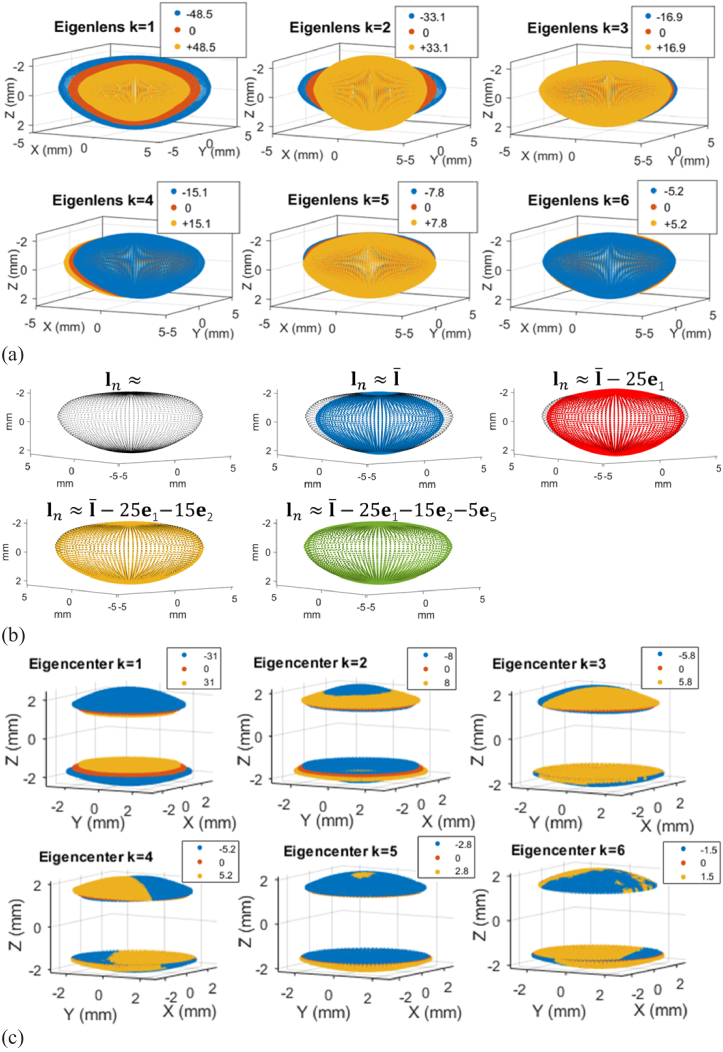
where represents the lens n to be represented, the average lens obtained from a set of ex vivo training lenses, the eigenlens k and the coefficients that multiply each eigenlens (establishing the contribution of each deformation pattern) to obtain the lens . Elements of vectors and represent the distances r from the origin of coordinates to the surface at every pair of sampled elevation (θ) and azimuth (φ) angles in spherical coordinates, i.e., , with P the number of elevation angle sampling points, Q the number of azimuth angle sampling points, and M=P × Q the number of points that define the lens [33]. Figure 1(a) represents the 6 first eigenlenses, and Fig. 1(b) shows an example of how the representation of a given lens improves as more eigenlenses are included. Figure S1 shows an example of the construction of an ex-vivo lens of age 65 y/o with eigenlenses.
Fig. 1.
(a) Representation of the 6 first eigenlenses obtained, for each eigenlens k, as . Three different values are illustrated for every eigenlens k (in blue, red and yellow). The average lens is represented in all subfigures in red ( = 0) and the different eigenlenses can be interpreted as deformations from this average lens shape. (b) Example of how the representation of a given lens improves as more eigenlenses are included. The black lens shows the lens to be represented. Blue, red, yellow and green lenses show the obtained representation as the average lens , the , and coefficients are included, respectively. Asymmetric terms ( and ) are not included in the example for clarity. (c) Representation of the 6 first eigencenters obtained, for each eigencenter k, as . Three different values are illustrated for every eigencenter k (in blue, red and yellow). The average central area is represented in all subfigures in red ( = 0) and the different eigencenters can be interpreted as deformations from this average central area.
Furthermore, eigenlenses were additionally constructed to represent the optical zone (central area) of the crystalline lens that is visible through the pupil in-vivo. In the current study we introduce the term eigencenters as a denomination of this representation. The concept of the eigencenters is similar to the eigenlenses, but in this case, they are obtained using only the central area of a given diameter in the training ex-vivo lenses, and thus, they represent the variations of the shape of the lens within the pupil. Therefore, the central area of any crystalline lens can be represented as the average crystalline lens-central area plus a linear combination of K eigencenters:
| (2) |
where represents the central area of lens n to be represented, the average shape within the central area from a set of training lenses, the eigencenter k and the coefficients that multiply each eigencenter to obtain the central area of lens n. Figure 1(c) shows the first 6 eigencenters representing the most common “deformation patterns” in the central area.
In our previous work [33], we determined that was the optimal number of eigenlenses/eigencenters to be used, as we found that a higher K did not result in a substantial increase of the representation accuracy (with we were able to explain the 96% of the variance in the training set). Therefore, we will also use 6 eigenlenses/eigencenters in the present work.
2.4. Training a model for the estimation of the full shape of the crystalline lens from its central area
Eigenlenses can be used to estimate the full shape of the crystalline lens from the information of the optical/central area that is available in-vivo. To this end, a mathematical expression for the estimation of full-shape coefficients from the eigencenter coefficients was obtained, following the next steps:
-
(i)
Eigenlenses representation was calculated in a training set of N=133 isolated lenses, obtaining the corresponding set of coefficients for each of the 133 lenses [33]. Furthermore and were stored as they are needed to obtain the full shape of new (previously “unseen”) test lenses.
-
(ii)
In vivo conditions were simulated in the training set assuming that only the central part of the lens was visible. Specifically, experiments were done assuming pupil diameters from approximately 3.4 to 6.5 mm (sampling the elevation angle in polar coordinates from to , see Fig. 3 in [33] for details). From this central part, the eigencenter representation was calculated for each lens, obtaining the corresponding set of coefficients . Furthermore and were stored as they were needed to obtain the eigencenter representation of new test lenses.
-
(iii)An expression for the estimation of coefficients from ( ) was obtained using multivariate linear regression. Specifically, we solved the problem:
where A is an N×6 matrix where each column corresponds to a coefficient and each row to a training lens, C is an N×(6+1) matrix where each column k corresponds to a coefficient (first column is a vector of ones) and each row to a training lens, is a 7×6 coefficients matrix (to be obtained) and is the error matrix [35]. The matrix contains the coefficients needed to estimate each from a set of eigencenter coefficients.(3)
Fig. 3.
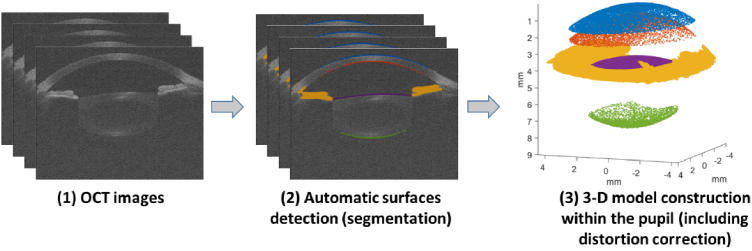
3-D model construction within the pupil, including the automatic surfaces detection in each B-scan and the distortion correction.
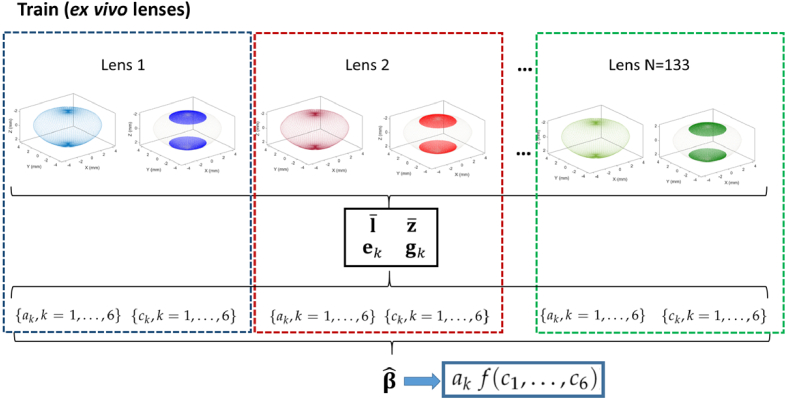
Figure 2 illustrates the process. From the whole set of 133 training lenses, we obtained and stored and , and, after simulating in vivo conditions, and . Then, for each ex vivo training lens, we obtained (representation of the full shape) and (representation of the central area) coefficients. Finally, was estimated solving Eq. (3). With this information, we can estimate the full shape of a new, previously unseen, test lens in vivo as explained in the next section.
Fig. 2.
Training a model for the estimation of the full shape from the central area. From the training set of ex vivo lenses, and are firstly obtained and stored. Then, for each ex vivo training lens, (representation of the full shape) and (central part) are calculated. From them, a matrix is obtained using multivariate linear regression, that allows the estimation of the from in a new unseen lens (and thus, the estimation of its full shape from its central part measured in-vivo).
2.5. Full shape estimation in-vivo using eigenlenses
In this section, we describe the estimation of the crystalline lens full shape from a volume of OCT images of a crystalline lens in vivo using the models previously trained (section 2.4). Specifically, the method consists of three steps: (i) the 3-D shape of the lens is obtained within the pupil; (ii) the eigencenter representation of this 3-D shape is obtained; and (iii) the full shape coefficients and, from them, the full shape of the lens is estimated.
2.5.1. Obtaining the 3-D shape of the lens within the pupil
Obtaining the accurate 3-D shape of a lens within the pupil from the OCT images involved automatic surfaces detection and segmentation, and distortion correction [21,36]. The surfaces of interest (anterior and posterior cornea and anterior and posterior crystalline lens) were automatically segmented in each B-scan using thresholding, Canny edge detectors, mathematical morphological operations, and a priori knowledge of the measurements [19,37]. Then, each 3-D surface composed of all B-scans segmentations was fit with Zernike polynomials up to the 4-th order, and the resulting smooth surface was used to guide a new refined segmentation in each B-scan. In this case, the edges were searched in the local neighborhood of the “smooth segmentation”, obtained (for each B-scan and surface) by evaluating the Zernike representation of the corresponding 3-D surface at the corresponding coordinates of that B-scan [28].
The custom-designed OCT system produced a partially-telecentric scan. The residual “fan distortion” arising from the scanning architecture and the optics of the system was corrected following the process described by Ortiz et al. [36]. Optical distortion, due to the refraction of the rays in the different surfaces of interest, was corrected by using 3-D ray tracing [21]. The corneal group refractive index was taken as 1.389 [38], the aqueous humor group refractive index as 1.345, and the crystalline lens refractive index was obtained from the age-dependent average refractive index expression derived by Uhlhorn et al. [39]. Figure 3 illustrates the process to obtain the 3-D model within the pupil.
2.5.2. Obtaining the eigencenter representation of the 3-D shape
The eigencenters representation of the 3-D shape of the lens within the pupil was obtained by calculating the corresponding coefficients . Specifically, the 3-D crystalline lens data were first centered laterally at the anterior lens maximum elevation point and axially at the mid-point between anterior and posterior surfaces, converted into polar coordinates, and interpolated in the specific M = P×Q=10000 defined sampling points, obtaining . The residual data was obtained by subtracting the mean lens, and projected into the eigencenter basis:
where is a vector with the 6 coefficients, , E is an M×6 matrix where each column is the ordered (starting form the highest eigenvalue) first 6 eigencenters , and is an M×1 vector of the test data; T indicates the transpose operator.
2.5.3. Estimation of the full shape coefficients and the full shape of the lens
From the set of eigencenter coefficients , full shape coefficients are estimated using the matrix obtained in the training phase (as illustrated in Fig. 2):
| (5) |
where are the estimated coefficients, and is a 7×6 coefficients matrix. Once we have , we can obtain the full shape by projecting into the eigenlenses basis and adding the mean lens:
| (6) |
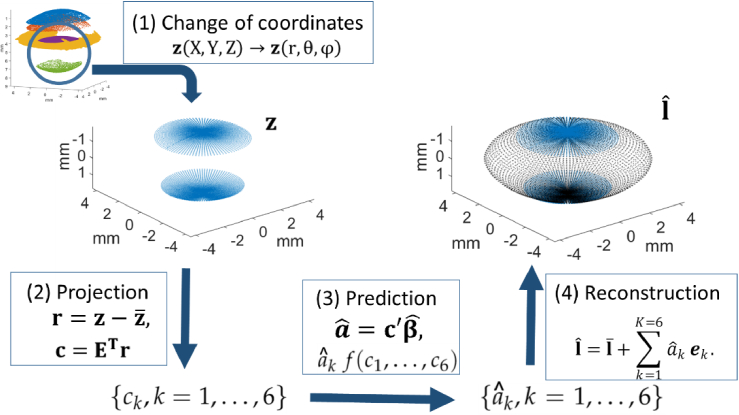
Figure 4 illustrates the process to estimate the full shape from the 3-D model within the pupil.
Fig. 4.
Full shape estimation from the 3-D model within the pupil, including: (1) Change of coordinates: 3-D model within the pupil change of coordinates, from cartesian to spherical; (2) Projection of the residual data in the eigencenters basis to obtain coefficients; (3) Prediction of coefficients from the coefficients; (4) Reconstruction of the full shape from the coefficients.
2.6. Full shape quantification
Once the full shape 3-D models were constructed, various biometric parameters were quantified. Specifically, we obtained: (1) lens thickness (LT); (2) lens equatorial diameter (DIA); (3) lens equatorial plane position (EPP); (4) lens surface area (LSA); and (5) lens volume (VOL). The EPP was defined as the distance between the anterior lens apex and the position of the equatorial plane [3]. The VOL was estimated by numerically solving the double integration of the anterior and posterior lens surfaces [29]. The LSA was estimated from the Delaunay triangulation of the 3-D anterior and posterior lens contours [29].
2.7. Data analysis
We investigated if the coefficients and the geometrical parameters (DIA, VOL, LSA and EPP) varied significantly with the pupil diameter (PD) from which the full shape was estimated, applying one-way ANOVA with Bonferroni’s correction for multiple comparisons.
We analyzed the relationship between eigenlenses coefficients and full shape geometrical parameters by means of linear regression, obtaining the Pearson correlation coefficient (ρ) and the p-value for testing the hypothesis of no correlation (p).
We also analyzed the agreement between the proposed method and our previous method for the full shape estimation of the crystalline lens [27] using Bland-Altman plots [40]. To evaluate the repeatability of each method, we calculated the standard deviation across repeated measurements for each subject, and the mean across subjects was obtained.
We compared the mean values of geometrical parameters and eigenlenses coefficients between 0 D and 4.5 D accommodative states using a two-tails paired t-test. For all analyses, statistical significance was defined as a p-value lower than 0.05. Calculations were performed with Matlab software (MathWorks, Natick, MA, USA).
3. Results
3.1. OCT images and 3-D full shape models
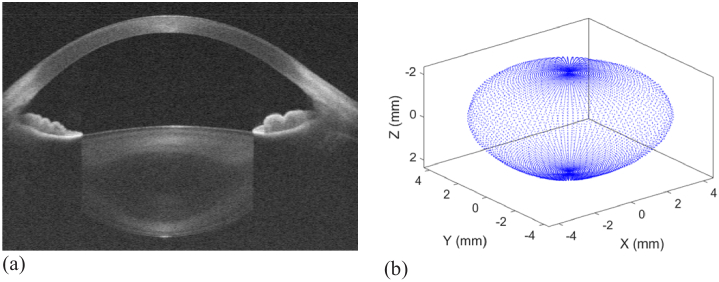
Figure 5 shows an example of a central B-scan acquisition and the 3-D full shape model obtained after applying the proposed method.
Fig. 5.
(a) Example of a frame extracted from a volumetric OCT scan obtained with the custom-designed OCT (Subject #11, 26-year old subject; relaxed accommodation, central B-scan, average of 3 scans). (b) Example of the full shape 3-D models obtained with the proposed method (from OCT image volumes) in this subject. The central region eigencenters/full lens shape eigenlenses are described by coefficient-values and .
3.2. Pupil diameter analysis
The coefficients and the geometrical parameters (DIA, VOL, LSA and EPP) estimated with the proposed method were analyzed as a function of the pupil diameter (PD) from which the estimation of the full lens shape is obtained (n=17 subjects at 0 D of accommodation, mean of the repeated measurements). We investigated coefficients and parameters for PDs between 3.4 to 6.5 mm. In cases in which the actual PD of the measurement was higher than the tested PD, we removed the information outside the tested diameter.
We did not find a statistically significant difference of the and coefficients and the reconstructed lens geometrical parameters across pupil diameters (p>0.05, one-way ANOVA with Bonferroni’s correction). Furthermore, the values did not differ more than 1% for PD larger or equal to 4.4 mm with respect to the largest PD tested (6.5 mm) for any parameter except for the (that differed <2%) and (that differed <4%). Only the coefficient showed a statistically significant variation with PD. These results are shown in Figure S2.
3.3. Relationship between eigenlenses cofficients and full shape geometrical parameters
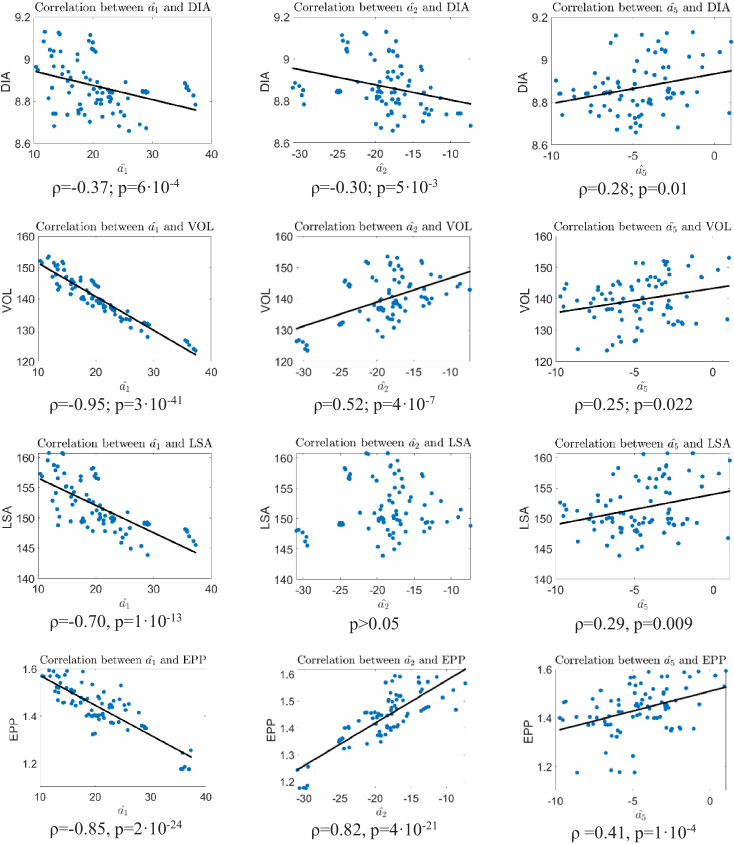
Figure 6 shows the correlation between eigenlenses coefficients and full-shape geometrical parameters. The first column shows the correlation of DIA (first row), VOL (second row), LSA (third row) and EPP (fourth row) with the first coefficient ; the second column with the second coefficient ; and the third column with the fifth coefficient . The black solid line represents the best linear fitting, which is plotted when the correlation is statistically significant. Correlation coefficient (ρ) and the p-value for testing the hypothesis of no correlation (p) are also shown. For these calculations we considered a PD of 5.2 mm, which was the closest value to the actual mean PD of the in-vivo measurements. These results are for measurements obtained at 0 D of accommodative demand (n=83, including repeated measurements on the 17 subjects).
Fig. 6.
Correlation between eigenlenses coefficients and full-shape geometrical parameters. First column: correlation between and DIA, VOL, LSA and EPP. Second column: correlation between and DIA, VOL, LSA and EPP. Third column: correlation between and DIA, VOL, LSA and EPP.
In general, VOL and LSA strongly depended on , while DIA depended on a combination of and . As expected, we did not find correlation of or eigenlens coefficients (asymmetric terms) with any of the geometrical parameters, and of coefficient with any parameter, except for the EPP (ρ =-0.51, p=8·10−7, not shown in the figure).
Table 1 shows a multiple linear regression analysis using least squares between the crystalline lens geometrical parameters and the first two coefficients and . First row shows the R2, second row shows the equation that relates each parameter and the two coefficients and third row shows the Mean Absolute error (MAE) between the estimation using the two coefficients and the actual parameter.
Table 1. Multiple linear regression analysis using least squares between the crystalline lens geometrical parameters and the first two coefficients and .
| LT | DIA | VOL | |
|---|---|---|---|
| R2 | 0.997 | 0.974 | 0.997 |
| Equation | |||
| MAE | 0.007 mm | 0.017 mm | 0.32 mm3 |
| LSA | EPP | |
|---|---|---|
| R2 | 0.99 | 0.789 |
| Equation | ||
| MAE | 0.34 mm2 | 0.037 mm |
LT, DIA, VOL and LSA can be accurately estimated from the first 2 coefficients. On the contrary, EPP estimation improves if the fifth coefficient is included instead of the first coefficient (R2 = 0.90, , MAE = 0.025 mm).
3.4. Comparison with our previous 2-region parametric model (2RM) to estimate the full lens shape in vivo
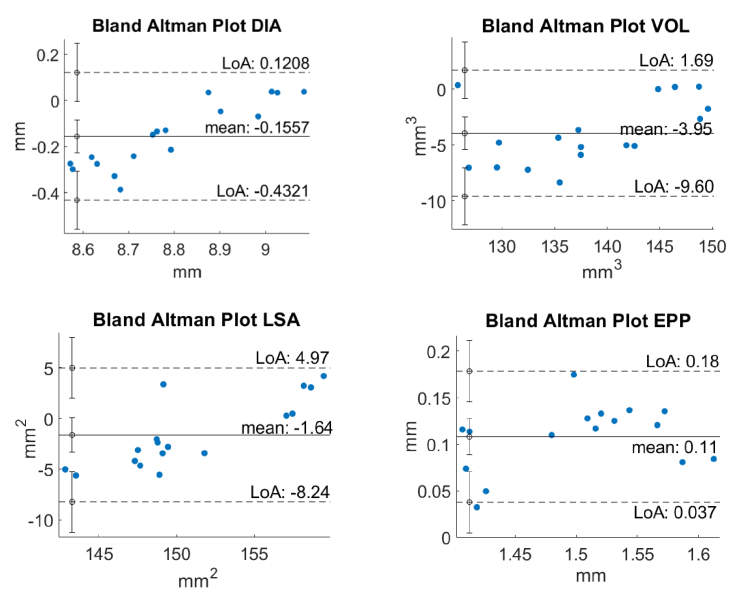
Figure 7 shows the Bland-Altman plots for measurements at 0 D accommodation (n = 17, using the mean of the repeated measurements for each subject). The Y axis represents the difference between the methods calculated as 2RM-proposed eigenlenses. The limits of agreement (LoA) are calculated as , where SD is the standard deviation of the difference.
Fig. 7.
Bland-Altman plots for the different geometrical parameters; Y axis: difference of the methods (2RM-proposed); LoA: Limit of Agreement ( , where SD is the standard deviation of the difference).
Table 2 shows the mean value ± standard deviation across subjects of each method (2RM and proposed eigenlenses) and geometrical parameter.
Table 2. Mean and standard deviation values across subjects for each method (2RM and proposed eigenlenses) and geometrical parameter.
| 2RM | Proposed eigenlenses method | |
|---|---|---|
| DIA (mm) | 8.71 ± 0.23 mm | 8.87 ± 0.11 mm |
| VOL (mm3) | 136 ± 9 mm3 | 140 ± 7 mm3 |
| LSA (mm2) | 150 ± 7 mm2 | 152 ± 4 mm2 |
| EPP (mm) | 1.55 ± 0.08 mm | 1.43 ± 0.09 mm |
In general, the 2RM method underestimated the size of the lens relative to the proposed eigenlenses method (∼2% lower DIA, 3% lower VOL, 1% lower LSA) and overestimated EPP (7%), especially for smaller lenses.
Table 3 shows the repeatability of each method (2RM and proposed eigenlenses) for each geometrical parameter (mean across subjects of the standard deviation across repeated measurements). The standard deviation across measurements is statistically significantly lower (better repeatability) with the eigenlenses than with the 2RM method for all geometrical parameters except for the VOL (paired t-test, asterisks in Table 3).
Table 3. Repeatability (standard deviation) in the estimation of each geometrical parameter for the 2RM and the eigenlenses methods. a .
| 2RM | Proposed eigenlenses method | p-value | |
|---|---|---|---|
| DIA (mm)* | 0.062 mm | 0.037 mm | 0.03 |
| VOL (mm3) | 2 mm3 | 1.5 mm3 | 0.058 |
| LSA (mm2)* | 1.9 mm2 | 1.2 mm2 | 0.003 |
| EPP (mm)* | 0.041 mm | 0.024 mm | 0.003 |
p-values correspond to paired a t-test; * indicates statistically significant changes between repeatability values at a significance level of p<0.05.
The mean computational time across lenses was statistically significantly lower (paired t-test) with eigenlenses (4.3 ±0.4 ms) than with the 2RM method (8.1±2.3 s), measured in a 3.5 GHz CPU, 8 GB RAM, using Matlab software.
3.5. Changes of the eigenlenses coefficients and geometry with accommodation
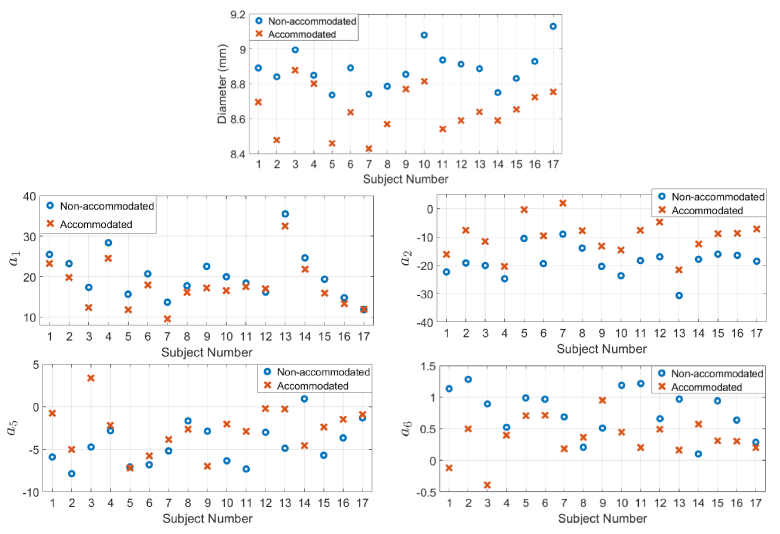
Figure 8 shows DIA and “symmetric” eigenlenses coefficients ( and ) for the 17 subjects in two accommodative demands: 0 D (blue circles) and 4.5 D (red crosses).
Fig. 8.
Changes of equatorial lens diameter (DIA) and “symmetric” eigenlenses coefficients and with accommodation for each subject. Blue: non-accommodated state (0 D of accommodation demand); red: accommodated state (4.5 D of accommodation demand).
Table 4 shows the mean changes across subjects of DIA, VOL and eigenlenses coefficients ( and ), between the two accommodative demand states, and the p-value of a paired t-test to compare if the mean changes with accommodation were statistically significant. As expected, asymmetric terms , (not shown) and VOL did not statistically change with accommodation.
Table 4. Mean changes of DIA, VOL and eigenlenses coefficients ( and ) between two accommodative states (0 and 4.5 D) a .
| Mean±SD | p-value | |
|---|---|---|
| ΔDIA (0 D- 4.5 D)* | 0.24±0.10 mm | 4·10−8 |
| ΔVOL (0 D- 4.5 D) | 1.4±2.73 mm3 | >0.05 |
| Δa1 (0 D- 4.5 D)* | 2.72±1.66 | 5·10−6 |
| Δa2 (0 D- 4.5 D)* | -8.66±2.33 | 6·10−11 |
| Δa5 (0 D- 4.5 D)* | -1.79±3.35 | 0.04 |
| Δa6 (0 D- 4.5 D)* | 0.42±0.53 | 0.004 |
p-values correspond to a paired t-test; * indicates statistically significant changes at a significance level of p<0.05.
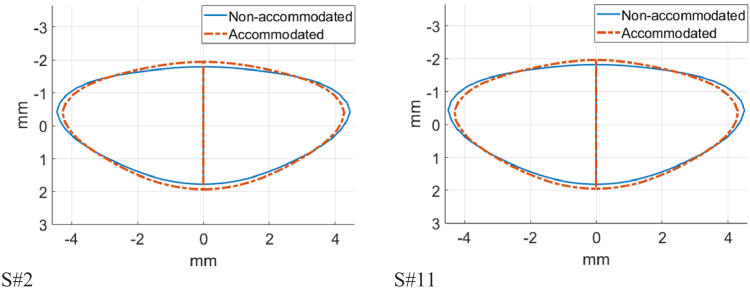
Figure 9 shows the geometrical changes with accommodation of the full shape obtained with the eigenlenses method for two different subjects. Blue line represents the non-accommodated state (0 D of accommodation demand); red dashed line shows the accommodated state (4.5 D of accommodation demand). For visualization purposes, the figure shows 2-D profiles calculated as the mean of the meridians that compose the 3-D model (azimuth angles defined in the sampling in spherical coordinates).
Fig. 9.
Changes of the full shape with accommodation obtained using the eigenlenses method. Blue: non-accommodated state (0 D of accommodation demand); red: accommodated state (4.5 D of accommodation demand). 2-D profiles calculated as the mean of the meridians that compose the 3-D model.
3.6. Changes of the eigenlenses coefficients and the geometrical parameters with refractive error
Table 5 shows the mean DIA, VOL and eigenlenses coefficients ( and ) pooling emmetropic subjects (n=4, mean refractive error= 0.19 ± 0.37 D, spherical error ranging from 0 to 0.75 D) and myopic subjects (refractive error 1 D, n=13, mean refractive error = -3.36 ± 1.98 D, ranging from -6.75 to -1.25 D) separately. Data are shown for relaxed accommodation (0 D) and for 4.5 D of accommodative demand. We found statistically significant differences between emmetropes and myopes (t-test; p<0.05 significance) in the lens diameter at 4.5 D of accommodative demand and in the coefficients and for both accommodative states (marked by *).
Table 5. Mean DIA, VOL and eigenlenses coefficients (a1, a2, a5 and a6) in an emmetropic and a myopic group for relaxed accommodation (0 D) and accommodated states (4.5 D demand). a .
| Emmetropes (0 D) | Myopes(0 D) | p-value(0 D) | Emmetropes (4.5 D) | Myopes(4.5 D) | p-value(4.5 D) | ||
|---|---|---|---|---|---|---|---|
| DIA (mm) | 8.81±0.10 | 8.91±0.11 | 0.14 | DIA* (mm) | 8.48±0.05 | 8.70±0.10 | p=5·10−4 |
| VOL (mm3) | 141±4 | 140±7 | 0.83 | VOL (mm3) | 138±4 | 139±6 | 0.80 |
| 17.7±4 | 21.1±6 | p=0.33 | 14.7±5 | 18.5±6 | p=0.24 | ||
| -14.3±5 | -20.1±4 | p=0.04 | -3.5±5 | -12.1±5 | p=0.009 | ||
| -6.9±1 | -3.8±2 | p=0.02 | -4.7±2 | -2±3 | p=0.08 | ||
| 1±0.3 | 0.69±0.4 | p=0.09 | 0.4±0.2 | 0.34±3 | p=0.75 |
p-values correspond to a t-test between the groups (emmetropes and myopes); * indicates statistically significant changes at a significance level of p<0.05. We also compared the mean change in diameter with accommodation (ΔDIA=DIA at 0 D- DIA at 4.5 D) for emmetropes (ΔDIA=0.34±0.05 mm) and myopes (ΔDIA=0.20±0.09 mm), and found that they were statistically significantly different, t-test, p=0.0167.
4. Discussion
In earlier work [33] we presented the novel concepts of eigenlenses and eigencenters for the representation of the full shape and the central area of the crystalline lens, respectively. They were constructed from 3-D OCT images of 133 ex vivo lenses (newborn to 71 y/o), thus capturing compactly and accurately the geometry of lenses of different ages. In this paper, we have shown the application of the eigenlenses and eigencenters method to the full shape estimation of the crystalline lens from in-vivo OCT images. Eigencenter coefficients are obtained from the central part of the lens that is visible through the pupil, and eigenlenses coefficients (and thus, the full shape of the lens) are estimated from them using an estimator previously obtained using the set of ex vivo lenses. The estimation of eigenlenses from eigencenters is made possible thanks to the compaction ability of the representations, that capture the 96% of the variance in the training set with only 6 coefficients and more than 80% with 2 coefficients. This allows to obtain an accurate estimator that only depended on 6 variables, avoiding overfitting problems [33].
The eigenlenses method has several advantages when compared with our previous 2-region parametric model (2RM) [27] for the full shape estimation of the crystalline lens. Unlike in 2RM, where the full shape is obtained by merging a set of parametric surfaces that represent different portions of the lens, eigenlenses always lead to a smooth and realistic shape by construction, because lens deformation patterns (eigenlenses) are added to the average lens (Eq. (1)), which is inherently smooth. Furthermore, as shown in Table 3, eigenlenses is a more repeatable method than 2RM (e.g., reducing the standard deviation across measurements by a factor of around 1.8 in DIA and 1.4 in VOL), and much more robust: from the total 83 available 3-D models of the central part, 16 full shapes obtained using 2RM were not accurately constructed and thus discarded (i.e., ∼19% led to non-smooth or anatomically impossible shapes, remaining 67 useful models), while no models were discarded due to a wrong construction with eigenlenses. Thus, 2RM required user interaction to discard those models. Finally, to obtain the representation of a new test lens, the eigenlenses method simply finds the projection of the lens on the eigenlenses space and no parameter optimization is required, unlike in the 2RM approach. This reduced by a factor of 2,000 the computational time of a full shape estimation (from 8.1 s to 4.3 ms). High repeatability, robustness, and low computational cost are very desirable properties for the implementation of the method in commercial OCT systems.
Geometrical changes with accommodation can be well described with changes in the value of the eigenlenses coefficients (Table 4). Specifically, accommodation shape changes are driven by coefficient , which increased approximately 1.92 D-1 with accommodation (i.e., lens became more rounded), while slightly decreased 0.6 D-1, increased 0.4 D-1, and decreased 0.09 D-1. There are several studies in the literature where finite element models (FEM) are used to predict the deformation of the crystalline lens in the accommodation process upon application of equatorial forces by the ciliary muscle, assuming some age-dependent lens material properties and specific lens geometries as a function of age (11, 29 and 45 y/o in [41,42]). The combination of the eigenlenses representation (for the description of patient-dependent full shape changes with accommodation) and FEM can be very useful to study the crystalline lens mechanical parameters of a given patient [43], improving the understanding of the interplay between the mechanical, geometrical, and optical factors in the accommodative response. Also, our results on the changes of eigenlenses coefficients with accommodation can be useful in the generation of geometrical models with accommodation, which is challenging with classical descriptions of the crystalline lens using for example radii of curvature and asphericities or other more complex full shape models [44].
Mean DIA obtained with eigenlenses for un-accommodated lenses (8.87 mm) is close to the one reported in [29] based on the 2RM method (8.94 mm) and by Atchison et al. [6] using MRI (9.03 mm); DIA decreased at 4.5 D of accommodative demand to 8.65 mm (eigenlenses method). Atchison et al. reported average 8.71 mm lens diameters (MRI) in young subjects for 4.8-6.9 D accommodative demand. For VOL, our mean reported value for unaccommodated lenses was 140 mm3, which is slightly lower than our report using 2RM [29] (146 mm3) and MRI-based data (154 mm3 in [9]). Changes of DIA were statistically significant with accommodation (0.24 mm upon 4.5 D of accommodative demand). Assuming linear changes of DIA with accommodation, our mean rate of change (around -0.05 mm/D) is similar to those reported by Atchison et al. [6] (slopes around 0.048-0.067 mm/D) Hermans et al. [7] (0.07 mm/D), and lower than those reported with 2RM [29] (0.13 mm/D) and in Shepard et al. [9] (0.09 mm/D). Nevertheless, note that changes are reported as a function of accommodative demand, and some differences may arise from individual differences in accommodative response. The presence of accommodative lags will induce an underestimation of the rates compared to estimates as a function of the actual accommodative response [29]. Changes in VOL with accommodation were not statistically significant, as expected and found in previous literature using OCT [29,45] and MRI [7].
Second and fifth eigenlenses coefficients were significantly different between myopes and emmetropes. Specifically, decreased in myopes (for both, 0 D and 4.5 D states) consistent with more stretched lenses in myopic subjects, and increased (only in the 0 D state). Also, we found that DIA in myopes was statistically significantly higher than in emmetropes (only significant for the 4.5 D state), in good correspondence with our previous report [31]. Furthermore, changes of DIA with accommodation (between relaxed and 4.5 D of accommodative demand) were statistically significantly higher in emmetropes (0.34 ± 0.05 mm) than in myopes (0.20 ± 0.09 mm), which could indicate a lower accommodative response in myopes. The ability of the eigenlenses to capture the full shape of the crystalline lens with a small number of coefficients makes them suitable metrics in applications monitoring myopia and accommodation [46], and in studies of the role of the crystalline lens during emmetropization process, myopia development, and myopia treatment [31,47].
In previous work [3], we demonstrated that including some parameters of the full shape of the crystalline lens (e.g., the EPP, LSA and VOL) improved the estimation of the post-operative IOL position in cataract surgery, which is the largest contributor to post-surgical refractive errors [48]). Thanks to their properties and construction, eigenlenses coefficients describe the full shape of the crystalline lens in a more accurate and compact way than other “classical” geometrical parameters (for example, the lens shape is better described with the first two eigenlenses coefficients than with its VOL and EPP). This opens the possibility of improving the IOL position estimation formulas using directly eigenlenses coefficients instead of geometrical parameters as previously shown [3]. The same reasoning applies also to accommodative IOLs (A-IOLs) for presbyopia, where prior knowledge of the full shape of the crystalline lens could be critical for the proper sizing and thus the correct operation of the implanted A-IOL [2,49,50]. Finally, full shape lens models could be useful for improving IOL design and for customizing accommodating IOLs, by studying how the full shape geometry modulates the optical/mechanical performance of a given IOL or how the capsular bag shape relates with the IOL tilt and decentration.
The gradient of the refractive index (GRIN) of the crystalline lens may affect the posterior lens shape retrieved from OCT images. Nevertheless, we demonstrated a minor influence in the obtained full shape estimation in earlier work [27,29]. Eigenlenses have been applied in vivo in this paper, but they are constructed from a set of ex vivo lenses [33], which geometry can be considered fully-accommodated. Cataract and presbyopia applications of eigenlenses correspond to nearly presbyopic or presbyopic eyes, where one expects ex vivo and in vivo lenses to have approximately the same shape, as changes with accommodation will be small. Furthermore, the set of ages of the ex vivo lenses used for the eigenlenses construction ranged from new born to 71 y/o, thus including very different geometries that are learned by the models. Eigenlenses were constructed using lenses from two different populations: 28 lenses from an eyebank in Spain, and 105 lenses from an eyebank in India. In a recent study [51] we did not find population differences in geometry between isolated European and Indian lenses.
In the future, we plan to include in the training set isolated ex vivo young lenses measured in a lens stretcher system that simulates non-accommodated states [52,53] in order to improve the representation of young lenses with accommodation. In addition, coupling of the eigenlenses representation of the lens with Finite Element Models (and applied equatorial forces) on this lens stretcher database, and further applications in vivo can give insights into the mechanism of accommodation and its loss in presbyopia. The full shape coefficients ak are estimated from coefficients ck using multivariate linear regression. In the future, the estimation method could be improved using “classical” machine learning methods for supervised learning, as neural networks or support vector machines (SVMs). Finally, a related interesting future application of the eigenlens framework is the study of the change of eigenlens coefficient/lens parameters as a function of age, and as a function of refractive error, in relation to the accommodative response.
5. Conclusion
We have shown application of the proposed eigenlenses representation for the estimation of the crystalline lens full shape in vivo from OCT images, where only the central part of the lens visible through the pupil is available. We have demonstrated that the eigenlenses method has higher repeatability, robustness and computational speed compared to the previously proposed 2RM method for the estimation of the full shape of the lens in vivo. Also, we have shown the ability of eigenlenses to capture geometrical changes with accommodation, only requiring a small number (2-4) of coefficients, and analyzed the relationship between eigenlenses coefficients, accommodation and refractive error. Accurate patient-specific modelling of the crystalline lens in vivo with the eigenlenses representation has the potential to improve cataract surgery (more accurate selection of IOL power) and the design of solutions to restore accommodation (accommodative IOLs).
Funding
HORIZON EUROPE European Research Council10.13039/100019180 (IMCUSTOMEYE H2020-ICT-2017 Ref. 779960;); European Research Council10.13039/501100000781 (SILKEYE H2020-ERC-571 2018-ADG Ref.833106); Ministerio de Ciencia e Innovación10.13039/501100004837 (PID2020-115191RB-I00); Narodowa Agencja Wymiany Akademickiej10.13039/501100014434 (ULAM 2020/1/00176); Fundacja na rzecz Nauki Polskiej10.13039/501100001870 (MAB/2019/12); L'Oréal-UNESCO “For Women in Science”; Ministerio de Ciencia, Innovación y Universidades10.13039/100014440 (IJC2018-037508-I, Juan de la Cierva-Incorporation); Research to Prevent Blindness10.13039/100001818 (Bascom Palmer Eye Institute, Flaum Eye Institute); National Institutes of Health10.13039/100000002 (NIE P30EY 001319); Unrestricted Funds Research to Prevent Blindness, NY; National Institutes of Health10.13039/100000002 (R01EY021834); National Institutes of Health10.13039/100000002 (P30EY014801); Florida Lions Eye Bank and Beauty of Sight Foundation; Hyderabad Eye Research Foundation10.13039/501100005809.
Disclosures
EME (P), SM (P).
Data availability
Data underlying the results presented in this paper are available in the “Estimation-of-the-full-shape-of-the-crystalline-lens-in-vivo-from-optical-coherence-tomography-image” repository, [54].
Supplemental document
See Supplement 1 (1.5MB, pdf) for supporting content.
References
- 1.Atchison D. A., Simth G., “Optics of the Human eye,” Butterworth-Heinemann (2000).
- 2.Marcos S., Martinez-Enriquez E., Vinas M., de Castro A., Dorronsoro C., Bang S. P., Yoon G., Artal P., “Simulating Outcomes of Cataract Surgery: Important Advances in Ophthalmology,” Annu. Rev. Biomed. Eng. 23(1), 277–306 (2021). 10.1146/annurev-bioeng-082420-035827 [DOI] [PubMed] [Google Scholar]
- 3.Martinez-Enriquez E., Perez-Merino P., Duran-Poveda S., Jimenez-Alfaro I., Marcos S., “Estimation of intraocular lens position from full crystalline lens geometry: towards a new generation of intraocular lens power calculation formulas,” Sci. Rep. 8(1), 9829 (2018). 10.1038/s41598-018-28272-6 [DOI] [PMC free article] [PubMed] [Google Scholar]
- 4.Olsen T., Hoffmann P., “C constant: new concept for ray tracing-assisted intraocular lens power calculation,” J. Cataract Refract Surg. 40(5), 764–773 (2014). 10.1016/j.jcrs.2013.10.037 [DOI] [PubMed] [Google Scholar]
- 5.Alió J. L., del Barrio A., Vega-Estrada A., “Accommodative intraocular lenses: where are we and where we are going,” Eye and Vis. 4(1), 16 (2017). 10.1186/s40662-017-0077-7 [DOI] [PMC free article] [PubMed] [Google Scholar]
- 6.Atchison D. A., Markwell E. L., Kasthurirangan S., Pope J. M., Smith G., Swann P. G., “Age-related changes in optical and biometric characteristics of emmetropic eyes,” J. Vis. 8(4), 29 (2008). 10.1167/8.4.29 [DOI] [PubMed] [Google Scholar]
- 7.Hermans E. A., Pouwels P. J., Dubbelman M., Kuijer J. P., van der Heijde R. G., Heethaar R. M., “Constant volume of the human lens and decrease in surface area of the capsular bag during accommodation: an MRI and Scheimpflug study,” Invest. Ophthalmol. Visual Sci. 50(1), 281–289 (2009). 10.1167/iovs.08-2124 [DOI] [PubMed] [Google Scholar]
- 8.Kasthurirangan S., Markwell E. L., Atchison D. A., Pope J. M., “MRI study of the changes in crystalline lens shape with accommodation and aging in humans,” J. Vis. 11(3), 19 (2011). 10.1167/11.3.19 [DOI] [PubMed] [Google Scholar]
- 9.Sheppard A. L., Evans C. J., Singh K. D., Wolffsohn J. S., Dunne M. C., Davies L. N., “Three-dimensional magnetic resonance imaging of the phakic crystalline lens during accommodation,” Invest. Ophthalmol. Visual Sci. 52(6), 3689–3697 (2011). 10.1167/iovs.10-6805 [DOI] [PubMed] [Google Scholar]
- 10.Ramasubramanian V., Glasser A., “Objective measurement of accommodative biometric changes using ultrasound biomicroscopy,” J. Cataract Refract Surg. 41(3), 511–526 (2015). 10.1016/j.jcrs.2014.08.033 [DOI] [PMC free article] [PubMed] [Google Scholar]
- 11.Rosales P., Dubbelman M., Marcos S., van der Heijde R., “Crystalline lens radii of curvature from Purkinje and Scheimpflug imaging,” J. Vis. 6(10), 5–1067 (2006). 10.1167/6.10.5 [DOI] [PubMed] [Google Scholar]
- 12.Garner L. F., Yap M. K., “Changes in ocular dimensions and refraction with accommodation,” Ophthalmic Phys. Opt. 17(1), 12–17 (1997). 10.1111/j.1475-1313.1997.tb00518.x [DOI] [PubMed] [Google Scholar]
- 13.Cook C. A., Koretz J. F., Pfahnl A., Hyun J., Kaufman P. L., “Aging of the human crystalline lens and anterior segment,” Vision Res. 34(22), 2945–2954 (1994). 10.1016/0042-6989(94)90266-6 [DOI] [PubMed] [Google Scholar]
- 14.Koretz J. F., Cook C. A., Kaufman P. L., “Aging of the human lens: changes in lens shape at zero-diopter accommodation,” J. Opt. Soc. Am. A 18(2), 265–272 (2001). 10.1364/JOSAA.18.000265 [DOI] [PubMed] [Google Scholar]
- 15.Dubbelman M., Van der Heijde G. L., “The shape of the aging human lens: curvature, equivalent refractive index and the lens paradox,” Vision Res. 41(14), 1867–1877 (2001). 10.1016/S0042-6989(01)00057-8 [DOI] [PubMed] [Google Scholar]
- 16.Dubbelman M., Van der Heijde G. L., Weeber H. A., “Change in shape of the aging human crystalline lens with accommodation,” Vision Res. 45(1), 117–132 (2005). 10.1016/j.visres.2004.07.032 [DOI] [PubMed] [Google Scholar]
- 17.Grulkowski I., Manzanera S., Cwiklinski L., Sobczuk F., Karnowski K., Artal P., “Swept source optical coherence tomography and tunable lens technology for comprehensive imaging and biometry of the whole eye,” Optica 5(1), 52–59 (2018). 10.1364/OPTICA.5.000052 [DOI] [Google Scholar]
- 18.Ortiz S., Perez-Merino P., Gambra E., de Castro A., Marcos S., “In vivo human crystalline lens topography,” Biomed. Opt. Express 3(10), 2471–2488 (2012). 10.1364/BOE.3.002471 [DOI] [PMC free article] [PubMed] [Google Scholar]
- 19.Pérez-Merino P., Velasco-Ocana M., Martinez-Enriquez E., Marcos S., “OCT-based crystalline lens topography in accommodating eyes,” Biomed. Opt. Express 6(12), 5039–5054 (2015). 10.1364/BOE.6.005039 [DOI] [PMC free article] [PubMed] [Google Scholar]
- 20.Sun M., Pérez-Merino P., Martinez-Enriquez E., Velasco-Ocana M., Marcos S., “Full 3-D OCT-based pseudophakic custom computer eye model,” Biomed. Opt. Express 7(3), 1074–1088 (2016). 10.1364/BOE.7.001074 [DOI] [PMC free article] [PubMed] [Google Scholar]
- 21.Ortiz S., Siedlecki D., Grulkowski I., Remon L., Pascual D., Wojtkowski M., Marcos S., “Optical distortion correction in optical coherence tomography for quantitative ocular anterior segment by three-dimensional imaging,” Opt. Express 18(3), 2782–2796 (2010). 10.1364/OE.18.002782 [DOI] [PubMed] [Google Scholar]
- 22.Ortiz S., Siedlecki D., Remon L., Marcos S., “Three-dimensional ray tracing on Delaunay-based reconstructed surfaces,” Appl. Opt. 48(20), 3886–3893 (2009). 10.1364/AO.48.003886 [DOI] [PubMed] [Google Scholar]
- 23.Yoo Y. S., Whang W. J., Hwang K. Y., Lazo M., Hwang J. H., Joo C. K., Yoon G., “Use of the Crystalline Lens Equatorial Plane as a New Parameter for Predicting Postoperative Intraocular Lens Position,” Am J Ophthalmol 198, 17–24 (2019). 10.1016/j.ajo.2018.09.005 [DOI] [PubMed] [Google Scholar]
- 24.Yoo Y. S., Whang W. J., Kim H. S., Joo C. K., Yoon G., “Preoperative biometric measurements with anterior segment optical coherence tomography and prediction of postoperative intraocular lens position,” Medicine (Baltimore) 98(50), e18026 (2019). 10.1097/MD.0000000000018026 [DOI] [PMC free article] [PubMed] [Google Scholar]
- 25.Waring G. O., Chang D. H., Rocha K. M., Gouvea L., Penatti R., “Correlation of Intraoperative Optical Coherence Tomography of Crystalline Lens Diameter, Thickness, and Volume with Biometry and Age,” Am. J. Ophthalmol. 225, 147–156 (2021). 10.1016/j.ajo.2020.12.021 [DOI] [PubMed] [Google Scholar]
- 26.Satou T., Shimizu K., Tsunehiro S., Igarashi A., Kato S., Koshimizu M., Niida T., “Relationship between Crystalline Lens Thickness and Shape and the Identification of Anterior Ocular Segment Parameters for Predicting the Intraocular Lens Position after Cataract Surgery,” BioMed Res. Int. 2019, 1–9 (2019). 10.1155/2019/3458548 [DOI] [PMC free article] [PubMed] [Google Scholar]
- 27.Martinez-Enriquez E., Sun M., Velasco-Ocana M., Birkenfeld J., Perez-Merino P., Marcos S., “Optical Coherence Tomography Based Estimates of Crystalline Lens Volume, Equatorial Diameter, and Plane Position,” Invest. Ophthalmol. Visual Sci. 57(9), OCT600 (2016). 10.1167/iovs.15-18933 [DOI] [PubMed] [Google Scholar]
- 28.Martinez-Enriquez E., de Castro A., Mohamed A., Sravani N. G., Ruggeri M., Manns F., Marcos S., “Age-Related Changes to the Three-Dimensional Full Shape of the Isolated Human Crystalline Lens,” Invest. Ophthalmol. Visual Sci. 61(4), 11 (2020). 10.1167/iovs.61.4.11 [DOI] [PMC free article] [PubMed] [Google Scholar]
- 29.Martinez-Enriquez E., Perez-Merino P., Velasco-Ocana M., Marcos S., “OCT-based full crystalline lens shape change during accommodation in vivo,” Biomed. Opt. Express 8(2), 918–933 (2017). 10.1364/BOE.8.000918 [DOI] [PMC free article] [PubMed] [Google Scholar]
- 30.Martinez-Enriquez E., Mohamed A., Ruggeri M., Velasco-Ocana M., Williams S., Maceo Heilman B., De Castro A., Perez-Merino P., Geetha Sravani N., Sangwan V., Parel J.-M. A., Augusteyn R. C., Ho A., Manns F., Marcos S., “Full shape crystalline lens geometrical changes with age from 3-D OCT images in vivo and ex vivo,” Invest. Ophthalmol Visual Sci. 59, 268 (2018). [Google Scholar]
- 31.Muralidharan G., Martínez-Enríquez E., Birkenfeld J., Velasco-Ocana M., Pérez-Merino P., Marcos S., “Morphological changes of human crystalline lens in myopia,” Biomed. Opt. Express 10(12), 6084–6095 (2019). 10.1364/BOE.10.006084 [DOI] [PMC free article] [PubMed] [Google Scholar]
- 32.Pérez-Merino P., Velasco-Ocana M., Martinez-Enriquez E., Revuelta L., McFadden S. A., Marcos S., “Three-dimensional OCT based guinea pig eye model: relating morphology and optics,” Biomed. Opt. Express 8(4), 2173–2184 (2017). 10.1364/BOE.8.002173 [DOI] [PMC free article] [PubMed] [Google Scholar]
- 33.Martinez-Enriquez E., de Castro A., Marcos S., “Eigenlenses: a new model for full crystalline lens shape representation and its applications,” Biomed. Opt. Express 11(10), 5633–5649 (2020). 10.1364/BOE.397695 [DOI] [PMC free article] [PubMed] [Google Scholar]
- 34.Curatolo A., Birkenfeld J. S., Martinez-Enriquez E., Germann J. A., Muralidharan G., Palaci J., Pascual D., Eliasy A., Abass A., Solarski J., Karnowski K., Wojtkowski M., Elsheikh A., Marcos S., “Multi-meridian corneal imaging of air-puff induced deformation for improved detection of biomechanical abnormalities,” Biomed. Opt. Express 11(11), 6337–6355 (2020). 10.1364/BOE.402402 [DOI] [PMC free article] [PubMed] [Google Scholar]
- 35.Helwig N. E., “Multivariate Linear Regression,” (University of Minnesota, http://users.stat.umn.edu/∼helwig/notes/mvlr-Notes.pdf, 2017).
- 36.Ortiz S., Siedlecki D., Remon L., Marcos S., “Optical coherence tomography for quantitative surface topography,” Appl. Opt. 48(35), 6708–6715 (2009). 10.1364/AO.48.006708 [DOI] [PubMed] [Google Scholar]
- 37.Martinez-Enriquez E., Perez-Merino P., Sun M., Durán-Poveda S., Jiménez-Alfaro I., Marcos S., “Full shape crystalline lens quantification from 3-D OCT images and its application to predict the post-operative IOL position,” Invest. Ophthalmol Visual Sci. 58, 1803 (2017). [Google Scholar]
- 38.Lin R. C., Shure M. A., Rollins A. M., Izatt J. A., Huang D., “Group index of the human cornea at 1.3-µm wavelength obtained in vitro by optical coherence domain reflectometry,” Opt. Lett. 29(1), 83–85 (2004). 10.1364/OL.29.000083 [DOI] [PubMed] [Google Scholar]
- 39.Uhlhorn S. R., Borja D., Manns F., Parel J. M., “Refractive index measurement of the isolated crystalline lens using optical coherence tomography,” Vision Res. 48(27), 2732–2738 (2008). 10.1016/j.visres.2008.09.010 [DOI] [PMC free article] [PubMed] [Google Scholar]
- 40.Bland J. M., Altman D. G., “Statistical methods for assessing agreement between two methods of clinical measurement,” Lancet 327(8476), 307–310 (1986). 10.1016/S0140-6736(86)90837-8 [DOI] [PubMed] [Google Scholar]
- 41.Burd H. J., Judge S. J., Cross J. A., “Numerical modelling of the accommodating lens,” Vision Res. 42(18), 2235–2251 (2002). 10.1016/S0042-6989(02)00094-9 [DOI] [PubMed] [Google Scholar]
- 42.Martin H., Guthoff R., Terwee T., Schmitz K. P., “Comparison of the accommodation theories of Coleman and of Helmholtz by finite element simulations,” Vision Res. 45(22), 2910–2915 (2005). 10.1016/j.visres.2005.05.030 [DOI] [PubMed] [Google Scholar]
- 43.de la Hoz A., Martinez-Enriquez E., Marcos S., “Estimation of crystalline lens material properties from OCT measurements of subjects under accommodation,” In preparation. [DOI] [PMC free article] [PubMed]
- 44.Urs R., Manns F., Ho A., Borja D., Amelinckx A., Smith J., Jain R., Augusteyn R., Parel J. M., “Shape of the isolated ex-vivo human crystalline lens,” Vision Res. 49(1), 74–83 (2009). 10.1016/j.visres.2008.09.028 [DOI] [PMC free article] [PubMed] [Google Scholar]
- 45.Marussich L., Manns F., Nankivil D., Maceo Heilman B., Yao Y., Arrieta-Quintero E., Ho A., Augusteyn R., Parel J. M., “Measurement of Crystalline Lens Volume During Accommodation in a Lens Stretcher,” Invest. Ophthalmol. Visual Sci. 56(8), 4239–4248 (2015). 10.1167/iovs.15-17050 [DOI] [PMC free article] [PubMed] [Google Scholar]
- 46.Ramasubramanian V., Glasser A., “Predicting Accommodative Response Using Paraxial Schematic Eye Models,” Optom. Vis. Sci. 93(7), 692–704 (2016). 10.1097/OPX.0000000000000868 [DOI] [PMC free article] [PubMed] [Google Scholar]
- 47.Mutti D. O., Zadnik K., Fusaro R. E., Friedman N. E., Sholtz R. I., Adams A. J., “Optical and structural development of the crystalline lens in childhood,” Invest. Ophthalmol. Visual Sci. 39(1), 120–133 (1998). [PubMed] [Google Scholar]
- 48.Norrby S., “Sources of error in intraocular lens power calculation,” J. Cataract Refract Surg. 34(3), 368–376 (2008). 10.1016/j.jcrs.2007.10.031 [DOI] [PubMed] [Google Scholar]
- 49.McLeod S. D., Vargas L. G., Portney V., Ting A., “Synchrony dual-optic accommodating intraocular lens. Part 1: optical and biomechanical principles and design considerations,” J. Cataract Refract Surg. 33(1), 37–46 (2007). 10.1016/j.jcrs.2006.09.020 [DOI] [PubMed] [Google Scholar]
- 50.Sheppard A. L., Bashir A., Wolffsohn J. S., Davies L. N., “Accommodating intraocular lenses: a review of design concepts, usage and assessment methods,” Clin. Exp. Optom. 93(6), 441–452 (2010). 10.1111/j.1444-0938.2010.00532.x [DOI] [PubMed] [Google Scholar]
- 51.Mohamed A., Nandyala S., Martinez-Enriquez E., Heilman B. M., Augusteyn R. C., de Castro A., Ruggeri M., Parel J. A., Marcos S., Manns F., “Isolated human crystalline lens three-dimensional shape: A comparison between Indian and European populations,” Exp Eye Res 205, 108481 (2021). 10.1016/j.exer.2021.108481 [DOI] [PMC free article] [PubMed] [Google Scholar]
- 52.Martinez-Enriquez E., De Castro A., Mohamed A., Maceo Heilman B., Williams S., Nandyala S., Ruggeri M., Parel J.-M. A., Augusteyn R., Ho A., Manns F., Marcos S., “3D OCT-based geometrical changes of human crystalline lenses during simulated accommodation in a lens stretcher,” Invest. Ophthalmol Visual Sci. 61, 1713 (2020). [Google Scholar]
- 53.Ruggeri M., Williams S., Heilman B. M., Yao Y., Chang Y. C., Mohamed A., Sravani N. G., Durkee H., Rowaan C., Gonzalez A., Ho A., Parel J. M., Manns F., “System for on- and off-axis volumetric OCT imaging and ray tracing aberrometry of the crystalline lens,” Biomed. Opt. Express 9(8), 3834–3851 (2018). 10.1364/BOE.9.003834 [DOI] [PMC free article] [PubMed] [Google Scholar]
- 54.Martínez-Enríquez E., Curatalo A., de Castro A., et al. , “Estimation of the full shape of the crystalline lens in-vivo from optical coherence tomography images using eigenlenses: data,” Github, 2022, https://github.com/EduardoMartinezEnriquez/Estimation-of-the-full-shape-of-the-crystalline-lens-in-vivo-from-optical-coherence-tomography-image. [DOI] [PMC free article] [PubMed]
Associated Data
This section collects any data citations, data availability statements, or supplementary materials included in this article.
Data Availability Statement
Data underlying the results presented in this paper are available in the “Estimation-of-the-full-shape-of-the-crystalline-lens-in-vivo-from-optical-coherence-tomography-image” repository, [54].


