

Abstract
In countries, where a substantial proportion of retirement income rests on savings, there is much concern that a sizeable fraction of the population reaches retirement with insufficient financial resources. We define saving regret as the wish in hindsight to have saved more earlier in life. We measured saving regret and possible determinants in a survey of U.S. households in which respondents were aged 60–79. We find high levels of saving regret, affirmed by some 58%. Saving regret exhibits significant and plausible correlations with personal characteristics and wealth: Married, older, healthier and wealthier respondents are less likely to report saving regret, suggesting the measure’s validity. We find only weak evidence for correlations between saving regret and measures of procrastination: persons with traits associated with procrastination express saving regret about as often as those without those traits.
Keywords: Retirement saving, procrastination, uncertainty, regret
JEL codes: D91, D83, D84, D14, D15
1. Introduction
In countries such as the U.S. and the UK, where a substantial proportion of retirement income rests on savings, there is concern that a sizeable fraction of the population reaches retirement with insufficient financial resources (Laibson et al., 1998b; Madrian and Shea, 2001; Poterba et al., 2011; Stanford Center on Longevity, 2016). Inadequate or under saving is a prominent explanation for the insufficiency, and a leading explanation for under saving is procrastination (Strotz, 1955; Thaler, 1994; Laibson, 1997; 1998; Angeletos et al., 2001; Choi et al., 2002; Rabin, 2013a; b; Della Vigna and Malmendier, 2006). The perception that under saving is due to procrastination has led to calls for government intervention in the form of defaults, and nudges aim to counteract individuals’ tendencies to procrastinate (Thaler, 1994; Laibson, 1997; 1998; Thaler and Sunstein, 2003; 2009; Lewis, 2008; Chetty et al., 2014).
Procrastination, the tendency to put off decisions or actions that are difficult to perform, may be due to a lack of self-control, short-sightedness, or difficulties navigating the complex intertemporal decisions of saving for retirement (McCarthy, 2011; Beshears et al., 2013; Strömbäck et al., 2017). In hindsight, procrastinators are usually aware of their failure to do what they should have done, in this case, to have saved more earlier in life.1 When looking back and being aware of their procrastination, they will wish they had saved more earlier in life. We will refer to this as expressing “saving regret” as a shorthand in this paper.2 Our central hypothesis of this study is: if procrastination is a quantitatively important driver of saving behavior over the lifecycle, we should find that individuals with a stronger tendency to procrastinate are more likely to express saving regret at older ages.
The study of procrastination has a long history in psychology (Ellis and Knaus, 1977; Ferrari et al., 1995; Steel, 2007), and the discipline has developed scales in which respondents are led to evaluate their propensity to procrastinate and to express a self-awareness of procrastination (Tuckman, 1991; Ferrari et al., 1995). Procrastination in economics has often been interpreted to mean a present bias: procrastinators overweight today’s utility relative to future utility which leads to time inconsistency and to under saving relative to consistent (long-run) preferences. Evidence has come from laboratory experiments, from quasi experiments and from randomized controlled trials (RCTs) such as delays (or failure) to sign up for pensions, or other favorable programs (Brown and Previtero, 2014).
In this paper we provide empirical evidence on the saving behavior that individuals wished they had chosen in hindsight, and how this is related to indicators of procrastination derived from the psychology literature. We fielded surveys in the RAND American Life Panel in which we employed psychometric scales to measure procrastination and in which we asked persons aged 60 to 79 whether, if they were given the chance to live their lives over again, they would have saved more or less earlier in life. We find that saving regret is a prevalent phenomenon among Americans of retirement age: According to our preferred estimate, 58.5 percent of the population aged 60 to 79 wished they had saved more, about 40 percent the same, and only 1.7 percent wished they had saved less. The expression of regret varied across individuals in a manner to be expected if it is a valid measure of relatively unsuccessful saving behavior: those with more wealth or more income are less likely to express regret; those who say they are well prepared to meet their future financial needs are also less likely as are those persons who have skills that facilitate planning and execution of plans. But we found that measures of procrastination as measured by a battery assembled from items taken from the psychology literature explain little of the variation across persons in the expression of saving regret. That is, while population levels of saving regret are high, individuals who characterize themselves as procrastinators have about the same level of regret as those who do not.
Our results are robust to several concerns. It is easy for respondents to wish they had saved more: no difficult action such as reducing consumption is required. In our survey design, described in detail below, we adopted several strategies to minimize the possibility that respondents might construe the saving regret question to be a query for whether they wished to have more wealth. A first indicator that our efforts were successful in this regard is that the prevalence of saving regret in the population was affirmed by far less than 100 percent. Second we established face validity of our regret measure by relating it to other measures that reflect the actual financial situation, such as wealth, income, living standard, and current and expected future expenses, supporting the conclusion that the survey question whether individuals wished to have saved more was not misperceived simply as a query about wishing to have more wealth.
A second concern is that many people experienced shocks such as unemployment, divorce, or bad health over the years which had negative consequences for their financial situation. They may well wish on hindsight they had better prepared for the shocks.3 To account for this, we collected data asking respondents about shocks they have experienced earlier in life and control for them, when examining the role of procrastination.
Third, making saving decisions over a long time horizon is difficult. Life circumstances vary a lot so that it is not easy to learn from others how much to save each period. These difficulties of managing the complexities of intertemporal decisions and the inherent uncertainties may be aggravated for some people by lack of financial knowledge and relevant cognitive skills such as the ability to think probabilistically (Rhea et al., 2006; Bucher-Koenen and Lusardi, 2011; Lusardi and Mitchell, 2014; Hudomiet et al., 2018). We have included indicators of financial planning horizon, financial literacy and probability numeracy scores to control for the corresponding levels of supporting skills.
Furthermore, people may systematically make bad decisions because of over-optimism, illusion of control, overconfidence or similar biases.4 In order to account for these factors, our survey measures included self-perceived personal traits such as optimism, cheerfulness and self-confidence.
Our paper is related to the literature on the adequacy of retirement savings (see, e.g. OECD 2019). One challenge to the assessment of adequacy is to find a benchmark against which to evaluate the situation. A frequently used reference point is the replacement rate, i.e. a certain fixed fraction of pre-retirement income. A second is to find whether a household has sufficient total economic resources to finance its remaining lifetime spending with high probability.5 A third is based on a dynamic programming model derived from economic theory: Scholz et al., (2006) argue that 80 percent of U.S. households are saving optimally. We add a different perspective to this ongoing discussion by asking individuals in or close to retirement to evaluate their own financial situation. This kind of within person evaluation is valuable because it permits the individual to take into account his or her full situation, much of which cannot be observed by an outside investigator. However our measure is not directly a measure of economic preparation for retirement for two reasons. On the one hand, people who are well prepared for retirement may nonetheless express regret because they did not reach their financial goals; an example would be someone who wanted to give a larger bequest than they will be able to; or a highly risk averse person who prefers to have generous buffer stock saving. Some evidence in support of this interpretation is that among those who say they have more than enough financial resources to meet their future needs, 21% expressed saving regret. On the other hand, there are people who are not well prepared but may not express regret. For example, someone who highly valued the spending earlier in life would not want to reduce it. Rather than being a measure of adequacy of economic resources for retirement by some outside standard, saving regret captures individuals’ subjective expression of having fallen short of the financial position they wanted to achieve around retirement and that they could have done more (i.e., saved more and spent less) to achieve that better position.
Our paper also relates to studies which link preference parameters, personal traits and observed procrastinating behavior to actual savings and retirement decisions (Goda et al., 2015; Rha et al., 2006; Clark et al., 2017; Brown and Previtero, 2014 and 2020). None of these papers, however, relates to people’s own assessment whether they have saved sufficiently. In this respect our measure of saving regret is novel and adds an important under researched dimension to the literature.6
Taken together, our findings raise questions about the relative importance of procrastination as a determinant of saving decisions over the lifecycle, and they suggest that research should bring forward other determinants of why people wish they had saved more than they actually did. It is also an important concern for policy makers that some 58 percent of the U.S. population near retirement wished they had saved more, that is they feel they fell short of the financial situation they would have liked to have realized around retirement.
The paper is structured as follows. Section 2 describes data and methods. Section 3 reports prevalence and intensity of saving regret. Section 4 is the core of the paper and measures the correlation between saving regret and indicators of potential explanations for it. Section 5 summarizes our main results.
2. Data and methods
2.1. The Sample
Our data come from the RAND American Life Panel (ALP).7 The ALP maintains a sample of about 6,000 respondents who are interviewed regularly over the Internet. To avoid selection due to lack of Internet access, any participant without such access was provided a laptop or an Internet service subscription. The sample is representative of the U.S. population when applying weights. It has been recruited in several waves over time. Seventy-five percent of the respondents were recruited using probability-based sampling, while 25 percent were recruited through other efforts (Pollard and Blaird, 2017).
We designed ALP survey 455, which was fielded from August through December 2016. In order to validate our results, we fielded a second survey about one and a half years later, see Subsection 3.3. The sample was restricted to those aged 60 or older and the survey was administered only in English. A total of 2,391 ALP panel members were selected to participate; 1,728 completed the survey during the field period, corresponding to a response rate of 72.3 percent. Of these, 90 percent pertain to the probability sample. We confined our analytical sample to those aged 60 to 79 (N=1,590) to reduce potential bias due to differential mortality. On average, participants in our analytic sample are 68 years old.8 The sample size in some analyses is somewhat lower, depending on the covariates used from earlier ALP waves.
The analyses in the paper were performed in STATA 17.0, using the analytic weight commands. RAND ALP constructs weights to adjust the population of completed responses for each survey to be representative of the general U.S. population of the sampled age range. RAND produces raked weights that match a range of population distributions in the Current Population Survey (gender interacted with age, ethnicity, education and household income; and household income interacted with the number of household members). See Pollard and Baird (2017) for further details.
2.2. Questionnaire and Measuring Saving Regret
The questionnaire began with items on socio-demographic and economic characteristics, a battery of questions on psychological factors, including procrastinating behavior, and a set of questions about respondents’ assessment of their income and living standards. Only after that did we ask households whether – looking back to when they were around 45 years old – they wished they had saved more, about the same, or less earlier in their lives if they were given the chance to re-do their saving and spending. See Appendix A for more details on the variables and for the exact wording of critical questions.
Measuring Saving Regret.
We randomly assigned respondents to one of two versions of this question. One was unframed (“would you save more over the years”) and the other, framed. The objective of the framed version was to remind respondents that saving more comes at a price: less consumption. The specific wording was:
Again please think back to when you were around 45 years old. Suppose you could re-do your spending and saving from then to now, would you…
Version A: Save more over the years? / Save about the same over the years? / Save less over the years? (unframed version)
Version B: Spend less and save more over the years? / Spend and save about the same over the years? / Spend more and save less over the years? (framed version)
If respondents answered that they wished they had saved more, there was a follow-up question asking for the categories of goods they would have spent less on. They were also given the opportunity to revise their previous answer and choose “No way I could have cut spending. I could not have saved more.”
Correlates with saving regret.
To establish face validity, we study the correlations of saving regret with personal characteristics such as age, marital status, health, income and wealth, and check whether they have plausible patterns.
Bad outcomes.
To allow for the fact, that some people simply had some bad draws in life, we asked respondents about shocks they experienced earlier in life. Specifically, we asked respondents about events which affected their finances negatively or positively. Examples are unemployment, divorce, bad health, but also inheritances and unexpectedly high returns on their assets.
Psychometrics.
The focus of our study is to understand the correlations between saving regret and two groups of psychological determinants of poor decision making: general personal traits such as over-optimism and over-confidence that lead to biases in decision making, and motivational attitudes that lead to procrastinating behavior. We asked respondents to evaluate themselves along a number of dimensions in an 18-item question battery. This battery was informed by the General Procrastination Scale (GPS), described and validated by Tuckman (1991), and adapted to the setting of our research and the age of the respondents in our sample.9 The battery includes general personal traits (8 items), e.g., “I am a relaxed person” or “I like exciting or risky activities” (strongly agree … strongly disagree), and questions that directly address procrastination and perseverance (10 items), e.g., “How often do you put off things you should do?” or “Do you give up when things get difficult?” (never, sometimes, most of the time, always). The items are detailed in Appendix A.
Skills.
We included questions about the financial planning horizon, financial literacy, and probability numeracy tests to account for the corresponding level of cognitive and financial skills.
2.3. Statistical analyses
In order to test the hypotheses which we outlined in the introduction, we use bivariate comparisons and multivariate analyses based on a linear probability model where the outcome is whether saving regret was reported. Section 3 describes this outcome variable and its variants. In Section 4, where we measure the correlation between saving regret and indicators of potential explanations for it, we combine versions A and B of the saving regret question and apply revisions if respondents indicated that they could not have saved more after all. In these statistical analyses, we first establish face validity, then study alternative explanations until we arrive at our main hypothesis linking procrastination to saving regret.
3. Prevalence and intensity
3.1. Prevalence of Saving Regret
Table 1 presents the prevalence of saving regret among respondents given, respectively, the unframed and the framed formats. For those viewing the unframed format, 66.6 percent said they would save more if they could re-do their earlier life. We did not use the word “regret” in the survey itself, but we will refer to this as “having saving regret” as it appears in hindsight. The percentage of those having saving regret was 60.9 percent when we framed the question by adding that saving more implies spending less. This difference is statistically significant but economically small.
Table 1:
Prevalence (in Percent) of Saving Regret by Framing (N= 1,590), Before and After Revision
| Wish to have | Unframed | Framed | Total | |||
|---|---|---|---|---|---|---|
|
| ||||||
| Before Revision | After Revision | Before Revision | After Revision | Before Revision | After Revision | |
| …saved more | 66.6 | 62.4 | 60.9 | 55.1 | 63.6 | 58.5 |
| …about the same | 32.4 | 36.6 | 36.8 | 42.6 | 34.7 | 39.8 |
| …saved less | 1.1 | 1.1 | 2.3 | 2.3 | 1.7 | 1.7 |
| Total | 100.0 | 100.0 | 100.0 | 100.0 | 100.0 | 100.0 |
|
| ||||||
| N | 776 | 814 | 1590 | |||
Note: Only respondents expressing saving regret were invited to revise. Those who no longer expressed regret were assigned in this table to the category ”wish to have saved about the same.” Data are weighted.
The smallest estimate comes from the framed version after revision: 55.1%. For the detailed analyses, we combined the two samples (with and without framing; Column ‘Total’). In the combined sample, 63.6 percent of the 1,590 respondents voiced saving regret (Column ‘Before Revision’). Saving regret was far from universal: More than a third of the respondents are satisfied with their saving decisions earlier in life (34.7 percent before revision); a very small fraction would have saved less if they could re-do their earlier life (1.7 percent).
3.2. Probing and revision
In our survey design we adopted several strategies to minimize the possibility that respondents might construe the saving regret question to be a query for whether they wished to have more wealth. A first indicator of our efforts being successful in this regard is that the prevalence of saving regret in the population was affirmed by far less than 100 percent. (Table 1). Aside from careful question ordering and framing, we probed respondents who had expressed saving regret to tell us which spending categories would have been targets for reduction in spending earlier in life. The most frequently mentioned targets for spending cuts earlier in life were “car” and “vacation” among men, and “clothing” and “vacation” among women. We included in the list of spending categories that could have been cut the response option “No way I/we could have cut spending. I/we could not have saved more.” If this option was checked we considered this a revision of the respondent’s earlier expression of saving regret. In the unframed version, 6.3 percent of those who voiced saving regret revised their answer, as did 9.5 percent in the framed version of the question, leading to a reduction in the observed levels of saving regret by 4.2 and 5.8 percentage points, respectively.
While probing and giving respondents the opportunity to revise their initial responses resulted in a lower prevalence of saving regret, the prevalence of revisions (6.3 percent and 9.5 percent in the unframed and framed versions, respectively) was small relative to the initial prevalence of saving regret. 58.5 percent voiced saving regret even after probing for specific spending cuts (Column ‘After Revision’). This is our preferred estimate because the probing aims to reduce the likelihood of a casual affirmation which we call “cheap talk.” We will use the 58.5 percent figure as the “population average” in the analyses to be discussed below.
3.3. Validation
The psychological literature on experienced regret provides little guidance to judge whether our measure of the prevalence of saving regret is large or small; whether individuals who express saving regret feel strongly about the regret; whether the reports are stable over time; and how reliable they are. To address these issues, we launched a second survey to provide evidence about whether regret is strong or weak, and to determine whether people have regrets over a wide range of prior choices. If the latter were the case, people who experienced bad outcomes might lack the ability to place themselves ex ante and affirm that a good choice was made previously, given the incomplete knowledge they had at the time. We fielded the second survey in the ALP about one and a half years after the first, partly to the same people and partly to other people. The total sample was 1,376, and the overlap between the two surveys was 1,198 respondents. In the second survey, we only used version B; that is, we reminded respondents that saving more would require that they spend less.
The prevalence of saving regret in the second survey for respondents of the same age range (60–79) was almost the same as in the first survey: 56.8 percent expressed regret after revision in the second survey compared with 55.1 percent after revision in the framed question of the first survey. As far as longitudinal consistency is concerned, 77.3 percent gave the same answer to the main saving regret question in both surveys; 12.2 percent reported saving regret in the earlier survey and said they “would save about the same” in the later survey; and 8.9 percent reported they would “save about the same” in the earlier survey but reported saving regret in the later survey.
3.4. Intensity of regret
In the second wave of data collection we asked respondents about the intensity of their regret:
How strongly do you wish you could redo your spending and saving?
(1 – very strongly, 2- strongly , 3- somewhat strongly, 4- not at all strongly)
Forty one percent categorized their saving regret as “very strong,” 27 percent as “strong,” 24 percent as somewhat strong, and only 7.8 percent as “not strong at all” (Table 2). Thus, about two-thirds of those expressing regret felt strongly about it. Were we to characterize the population prevalence of regret as those feeling strongly or very strongly, the level would be about 40 percent.
Table 2:
Comparing Saving Regret with Other Regrets and Intensity of Regret
| Population Expressing Regret | Intensity of Regret | ||||||
|---|---|---|---|---|---|---|---|
|
| |||||||
| N | In percent | Very Strongly | Strongly | Somewhat Strongly | Not at All Strongly | Total | |
| Spend less and save more | 782 | 56.8 | 41.2 | 26.8 | 24.2 | 7.8 | 100 |
| Get different education | 572 | 41.8 | 39.2 | 29.1 | 29.9 | 1.8 | 100 |
| Spend more time with family | |||||||
| and friends | 489 | 35.7 | 42.7 | 32.5 | 22.6 | 2.2 | 100 |
| Choose different occupation | 404 | 29.5 | 32.4 | 32.9 | 32.3 | 2.4 | 100 |
| Marry differently /or not at all | 352 | 25.7 | 41.7 | 22.0 | 29.1 | 7.3 | 100 |
| Have kids | 166 | 12.1 | 19.7 | 32.4 | 38.7 | 9.2 | 100 |
| Have no/fewer kids | 75 | 5.4 | 20.1 | 26.8 | 29.9 | 23.2 | 100 |
| Other regret | 88 | 6.4 | 54.2 | 29.8 | 15.1 | 0.9 | 100 |
Note: This refers to the subsample of N=1,376 respondents age 60–79 who participated in the second survey. Intensity of regret refers to the subsample of individuals expressing regret. Data are weighted.
3.5. Other regrets
In our second survey we asked in the same format about other subjects of regret related to important decisions in life: “if you could redo your choices would you want to?” Specifically, they were asked if they felt regret with respect to their educational and occupational choices, their family life, the amount of time spent with friends and family, or other areas they could specify freely. In response, 41.8 percent regretted their educational choices, 35.7 percent wished that they had spent more time with family or friends, 29.5 percent regretted their occupational choices, and 25.7 percent regretted their choice of partner (Table 2). Thus, according to our second survey, people expressed regret at a relatively high frequency and across a number of domains. Saving regret was expressed most frequently among all types of regrets discussed.
We compared the prevalence of regret in our survey with that measured in the scarce literature about experienced regret. Morrison and Roese (2011) found that regrets related to partnership and family are the most common (18 percent), less so regrets regarding work and education (14 percent), and even less so regarding finance (10 percent). In contrast, a recent nationwide survey by Bankrate (Bell 2016) found that 75 percent of Americans experience regrets about their retirement savings. The percentage is higher among those of retirement age than among younger people.
4. Correlates of saving regret
We first want to establish the face validity of our regret measure by relating it to other measures that reflect the actual financial situation such as wealth, income, and standard of living. We expect that high-wealth and high-income people have below-average levels of saving regret. Furthermore, we expect that saving regret decreases with age when measured in a cross-section. There are two reasons for this. First, life situations have changed dramatically. Cohorts born in the 40s and 50s have witnessed enormous economic growth, while more recent cohorts have experienced stagnation in wages. In addition, older persons may be more likely content with their current situation than younger ones. These checks for face validity occupy Subsections 4.1-4.3.
Second, we want to condition our subsequent analysis on the fact, that many people simply had a bad draw in life and, in hindsight, wished they had saved more. We expect that individuals are more likely to express saving regret if they had experienced a divorce, a health decline or similar shocks. We therefore condition our subsequent regressions on self-reported indicators of such shocks.
Saving regret may be caused by suboptimal financial decision making. We expect that saving regret is correlated with indicators of such behavior, such as a short financial planning horizon, low financial literacy, and difficulties with the laws of probabilities. Most importantly, we hypothesize that respondents who report a tendency to procrastinate have a higher probability of experiencing saving regret. This is tested in Subsections 4.4-4.6.
We estimate several multivariate regression specifications (Subsection 4.7), using as our measure of saving regret the combination of the framed and unframed versions of the saving regret question after revision. Using results for saving regret before the revision changes the level of regret but not the patterns of correlation reported in the following subsections.
4.1. Correlation with current wealth
A valid measure of saving regret should be related to wealth. Consider two similarly situated individuals who think back to an earlier age, and who in retrospect think of a similar (optimal) target saving rate. The first achieved that target rate and so when asked about redoing his or her saving would not desire to do so; the second did not achieve that target rate and would express a desire to do so. The achieved wealth of the first would be greater than the second. We found that regret was strongly related to economic position, especially wealth itself (Table 3 – Panel A).
Table 3.
Saving Regret and Current and Future Financial Situation
| Saving Regret (After
Revision) |
|||||
|---|---|---|---|---|---|
| N | In percent | Mean | Std. Error | T-test | |
| Panel A. Current wealth and income | |||||
| Wealth quartiles | |||||
| Lowest | 211 | 13.3 | 0.719 | 0.035 | ref |
| 2 | 207 | 13.0 | 0.659 | 0.038 | ns |
| 3 | 210 | 13.2 | 0.554 | 0.033 | *** |
| Highest | 205 | 12.9 | 0.389 | 0.030 | *** |
| Missing | 756 | 47.6 | 0.589 | 0.018 | *** |
| Income quartiles | |||||
| Lowest | 393 | 24.7 | 0.674 | 0.028 | ref |
| 2 | 404 | 25.4 | 0.627 | 0.027 | ns |
| 3 | 379 | 23.8 | 0.568 | 0.025 | *** |
| Highest | 389 | 24.4 | 0.464 | 0.021 | *** |
| Missing | 26 | 1.6 | 0.634 | 0.108 | ns |
|
Panel B. Household income is sufficient to meet spending needs each month | |||||
| Yes, always | 698 | 43.9 | 0.445 | 0.018 | ref. |
| Most of the time | 669 | 42.1 | 0.671 | 0.019 | *** |
| Rarely or never | 223 | 14.0 | 0.765 | 0.031 | *** |
|
Panel C. Financial resources to meet future needs | |||||
| More than enough to meet your future needs | 328 | 20.7 | 0.310 | 0.023 | ref. |
| Just enough to meet your future needs | 522 | 32.8 | 0.589 | 0.021 | *** |
| Not enough to meet your future needs | 238 | 15.0 | 0.792 | 0.027 | *** |
| Not nearly enough to meet your future needs | 132 | 8.3 | 0.826 | 0.036 | *** |
| Uncertain | 273 | 17.2 | 0.617 | 0.032 | *** |
| Don’t know | 96 | 6.0 | 0.563 | 0.061 | *** |
Note: We report the mean of saving regret and the standard error of the mean, pooling respondents across the two question formats for saving regret (unframed and framed). The t-test refers to a t-test of the indicated category vs. the reference category (ref). ns= not significant
p<0.05
p<0.01
p<0.001.
Data are weighted.
This result is confirmed in multivariate analyses which use a linear probability model where the outcome was whether saving regret was reported (results reported in Appendix C). Respondents in the highest wealth quartile have significantly less saving regret than those with less wealth. We note that, even among those in the highest wealth quartile, 38.9 percent expressed saving regret; among those in the lowest wealth quartile, 71.9 percent did so.
We found similar, albeit weaker, correlations with income. The stronger correlation with wealth than with income is to be expected because wealth itself is a measure of prior saving.
4.2. Adequacy of financial resources
Whether the level of current wealth is sufficiently high to prevent saving regret depends on current and future needs. We therefore asked our respondents first whether their present income is sufficient for their present needs (Table 3 – Panel B). Overall, 43.9 percent reported that income is always sufficient to meet present needs; yet, 44.5 percent of that group wished they had saved more.
This finding also points to the role of uncertainty. Whether present income is sufficient for present needs is known largely from day-to-day experience. But the amount of wealth needed for future spending needs is uncertain. We addressed that issue by asking whether respondents’ financial resources are adequate for future needs (Table 3 – Panel C). Notably, about 23 percent answered either “uncertain” or “don’t know,” reflecting the difficulty of predicting future needs due to uncertainties about both future shocks and future tastes for consumption over a long retirement period. About 23 percent said that their financial resources are not enough or not nearly enough to meet future needs, and around 80 percent of these respondents had saving regret. We therefore find the same very strong relationship between adequate resources and saving regret. Yet, among those with “more than enough” financial resources to meet future needs, some 31 percent still wished they had saved more.
4.3. Saving Regret by Socio-Demographic, Health, and Financial Status
Overall, the correlations between saving regret and socio-demographic and financial variables are strong (Column 4 in Table 4).
Table 4.
Saving Regret by Sociodemographic Characteristics
| Saving Regret (After
Revision) |
|||||
|---|---|---|---|---|---|
| N | In percent | Mean | Std. Error | T-test | |
| Total | 1590 | 100.0 | 0.585 | 0.012 | |
|
| |||||
| Gender | |||||
| Male | 741 | 46.6 | 0.567 | 0.018 | ref |
| Female | 849 | 53.4 | 0.601 | 0.017 | ns |
|
| |||||
| Age | |||||
| 60–64 | 528 | 33.2 | 0.649 | 0.020 | ref |
| 65–69 | 478 | 30.1 | 0.634 | 0.021 | ns |
| 70–74 | 310 | 19.5 | 0.549 | 0.028 | *** |
| 75–79 | 274 | 17.2 | 0.417 | 0.037 | *** |
|
| |||||
| Marital status | |||||
| Married | 997 | 62.7 | 0.571 | 0.016 | ref |
| Separated or divorced | 278 | 17.5 | 0.673 | 0.026 | *** |
| Widowed | 221 | 13.9 | 0.518 | 0.038 | ns |
| Never married | 93 | 5.9 | 0.622 | 0.045 | ns |
|
| |||||
| Education level | |||||
| HS or less | 739 | 46.5 | 0.607 | 0.031 | ref |
| some coll or degr | 391 | 24.6 | 0.652 | 0.020 | ns |
| BA,BS | 223 | 14.0 | 0.534 | 0.026 | ** |
| MA etc. to PhD | 238 | 15.0 | 0.453 | 0.026 | *** |
|
| |||||
| Poor self-reported health | |||||
| No | 1202 | 75.6 | 0.543 | 0.014 | ref |
| Yes | 388 | 24.4 | 0.715 | 0.026 | *** |
|
| |||||
| Memory problems | |||||
| No | 1394 | 87.7 | 0.574 | 0.013 | ref |
| Yes | 196 | 12.3 | 0.666 | 0.038 | ** |
Note: We report the mean of saving regret and standard error of the mean, pooling respondents across the two question formats for saving regret (unframed and framed). The t-test refers to a t-test of the indicated category vs. the reference category (ref). ns= not significant
p<0.05
p<0.01
p<0.001
Data are weighted.
The fraction reporting that they should have saved more was higher for those who are younger; have separated or divorced; and have a low socio-economic status measured in terms of education. Respondents self-reporting fair or poor health also expressed saving regret more often. These bivariate correlations are confirmed in the multivariate regression analysis (Table 8).
4.4. Supporting Skills for Optimal Financial Decision Making
Optimal financial decision making requires several supporting skills, such as planning for the future, financial literacy and some mastery of probabilities (Hung et al. 2009). People who are deficient in these skills may be more likely to express saving regret, because of their lower ability to manage the complexities of intertemporal decisions and the inherent uncertainties.
We merged information from other ALP waves about the financial planning horizon (N= 1,207), financial literacy (N=921), and probability numeracy (N=1,056) (see Table 5).10
Table 5:
Saving Regret, Financial Planning, Financial Literacy, and Probability Numeracy
| Saving Regret (After
Revision) |
|||||
|---|---|---|---|---|---|
| N | In percent | Mean | Std.Error | T-test | |
| Financial Planning Horizon | |||||
| I don’t plan | 70 | 4.4 | 0.680 | 0.071 | ns |
| Next few months | 234 | 14.7 | 0.648 | 0.034 | ref |
| Next year | 155 | 9.7 | 0.640 | 0.040 | ns |
| Next few years | 299 | 18.8 | 0.593 | 0.029 | ns |
| Next 5–10 years | 260 | 16.3 | 0.565 | 0.029 | ns |
| Longer than 10 years | 189 | 11.9 | 0.508 | 0.034 | *** |
| Missing | 384 | 24.1 | 0.552 | 0.025 | ** |
|
| |||||
| Financial Literacy | |||||
| 0 correct answers | 69 | 4.3 | 0.747 | 0.068 | ref |
| 1 correct answer | 132 | 8.3 | 0.737 | 0.045 | ns |
| 2 correct answers | 268 | 16.9 | 0.687 | 0.030 | ns |
| 3 correct answers | 452 | 28.4 | 0.556 | 0.020 | *** |
| Missing | 669 | 42.1 | 0.517 | 0.020 | *** |
|
| |||||
| Probability Numeracy | |||||
| 0 or 1 correct answers | 146 | 9.2 | 0.505 | 0.045 | ref. |
| 2 correct answers | 272 | 17.1 | 0.659 | 0.03 | *** |
| 3 correct answers | 491 | 30.9 | 0.581 | 0.021 | ns |
| 4 correct answers | 147 | 9.2 | 0.461 | 0.033 | ns |
| Missing | 534 | 33.6 | 0.607 | 0.024 | ** |
Note: We report the mean of saving regret and the standard error of the mean, pooling respondents across the two question formats for saving regret (unframed and framed). The t-test refers to a t-test of the indicated category vs. the reference category (ref). ns= not significant
p<0.05
p<0.01
p<0.001
Financial planning, financial literacy and probability numeracy were merged from other ALP surveys. That is why we have missing values for individuals who did not participate in both survey waves. Data are weighted.
Respondents have substantially different financial planning horizons: 4.4 percent stated that they do not plan and 14.7 percent only planned for the next couple of months. Yet, 16.3 percent of respondents planned for the next five to ten years and 11.9 percent for more than ten years. The financial planning horizon and saving regret are significantly correlated. Saving regret was highest among respondents who stated that they do not have a financial plan (68.0 percent) or who only planned for the next few months (64.8 percent). It declines monotonically with the length of the planning horizon: among respondents with a planning horizon that exceeds ten years, 50.8 percent expressed saving regret.
The relationship between saving regret and financial literacy is also strong in the bivariate analysis (Table 5). Respondents who scored highest on financial literacy (i.e. they answered all three financial literacy questions correctly) had significantly lower saving regret (55.6 percent) compared to those who scored low on financial literacy (74.0 percent among those answering 0 or 1 financial literacy question correctly).
4.5. Personal traits
There are several personal traits that are usually assumed to be relatively stable over time and that affect saving behavior.11 Examples are optimism/pessimism, self-confidence, openness for change, and risk aversion. Figure 1 (Appendix Table A2) displays how saving regret is related to eight items that measure such personal psychological characteristics. The questions on psychological factors were asked before the saving regret question in the course of the interview.
Figure 1. Significance and monotonicity of personal traits.
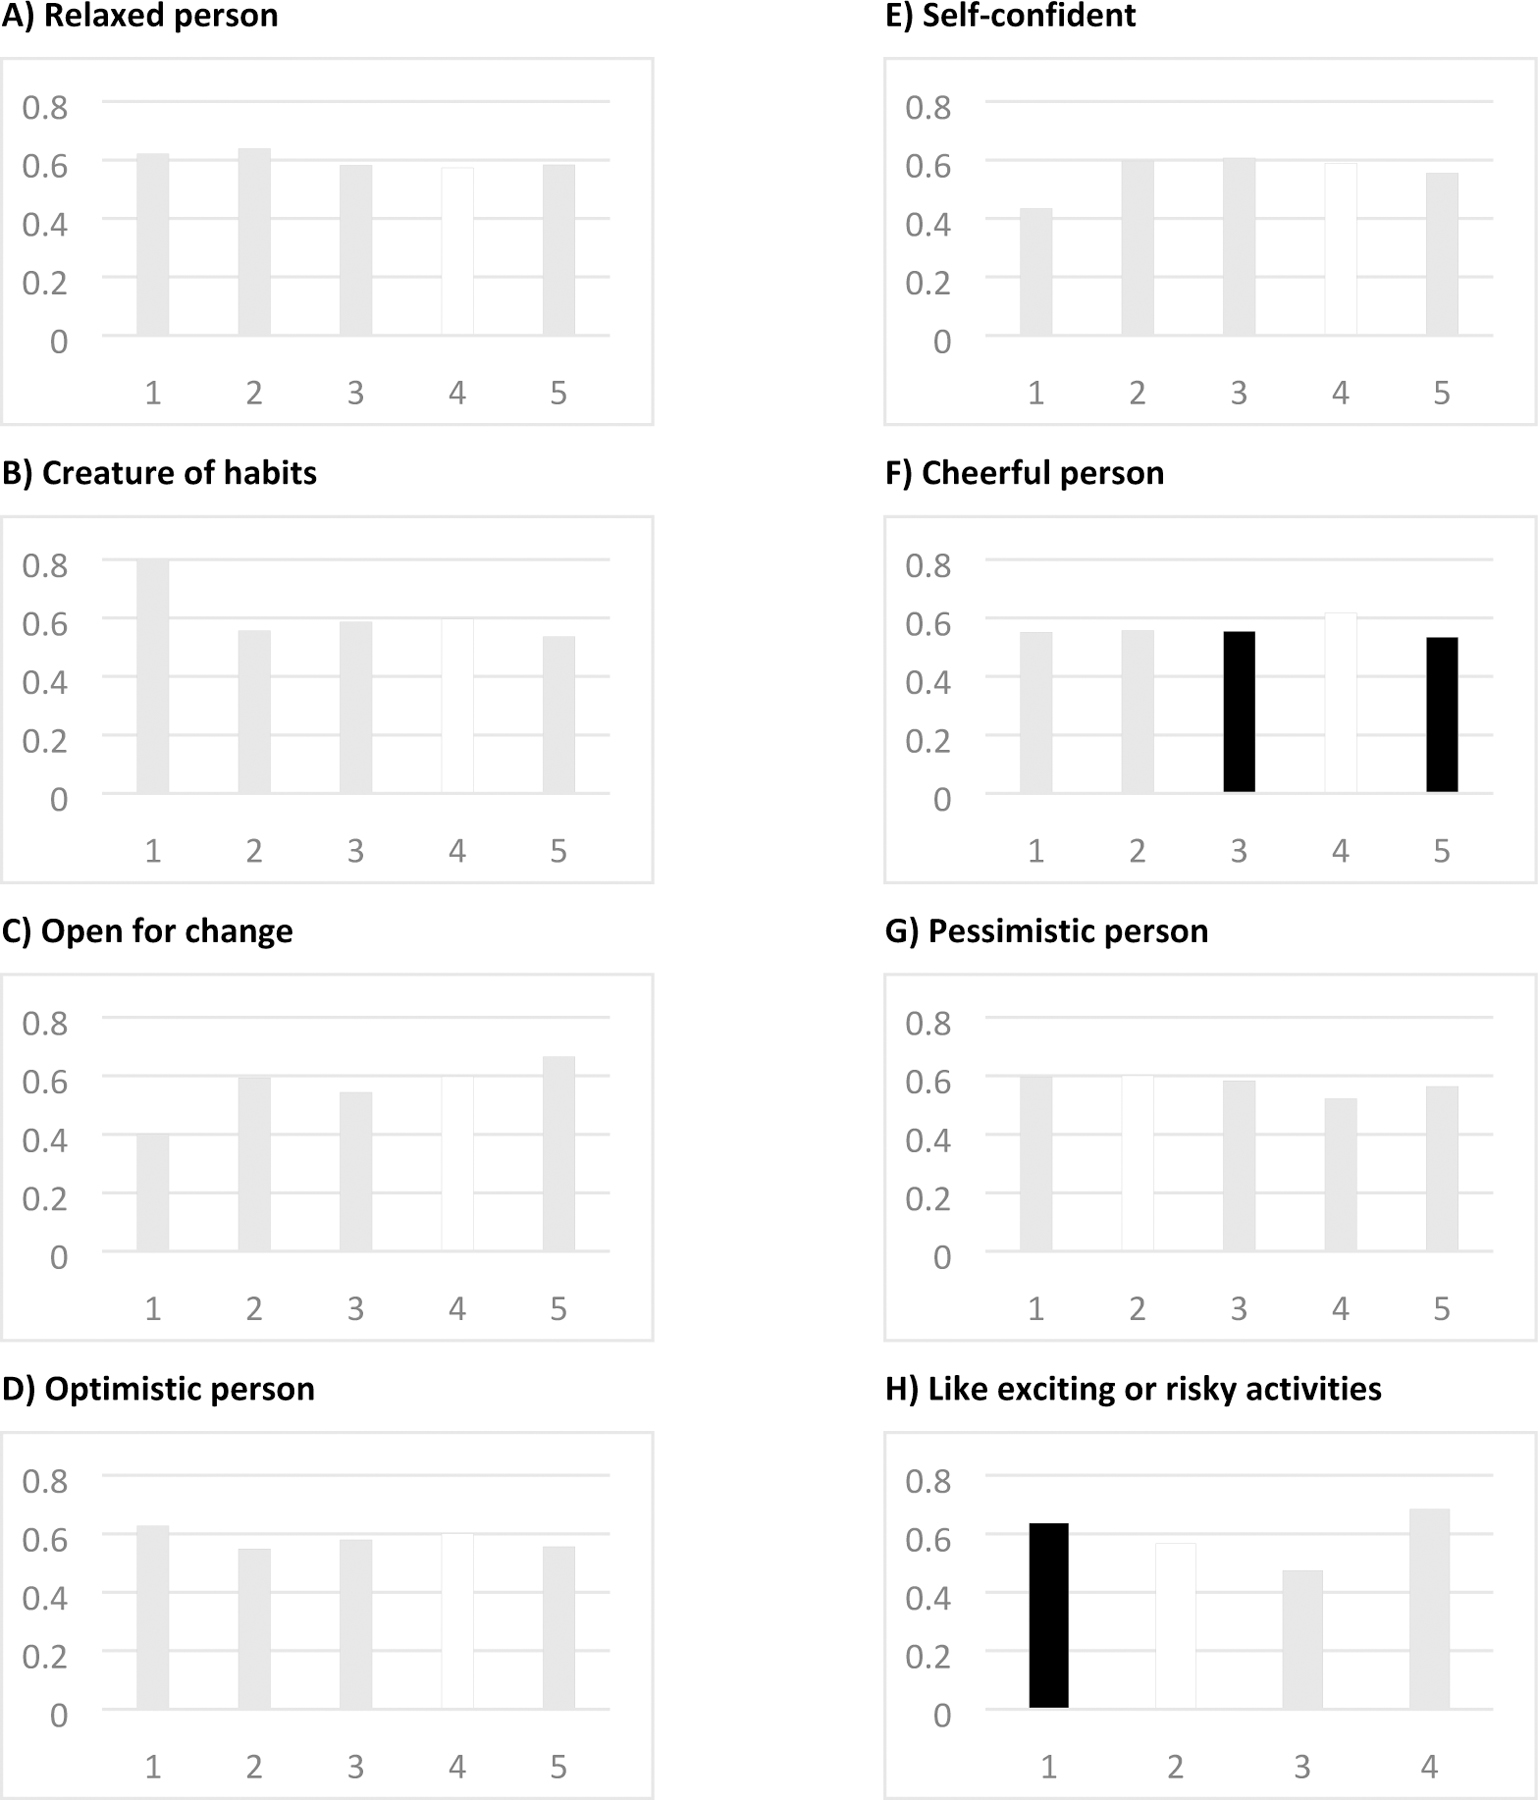
Notes: Vertical axis shows the percentage of respondent who report saving regret.
Answer categories for items A through G are: 1=Strongly disagree, 2=Disagree, 3=Neither agree or disagree, 4=Agree, 5=Strongly agree.
Answer categories for item H are: 1=Never, 2=Some-time, 3=Most of the time, 4=Always
White bars indicate the most prevalent category, which serves as the reference group. Black bars indicate a statistically significant difference from the most prevalent category at level < 0.05.
If these items had a systematic influence on saving regret, we would expect to see a monotonic pattern, e.g., from strongly agreeing to be a person with a certain characteristic to strongly disagreeing with it. Figure 1 therefore shows each category of agreement separately. However, most items do not exhibit such monotonicity. Moreover, most of the items turn out to be statistically insignificant in their influence on saving regret.12 We conclude that there is quite limited and scattered systematic variation in saving regret with these psychometric variables. One may suspect that even though each item is only weakly or not at all significant, the entire group of personal traits does contribute significantly to explaining saving regret. This will be addressed in Section 4.7, in which we use multivariate regression analysis to assess the joint significance of these variables.
4.6. Procrastination and perseverance
Figure 2 (Appendix Table A3) displays how saving regret is related to ten measures of procrastination and perseverance. We pursue the same strategy as in the previous subsection, depict each category of a measure separately, then assess monotonicity and statistical significance. The ten items are designed to indicate whether individuals are able to follow through on their plans, are perseverant in pursuing their aims, or rather act spontaneously. The underlying conjecture is that saving regret could emerge from individuals’ inability to plan ahead and save sufficiently for their old age. These questions were also asked before the saving regret question in the course of the interview.
Figure 2. Significance and monotonicity of procrastination indicators.
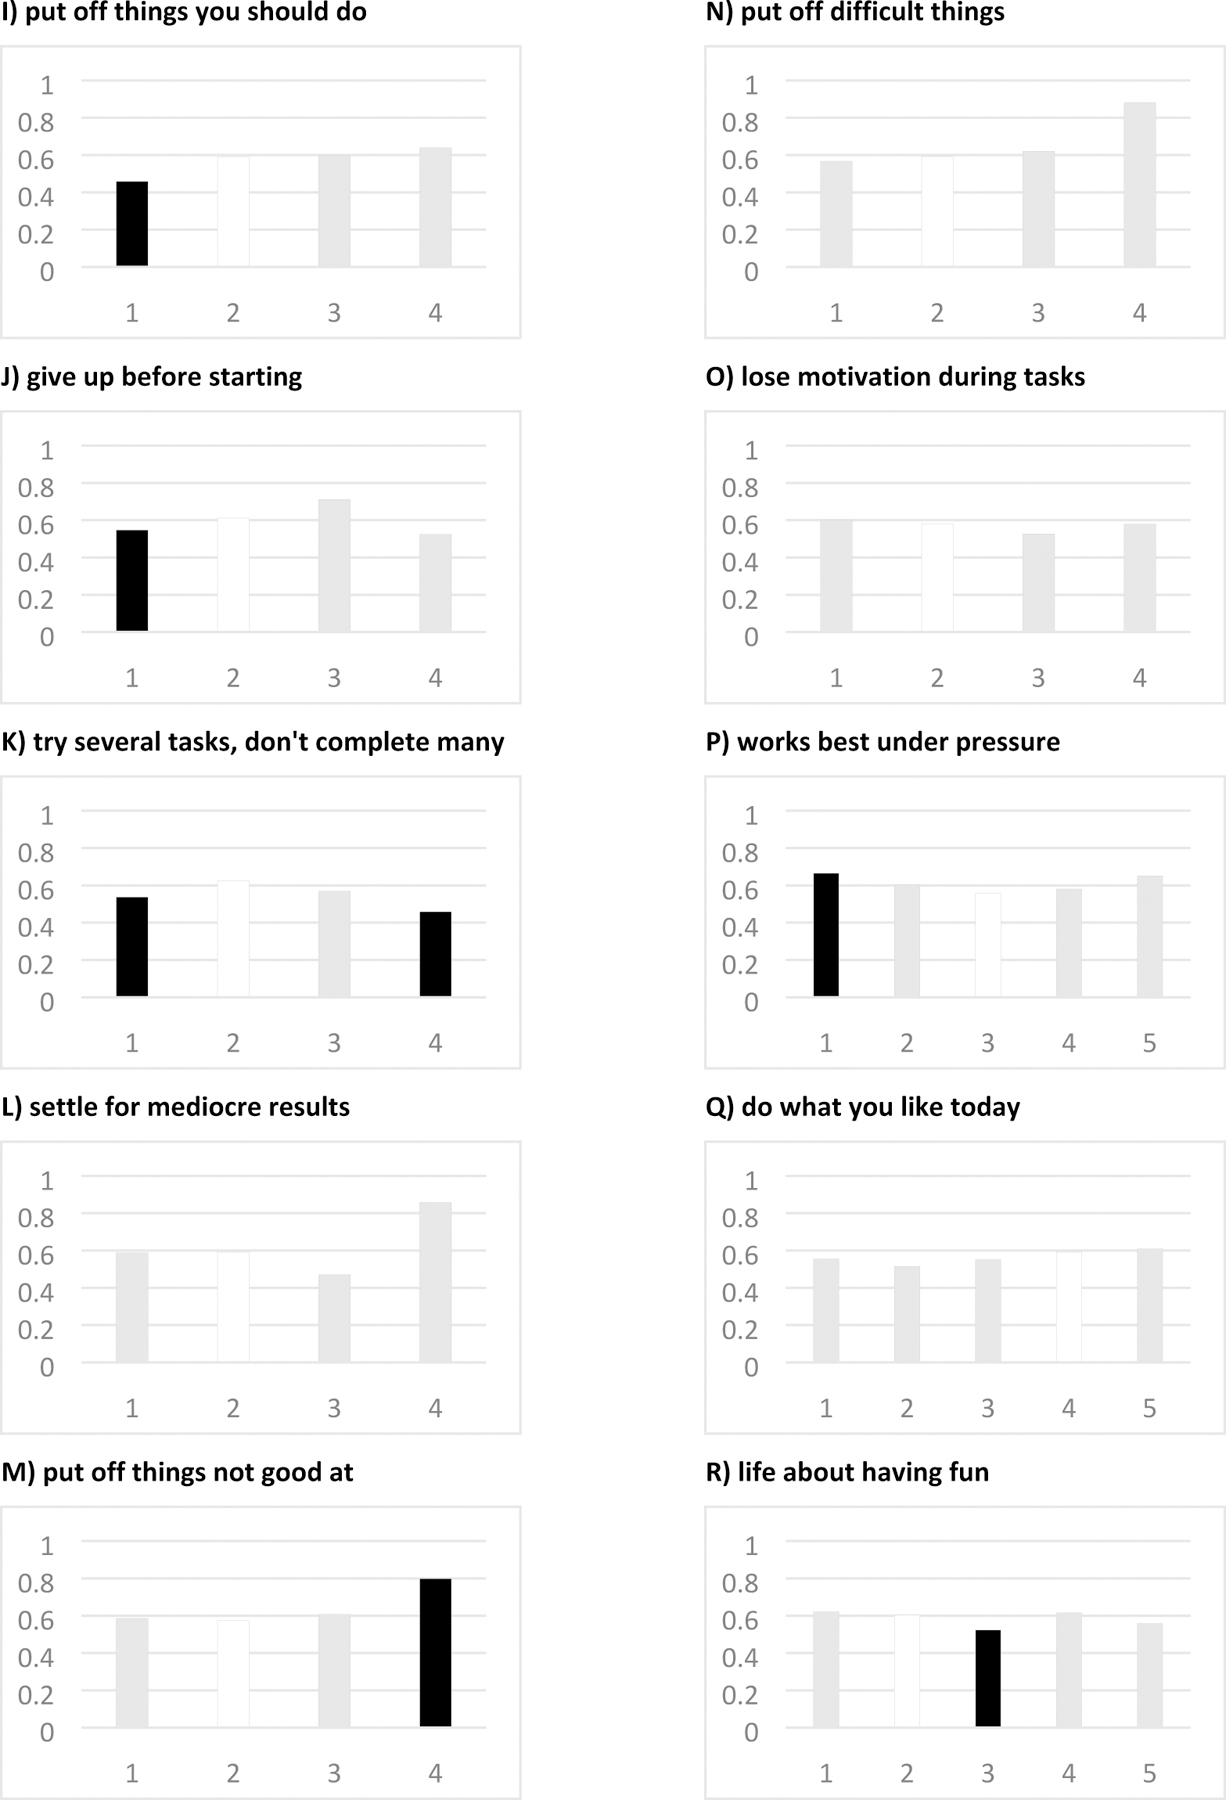
Notes: Vertical axis shows the percentage of respondent who report saving regret.
Answer categories for items I through O are: 1=Never, 2=Some-time, 3=Most of the time, 4=Always
Answer categories for items P through R are: 1=Strongly disagree, 2=Disagree, 3=Neither agree or disagree, 4=Agree, 5=Strongly agree. White bars indicate the most prevalent category, which serves as the reference group. Black bars indicate a statistically significant difference from the most prevalent category at level < 0.05.
In light of the emphasis on procrastination as an explanation of inadequate saving, as pointed out in the introduction, the results in Figure 2 are surprising. For most measures of procrastination and perseverance the fraction reporting saving regret across response categories is not statistically different at conventional levels of significance, and in the few cases where there are statistically significant differences, there is no consistently monotonic gradient.
Taken together, the few significant results do not provide convincing evidence for a substantial influence of procrastination and perseverance on saving regret. While item I (“put things off you should do”) exhibits substantial variation between “never” and the other categories, just 5 percent of respondents never “put things off.” It is worth noting that Item J (“give up before starting”) has considerable variation in average saving regret across the three categories that comprise 99.5 percent of the sample, even if the remaining 0.5 percent do not follow the same pattern. Particularly the first two categories display considerable discriminatory power: approximately half the sample is in each category, and the average saving regret varies by 6.4 percentage points. For respondents who answer “always” for items M and N (“put off things not good at” and “put off difficult things”), there is a significant association with saving regret, but only 1.5 and 0.7 percent, respectively, of respondents are in these categories.
We conclude that the variation in saving regret with the measures of procrastination and perseverance is limited and unsystematic. These items would, according to their plain language, address procrastination; yet, among the ten items, there is really only one that suggests procrastination leads to saving regret.13
4.7. Multivariate regressions
As a final step of our analysis, we employ multivariate regressions in order to account for correlations among the variables and to assess the joint explanatory power of the variable groups discussed so far. Figure 3 and Table 6 show the results of a linear probability model. The dependent variable is whether the respondent expresses saving regret, where we combined versions A and B of the saving regret question and applied revisions if respondents decided to do so. The explanatory variables are demographics, income measured in quartiles, skill indicators, indicators for shocks, and the two groups of psychological factors (personal traits and indicators for procrastinating behavior). We follow the idea that saving regret should be monotonously increasing in some of these indicators and decreasing in others. They are thus entered as scalars.
Figure 3.
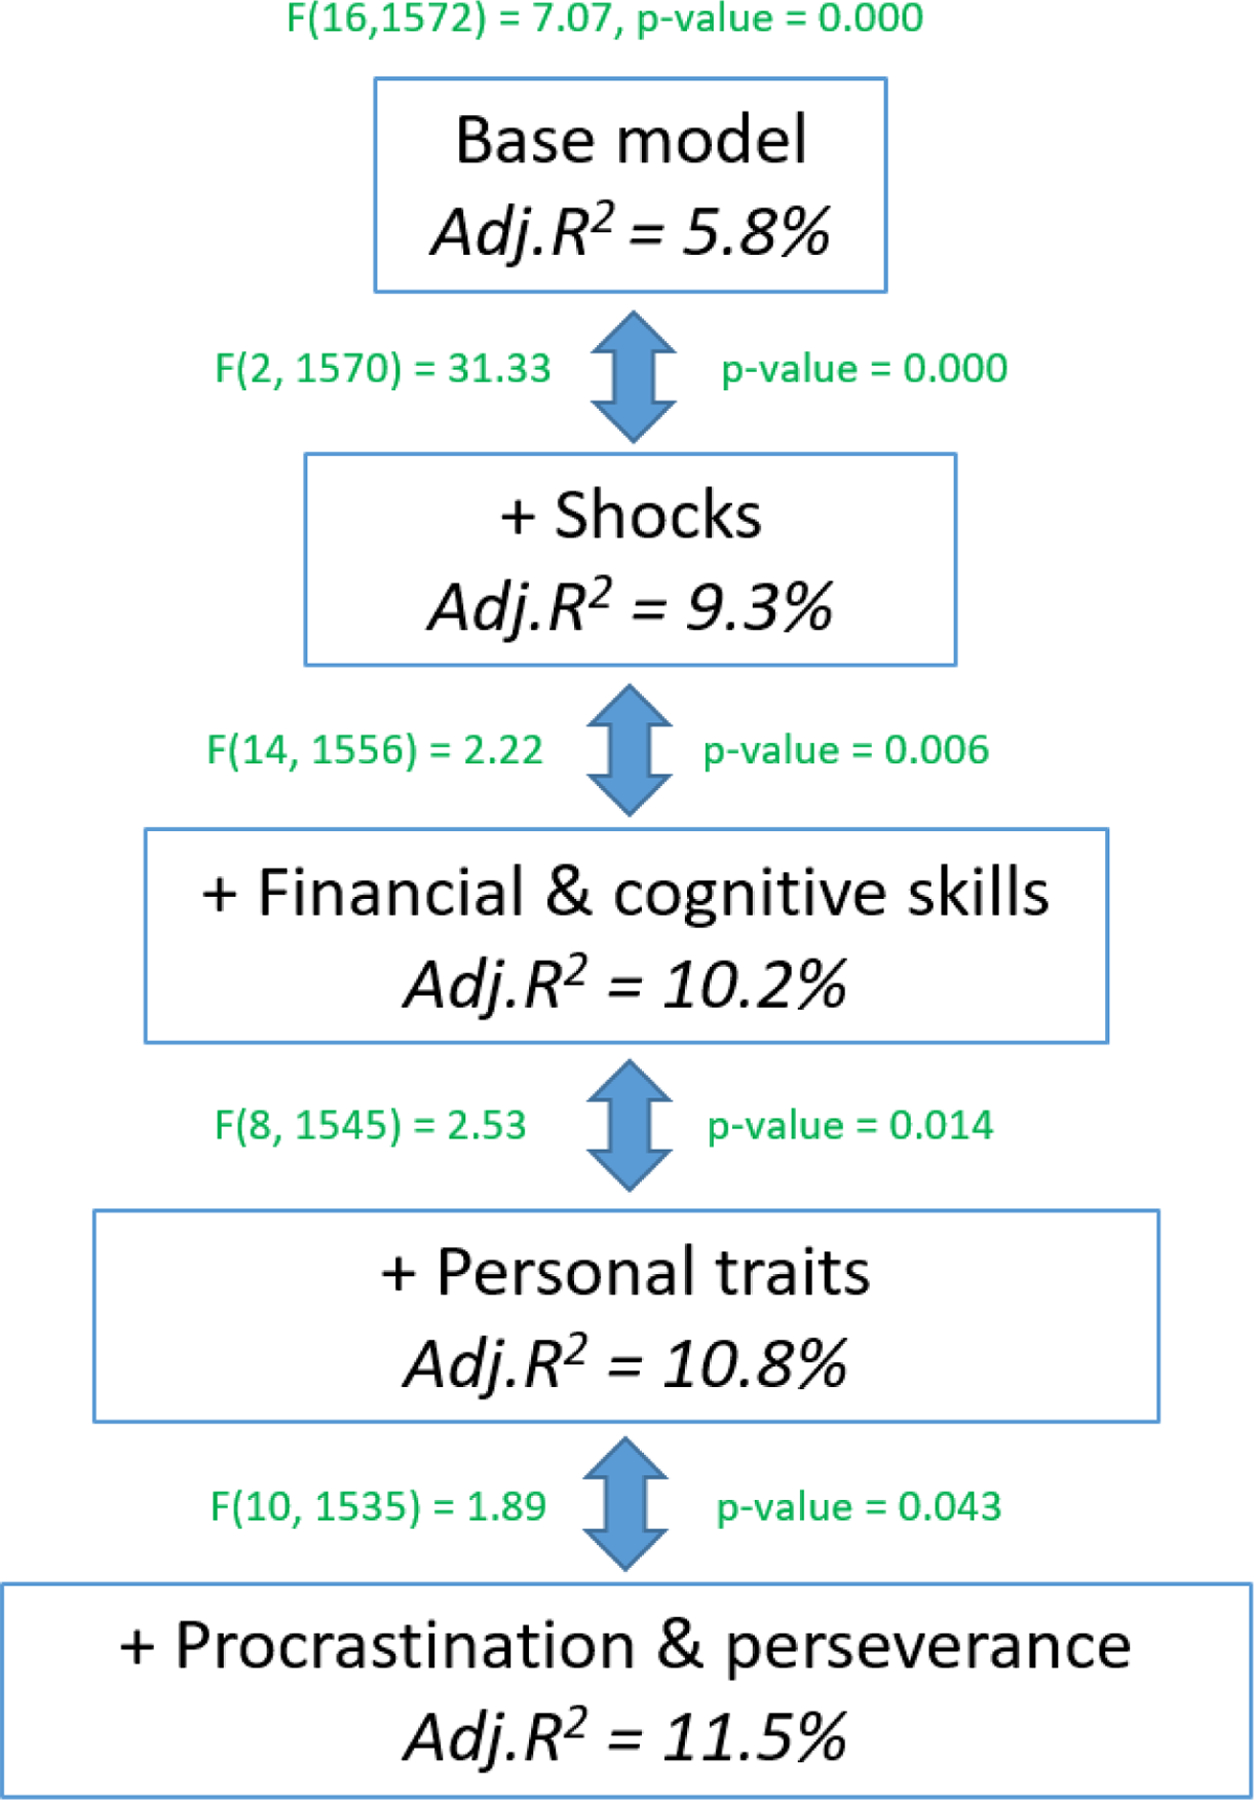
Additional contribution of variable groups
Table 6:
Linear probability model. Effect on Probability of Expressing Saving Regret
| (1) | (2) | (3) | (4) | (5) | |
|---|---|---|---|---|---|
| Age: 60–64 (Ref.) | |||||
| Age: 65–69 | −0.037 | −0.020 | −0.020 | −0.018 | −0.017 |
| (0.029) | (0.029) | (0.029) | (0.029) | (0.029) | |
| Age: 70–74 | −0.095** | −0.060 | −0.05 | −0.050 | −0.049 |
| (0.034) | (0.033) | (0.035) | (0.035) | (0.035) | |
| Age: 75–79 | −0.201*** | −0.162*** | −0.154** | −0.148** | −0.145** |
| (0.042) | (0.041) | (0.048) | (0.048) | (0.048) | |
| Female | −0.02 | −0.018 | −0.020 | −0.035 | −0.043 |
| (0.025) | (0.025) | (0.025) | (0.026) | (0.026) | |
| Spouse | −0.066* | −0.029 | −0.020 | −0.021 | −0.019 |
| (0.026) | (0.026) | (0.026) | (0.026) | (0.026) | |
| High school or less (Ref.) | |||||
| (some) College education | 0.060 | 0.045 | 0.041 | 0.028 | 0.024 |
| (0.037) | (0.037) | (0.037) | (0.037) | (0.037) | |
| Bachelor’s degree | −0.007 | −0.006 | 0.004 | −0.015 | −0.017 |
| (0.042) | (0.041) | (0.042) | (0.042) | (0.042) | |
| Master’s degree or higher | −0.074 | −0.068 | −0.047 | −0.071 | −0.071 |
| (0.043) | (0.043) | (0.044) | (0.045) | (0.045) | |
| Income (lowest quartile) (Ref.) | |||||
| Income (2nd quartile) | −0.009 | −0.002 | 0.005 | 0.008 | 0.006 |
| (0.040) | (0.039) | (0.039) | (0.039) | (0.039) | |
| Income (3rd quartile) | −0.018 | 0.016 | 0.027 | 0.02 | 0.009 |
| (0.038) | (0.038) | (0.038) | (0.039) | (0.039) | |
| Income (highest quartile) | −0.104** | −0.047 | −0.035 | −0.042 | −0.054 |
| (0.039) | (0.039) | (0.039) | (0.039) | (0.040) | |
| Income (missing) | −0.155 | −0.116 | −0.118 | −0.119 | −0.143 |
| (0.111) | (0.110) | (0.110) | (0.110) | (0.110) | |
| Black | 0.078 | 0.072 | 0.061 | 0.048 | 0.033 |
| (0.049) | (0.049) | (0.050) | (0.050) | (0.051) | |
| Hispanic | 0.102* | 0.106* | 0.096 | 0.085 | 0.075 |
| Poor self-rated health | (0.050) | (0.050) | (0.050) | (0.050) | (0.051) |
| 0.113*** | 0.068* | 0.075* | 0.090** | 0.096** | |
| (0.034) | (0.034) | (0.034) | (0.035) | (0.035) | |
| Poor self-rated memory | −0.029 | −0.04 | −0.04 | −0.035 | −0.047 |
| (0.044) | (0.043) | (0.043) | (0.043) | (0.044) | |
|
Self-perceived personal traits | |||||
| A) relaxed person | −0.019 | −0.016 | |||
| (0.015) | (0.015) | ||||
| B) creature of habits | 0.015 | 0.015 | |||
| (0.015) | (0.015) | ||||
| C) open for change | 0.057*** | 0.054** | |||
| (0.017) | (0.017) | ||||
| D) optimistic person | 0.006 | 0.004 | |||
| (0.021) | (0.021) | ||||
| E) self-confident | −0.019 | −0.026 | |||
| (0.018) | (0.018) | ||||
| F) cheerful person | 0.006 | 0.005 | |||
| (0.021) | (0.021) | ||||
| G) pessimistic person | −0.025 | −0.029 | |||
| (0.015) | (0.015) | ||||
| H) like exciting or risky activities | −0.029 | −0.034 | |||
| (0.020) | (0.020) | ||||
|
Procrastination and perseverance | |||||
| I) put off things you should do | 0.042 | ||||
| (0.027) | |||||
| J) give up before starting | −0.005 | ||||
| (0.025) | |||||
| K) try several tasks, don’t complete many | 0.057** | ||||
| (0.021) | |||||
| L) settle for mediocre results | −0.021 | ||||
| (0.025) | |||||
| M) put off things not good at | −0.009 | ||||
| (0.024) | |||||
| N) put off difficult things | 0.027 | ||||
| (0.026) | |||||
| O) lose motivation during tasks | −0.039 | ||||
| (0.027) | |||||
| P) works best under pressure | 0.035** | ||||
| (0.013) | |||||
| Q) do what you like today | 0.019 | ||||
| (0.015) | |||||
| R) life about having fun | −0.020 | ||||
| (0.013) | |||||
|
| |||||
| Constant | 0.695*** | 0.618*** | 0.565*** | 0.543*** | 0.376* |
| (0.052) | (0.054) | (0.101) | (0.159) | (0.182) | |
| Numeracy, Financial literacy, Planning | X | X | X | ||
| Financial shocks | X | X | X | X | |
| N | 1589 | 1589 | 1589 | 1586 | 1586 |
| Adj. R-squared | 0.058 | 0.093 | 0.102 | 0.108 | 0.115 |
Note:
p<0.05
p<0.01
p<0.001
We report five specifications with an increasing number of explanatory variables. The base model (column 1 in Table 6) includes demographics and income only. We then account for shocks and skills as background variables (columns 2 and 3). The contributions of each variable group to the overall explanatory power are assessed by their joint statistical significance, measured by F-tests.14 This is depicted in Figure 3. It shows that accounting for experienced shocks and the respondent’s skill level is important (p<0.001 and p=0.006, respectively).
We then include the indicators of personal traits into the regression. While the personal traits as a group add significantly to the explanatory power of the linear probability model (Figure 3, p=0.014), only item C (“open for change”) shows a significant influence on saving regret in the multivariate regression (Column 4 in Table 6, p<0.01).
The final step is to add the indicators that measure procrastination and perseverance to the model. They contribute only weakly to the explanatory power of the model (Figure 3, p=0.043). Only the items K and P (“try several tasks, don’t complete many” and “works best under pressure”) are statistically significant (Column 5 in Table 6, p<0.01).
We performed several robustness checks. The coefficients in Table 6 do not change in any meaningful way if wealth quartiles are added to the regression (Appendix Table A4). One may suspect that the many items describing personal traits, procrastination and perseverance are highly correlated with each other such that the contribution of each single item cannot be measured precisely. However, in a regression with only those variables that can clearly be attributed to procrastination (items I, J, K, M, N, and O) and without all other personal traits, the significance levels for the indicators of procrastination are even lower. Moreover, the lack of significance of the indicators that measure procrastination and perseverance remains if they are entered as categorical variables rather than as scalars.
5. Conclusions
Our study produced two main results. The first is that saving regret is prevalent among Americans aged 60–79, with most individuals feeling strongly about this regret. This finding is important because it indicates that a majority of Americans near retirement express dissatisfaction with their achieved financial situation. Although we cannot completely rule out that respondents were not serious about wishing they had saved more in our surveys, because wishing is easy, the variation of saving regret with observable measures of financial well-being establishes face validity of the answers to that question. In particular, (1) wealthier and income richer individuals have less saving regret; (2) married individuals have less saving regret than divorced or never married individuals; (3) older persons and earlier cohorts have less saving regret than those born later; (4) healthy people have less saving regret than those with health problems.
Our second result is that we find little evidence to support the hypothesis that procrastination and a lack of perseverance explain a substantial share of the variation in saving regret. In fact, two groups of psychological factors (personal traits and indicators for procrastinating behavior) exhibit only limited and quite unsystematic variation with the extent of saving regret. This holds especially for those items that, according to their plain language, appear perfectly in line with the definition of procrastination and lack of perseverance. In the bivariate analysis, the variable with the strongest statistical evidence that procrastination leads to saving regret is the item “give up before starting”; the very same item, however, turns out to be insignificant in the linear probability model, while the only significant items in the linear probability model (“try several tasks, don’t complete many” and “works best under pressure”) exhibit non-monotonicity in the bivariate analysis. Moreover, adding the battery of indicators that measure procrastinating behavior to the regression adds only very little explanatory power to the model. In the multivariate analysis we controlled for the occurrence of negative shocks by including a set of indicator variables for such shocks. Similarly, we accounted for a set of financial and cognitive skills. As may be expected, shocks and skills contribute significantly to the explanatory power in the multivariate model.
Several caveats apply. Our data are largely cross-sectional, although we have a small panel component that confirms the stability of the regret measure. Shocks are self-reported and may not be recollected accurately. We would attach more confidence to results based on longitudinal data where desired saving, actual saving and procrastinating traits can be observed ex ante and then saving regret observed ex post. Moreover, our indicators for the tendency to procrastinate are measured shortly before or after retirement, assuming that it is a stable personal trait over the entire life course. If this were not the case, then we would need measures of procrastination that are elicited at various ages during the life cycle.
The weak evidence on the role of procrastination and perseverance opens avenues for further research. What are the main drivers of this phenomenon and what policy levers could facilitate more people reaching retirement with the confidence that they have saved enough for retirement? Deeper analyses are required to shed more light on the role of unanticipated shocks; informational barriers; the inability to assess ex ante how much saving should be undertaken; and lack of organizational or informational skills.
At this stage, we cannot draw firm policy conclusions. Determining a satisfactory saving rate in an uncertain environment over the lifecycle is a difficult problem, so it should not be surprising that many persons would wish to re-do some of their decisions. Remedies could be information or simple planning tools. Defaults may have a place. Moreover, the role of unanticipated shocks and their relatively large explanatory power may lead to more general policy conclusions. If unanticipated shocks drive a large part of the failure to save sufficiently over the life course, social insurance may have a greater role than self-insurance mechanisms when we want to ascertain a satisfactory level of saving later in life.
Supplementary Material
Acknowledgments
We thank Laura Carstensen, Margie Lachmann, Andrew Parker, Lee Ross, and participants of workshops held at the NBER, the Michigan Retirement Research Center, at the NETSPAR Pension Workshop and the ASSA meetings, the editors and reviewers for helpful discussions. Hurd and Rohwedder gratefully acknowledge funding from the National Institute on Aging (P01 AG008291) for research support and data collection. Additional funding for data collection came from the Max Planck Society. Joanna Carroll provided excellent programming assistance. The data of the first saving regret survey is accessible at https://alpdata.rand.org/index.php?page=data&p=showsurvey&syid=455. The data of the second saving regret survey is accessible at https://alpdata.rand.org/index.php?page=data&p=showsurvey&syid=487. To register for data access visit https://www.rand.org/research/data/alp/data-access.html.
Footnotes
Publisher's Disclaimer: This is a PDF file of an unedited manuscript that has been accepted for publication. As a service to our customers we are providing this early version of the manuscript. The manuscript will undergo copyediting, typesetting, and review of the resulting proof before it is published in its final form. Please note that during the production process errors may be discovered which could affect the content, and all legal disclaimers that apply to the journal pertain.
This hindsight view of “being aware” of past procrastinating behavior differs from the contemporaneous view taken by O’Donoghue and Rabin (1999) who introduced the distinction between naïve and sophisticated procrastinators. Naïve persons think that their future selves will behave in a time-consistent manner despite the fact that they have consistently violated this belief in the past, while sophisticated procrastinators correctly foresee that their future selves will also behave in a time-inconsistent way and therefore constrain their future actions.
There is an extensive literature in psychology on regret, distinguishing different types of regret, such as experienced regret (Valenti et al., 2011) and anticipatory regret (Loomes and Sugden, 1982). We should note that we did not use the term “regret” in the survey that provides the data on which this study is based. While the wish to have saved more is related to the literature on experienced regret, our use of the term “saving regret” is more out of linguistic convenience than with the aim to contribute substantively to the regret literature in psychology. Muermann et al., (2006) examine the effect of anticipatory regret in the context of investment behavior and the role of guarantees in US-American DC pension plans. Croy et al., (2015) apply anticipatory regret theory to describe retirement savings intentions in Australia. Caliendo and Findley (2020) explain regret by attributing lower utility to past relative to present consumption (backwards discounting).
Skinner (1988). In the language of psychology experienced regret refers to faulty (in)actions which is different from disappointment over disconfirmed expectancies (e.g., Zeelenberg et al., 2000). Unexpected life events may also trigger regret over too much saving (Börsch-Supan and Stahl, 1991). Gabaix and Laibson (2017) provide a model in which prediction errors about future shocks and personality traits such as patience or procrastination can lead to observationally equivalent behavioral outcomes.
Over-optimism is “expecting future outcomes that are better than reasonably likely” (Shepperd et al., 2017) and is documented widely beginning with Weinstein (1980). When individuals update their beliefs more in response to good news than to bad news, they may fail to prepare for potential future problems or take too much risk. Illusion of control is an exaggerated belief in one’s capacity to control independent, external events, and the better than average effect (also called the superiority illusion) is the perception of oneself, one’s past behavior, and one’s lasting features as more positive than is the case (Jefferson et al., 2017). Overconfidence may increase an individual’s propensity to underestimate the probability and/or the negative consequences of an adverse event (see literature reviews by Barberis and Thaler, 2003, and Dunning et al., 2004).
Hurd and Rohwedder (2012) estimate that 75 percent of retirees have sufficient savings to reach the end of their lives with positive wealth.
Exceptions are Morrison and Roese (2011) and Bell (2016), see Section 3.
See the on-line appendix for summary statistics.
Sample statistics are displayed in the Appendix Table A1.
An overview of several GPS variants is given by Ferrari et al. (1995). Tuckman’s scale was developed to study procrastination behavior among high school students and in other educational settings.
See Appendix A for the list of questions used to construct the financial literacy and probability numeracy scales.
Personality traits have been found to be largely rank-order stable in later adulthood, that means that while personality may change somewhat with age, the ranking of individuals in the population will be preserved so that those who scored high along some trait will continue to score high relative to others (e.g., Anusic and Schimmack, 2016, Roberts and DelVecchio, 2000; Trzesniewski et al., 2003, Bleidorn et al., 2018).
This also holds if these the categories are summed into a rank score and saving regret is regressed on this rank score.
We also used the Big 5 personality traits (neuroticism, extroversion, agreeableness, conscientiousness, openness) as an alternative to the psychometric scales (John and Srivastava 1999). Saving regret was significantly higher among individuals with high values on the agreeableness scale and lower for individuals with high values of openness. However, the overall explanatory power of the Big 5 was relatively low; they did not perform significantly better than the other psychometric scales.
The use of F-tests also addresses the multiple comparisons issue (Alos-Ferrer and Yechiam 2020) that arises when personality traits are measured by a large set of correlated indicators.
References
- Alos-Ferrer Carlos, and Yechiam Eldad. 2020. At the eve of the 40th anniversary of the Journal of Economic Psychology: Standards, practices, and challenges. Journal of Economic Psychology 80: 1–7. [Google Scholar]
- Angeletos George-Marios, Laibson David, Repetto Andrea, Tobacman Jeremy, and Weinberg Stephen. 2001. The Hyperbolic Consumption Model: Calibration, Simulation, and Empirical Evaluation. Journal of Economic Perspectives 15 (3):47–68. [Google Scholar]
- Anusic Ivana, and Schimmack Ulrich. 2016. Stability and Change of Personality Traits, Self-Esteem, and Well-Being: Introducing the Meta-Analytic Stability and Change Model of Retest Correlations. Journal of Personality and Social Psychology 110 (5):766. [DOI] [PubMed] [Google Scholar]
- Barberis Nicholas, and Thaler Richard. 2003. A Survey of Behavioral Finance. Handbook of the Economics of Finance 1:1053–1128. [Google Scholar]
- Bell Claes. 2016. Survey Finds Most Americans Have Financial Regrets https://www.bankrate.com/finance/consumer-index/financial-security-charts-0516.aspx.
- Beshears J, Choi J, Laibson D, Madrian BC. 2013. Simplification and Saving. Journal of Economic Behavior and Organization 95:130–145. [DOI] [PMC free article] [PubMed] [Google Scholar]
- Bleidorn Wiebke, Hopwood Christopher J, and Lucas Richard E. 2018. Life Events and Personality Trait Change. Journal of Personality 86 (1):83–96. [DOI] [PubMed] [Google Scholar]
- Börsch-Supan Axel, and Stahl Konrad. 1991. Life Cycle Savings and Consumption Constraints. Journal of Population Economics 4 (3):233–255. [DOI] [PubMed] [Google Scholar]
- Brent W, and DelVecchio Wendy F. 2000. The Rank-Order Consistency of Personality Traits from Childhood to Old Age: A Quantitative Review of Longitudinal Studies. Psychological Bulletin 126 (1):3. [DOI] [PubMed] [Google Scholar]
- Brown Jeffrey and Previtero Allessandro. 2014. Procrastination, Present-Biased Preferences, and Financial Behaviors. NBER RRC paper NB14–04 [Google Scholar]
- Brown Jeffrey and Previtero Allessandro. 2020. Saving for Retirement, Annuities, and Procrastination Paper presented at the Annual NETSPAR Pension Conference, Leiden, Netherlands, April 2020. [Google Scholar]
- Bucher-Koenen Tabea, and Lusardi Annamaria. 2011. Financial Literacy and Retirement Planning in Germany. Journal of Pension Economics & Finance 10 (4):565–584. [DOI] [PMC free article] [PubMed] [Google Scholar]
- Caliendo Frank, and Findley T. Scott. 2020. Dynamic Consistency and Regret Journal of Economic Behavior and Organization, 173(1), 342–364 (2020) [Google Scholar]
- Chetty Raj, John N Friedman Søren Leth-Petersen, Nielsen Torben Heien, and Olsen Tore. 2014. Active vs. Passive Decisions and Crowd-Out in Retirement Savings Accounts: Evidence from Denmark. The Quarterly Journal of Economics 129 (3):1141–1219. [Google Scholar]
- Choi, James J, Laibson David, Madrian Brigitte C, and Metrick Andrew. 2002. Defined Contribution Pensions: Plan Rules, Participant Choices, and the Path of Least Resistance. Tax Policy and the Economy 16:67–113. [Google Scholar]
- Clark Robert L., Hammond Robert G., Khalaf Christelle, and Morrill Melinda Sandler. 2017. Planning for Retirement? The Importance of Time Preferences NBER Working Paper 23501, National Institute of Economic Research, Cambridge, Mass.Croy, Gerry, Paul Gerrans, and Craig P Speelman. 2015. A Mediating Role for Anticipated Regret in Predicting Retirement Savings Intention Between Groups with (without) Past Behaviour. Australian Journal of Psychology 67 (2):87–96. [Google Scholar]
- DellaVigna Stefano, and Malmendier Ulrike. 2006. Paying Not to Go to the Gym. American Economic Review 96 (3):694–719. [Google Scholar]
- Dunning David, Heath Chip, and Suls Jerry M. 2004. Flawed Self-Assessment: Implications for Health, Education, and the Workplace. Psychological Science in the Public Interest 5 (3):69–106. [DOI] [PubMed] [Google Scholar]
- Ellis A, and Knaus W. 1977. Overcoming procrastination New York: Institute for Rational Living. [Google Scholar]
- Ferrari, Joseph R, Johnson Judith L, and McCown William G. 1995. Procrastination and Task Avoidance: Theory, Research, and Treatment: New York: Plenum. [Google Scholar]
- Gabaix Xavier, and Laibson David. 2017. Myopia and Discounting. National Bureau of Economic Research, Working Paper 23254, DOI 10.3386/w23254 [DOI] [Google Scholar]
- Goda Gopi Shah, Levy Matthew R., Colleen Flaherty Manchester Aaron Sojourner, and Tasoff Joshua. 2015. The Role of Time Preferences and Exponential-Growth Bias in Retirement Savings, NBER Working Paper 21482, National Institute of Economic Research, Cambridge, Mass. [Google Scholar]
- Hampson Sarah. 2017. Personality and Health. Oxford Research Encyclopedia of Psychology December. DOI: 10.1093/acrefore/9780190236557.013.121 [DOI] [Google Scholar]
- Hudomiet Peter, Hurd Michael D, and Rohwedder Susann. 2018. Measuring Probability Numeracy. RAND Working Papers WR-1270 [Google Scholar]
- Hung, Angela A, Parker Andrew M, and Yoong Joanne. 2009. Defining and Measuring Financial Literacy Santa Monica, CA: RAND Corporation, 2009. https://www.rand.org/pubs/working_papers/WR708.html. [Google Scholar]
- Hurd Michael D., and Rohwedder Susann. 2012. Economic Preparation for Retirement,” in Wise D (ed.) Investigations in the Economics of Aging, Chicago: University of Chicago Press, 77–113, also available as NBER working paper No. 17203. [Google Scholar]
- Jefferson Anneli, Bortolotti Lisa, and Kuzmanovic Bojana. 2017. What is Unrealistic Optimism? Consciousness and Cognition 50:3–11. [DOI] [PMC free article] [PubMed] [Google Scholar]
- John, Oliver P, and Srivastava Sanjay. 1999. The Big Five Trait Taxonomy: History, Measurement, and Theoretical Perspectives. Handbook of Personality: Theory and Research 2 (1999):102–138. [Google Scholar]
- Laibson David. 1997. Golden Eggs and Hyperbolic Discounting. The Quarterly Journal of Economics 112 (2):443–478. [Google Scholar]
- Laibson David. 1998. Life-cycle Consumption and Hyperbolic Discount Functions. European Economic Review 42 (3–5):861–871. [Google Scholar]
- Laibson, David I, Repetto Andrea, Tobacman Jeremy, Hall Robert E, Gale William G, and Akerlof George A. 1998. Self-Control and Saving for Retirement. Brookings Papers on Economic Activity 1998 (1):91–196. [Google Scholar]
- Lewis Carol. 2008. Why Barack Obama and David Cameron are Keen to ‘Nudge’ You. Times Online, July 14:2008. [Google Scholar]
- Loomes Graham, and Sugden Robert. 1982. Regret Theory: An Alternative Theory of Rational Choice Under Uncertainty. The Economic Journal 92 (368):805–824. [Google Scholar]
- Lusardi Annamaria, and Mitchell Olivia S. 2014. The Economic Importance of Financial Literacy: Theory and Evidence. Journal of Economic Literature 52 (1):5–44. [DOI] [PMC free article] [PubMed] [Google Scholar]
- Madrian, Brigitte C, and Shea Dennis F. 2001. The Power of Suggestion: Inertia in 401 (k) Participation and Savings Behavior. The Quarterly Journal of Economics 116 (4):1149–1187. [Google Scholar]
- McCarthy Yvonne, Characteristics Behavioural and Distress Financial. 2011. ECB Working Paper No. 1303, Available at SSRN: https://ssrn.com/abstract=1761570. [Google Scholar]
- Morrison Mike, and Roese Neal J. 2011. Regrets of the Typical American: Findings from a Nationally Representative Sample. Social Psychological and Personality Science 2 (6):576–583. [Google Scholar]
- Muermann Alexander, Mitchell Olivia S, and Volkman Jacqueline M. 2006. Regret, Portfolio Choice, and Guarantees in Defined Contribution Schemes. Insurance: Mathematics and Economics 39 (2):219–229. [Google Scholar]
- OECD. 2019. Risks That Matter” Paris: OECD. [Google Scholar]
- O’Donoghue Ted, and Rabin Matthew. 1999. Doing it Now or Later. American Economic Review 89 (1):103–124. [Google Scholar]
- Pollard Michael S. and Baird Matthew D.. 2017. The RAND American Life Panel: Technical Description Santa Monica, CA: RAND Corporation. https://www.rand.org/pubs/research_reports/RR1651.html. [Google Scholar]
- Poterba, James M, Venti Steven F, and Wise David A. 2011. Were They Prepared for Retirement? Financial Status at Advanced Ages in the HRS and AHEAD Cohorts. In Wise David (ed.) Investigations in the Economics of Aging, 21–69. University of Chicago Press. [Google Scholar]
- Rabin Matthew. 2013a. An Approach to Incorporating Psychology into Economics. American Economic Review 103 (3):617–22. [Google Scholar]
- Rabin Matthew. 2013b. Incorporating Limited Rationality into Economics. Journal of Economic Literature 51 (2):528–43. [Google Scholar]
- Rha Jong-Youn, Montalto Catherine P., and Hanna Sherman D.. 2006. The Effect of Self-Control Mechanisms on Household Saving Behavior. Journal of Financial Counseling and Planning, 17 (2): 3–16. [Google Scholar]
- Roberts, Brent W, and DelVecchio Wendy F. 2000. The Rank-Order Consistency of Personality Traits from Childhood to Old Age: A Quantitative Review of Longitudinal Studies. Psychological Bulletin 126, no. 1: 3. [DOI] [PubMed] [Google Scholar]
- Scholz John Karl, Seshadri Ananth, and Khitatrakun Surachai. 2006. Are Americans Saving Optimally” for Retirement? Journal of Political Economy 114 (4):607–643. [Google Scholar]
- Shepperd, James A, Pogge Gabrielle, and Howell Jennifer L. 2017. Assessing the Consequences of Unrealistic Optimism: Challenges and Recommendations. Consciousness and Cognition 50:69–78. [DOI] [PubMed] [Google Scholar]
- Skinner Jonathan. 1988. Risky Income, Life Cycle Consumption, and Precautionary Savings. Journal of Monetary Economics 22 (2):237–255. [Google Scholar]
- Stanford Center on Longevity. 2016. The Sightlines Project: Seeing Our Way to Living Long, Living Well in 21st Century America” (http://sightlinesproject.stanford.edu). [Google Scholar]
- Steel Piers. 2007. The Nature of Procrastination: A Meta-Analytic and Theoretical Review of Quintessential Self-Regulatory Failure. Psychological Bulletin 133 (1):65. [DOI] [PubMed] [Google Scholar]
- Strömbäck Camilla & Lind Therese & Kenny Skagerlund& Daniel Västfjäll & Gustav Tinghög. 2017. Does self-control predict financial behavior and financial well-being? Journal of Behavioral and Experimental Finance 14. 10.1016/j.jbef.2017.04.002. [DOI] [Google Scholar]
- Strotz Robert Henry. 1955. Myopia and Inconsistency in Dynamic Utility Maximization. The Review of Economic Studies 23 (3):165–180. [Google Scholar]
- Thaler Richard H. 1994. Psychology and Savings Policies. The American Economic Review 84 (2):186–192. [Google Scholar]
- Thaler, Richard H, and Sunstein Cass R. 2003. Libertarian Paternalism. American Economic Review 93 (2):175–179. [Google Scholar]
- Thaler, Richard H, and Sunstein Cass R. 2009. Nudge: Improving Decisions About Health, Wealth, and Happiness: Penguin [Google Scholar]
- Trzesniewski Kali H., Donnellan M. Brent, and Robins Richard W.. 2003. Stability of Self-Esteem Across the Life Span. Journal of Personality and Social Psychology, Vol. 84, No. 1, 205–220. [PubMed] [Google Scholar]
- Tuckman Bruce W. 1991. The Development and Concurrent Validity of the Procrastination Scale. Educational and psychological measurement 51 (2):473–480. [Google Scholar]
- Valenti Greta, Libby Lisa K, and Eibach Richard P. 2011. Looking Back with Regret: Visual Perspective in Memory Images Differentially Affects Regret for Actions and Inactions. Journal of Experimental Social Psychology 47 (4):730–737. [Google Scholar]
- Weinstein Neil D. 1980. Unrealistic Optimism About Future Life Events. Journal of Personality and Social Psychology 39 (5):806. [Google Scholar]
- Zeelenberg Marcel, van Dijk Wilco W., Manstead Antony S.R., and Pligt Joop van der. 2000. On bad decisions and disconfirmed expectancies: The psychology of regret and disappointment. Cognition and Emotion, 14 (4), 521–541. [Google Scholar]
Associated Data
This section collects any data citations, data availability statements, or supplementary materials included in this article.