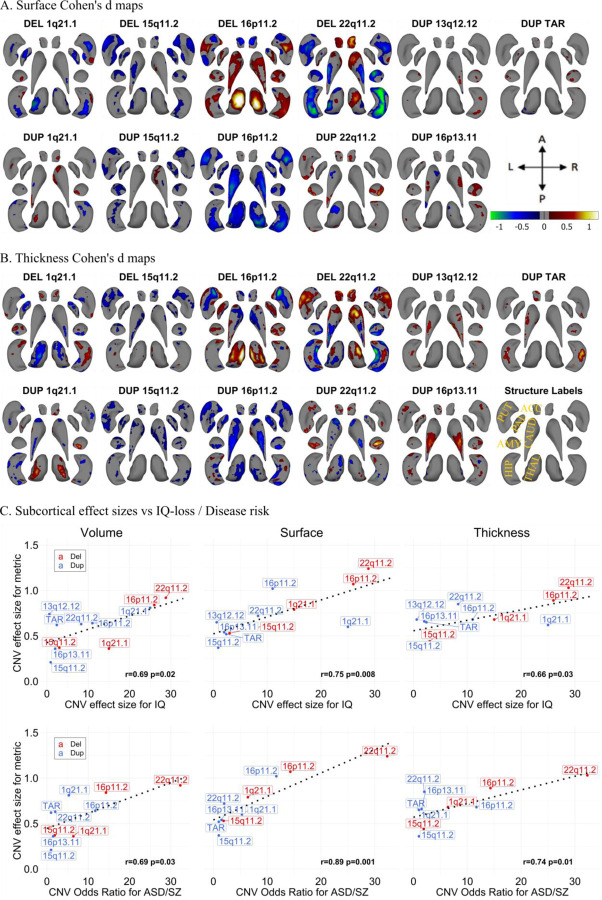
Figure 2: Cohen’s d maps for Subcortical Shape analysis and effect size comparison.
A-B) Cohen’s d maps of subcortical shape alterations in surface (panel A); and thickness (panel B) for 11 CNVs (dorsal view). Significant vertices are shown, after applying FDR correction (<0.05) across all 27,000 vertices x 11 CNVs (within each panel). Colorbar for panels A-B are shown in panel A, and structures’ labels are shown in panel B. Thickness represents local radial distance, and surface represents local surface area dilation/contraction. Blue/green colors indicate negative coefficients, or regions with reduced thickness in the CNV group compared with the controls. Red/yellow colors indicate positive coefficients, or regions with increased thickness in the CNV group compared with the controls. Gray regions indicate areas of no significant difference after correction for multiple comparisons. Each vertex was adjusted for sex, site, age, and intracranial volume (ICV). Ventral views are shown in Figure SF6. Covariance as well as overlap between surface and thickness at the vertex level are shown in Figure SF7.
C) Comparison of effect sizes of CNVs on subcortical-volume / subcortical-shape metrics and previously published effect sizes on cognition and disease risk. Regression lines fitted using the geom_smooth function in R. Pearson correlation and p-values (parametric cor.mtest function in R) are shown for each metric. Plots comparing the effect sizes of CNVs and the number of genes within CNV / probability of being loss-of-function intolerant (pLI-sum) for genes within CNV, as well as ICV metric are shown in Figure SF8. Concordance of effect sizes of CNVs on subcortical shape metrics and subcortical-volume are shown in Figure SF9. Abbreviations, DEL: deletion; DUP: duplication; ACC: accumbens; AMY: amygdala; CAUD: caudate; HIP: hippocampus; PUT: putamen; PAL: pallidum; THAL: thalamus; ES: effect size; CCC: concordance correlation coefficients; Directions: L-left, R-right, A-anterior, P-posterior.

