

Abstract
Remittances received by households from international migrants are of interest in an increasing number of microeconomic analyses. Making use of novel data, we measure misreporting of remittances sent by migrants in the United Arab Emirates (UAE) to remittance recipients in the Philippines. We obtained administrative transaction data from a sample of Filipino migrants who were clients of a popular money transfer operator (MTO). We then surveyed these migrants as well as their primary remittance recipients about the same remittance flows. Migrant-reported remittances are only 6% lower than MTO administrative records, and we cannot reject their equality. A custom smartphone app designed to facilitate migrant remittance reporting does not help raise reporting accuracy. Recipient-reported remittances are 23% lower than migrant reports on average. Recipients under-report even more when they receive remittances less frequently and when remittances make up a lower share of household income.
Keywords: Remittances, Migration, Survey Methodology
1. Introduction
The remittances that international migrants sent to their origin countries amounted to $548 billion in 2019, a figure far exceeding total official development assistance (foreign aid) of $152 billion in that year (World Bank, 2021). A wide variety of studies in economics have investigated remittance-related questions (Yang, 2011). For example, studies examine the correlates or determinants of remittance flows (Bollard et al., 2011); how shocks to migrant income and remittances affect migrant-origin households (Yang, 2006; Yang and Martinez, 2006; Yang, 2008) and migrant-origin areas (Khanna et al., 2022); how remittances respond to origin-household shocks, playing an insurance role (Yang and Choi, 2007); remittance responses to changes in transaction fees (Ambler et al., 2014); financial innovations to stimulate remittances (Ashraf et al., 2015; De Arcangelis et al., 2015; Ambler et al., 2015); how migrants hide income from origin households so as to send less in remittances (Joseph et al., 2018; Baseler, 2021; Seshan and Zubrickas, 2015); and how financial literacy interventions affect remittances (Seshan and Yang, 2014; Abarcar et al., 2020).
All such studies require microdata on remittances, but it is rare to obtain administrative data directly from remittance companies (money transfer operators, or MTOs). Most studies therefore rely on remittance data reported by either senders or recipients, but these self-reports can be difficult to collect reliably (Brown et al., 2014). Survey respondents may misreport remittances, intentionally or not, introducing bias to empirical analyses using survey-based remittance data. For example, consider a regression examining the impact of household income (say, instrumented by weather variation as in Yang and Choi, 2007) on remittances received from migrants. In Yang and Choi (2007), the coefficient on income is negative, consistent with an insurance motive for remittances. If the data on remittances are under-reported, the coefficient on household income in this regression would be biased towards zero.1 In this case, the substantive conclusion of the analysis would be affected: remittances would appear in the data to provide less insurance against income shocks than they do in reality. The measured degree of insurance provided by remittances would be a lower bound of the true degree of insurance.
In this paper, we investigate the extent to which self-reported survey data captures the true volume of remittances sent by Filipino migrants in the United Arab Emirates (UAE). The results have important implications for survey design and the interpretation of empirical analyses involving remittances.
Collecting information on remittances through surveys is prone to several sources of measurement error, all of which can be difficult to test empirically. As many surveys use recall periods of up to twelve months in framing remittance related questions, recall bias is an obvious concern. Brown et al. (2014) refer to the “variability dilemma” when relying on recall; migrant remittances often vary in frequency and amount over time, so calculating one year’s worth of remittances can be subject to substantial measurement error. Moreover, social desirability bias poses a challenge among populations where social pressures to remit are strong (Brown et al., 2014). This is especially true among Filipino migrants, who are positioned as national heroes for their contributions to nation building and whose families rely on remittances for their livelihoods. In certain social and political environments, reporting biases may also be a concern in remittance recipient surveys (e.g. due to tax concerns or eligibility for social programs), though these biases are likely to move in the opposite direction. Given these methodological concerns, a better understanding of the extent to which self-reported remittance data may bias estimates is important for survey design and measurement methodologies.
Our study sample consists of Filipino migrants working in the emirates of Dubai and Sharjah within the UAE. For a subsample of these migrants, we have transaction-level administrative remittance data from a popular MTO called UAE Exchange. In addition to these administrative records, we have self-reported remittance data collected through two methods. First, we followed a traditional survey methodology in which we asked migrants and their primary remittance recipient about remittances sent during the last 7 days and 12 weeks. Second, we used a novel app-based data collection platform (called Padalapp), designed specifically for this study, to collect high frequency remittance data. Migrants were introduced to the app during a face-to-face baseline survey, and we administered an endline phone survey to both migrants and their remittance-recipient households. The entire sample was involved in a randomized controlled trial (RCT) investigating the impact of a “labeling treatment,” which allowed migrants to earmark remittance payments for specific expenditure categories in Padalapp (see Section 2). All data collection (and other aspects of research implementation) was conducted by Innovations for Poverty Action (IPA) Philippines, using locally recruited enumeration staff and overseen by the central office in Manila.2
The objective of collecting high-frequency, verifiable data via the app was in part to mitigate potential recall or social desirability bias among remittance senders. The former is mitigated by allowing participants to record remittances in real time and reminding them to do so via weekly surveys, push notifications, and SMS reminders. The latter is mitigated by removing personal interaction, and hence the fear of judgment, during the data collection process and by requiring remittance receipts to verify amounts sent. However, conducting high-frequency surveys over a prolonged 30-week period may also induce fatigue and increase the risk of non-response. We determine the accuracy of this remittance data by comparing it to UAE Exchange’s administrative data as well as the endline survey reports.
As with remittance sender reports, remittance recipient reports are subject to recall bias, social desirability bias, and other measurement error, though the source and/or magnitude of the error may differ from that of the sender. Utilizing a rare matched-sample dataset of both remittance senders and their recipients, we assess the relative accuracy of the two measures by comparing self-reported remittance data of senders and receivers. Our work is part of a small set of studies that have conducted “paired” surveys of migrants and their origin households, including Seshan and Yang (2014), De Arcangelis et al. (2015), Ashraf et al. (2015), and Ambler et al. (2015).
In a comparison with administrative data, we find that self-reported migrant survey data (using the 12-week recall period) accurately captures over 90 percent of the true remittance amount, and thus we see only limited evidence of recall bias or social desirability bias affecting this measure. However, we find that migrants significantly under-report remittance amounts when collecting high-frequency data via Padalapp, likely due to the difficulty of maintaining compliance with real-time remittance recording and weekly surveys over time. Furthermore, recipient households tend to under-report the amount of remittances received from senders by about 25 percent on average (relative to migrant reports). The magnitude of under-reporting is heterogeneous with respect to baseline characteristics.
When seeking to maximize the accuracy of remittance data, researchers should prioritize use of administrative data from money transfer operators. If administrative data is not available, our results imply that remittance-sender (migrant) surveys will likely suffer from less under-reporting than remittance-recipient surveys. In settings where surveying migrants is not feasible (or prohibitively expensive), recipient surveys can still serve as a viable alternative, especially for populations that remit frequently. Our findings do not support the use of high-frequency self-reports collected via smartphone app, but it is possible that app-based or other innovative data-collection approaches could be made viable after finding ways to raise respondent usage and compliance rates.
The paper is structured as follows: In Section 2 we describe our data sources, and Section 3 contains our primary analysis of remittance capture rates along with a discussion of the main findings. Finally, Section 4 concludes with some recommendations for data collection and policy analysis.
2. Description of Data Sources
The following section provides details on the data collection processes and timelines of the three data sources, which are 1) a remittance-focused smartphone application, 2) migrant and recipient surveys, and 3) administrative data.
Study participants were recruited in two waves, the first running from September to October 2018 and the second from March to August 2019. Participants in the first wave were recruited in various public locations frequented by Filipinos in Dubai and Sharjah, while participants in the second wave were recruited inside or near UAE Exchange branches to ensure recruitment of existing UAE Exchange customers (for which we could obtain administrative remittance data). During recruitment, a baseline interview was conducted to collect basic demographic and financial information from participants.
2.1. Smartphone Application Data
During the baseline interview, migrant participants were asked to install Padalapp,3 a mobile application developed specifically for this research project. Padalapp was not designed to transfer money but for remittance senders to easily record and track the remittances they send.4 For 30 weeks after the baseline survey, participants were asked to record their remittance data using Padalapp, including recipient name and cell phone number, transaction currency amount, and transaction date. Users could also use the application to send a free, customizable SMS to the recipient informing them that the remittance had been sent.5
Several measures were adopted to incentivize full reporting of remittance data and to ensure data accuracy. First, participants received weekly reminders—via in-app notifications and SMS reminders—to record remittance transactions from the previous week. Moreover, participants were asked to upload a photo of the transaction receipt showing the remittance recipient, amount, and date. Records with errors in the transaction amount and date were corrected by research staff during the data cleaning process, while duplicate and invalid records were identified and dropped from the dataset. A record was considered invalid if the remittance was not sent by the migrant participant themself, if the remittance was not sent from the UAE to the Philippines, or if the remittance was sent outside of the study period.
To incentivize careful reporting, records that included receipt photos were awarded points. The number of points per transaction varied randomly from week to week, and after reaching 100 points, participants were awarded with a gift certificate of their choice (for groceries, cell phone credit, or online shopping) with a value of 25 UAE dirhams.6 Participants could also record remittances without the receipt photo but did not receive points for those records; in total, over 80% of all remittance records submitted to Padalapp were accompanied by receipts and could be verified.
2.2. Survey Data
Endline data collection was also carried out in two waves, the first from March to July 2019, and the second from October 2019 to April 2020. The endline survey was administered by phone approximately 30 weeks after baseline, and interviews lasted 30 to 40 minutes on average. To incentivize participation, recipient respondents were given 50 pesos7 in cell phone credit upon completion of the survey, while migrant respondents received additional points towards gift certificate redemption in Padalapp. We successfully surveyed 1987 migrant participants and 2075 recipient participants at endline, 1377 of which were part of a matched migrant-recipient pair. 30 percent of study participants could not be reached at endline.
Self-reported remittance data was captured from migrants and their primary remittance recipients using 7-day and 12-week recall periods. To ensure a uniform interpretation of the period length, the survey program automatically calculated the exact start date of the recall period for each respondent separately. The survey instrument also specified the name of the primary remittance recipient or migrant, depending on whether the migrant or recipient survey was being administered.8 In addition, the survey asked separately about remittances the migrant may have sent on another person’s behalf, and these totals were excluded from the analysis.
The questions about remittance amounts in the migrant survey were worded as follows:9 (The questionnaire script was translated from English to Filipino, and then back-translated to English by a separate translator to minimize translation errors.)
How much money, in total, have you remitted to [PRIMARY REMITTANCE RECIPIENT NAME] in the last 7 days / 3 months (12 weeks) (since [DATE]) (in pesos)?
In the past 7 days / 3 months (12 weeks) (since [DATE]), how much have you sent in total to individuals other than to [PRIMARY REMITTANCE RECIPIENT NAME] (in pesos)?
The analagous remittance questions in the household survey were worded as follows:
In the last 7 days / 3 months (12 weeks) (since [DATE]), how much money, in total, has [MIGRANT NAME] remitted to you (in pesos)?
Since recruitment (and the baseline survey) was conducted on a rolling basis, the endline survey was also staggered. Though the initial attempt to contact a participant at endline was always made right after the end of the full 30-week study period, some participants were harder to reach by phone than others, so in some cases participants were not surveyed until several weeks after the end of the study period.
2.3. Administrative Data
For participants recruited in the second wave of the study, we obtained administrative data directly from UAE Exchange, which includes the date and amount for each remittance transaction made on the UAE Exchange platform. The data covers the 30-week study period as well as one full year prior to recruitment into the study for each user.
The data sharing agreement between IPA and UAE Exchange required that the data be anonymized before sharing. In practice, this meant that IPA sent UAE Exchange a list of study participants’ customer numbers (obtained during the baseline survey), and UAE Exchange returned a dataset in which these numbers were replaced by randomly generated unique IDs. The anonymity of this dataset means that it is not possible to match the administrative data with survey or Padalapp data at the individual level, and so our analysis (outlined below) involves comparisons of aggregate (full-sample) data from UAE Exchange with corresponding aggregate data from the endline survey. We obtained administrative data for a total of 1877 migrants; the remainder of the wave 2 participants reported UAE Exchange customer numbers that could not be located in UAE Exchange’s database and thus their remittance data could not be retrieved. In total, there are 414 wave 2 participants missing from the administrative data.
Since the administrative data captures all remittances sent by our study participants (over the UAE Exchange network), we consider it to be the most representative record of remittance behavior in our sample. Thus, in addition to comparing our other measures against this benchmark, we use administrative data to illustrate some descriptive properties of the sample. Here we present three measures of the frequency and consistency of remittances, which will be relevant to our discussion of survey capture rates (as people tend to have more accurate recall of regular, as opposed to erratic, events).
First, we consider the number of weeks (out of the entire 30-week study period) during which a migrant sent at least one remittance. While there is some variation in frequency, the majority of migrants were relatively infrequent remitters, with 50 percent of the sample sending remittances in fewer than 5 out of the 30 weeks, and only 5 percent of the sample sending in at least half of the 30 weeks. (Figure 1 provides the full distribution, showing the largest mass at only 2 weeks, but with a long right tail.) Since this measure does not account for timing and spread of remittances,10 we also calculate the number of migrants that sent a remittance at least once every two months during the study period,11 and find that only about one quarter of the sample met or exceeded this threshold. Finally, we also calculate variation in the weekly remittance amounts, and find similar evidence of inconsistency. Comparing the highest and lowest weekly remittance totals for each migrant, we find that the average difference is over 1400 percent (~ 35,000 Pesos in absolute terms). Though this average is affected by a long right tail, the median still suggests high variability in remittance amounts, with 50 percent of the sample exhibiting a spread of over 600 percent.
Figure 1:

Distribution of Remittance Frequency
Notes: Histogram shows the distribution of the frequency variable defined as “the number of weeks during which at least one remittance was recorded in the administrative data” (out of the 30-week study period) for the entire UAE Exchange sample. Vertical red line represents the sample mean of just over 5 weeks.
3. Capture Rate Analysis
The main objective of this work is to assess the performance of different remittance measurement methods against the benchmark of administrative data. In addition to the data from UAE Exchange, our study comprises two survey data sources (as described in Section 2), the first of which is based on traditional survey recall questions asked to migrant remittance senders and their recipient households (using both 7-day and 12-week recall periods). Our first analysis of the “capture rate” (or the percentage of remittances reported from one source that are also reflected in another) is a comparison of migrant and recipient survey responses, which will help determine the extent and direction of misreporting on the part of sender and/or recipient. To put this capture rate into context, we use the comparison between migrant survey data and administrative data as a benchmark to determine if a capture rate significantly different from 1 represents under-reporting on the part of one respondent or over-reporting on the part of the other.
The second source of self-reported remittance data is Padalapp, which provides an alternative measure to the one-time endline survey and allows for continuous data collection over an extended period of time (30 weeks in this case). The main advantage of continuous app-based data collection is its ability to limit the effect of recall bias that may otherwise be present in the endline survey (in which respondents are expected to accurately remember remittance transactions from up to 3 months earlier). However, sustained attention and usage of the app may diminish over time, which could lead to severe under-reporting. Since the remittance recall period in the endline survey refers to the last 12 weeks or the last 7 days of the 30-week observation period, comparison with Padalapp reports may be biased by the fact that these recall windows cover the later end of the study period, when app usage rates have already fallen.
Since administrative data from UAE Exchange was anonymized before being shared with the research team, all comparisons to administrative data must be made with average weekly remittance amounts using the entire wave 2 sample. When calculating the capture rate between survey and administrative data, we cannot exclude from the administrative sample those migrants that did not respond at endline, since individual respondents cannot be identified in the UAE Exchange data. Furthermore, since UAE Exchange customers may have also used other MTOs, correct comparisons with administrative data must differentiate UAE Exchange transactions in both the survey and Padalapp data. In Padalapp, we can distinguish UAE Exchange transactions from other provider transactions whenever a receipt was uploaded. Though migrants were incentivized to attach receipts to all remittance reports, only about 80 percent of all transactions included receipt verification. For this reason, we estimate the proportion of all transactions that were sent through UAE Exchange by taking the ratio of the total amount of receipt-verified UAE Exchange transactions to the total amount of all receipt-verified transactions in Padalapp data. This ratio, approximately equal to 0.56, was then multiplied by the total amount of all Padalapp transactions (with and without receipt) to generate an estimate of the total amount of remittances sent via UAE Exchange.
Additionally, respondents were not asked to separately report UAE Exchange transactions in either the migrant or household endline surveys. Thus, in order to generate figures for comparison with administrative data, both the 7-day and 12-week recall amounts from survey data were multiplied by the same ratio of receipt-verified UAE Exchange transactions to total receipt-verified transactions from the Padalapp data. While imperfect, this method provides some consistency across data sources by applying the same ratio to both Padalapp and survey data.
Since the various data sources used in this study reflect remittance flows occurring over different periods of time—ranging from the 7-day recall survey data to the 30-week continuous Padalapp data—all figures are expressed as per-person per-week averages before any capture rates are calculated. To ensure that all comparisons reflect overlapping periods, we average over the last 7 days (12 weeks) of Padalapp and administrative data when comparing with the 7-day (12-week) recall amounts from survey data. When comparing Padalapp with administrative data directly, however, averages are drawn from the entire 30-week study period. Thus, in all of the following comparisons, the reported capture rate reflects the ratio of per-person per-week average remittance amounts (measured in Philippine Pesos) from two different data sources over equal-length time periods.
In the subsequent analysis we focus on the following five capture rates:12
Recipient vs. Migrant Survey Data: proportion of remittances reported in the migrant endline survey that are also reported by the paired recipient.
Padalapp Data vs. Migrant Survey Data: proportion of remittances reported in the migrant endline survey that are also reported in the app.
Padalapp Data vs. Recipient Survey Data: proportion of remittances reported in the recipient endline survey that are also reported by paired migrants in the app.
Migrant Survey Data vs. UAE Exchange Administrative Data: proportion of remittances recorded in administrative data that are also reported in the migrant endline survey.
Padalapp Data vs. UAE Exchange Administrative Data: proportion of remittances recorded in administrative data that are also reported by migrants in the app.
In addition to computing capture rates using the raw data, we have also implemented two modifications for seasonal adjustment. Since endline surveys were not always conducted directly after the end of the 30-week study period (due to logistical delays and difficulties in tracking respondents), there are many migrants for whom the 7-day and 12-week survey recall windows do not overlap with the final 7 days and 12 weeks of Padalapp data (or migrants for whom the recall window does not overlap perfectly with their recipient’s window). If there is any seasonal variation in aggregate remittance trends (e.g., due to increased consumption around holidays), then data from two different time periods may not be comparable, even if the periods are of equal length. To address this time inconsistency, we implement two correction methods. First, we restrict comparisons using survey and Padalapp data to migrant/recipient pairs that were surveyed within 28 days of one another, or—in the case of comparisons between app and survey data—to respondents for whom the endline survey was conducted within 28 days of the final week of app data.13 Second, we implement a standard de-seasonalizing procedure on each dataset by (1) estimating the residuals from a regression of remittance amounts on a set of month fixed effects; (2) calculating the average of these de-seasonalized residuals for a series of rolling 3-month windows, then averaging these values across the entire data collection period. This adjusted average, which represents the de-seasonalized remittance amount for each individual, is then used in all capture rate comparisons in lieu of the raw data average.
3.1. Empirical Results
In Table 1 we report estimated capture rates for the five different comparisons described above. Numerator and Denominator values from the raw data are reported separately (in Philippine Pesos), and capture rates are reported using both the raw data as well as the seasonally adjusted data after implementing the two correction methods as previously described. While capture rates are reported for both 7-day and 12-week recall periods, note that the final row in both panels is identical because recall periods are not relevant when comparing administrative data with app data (since average remittance amounts are calculated over the entire 30-week study period). In general, we are interested in the extent to which capture rates are statistically distinguishable from 1 (indicating no difference in reporting).
Table 1:
Capture Rates
| All Matched Pairs | Matched Pairs w/in 28 Days | |||||||||
|---|---|---|---|---|---|---|---|---|---|---|
| Num. (Pesos) | Den. (Pesos) | N | Raw Data | Seasonal Adj. | N | Raw Data | ||||
| 12-Week Recall | Survey Data | Rec. Survey | 2,432.93 | Mig. Survey | 3,159.41 | 1,377 | 0.7701 (0.0242) |
0.7598 (0.0259) |
1,031 | 0.7696 (0.0290) |
| Padalapp Data | Padalapp | 3,451.70 | Mig. Survey | 4,667.31 | 1,377 | 0.7395 (0.0518) |
0.7096 (0.0508) |
1,019 | 0.7813 (0.0680) |
|
| Padalapp | 1,956.83 | Rec. Survey | 2,432.93 | 1,377 | 0.8043 (0.0849) |
0.8040 (0.0854) |
1,057 | 0.8325 (0.1141) |
||
| Admin. Data | Mig. Survey | 2,693.40 | Admin. | 2,858.40 | 721 / 1,979 | 0.9423 (0.0577) |
0.9410 (0.0569) |
. | . (.) |
|
| Padalapp | 2,365.73 | Admin. | 3,275.29 | 721 / 1,979 | 0.7223 (0.0486) |
0.7405 (0.0483) |
. | . (.) |
||
| 7-Day Recall | Survey Data | Rec. Survey | 2,876.40 | Mig. Survey | 3,217.52 | 1,377 | 0.8940 (0.0828) |
0.8943 (0.9653) |
1,031 | 0.8474 (0.0923) |
| Padalapp Data | Padalapp | 2,405.22 | Mig. Survey | 5,292.29 | 1,377 | 0.4545 (0.0598) |
0.4236 (0.1007) |
1,019 | 0.4658 (0.0644) |
|
| Padalapp | 999.73 | Rec. Survey | 2,876.40 | 1,377 | 0.3476 (0.0486) |
0.4008 (0.3049) |
1,057 | 0.2461 (0.0449) |
||
| Admin. Data | Mig. Survey | 2,766.15 | Admin. | 4,149.23 | 721 / 1,979 | 0.6667 (0.1154) |
0.6976 (0.1051) |
. | . (.) |
|
| Padalapp | 2,365.73 | Admin. | 3,275.29 | 721 / 1,979 | 0.7223 (0.0486) |
0.7405 (0.0483) |
. | . (.) |
||
Notes: Figures in the columns Num. and Den. are per-person, per-week averages expressed in Philippine pesos. Capture Rates in each row are the Numerator divided by the Denominator. In the All Matched Pairs columns the full sample includes all migrant/recipient pairs (N=1377), except for the Admin. Data rows, where the migrant survey and Padalapp sample sizes are N=721, and the administrative data sample size is N=1979. In the Matched Pairs w/in 28 Days column, the sample includes only matched pairs for whom data was collected no more than 28 days apart. Seasonal adjustment is obtained by demeaning monthly averages. Bootstrapped standard errors are reported in parentheses (based on 1000 replications). Comparisons of Padalapp and administrative data always use data from the full study-period, so these results do not vary by recall period.
Focusing first on the comparison of survey data, our results show that recipient households under-report remittances by about 23–25 percent of the amount reported by the migrant senders themselves (using the 12-week recall window). We see less under-reporting in the 7-day recall data—in the range of 11–15 percent—but these measurements are somewhat less precise and the capture rate is not statistically distinguishable from 1.14
To put this finding in context, we can use the comparison of migrant endline to administrative data as a benchmark. For the 12-week recall period, we cannot reject the null hypothesis of equivalence between migrant endline survey data and administrative data (i.e., that the capture rate is equal to 1).15 If we take the administrative data to represent the “true” average remittance amount over the 12-week recall period, this result implies that migrant survey respondents are reporting nearly all remittance transactions from the prior 12 weeks, and there is little indication of either over or under-reporting. Taken together, these results imply that self-reported survey data on remittances are more reliable when collected from senders rather than recipients—who, on average, report only about 75 percent of the remittances actually sent.
Turning now to the app data, we see that Padalapp-recorded remittances account for about 75 percent of the transactions reported in the migrant endline survey and 80 percent of the recipient reports (for the 12-week recall period), though these rates drop significantly for the 7-day recall question. This inconsistency between 12-week and 7-day capture rates may be due to Padalapp’s diminishing accuracy over time, as Padalapp usage frequency decreases over the course of the 30-week study period. This would imply that a smaller proportion of all remittances are recorded in the app as we move from the final 12 weeks of Padalapp data to the final 7 days. Though the Padalapp interface was intended to be as user-friendly as possible, some time and effort is still required to record remittance transactions, and for some users this small cost may have surpassed the monetary incentive as fatigue increased over time. As a sanity check on the data, it is reassuring to note that the Padalapp / administrative data capture rate of around 0.68 is consistent with the Padalapp / migrant survey capture rate and migrant survey / administrative data capture rate (0.72 ≈ 0.74 × 0.94 = 0.70).
Finally, as the last three columns of Table 1 show, results are generally robust to seasonal adjustment corrections. Neither the de-seasonalized data, nor the data limited to the within-28-day sample, produce meaningful changes in the interpretation of our results.
3.2. Robustness Checks
3.2.1. Baseline Balance
The primary constraining factor in our analysis is the inability to match administrative data with either survey or Padalapp data at the individual level (due to the fact that the partner MTO was only willing to share anonymized data). In the last two rows of both panels of Table 1, the anonymous nature of the administrative data does not allow for the use of identical samples: while the administrative data sample contains all wave 2 participants, the two self-reported samples only contain wave 2 participants that responded to both the migrant and recipient endline surveys.16 If we were to find evidence of selective attrition, i.e., that those responding to both endline surveys are different from the overall sample along important dimensions, unbiased comparisons of administrative data with survey/app data would not be possible.
Table 2 reports results from the relevant attrition test in which an indicator for whether each respondent is included in the matched migrant-recipient sample is regressed on baseline characteristics. The imbalance observed in certain demographic variables (e.g., family size and length of tenure as a migrant worker) is expected, as individuals with families, and those that have lived abroad longer, are less mobile and thus easier to track and survey. However, it is not clear that these differences would matter as far as remittances are concerned, and in fact, there does not appear to be any imbalance in either the amount or frequency of remittances sent. This gives some assurance that the remittance behaviors of the survey and Padalapp data samples are similar to those of the administrative data sample and provides reasonable justification for the last two rows of both panels in Table 1, even though the samples are not perfectly identical on observables.
Table 2:
Attrition Analysis
| Mig. & Rec. in Endline | Attrited Grp. Mean | N | |
|---|---|---|---|
| Monthly remittance amount | 315.113 (692.4930) |
16,077.47 | 2,255 |
| Respondent is Female | 0.010 (0.0164) |
0.7274 | 2,291 |
| Respondent is Single | −0.025 (0.0216) |
0.5927 | 2,291 |
| Respondent has Children | 0.073*** (0.0214) |
0.5182 | 2,291 |
| Years in UAE is above median | 0.037* (0.0217) |
0.4375 | 2,291 |
| Monthly income is above median | −0.065*** (0.0216) |
0.5618 | 2,291 |
| Target Beneficiary is Female | −0.006 (0.0194) |
0.7417 | 2,291 |
| Target Beneficiary is Study Participant’s Parent | −0.028 (0.0217) |
0.4987 | 2,291 |
| Frequency of remittances to target household is monthly | 0.009 (0.0130) |
0.8380 | 2,291 |
| Monthly remittance amount is above median | −0.002 (0.0218) |
0.4766 | 2,291 |
| Respondent allocates highest share of funds to food | −0.038* (0.0199) |
0.2990 | 2,291 |
| Respondent allocates highest share of funds to medical expenses | −0.021 (0.0133) |
0.1913 | 2,291 |
| Respondent allocates highest share of funds to business expenses | 0.021* (0.0115) |
0.1571 | 2,291 |
| Respondent allocates highest share of funds to education | 0.030** (0.0124) |
0.1487 | 2,291 |
| Respondent allocates highest share of funds to housing | 0.020 (0.0175) |
0.2635 | 2,291 |
| Respondent participates in decisions over how to use remittances | 0.020 (0.0217) |
0.5059 | 2,291 |
| Respondent wishes had more control over how recipient uses remittances | 0.001 (0.0211) |
0.3647 | 2,291 |
| Mig. is in Labeling Treatment Group | −0.017 (0.0218) |
0.5023 | 2,291 |
Notes: This table shows results from a simple regression of baseline characteristics on a dummy variable for attrition (=1 if both the migrant and recipient were included in the endline survey). Figures in the second column represent the coefficient on the dummy variable, with robust standard errors in parentheses; also reported is the mean from the attrited group (where the attrition dummy =0). The sample for all regressions is the full set of wave 2 respondents, except for the regression of Monthly remittance amount, for which there were some missing values in the baseline survey.
3.2.2. Simulated Attrition Bias
Based on this test of selective attrition, we can also perform a counterfactual analysis using various hypothetical attrition scenarios. In other words, we can simulate capture rates under a range of attrition bias assumptions and determine how extreme the true bias would have to be in order to substantively alter our findings. To start, we estimate the average change in remittance amounts (from administrative data) between the beginning and end of the study period, and multiply baseline monthly remittance amounts (from migrant survey data) by this factor. This gives an estimate of the monthly remittance amount (sent at endline) across the entire migrant sample, which we then divide by four to approximate a weekly average. Next, we re-run the regression from the first row of Table 2 using this newly generated variable in place of the baseline monthly remittance amount. This regression estimates the difference in average weekly remittances (at endline) between the sub-sample in which both migrant and recipient were included in the endline survey data, and the sub-sample in which at least one of the pair was not interviewed—i.e., the selection bias due to attrition.17
We consider this regression coefficient—estimated to be approximately 84—to represent observed attrition bias. By subtracting this from the average remittance amount reported by migrants in the endline survey sample (from the 12-week recall question), we can estimate the average amount of weekly remittances that would have been reported under zero attrition. Of course, since this adjustment only represents true bias under the assumption that the baseline difference between attriters and non-attriters holds at endline, we simulate additional scenarios in which this assumption doesn’t hold. Specifically, we care about how our results would change if attrition bias were more extreme than this estimated value. To this end, we assume a range of both negative and positive biases, subtract these from the non-missing endline average, and simulate data for the missing observations using a log-normal distribution centered around the new mean.18 Finally, for each simulated bias scenario, we calculate the implied capture rate by dividing the migrant survey average by the average from administrative data.
Figure 2 plots these capture rates under bias assumptions from −100 to 250 at increments of 50, along with 95% confidence intervals (based on bootstrapped standard errors). The “observed” value of 84 is also included, and the plotted value at 0 represents the case of no attrition bias, which matches the un-altered capture rate reported in Table 1. This figure illustrates two important findings: (1) If we assume an attrition bias based on observed baseline data, the implied capture rate decreases by only about .02 (from a reported value of approximately .94)—and remains statistically indistinguishable from one; (2) Even under simulations of much more extreme attrition biases—ranging from a 200% decrease to a 200% increase of the observed value—the implied capture rates stay within a range of about .08 (between approximately .96 and .88), and in all cases are statistically indistinguishable from one. In fact, only after increasing the baseline attrition bias by a factor of 5, to about 400 (not shown in Figure 2), does the capture rate’s confidence interval begin to dip below one. These results provide reasonable assurance that the data constraints of this paper do not invalidate a comparison of survey with administrative data; our findings are robust to even the unlikely event of extreme attrition bias in the survey data.
Figure 2:
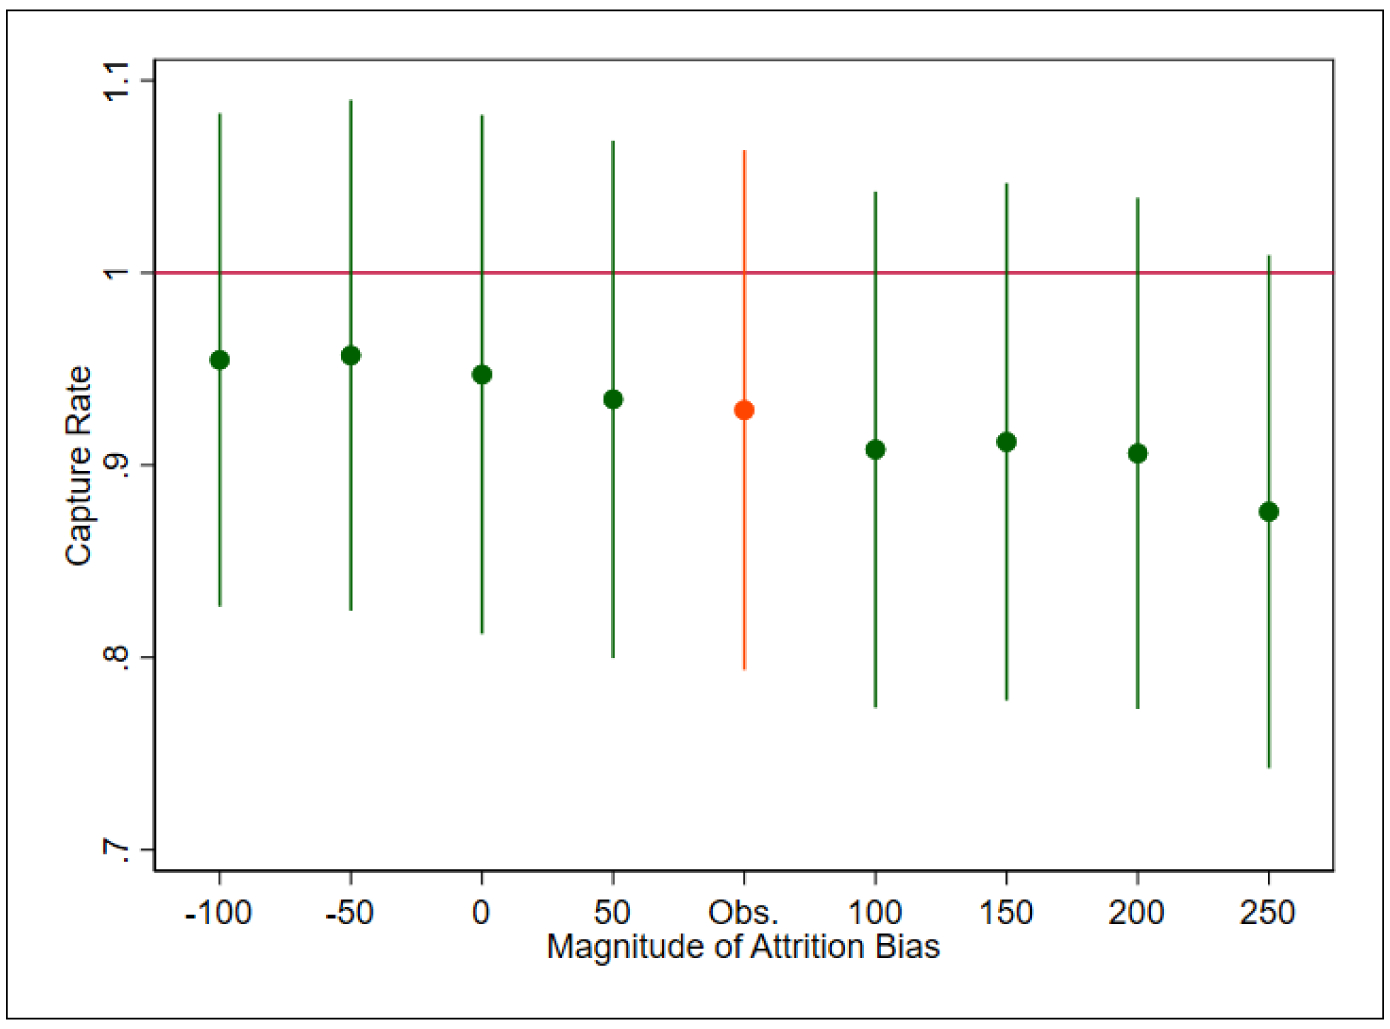
Capture Rates under Various Bias Assumptions
Notes: Each plotted point represents an estimate of the capture rate between migrant survey and administrative data (with bootstrapped 95% CI). The point plotted at 0 is the unadjusted main result presented in Table 1 (assuming no attrition bias), while the point plotted at Obs. represents the estimated capture rate assuming baseline survey levels of attrition bias. All other plots are simulated using a range of bias assumptions from an extreme negative assumption to an extreme positive assumption.
3.2.3. Grouped Data Matching
Though remittance senders cannot be individually identified in the administrative data, it is possible to precisely match certain sub-samples across our survey and administrative data. As part of the RCT previously mentioned, all participants were randomly assigned to different groups based on treatment intensity and enrollment date, the combination of which resulted in hundreds of unique “stratification cells.” Many of these cells comprise only a handful of individuals (in some cases as few as two), and since this treatment assignment variable is included in the administrative data set, we are able to exactly match some individuals across survey and administrative data as follows: for any cell in which at least one respondent is missing from the endline survey data, we remove the entire cell from both data sets before calculating capture rates. This ensures that we are comparing the exact same set of respondents across survey and administrative data.
Though this procedure guarantees perfect sample overlap, it comes at a cost in sample size, as an entire cell must be dropped if it contains even a single attriter. Table 3 compares capture rates between survey and administrative data for two distinct samples: (1) the complete set of endline survey respondents compared with the full administrative dataset (as reported in Table 1), and (2) the set of respondents (in both datasets) from all treatment cells in which there was no migrant or recipient attrition. Since the capture rates reported in the second column represent comparisons between identical samples, they are free from any attrition bias, but due to small sample size, are estimated with less precision than the full sample capture rate. The process of matching survey and administrative data restricts the sample to only 180 individuals—those that we know to be observed in both the endline survey and administrative data.
Table 3:
Matched Sample Comparison
| Full Sample | Matched Sample (N=180) | Difference | |||
|---|---|---|---|---|---|
| 12-Week Recall | Seasonal Adj. | Mig. Survey / Admin | 0.9410 (0.0570) |
0.8267 (0.0965) |
0.1143 (0.1095) |
| Padalapp / Admin | 0.7405 (0.0486) |
0.7059 (0.1059) |
0.0346 (0.1144) |
||
| 7-Day Recall | Seasonal Adj. | Mig. Survey / Admin | 0.6976 (0.1090) |
0.8278 (0.2311) |
−0.1302 (0.2581) |
| Padalapp / Admin | 0.7405 (0.0486) |
0.7059 (0.1059) |
0.0346 (0.1144) |
Notes: This table compares a selection of capture rates for two sub-samples of the data. The first column shows the main results as presented in Table 1, from the full sample of wave 2 migrant endline surveys (N=721) and the full sample of administrative data (N=1979). The second column shows these same capture rates for the matched sample of migrant endline surveys and administrative records (N=180). The difference between the first and second column is also shown, with bootstrapped standard errors in parentheses. All results have been seasonally adjusted following the demeaning procedure described in Section 3.
While the migrant survey / administrative data capture rate of 0.8267 in this matched sample is lower than the full sample capture rate of 0.9423 (for the 12-week recall period), this difference is not significantly different from zero at conventional levels. The 12-week Padalapp / administrative data capture rates are closer across the two samples, differing by less than four percentage points, and are also not statistically different from zero (after adjusting for seasonal trends). Finally, the corresponding 7-day recall capture rates are also relatively similar across the two samples, and none of the differences are statistically different from zero.19 We conclude from this analysis that survey sample attrition is not introducing major bias in our reported capture rates.
3.2.4. Additional Notes on Capture Rate Calculations
We anticipate two additional concerns about the comparability of survey and administrative data, relating to the handling of (1) remittance fees and (2) currency exchange rates. First, since all MTOs charge a service fee for all international remittance transactions, it is important to correctly account for these additional charges in any comparison of data sources. For instance, if the administrative data presents net transaction amounts, but survey respondents reported fee-inclusive totals (or vice versa), then our estimated capture rates would be biased even under perfect fidelity of survey recall. We are confident, however, that this is not affecting our estimates. On the administrative side, we know that the data shared with us by UAE Exchange does not include transaction fees but only reports the net amount remitted for each transaction. Next, since remittance recipients do not pay a fee on the receiving end, they should not even be aware of the fee-inclusive transaction amount unless informed by the migrant directly. Thus, we are fairly certain in the assumption that household survey data does not include fees.
This leaves only Padalapp data and migrant survey data, for which both the survey questionnaire and Padalapp user interface were designed to elicit remittance amounts net of fees. In the smartphone app, users were asked to enter remittance amounts separately by recipient, after which an automated SMS was sent to inform each recipient of the amount they should be expecting. Knowing that the amount was being communicated directly with the recipient, the migrant would not have included transaction fees (which are not passed on to the recipient) in Padalapp reports. Finally, in the endline survey questionnaire, we avoided any phrasing that referred to the total amount spent on remittances, asking instead about the amount remitted to specific individuals, indicating that we were interested in the net amount received by the beneficiary in the Philippines.20
Second, one might reasonably be concerned about the effect of exchange rates on reporting differences, as remittances were reported in the respondents’ home currency (Philippine Pesos) in both the survey and Padalapp, while all transactions were made in UAE Dirhams. If the exchange rate used by migrants (to convert from Dirhams to Pesos in the survey and Padalapp reports)21 is different than the official exchange rate applied by UAE Exchange, we would expect inconsistencies between migrant reports, recipient reports, and administrative data. While we unfortunately do not know the conversion factors used by each migrant when reporting remittance amounts, we have no reason to believe that individuals were systematically over or underestimating the true rate. Since everyone in our study sample was a Filipino migrant living in the UAE and had at least semi-regular interactions with an international money transfer network, we expect that migrants were aware of the approximate exchange rate during the study period. The official daily exchange rate between Peso’s and Dirham’s over the span of this period—from 3 Sep 2018 to 1 May 2020—maintained an average value of 14.16 and standard deviation of 0.28, staying within a range of 13.75 and 14.80 at all times.22 Furthermore, the average daily fluctuation during these 20 months was −0.014 percent, never changing by more than 1 percent in absolute value from one day to the next. The fact that the exchange rate stayed relatively close to its average value of 14—with no major fluctuations—during the entire period of observation, suggests that even migrants who were not keeping close track of the official rate should have reported fairly accurate Peso amounts in both survey and Padalapp data.
3.3. Heterogeneity Analysis
As a final exercise, we re-calculate the recipient-migrant 12-week recall survey capture rate (Row 1 of Table 1) after splitting the sample along various baseline characteristics. In these results, presented in Table 4, we observe some notable heterogeneities. For example, in households with above median income (Household Income) and among those for whom remittances represent a high proportion of total income (Prop. of Inc. from Rem.), capture rates are significantly higher, i.e., recipient reports do a better job of capturing total remittance amounts. On the migrant side, individuals that remitted more at baseline (Pre-Treat Rem. Amt.), and those who remit more frequently (Remittance Frequency), also seem to produce higher capture rates, suggesting that recipients report more accurately under these conditions as well. Finally, recipient reporting seems to be more accurate among migrants who send less of their total remittances to the target beneficiary (Frac. Going to TB). Note that the labeling treatment itself had no measurable impact on the capture rate, as this feature was not intended to improve recall or reporting of remittance amounts, but rather to influence the use of remittances by recipients. The ability to send SMS notifications was available to both treatment and control participants; the actual intervention was simply the addition of the option to label these remittances for specific uses.
Table 4:
Heterogeneity Analysis
| Capture Rate | |||
|---|---|---|---|
| Below Median / Control | Above Median / Treatment | Difference | |
| Labeling Treatment | 0.7587 (0.0359) |
0.7825 (0.0322) |
0.0238 (0.0461) |
| Remittance Frequency | 0.6849 (0.0537) |
0.8002 (0.0264) |
0.1152 (0.0585) |
| Remittance Amount | 0.7081 (0.0646) |
0.7869 (0.0252) |
0.0788 (0.0678) |
| Frac. Going to TB | 0.8211 (0.0324) |
0.7014 (0.0384) |
−0.1197 (0.0498) |
| Unique Recipients | 0.7342 (0.0396) |
0.7995 (0.0316) |
0.0652 (0.0502) |
| HoH Education | 0.7464 (0.0374) |
0.7912 (0.0339) |
0.0447 (0.0504) |
| Household Income | 0.7117 (0.0268) |
0.8492 (0.0472) |
0.1375 (0.0540) |
| Prop. of Inc. from Rem. | 0.4477 (0.0373) |
0.9382 (0.0283) |
0.4905 (0.0467) |
| Pre-Treat Rem. Amt. | 0.6562 (0.0434) |
0.8331 (0.0286) |
0.1768 (0.0517) |
Notes: This table presents estimates for recipient/migrant survey capture rates across heterogeneous baseline values. Rates are calculated separately for individuals above and below the median value of each row variable (or for individuals in the RCT control and treatment group), taken from the entire sample of endline survey respondents (N=721). At the outset of the experiment, each migrant was asked to indicate one primary target beneficiary (TB) for their remittances, and the Frac. Going to TB variable refers to the fraction of total remittances that were intended for the TB, as indicated by the migrant at baseline. Unique Recipients captures the number of unique remittance recipients indicated by the migrant at baseline; HoH Education refers to the education level of the household head; Prop. of Inc. from Rem. indicates the fraction of total household income that was generated by remittances; and Pre-Treat Rem. Amt. is the baseline level of remittance flows reported by migrants before the start of the RCT treatment period. Bootstrapped standard errors are reported in parentheses
4. Conclusion
This study has shown that traditional survey data collection, using a standard recall window of 12 weeks, is a reliable method for measuring remittance flows when administered to migrants, as it tends to capture nearly all of the remittances reflected in administrative data. Remittance recipients, on the other hand, tend to under-report the funds they receive when responding to the same survey questions. An app-based data collection platform that collects high-frequency data from migrants under-performs compared to both migrant and recipient surveys, probably because usage rates are generally low and tend to further decline over time.
Our results have important implications for future research on remittances. In instances where researchers only have access to a single source of self-reported data, our findings provide an estimate of the degree of measurement error they can expect. In rare cases where researchers have access to multiple sources of self-reports, we provide guidance on how to assess the relative accuracy of these sources. Where administrative data from the relevant financial service providers is made available, this will of course be the researcher’s preferred information source, as it is unaffected by common sources of measurement error, such as recall bias and social desirability bias.23 However, private banks and MTOs are not usually willing to share customer data due to concerns over privacy and market competition. In these instances, we recommend that researchers turn to traditional survey methods, targeting remittance senders whenever possible.
When dealing with international remittances, surveying senders can prove prohibitively time consuming or expensive, as migrants are often scattered all around the world without permanent addresses or phone numbers. In these cases, surveying recipients may be the next best option. Our findings show that recipient self-reports are downward biased in general, but that the gap between recipient and sender reports is smaller for certain sub-populations. In particular, we see higher accuracy of recipient reports among higher income households, among households for whom remittances represent a relatively high proportion of total income, and in cases where remittances are sent with relatively high frequency.24 In study samples that possess all or some of these characteristics, researchers may have greater confidence in the accuracy of recipient-reported remittance amounts. Finally, though we observe a higher capture rate for recipient reports based on a 7-day (as opposed to 12-week) survey recall period, we do not recommend relying on short recall windows as a primary measurement method. We find these estimates to be more variable and less precise, and unless remittances are extremely consistent and regular, these reports will be overly dependent on exact survey timing.
With regards to alternative methods of self-reporting, we find that the app-based measurements performed most poorly of all sources. While this may seem like a rebuke of an innovative data-collection method, we still draw useful lessons for future improvements. The average Padalapp capture rate was much higher across the final 12 weeks of the study compared to the the final 7 days, which suggests that app usage rates declined over time as individuals lost interest or motivation in recording their remittance transactions. Therefore, we believe that this technology would perform better over shorter data-collection periods, and may be more appropriate in settings where only a few days/weeks of data are required. Otherwise, to combat user fatigue, researchers should find ways to incorporate stronger incentives into their designs,25 and make user experience more engaging in other ways (e.g., simplifying the interface, or adding gamification elements).26
As a final note, we recognize that the greatest limitation of the present analysis is the inability to cleanly link survey data with administrative records. Though robustness checks provide reasonable assurance that our findings are not driven by survey attrition bias, we would of course prefer to verify this directly. In future research, we stress the importance of regular communication with the MTO, and clarifying up front the need for data on both the full sample of study participants as well as the final sample of survey respondents (minus attriters). With access to these distinct samples, data can remain anonymous at the individual level without constraining researchers’ ability to make aggregate comparisons.
Acknowledgements:
This research was funded by the Global Innovation Fund (GIF), and made possible with the support of the UAE Exchange Centre LLC, IDS Research and Consultancy (IDS), and Innovations for Poverty Action (IPA). We would especially like to thank the many staff at IPA Philippines for their tireless research assistance and data collection efforts; Jaimon Jacob and Raphael Emmanuel Cruz Arcangel from UAE Exchange for facilitating the data sharing partnership with IPA; Manas Mishra and Rochelle Garcia from IDS for assisting with data collection activities in the UAE. We are grateful to participants at Northwestern University’s Methods and Measurement Conference, as well as the Economics of Global Interactions Conference at the University of Bari Aldo Moro, for their insightful questions and comments. Ethical approval and oversight for this study was provided by IPA (IRB #2267).
Appendix
A. Description of Capture Rate Comparisons
For all comparisons below, the Capture Rate is calculated simply by dividing the per-person per-week average from data source 1 by the per-person per-week average from data source 2.
Capture rates are derived from comparisons of our three data sources: 1) endline survey recall questions, 2) Padalapp data, and 3) UAE Exchange administrative data. Note that time periods between Padalapp/administrative data and survey recall do not overlap perfectly for all users, since not everyone was surveyed immediately after the end of the study period.
Recipient vs. Migrant Survey Data
Recipient Endline Survey Data (12 Week Recall): This value is taken from the 12-week recall question in the recipient endline survey, where each household reports total value and number of remittances received by the migrant over the previous 3 months (we divide the reported number by 12 to get weekly amounts). We drop all respondents whose migrants were not also captured in the migrant endline survey.
Migrant Endline Survey Data (to Target Beneficiary) (12 Week Recall): This value is taken from the 12-week recall survey question in the migrant endline survey. We take the response for remittances to the target beneficiary only, then divide by 12. Additionally, we drop all respondents whose target beneficiaries were not also captured in the recipient endline survey.
Padalapp vs. Migrant Survey Data
Padalapp Data (Restricted to Final 12 Weeks): Here we take Padalapp data and restrict it to the final 12 weeks of the study period for each user. We also drop all users that were not interviewed in both the migrant and recipient endline surveys. We then calculate average weekly amount of remittances sent over this period for each user.
Migrant Endline Data (All Recipients) (12 Week Recall): This value is taken from the 12-week recall survey question. We total the amount of remittances made to the target beneficiary and any other reported remittances, then divide by 12. Again, to keep the sample size consistent, we drop all users that were not also surveyed in the recipient endline survey before computing this average.
Padalapp vs. Recipient Survey Data
Padalapp Data (Restricted to Final 12 Weeks): Here we take Padalapp data and restrict it to the final 12 weeks of the study period for each user. We also drop all users that were not interviewed in both the migrant and recipient endline surveys. We then calculate average weekly amount of remittances sent to the target beneficiary (TB) over this period for each user.
Recipient Endline Survey Data (12 Week Recall): This value is taken from the 12-week recall question in the recipient endline survey, where each household reports total value and number of remittances received by the migrant over the previous 3 months (we divide the reported number by 12 to get weekly amounts). To keep the sample consistent, we drop all respondents whose migrants were not also captured in the migrant endline survey.
Migrant Survey vs. Administrative Data
Migrant Endline Survey Data (UAE Exchange Remittances) (12 Week Recall). Since the endline survey does not distinguish between remittances sent via UAE Exchange and other financial institutions, we need to estimate the amount of UAE Exchange remittances from the survey response. We calculate the total proportion of UAE Exchange remittances to total receipt verified remittances from the Padalapp data (for all wave 2 participants) and multiply this proportion by the 12-week recall survey response (including remittances to the target beneficiary and all other reported beneficiaries). This modified figure is used to construct the per-person per-week average as before, using only wave 2 migrants whose target beneficiary households were also included in the recipient endline survey.
UAE Exchange Admin. Data (Restricted to Final 12 Weeks). We take all administrative data from the final 12 weeks of the study period for each user, and calculate the aggregate weekly average remittance amount. We use the full administrative data sample to calculate this average, as we cannot identify individual respondents in the anonymized UAE Exchange data.
Padalapp vs. Administrative Data
Padalapp Data (Sent via UAE Exchange). We use Padalapp data from wave 2 only (wave 1 does not overlap with our administrative data), and drop observations from before week 26 and after week 74, as this is outside of the period covered by the administrative data. Users that UAE Exchange could not locate in their administrative data are also dropped. Finally, for consistency with previous comparisons, the sample includes only wave 2 users that responded to both migrant and recipient endline surveys. As with the migrant endline survey data, total reported remittances are multiplied by the estimated proportion of UAE Exchange remittances before calculating a per-person per-week average.
UAE Exchange Admin. Data. We consider all administrative data that overlaps with the wave 2 study period, and calculate average weekly remittance amounts in the same way as above. We use the full administrative data sample to calculate this average, as we cannot identify individual respondents in the anonymized UAE Exchange data.
B. Appendix Tables
Table B1:
Capture Rates (Matched Sample)
| All Matched Pairs | Matched Pairs w/in 28 Days | |||||||||
|---|---|---|---|---|---|---|---|---|---|---|
| Num. (Pesos) | Den. (Pesos) | N | Raw Data | Seasonal Adj. | N | Raw Data | ||||
| 12-Week Recall | Survey Data | Rec. Survey | 2,662.50 | Mig. Survey | 2,872.96 | 180 | 0.9267 (0.0843) |
0.9243 (0.0914) |
141 | 0.8932 (0.0837) |
| Padalapp Data | Padalapp | 4,956.57 | Mig. Survey | 4,621.71 | 180 | 1.0725 (0.2479) |
1.1193 (0.2604) |
132 | 1.1593 (0.3300) |
|
| Padalapp | 3,191.63 | Rec. Survey | 2,662.50 | 180 | 1.1987 (0.4294) |
1.2275 (0.4380) |
132 | 1.4481 (0.6103) |
||
| Admin. Data | Mig. Survey | 2,597.51 | Admin. | 3,133.71 | 180 | 0.8289 (0.0952) |
0.8267 (0.0965) |
. | . (.) |
|
| Padalapp | 2,771.55 | Admin. | 2,330.28 | 180 | 1.1894 (0.1034) |
0.7059 (0.1059) |
. | . (.) |
||
| 7-Day Recall | Survey Data | Rec. Survey | 3,453.33 | Mig. Survey | 2,936.11 | 180 | 1.1762 (0.2738) |
1.2038 (1.2831) |
141 | 1.0523 (0.2748) |
| Padalapp Data | Padalapp Padalapp |
3,585.24 1573.40 |
Mig. Survey Rec. Survey | 5,091.11 3,453.33 |
180 180 |
0.7042 (0.1796) 0.4556 (0.1270) |
0.8004 (5.2394) 0.4748 (0.1314) |
132 132 |
0.6424 (0.1900) 0.3281 (0.1249) |
|
| Admin. Data | Mig. Survey | 2,861.32 | Admin. | 3,440.97 | 180 | 0.8315 (0.2130) |
0.8278 (0.2311) |
. | . (.) |
|
| Padalapp | 2,771.55 | Admin. | 2,330.28 | 180 | 1.1894 (0.1034) |
0.7059 (0.1059) |
. | . (.) |
||
Notes: Figures in the columns Num. and Den. are per-person, per-week averages expressed in Philippine pesos. Capture Rates in each row are the Numerator divided by the Denominator. In the All Matched Pairs columns the sample includes only individuals that are confirmed to be in the administrative data as well as both migrant and recipient endline survey data (N=180, see Section 3.2.3 for more details). In the Matched Pairs w/in 28 Days column, this sample is further restricted to only matched pairs for whom data was collected no more than 28 days apart. Seasonal adjustment is obtained by demeaning monthly averages. Bootstrapped standard errors are reported in parentheses (based on 1000 replications). Comparisons of Padalapp and administrative data always use data from the full study-period, so these results do not vary by recall period.
Footnotes
Consider a simple example. Say a remittance-recipient household simply reports only a fixed fraction (less than one) of its true remittance receipts. The household receives $100 in remittances every month, but after a positive income shock receives zero remittances. If this household under-reports the pre-shock $100, but accurately reports the post-shock zero, then the effect of the positive income shock on remittances will be attenuated (biased towards zero).
For surveys conducted in the UAE, administrative and operational support was provided by IDS Research and Consultancy.
The name of the app is a play on the Filipino word padala, meaning “remittance.”
The user interface and other characteristics of the app are available from the authors upon request.
As part of the RCT, a subset of users were randomly selected to use a special feature of the app that allowed them to label remittances for specific purposes.
25 UAE Dirhams ≈ 6.81 USD
50 Philippine Pesos ≈ 1 USD
For each migrant, the remittance recipient was identified during the baseline survey through an indirect elicitation. We informed the migrant that they would be entered into a $500 raffle, and that the prize money would be sent to a recipient of their choosing in the Philippines. The recipient name provided in response was taken as the primary remittance recipient for the remainder of the study.
Incorrect or imprecise wording of survey questions could easily lead to incompatibility between migrant and recipient reports. In particular, we were concerned that migrants would interpret remittance questions to be in reference to the recipient’s entire household, while recipients would only report remittances received directly in their name. To minimize the risk of such misalignment in reporting, we clearly and explicitly referred to the receiver by name in all remittance related questions included in the migrant survey, and were careful not to refer to other household members during this section of the questionnaire.
For example, someone who sent remittances in 5 out of 30 weeks could have been active throughout the entire study–remitting once every 6 weeks–or active only during the first 5 weeks.
In other words, this is the number of migrants for whom we never observed a consecutive 8-week period with no remittances.
More details on the construction of these capture rates can be found in Appendix A.
Unfortunately, this method cannot be applied to any comparison involving administrative data, as respondents cannot be matched to the anonymized UAE Exchange data.
One potential reason that the shorter recall period generates a higher capture rate is simply that there are more zeros in the 7-day recall question, i.e., there are a large number of migrants in our sample who did not send weekly remittances. We expect that it is easier for remittance recipients to remember when they received no money in the prior week than to recall the exact total when a positive amount is received.
For the 7-day recall question, this capture rate drops dramatically, which may be due to mismatches in timing between survey and administrative data coverage—as even small differences can have a significant impact over the shorter recall period. Unfortunately, due to the anonymity of the administrative data, we cannot test this hypothesis by restricting the comparison to include only individuals with sufficient overlap in coverage.
In the calculation of all capture rates, both the Padalapp and survey samples are restricted to these individuals (N=1377 from wave 1+2; N=721 from wave 2 only) to maintain consistency with the initial recipient/migrant survey comparison.
This operates on the assumption that the average change in remittances between baseline and endline was constant across the attrited and non-attrited groups.
We assume constant variance across the missing and non-missing distributions.
In general, the composition of the smaller sample is similar to the full sample. In Appendix B Table B1, we reproduce Table 1 results on the smaller sample to show how the full set of capture rates compares across this subset of the data.
E.g., “How much, in total, have you remitted to [RECIPIENT NAME] in the last 12 weeks?”
While some migrants may have been calculating a precise peso amount, using the official rate, most were likely estimating the amount mentally using an approximate rate.
Exchange rate data is taken from the International Monetary Fund’s website.
In contexts where informal remittance channels are prevalent, however, researchers should be aware that administrative data from formalized MTOs may only cover a fraction of total remittance volumes.
Insofar as remittance frequency and the ratio of remittances to total income is correlated with a recipient’s ability to recall remittance amounts, these results indicate the importance of recall bias over other types of previously hypothesized behavioral biases (e.g., social desirability bias). In future research, it would be interesting to see more careful attempts to disentangle the effects of these and other behavioral sources of reporting bias.
Recall that we already offered small monetary rewards for receipt submissions in Padalapp (see Section 2.1). This did lead to relatively high rates of receipt verification (80%), but perhaps was not sufficient to sustain engagement in the long run. In determining the optimal levels of financial rewards, it will be important to test the trade-off between higher usage rates and the risk of fraudulent submissions.
Further research may also find that remittance frequency is an important determinant of the accuracy of app-based self-reports. The majority of migrants in our sample remitted less than once every two months, so opportunities to engage with the app presented themselves only rarely. For users such as these, it will be particularly important to maintain engagement during extended periods with no remittance activity.
References
- Abarcar P, Barua R, and Yang D (2020). Financial education and financial access for transnational households: Field experimental evidence from the philippines. Economic Development and Cultural Change 69(1), 373–404. [Google Scholar]
- Ambler K, Aycinena D, and Yang D (2014, September). Remittance responses to temporary discounts: A field experiment among central american migrants. Working Paper 20522, National Bureau of Economic Research.
- Ambler K, Aycinena D, and Yang D (2015). Channeling remittances to education: A field experiment among migrants from el salvador. American Economic Journal: Applied Economics 7(2), 207–232. [DOI] [PMC free article] [PubMed] [Google Scholar]
- Ashraf N, Aycinena D, C. M. A, and Yang D (2015). Savings in transnational households: A field experiment among migrants from el salvador. The Review of Economics and Statistics 97(2), 332–351. [Google Scholar]
- Baseler T (2021, January). Hidden income and the perceived returns to migration. Working paper, SSRN.
- Bollard A, McKenzie D, Morten M, and Rapoport H (2011, May). Remittances and the Brain Drain Revisited: The Microdata Show That More Educated Migrants Remit More. The World Bank Economic Review 25(1), 132–156. [Google Scholar]
- Brown RP, Carling J, Fransen S, and Siegel M (2014). Measuring remittances through surveys: Methodological and conceptual issues for survey designers and data analysts. Demographic Research 31, 1243–1274. [Google Scholar]
- De Arcangelis G, Joxhe M, McKenzie D, Tiongson E, and Yang D (2015). Directing remittances to education with soft and hard commitments: Evidence from a lab-in-the-field experiment and new product take-up among filipino migrants in rome. Journal of Economic Behavior and Organization 111, 197–208. [Google Scholar]
- Joseph T, Nyarko Y, and Wang S-Y (2018, April). Asymmetric information and remittances: Evidence from matched administrative data. American Economic Journal: Applied Economics 10(2), 58–100. [Google Scholar]
- Khanna G, Murathanoglu E, Theoharides CB, and Yang D (2022, March). Abundance from abroad: Migrant income and long-run economic development. Working Paper 29862, National Bureau of Economic Research.
- Seshan G and Yang D (2014). Motivating migrants: A field experiment on financial decision-making in transnational households. Journal of Development Economics 108, 119–127. [Google Scholar]
- Seshan G and Zubrickas R (2015, July). Asymmetric Information about Migrant Earnings and Remittance Flows. The World Bank Economic Review 31(1), 24–43. [Google Scholar]
- World Bank T (2021). Resilience: Covid-19 crisis through a migration lens. Technical report, World Bank. [Google Scholar]
- Yang D (2006). Why do migrants return to poor countries? evidence from philippine migrants’ responses to exchange rate shocks. Review of Economics and Statistics 88(4), 715–735. [Google Scholar]
- Yang D (2008). International migration, remittances and household investment: Evidence from philippine migrants’ exchange rate shocks. The Economic Journal 118(528), 591–630. [Google Scholar]
- Yang D (2011, Summer). Migrant remittances. Journal of Economic Perspectives 25(3), 129–152. [Google Scholar]
- Yang D and Choi H (2007, May). Are Remittances Insurance? Evidence from Rainfall Shocks in the Philippines. The World Bank Economic Review 21(2), 219–248. [Google Scholar]
- Yang D and Martinez C (2006). Remittances and poverty in migrants’ home areas: Evidence from the philippines. Technical report, World Bank. [Google Scholar]