



Abstract
BACKGROUND
The Pain Catastrophizing Scale (PCS), a widely used tool to assess catastrophizing related to spinal disorders, shows valid psychometric properties in general but the minimal important change (MIC) is still not determined.
AIM
The aim of this study was to assess responsiveness and MIC of the PCS in individuals with chronic low back pain (LBP) undergoing multidisciplinary rehabilitation.
DESIGN
Prospective observational study.
SETTING
The setting was outpatient rehabilitation hospital.
POPULATION
Two hundred and five patients with chronic LBP.
METHODS
Before and after an 8-week multidisciplinary rehabilitation program, 205 patients completed the Italian version of the PCS (PCS-I). We calculated the PCS-I responsiveness by distribution-based methods (effect size [ES], standardized response mean [SRM], and minimum detectable change [MDC]) and anchor-based methods [receiver operating characteristic (ROC) curves]. After the program, participants completed a 7-point global perceived effect scale (GPE), based on which they were classified as “improved” vs. “stable.” ROC curves computed the best cut-off level (taken as the MIC) between the two groups. ROC analysis was also performed on subgroups according to patients’ baseline PCS scores.
RESULTS
ES, SRM and MDC were 0.71, 0.67 and 7.73, respectively. ROC analysis yielded an MIC of 8 points (95% confidence interval [CI]: 6-10; area under the curve [AUC]: 0.88). ROC analysis of the PCS subgroups confirmed an MIC of 8 points (95%CI: 6-10) for no/low catastrophizers (score <30, N.=159; AUC: 0.90) and indicated an MIC of 11 points (95%CI: 8-14) for catastrophizers (score >30, N.=33; AUC: 0.84).
CONCLUSIONS
The PCS-I showed good ability to detect patient-perceived clinical changes in chronic LBP postrehabilitation. The MIC values we determined provide a benchmark for assessing individual improvement in this clinical context.
CLINICAL REHABILITATION IMPACT
The present study calculated – in a sample of people with chronic LBP – the responsiveness and MIC of the PCS. These values increase confidence in interpreting score changes, enhancing their meaningfulness for both research and clinical contexts.
Key words: Low back pain, Catastrophization, Pain, Rehabilitation, Exercise, Psychometrics
Pain catastrophizing is the tendency to magnify or exaggerate the threat or gravity of actual or anticipated painful experience.1 This negative mental set is associated with the severity of adverse pain-related reactions and can predict a poor long-term outcome.2 The Pain Catastrophizing Scale (PCS) is widely used to assess pain-related catastrophic thinking.1 The 13-item scale has three components, i.e., magnification, rumination, and helplessness. The scale has demonstrated good psychometric properties such as internal consistency, reproducibility, and content and construct validity.1, 3 Some responsiveness indices have also been examined4, 5 to analyze the scale’s ability to detect changes over time. In particular, effect size (ES) and standardized responsive mean (SRM) were estimated in patients with widespread musculoskeletal pain,6 while the minimum detectable change (MDC) was estimated in patients with chronic low back pain (LBP),7 LBP in general,8 and fibromyalgia.9 However, the minimal important change (MIC) – defined as the smallest change that patients perceive to be significant and termed minimal clinically important difference or minimal important difference5 – has never been determined for the PCS in people with LBP undergoing multidisciplinary rehabilitation. This parameter is essential to understand the within-person change over time during clinical care, to assess the effectiveness of the intervention and guide clinical decision-making. It is also essential for research purposes, e.g., to investigate treatment effectiveness in clinical trials, sample size estimates, and cost evaluations of given interventions.4
The aim of this study was thus to determine the responsiveness and MIC of the PCS in patients with chronic LBP undergoing multidisciplinary rehabilitation, triangulating the results using both distribution-based and anchor-based methods, in order to enhance confidence in interpreting the change score in pain catastrophizing thoughts.4, 5
Materials and methods
Participants
The participants were a convenience sample of outpatients consecutively admitted to a Rehabilitation Unit and enrolled between January 2017 and December 2018.
The inclusion criteria were diagnosis of chronic non-specific LBP (i.e., documented history of pain lasting >12 weeks without a recognizable, known specific pathological source;10, 11 good understanding of Italian; and age >18 years. Exclusion criteria were: 1) acute (<4 weeks) or subacute (<12 weeks) non-specific LBP; 2) specific causes of LBP (e.g. disc herniation, canal stenosis, spinal deformity, fracture, spondylolisthesis, or infections), central/peripheral neurological signs confirmed by imaging (lumbar radiographs and, in doubtful cases, computed tomography or magnetic resonance imaging) and/or case history; systemic illness (including rheumatologic diseases); cognitive impairment (Mini-Mental State Examination Score <24); recent myocardial infarction or cerebrovascular event; previously prescribed physical or cognitive-behavioral therapy; and 3) refusal or inability to adhere to the treatment.
Patients’ sociodemographic and clinical characteristics were collected regarding age, sex, Body Mass Index, pain duration, pain intensity, disability, education level, occupation, comorbidities, and marital status.
This research was part of an observational study approved by the Institutional Review Board of the local Hospital (N. 5/16; date of approval: 05/04/2016). All patients were informed about the research aims, questionnaires and procedures, and gave their written consent to participate. The study was conducted in accordance with the principles set forth in the Helsinki Declaration.
Measures
Pain catastrophizing scale (PCS)
The Pain Catastrophizing Scale (PCS) evaluates catastrophic thinking in patients with musculoskeletal disorders and is a 13-item self-report questionnaire.1, 2 Patients are asked to rate on a 5-point Likert scale, from 0 (never) to 4 (always), the degree to which they have any of the thoughts described in each item. The total score is the sum of the scores for each item, and ranges from 0 to 52. Higher scores reflect higher levels of catastrophic thinking. Studies have confirmed the PCS as a sufficiently unidimensional measure to allow the calculation of a global score,12, 13 inasmuch as it taps a single latent construct (general catastrophizing) characterized by three interrelated components,14 namely “helplessness” (items N. 1-5 and 12), “rumination” (items 8-11), and “magnification” (items 6-7 and 13).1 We used the Italian cross-culturally adapted and validated version of the PCS (PCS-I), which has demonstrated satisfactory psychometric properties.15
Global perceived effect
At the end of the treatment, patients self-rated the global perceived effect (GPE) of the intervention regarding catastrophizing thoughts. The question (“Overall, how much did the treatment you received help your catastrophizing due to current LBP?”) had 7 response options ranging from -3 (“much worse”) to +3 (“much better”).16 A variety of formats of this scale exists, with different anchors and with variations in names, such as “Global Rating of Change,” “Patient Global Impression of Change,” and “Transition Ratings.”16
Procedures
The outpatient program consisted of two 60-min individual motor training sessions per week for 8 weeks. The exercises aimed to improve postural control, to strengthen and stabilize the back muscles, and to stretch major muscle groups of the trunk and lower limbs. Patients received, in addition, one 60-min cognitive-behavioral therapy session per week for 8 weeks aimed at modifying their ‘fear of movement’ beliefs, catastrophizing thoughts and over-reactive illness behaviors, as well as providing information and education on ergonomic principles.17
Health personnel administered the questionnaires as part of the pre-/postrehabilitation assessment and checked them and returned any uncompleted part to participants for completion, in order to minimize the rate of missing/multiple responses.
Mild analgesics (i.e., paracetamol) and non-steroidal anti-inflammatory drugs (NSAIDs) were allowed during the study, but not more than one tablet per day on demand for more than 7 successive days. Their intake as well as symptoms and patients’ needs were constantly monitored.
Statistical analysis
We calculated two classical test theory indicators of reliability:18 1) internal consistency, through Cronbach’s α. Values >0.70 are recommended for group-level comparisons, and a minimum of 0.85-0.90 is advised for individual judgments; and 2) test/retest reliability of global scores, through the Intraclass Correlation Coefficient, with a “two-way mixed effects, single measurement model” (ICC(2,1)). This value is essential for the calculation of the standard error of measurement (SEM).19
Based on the literature, we determined that a sample size of 40 would provide adequate statistical power (expecting to obtain an ICC of 0.80-0.85, with a 95%CI of 0.15) for test-retest reliability of PCS total scores.20 Forty participants – randomly selected from the total sample – completed the questionnaire twice, within a 96-hour interval, before the start of the rehabilitation program.
We used distribution-based methods to examine the following parameters:4, 5
the ES, calculated on the whole sample as the difference between the pre- and post-test scores divided by the pretest standard deviation (SD). The ES was classified as trivial (<0.2), small (0.2-0.39), moderate (0.4-0.7), or large (>0.7);21
the SRM, representing the ratio between individual change and the SD of that change. Values of 0.20, 0.50, and 0.80 respectively represent small, moderate, and large changes;21
- the SEM, calculated as:19, 22
where the ICC(2,1) value was taken from test-retest results;
- the MDC (the minimal amount of change that a score must show to be greater than random fluctuations), calculated as:
Its 95% confidence level (MDC95) corresponds to a z value of 1.96.18, 23
As for anchor-based methods, we analyzed two parameters using the GPE score as an external criterion to determine whether changes in scores were clinically meaningful.
First, according to the mean change approach, we calculated the mean change of participants graded on the GPE as: not/minimally improved (GPE=0 “unchanged,” or GPE=1 “a little better”), moderately improved (GPE=2 “better”), or largely improved (GPE=3 “much better”).22
Second, according to receiver operating characteristic (ROC) curves,18 we divided the participants into two groups as stable (GPE= 0 or 1) or improved (GPE= 2 or 3) and computed the distribution of the change in scores on the PCS in both groups. We calculated the sensitivity and specificity of each possible cutoff value of the change score to distinguish between the two patient groups. For all possible cutoff points, sensitivity was plotted against 1-specificity, to obtain an ROC curve. The point on the ROC curve that is closest to the upper left corner of the figure was taken as the MIC. This point indicates the change score that is associated with the least amount of misclassification, i.e., the smallest sum of the percentages of false positives (patients who have a change larger than the MIC but reported themselves to be unchanged) and false negatives (patients who have a change smaller than the MIC but reported themselves to be importantly improved).19, 24 The cutoff score 95% confidence interval (CI) was estimated using the bootstrap method (500 repetitions). We also computed the area under the ROC curve (AUC), an aggregate measure of performance across all possible classification thresholds. The AUC indicates the probability of correctly identifying, in randomly selected pairs of subjects who have and have not improved, the one who has improved. The greater the AUC, the greater a measure’s ability to distinguish those with vs. without a meaningful improvement. As a rule, an AUC>0.70 indicates an acceptable discrimination and >0.80 a good one. In addition, ROC analysis was performed splitting the whole sample into two subgroups based on their PCS-I baseline values, and then separately examining the two different cutoffs suggested by the literature for defining clinically relevant levels of catastrophizing (which may warrant intervention): respectively, total PCS score of 2424 or 30 points.2, 25
To verify the validity of GPE value as a criterion, we examined its correlation with the pre-/post-treatment change score in PCS-I, hypothesizing to find at least a nontrivial correlation (>0.30-0.50) in all cases.5
Sample size (~200) was estimated in order to obtain an adequate number of ‘events’ (patients improved according to their GPE) for the ROC analysis, hypothesizing a 50% improvement rate, an AUC around 0.90 and a half-width of the CI on the AUC of about 0.05 (real AUC between 0.85 and 0.95).18
Data availability
The data associated with the paper are not publicly available but are available from the corresponding author on reasonable request.
Results
Of the 260 patients invited to participate, 7 did not meet the inclusion criteria (specific causes of LBP, N.=2; systemic illness, N.=3; cognitive impairment, N.=2), 35 refused, and 13 were unable to adhere to the treatment (logistic problems, N.=8; economic difficulties, N.=2; personal problems, N.=3).
The final study population consisted of 205 patients with a mean age of 51.1±11.4 years and a mean pain duration of 22.2±15.0 months. At baseline, average pain intensity was 4.4±1.6 (on a 0-10 numerical rating scale) and the average lumbar disability 25.7±6 (on the 0-100 Oswestry Disability Index). The Body Mass Index was 25.4±4.8 kg/m2. Table I shows additional clinical and socio-demographic characteristics of the patients. Table II describes baseline and post-treatment scores of the PCS-I total scale and three subscales (helplessness, rumination, and magnification). The PCS-I scores did not significantly differ between males and females (baseline: 18.9+8.1 vs. 22.5+9.2; post-treatment 14.4+10 vs. 16.2+10.4) or between younger and older participants (split according to the median age of the sample, 50 years; baseline: 19.7+8.8 vs. 22.5+8.9; post-treatment 14.5+9.1 vs. 16.5+11.3).
Table I. —Socio-demographic and clinical characteristics of the study population (N.=205).
| Variable | N. | % |
|---|---|---|
| Sex (male/female) | 79/126 | 39/61 |
| Marital status | ||
| Unmarried | 47 | 23 |
| Married | 156 | 76 |
| Not specified | 2 | 1 |
| Occupation | ||
| Employee | 94 | 46 |
| Self-employed | 52 | 25 |
| Housewife | 28 | 14 |
| Retired | 28 | 14 |
| Other | 3 | 1 |
| Education | ||
| Primary school | 16 | 8 |
| Middle school | 48 | 23 |
| High school | 96 | 47 |
| University | 45 | 22 |
| Smoking | ||
| Yes | 56 | 27 |
| No | 149 | 73 |
| Limb pain | ||
| Yes | 53 | 26 |
| No | 152 | 74 |
| Physical activity | ||
| Yes | 67 | 33 |
| No | 138 | 67 |
Table II. —Mean (SD) values of the PCS-I pre- vs. postrehabilitation for the total (N.=205) sample and for patients improved (GPE= 2 or 3; N.=94) vs. stable (GPE= 0 or 1; N.=98).
| Pretreatment | Post-treatment | |||
|---|---|---|---|---|
| Mean | SD | Mean | SD | |
| PCS-I | ||||
| Total | 21.06 | 8.93 | 15.48 | 10.23 |
| Improved | 22.00 | 7.34 | 10.54 | 7.29 |
| Stable | 19.91 | 10.16 | 17.86 | 9.76 |
| Helplessness subscale | ||||
| Total | 7.39 | 4.50 | 5.87 | 4.54 |
| Improved | 7.55 | 3.98 | 4.16 | 3.48 |
| Stable | 7.17 | 5.04 | 6.67 | 4.53 |
| Rumination subscale | ||||
| Total | 7.95 | 3.07 | 5.05 | 3.56 |
| Improved | 8.30 | 2.44 | 3.90 | 2.70 |
| Stable | 7.48 | 3.50 | 6.21 | 3.33 |
| Magnification subscale | ||||
| Total | 5.72 | 2.53 | 4.11 | 3.09 |
| Improved | 6.14 | 2.17 | 2.48 | 2.15 |
| Stable | 5.26 | 2.67 | 4.98 | 2.92 |
PCS-I: Pain Catastrophizing Scale, Italian version, SD: standard deviation.
Pain worsening was managed by means of symptomatic drugs: 29 subjects (14%) required paracetamol, and 25 subjects (12%) NSAIDs. No participant received more than one tablet per day on demand for more than 7 successive days.
The values related to Cronbach’s alpha and test-retest reliability (ICC(2,1)) for PCS-I and its subscales are shown in Table III, together with related distribution-based indices of responsiveness.
Table III. —Distribution-based indices of responsiveness for PCS-I and its subscales (potential score range in brackets).
| PCS-I (score: 0-52) | Helplessness (score: 0-24) | Rumination (score: 0-16) | Magnification (score: 0-12) | |
|---|---|---|---|---|
| Cronbach’s α | 0.89 | 0.82 | 0.80 | 0.70 |
| ICC (2,1) | 0.903 | 0.877 | 0.857 | 0.859 |
| Effect size (95%CI) | 0.71 (0.50 - 0.91) | 0.37 (0.17 - 0.57) | 0.92 (0.70 - 1.13) | 0.71 (0.50 - 0.91) |
| SRM (95%CI) | 0.67 (0.51 - 0.83) | 0.44 (0.29- 0.59) | 0.84 (0.69 -1.00) | 0.50 (0.36 - 0.64) |
| SEM | 2.79 | 1.58 | 1.16 | 0.95 |
| MDC95 | 7.73 | 4.38 | 3.23 | 2.64 |
PCS-I: Pain Catastrophizing Scale, Italian version; MIC: minimal important change; ROC: receiver operating characteristic; CI: confidence interval; SEM: standard error of measurement; SRM: standardized response mean; MDC95: minimum detectable change (at 95% confidence interval).
Based on the dichotomization of the GPE score, 94 participants (46%) were classified as improved (GPE= 2 or 3) and 98 (48%) as stable (GPE= 0 or 1). The remaining 13 participants (6%) showed a worsened clinical condition according to their GPE (-1 or -2) and were excluded from further analyses. The correlation of the score change of the PCS-I with the GPE was rs=0.74, while that with baseline and final PCS-I score was rs=0.32 and rs=0.55, respectively.
As for anchor-based methods, the mean PCS-I score changes according to the GPE levels were as follows: 0.2 points and 4 points in those who rated no or minimal improvement, respectively; 9.8 points in those who rated moderate improvement (GPE=2 “better”), and 14.4 points in those who rated large improvement (GPE=3 “much better”).
ROC analysis of the PCS-I revealed an AUC of 0.88 (95% C.I. 0.83-0.93) showing a good capacity to discriminate between improved and stable patients (Figure 1). The best cut-off point (i.e., MIC) was 8 (95%CI: 6-10), which had 81.9% sensitivity, 81.6% specificity, and a classification accuracy of 81.8%.
Figure 1.

—Receiver-operating-characteristic curves of the Pain Catastrophizing Scale, showing its overall accuracy in identifying a meaningful improvement (reduction) in pain catastrophizing, according to the Global Perceived Effect (GPE) at post-treatment (GPE 0 and 1 vs. GPE 2 and 3). For the cutoff point of 8, sensitivity was 81.9%, specificity 81.6%, and accuracy 81.8%.
The ROC analysis on the two sample subgroups based on baseline PCS-I scores gave the following results. In the subgroup with PCS-I score <30 (N.=159; people with no/low catastrophizing thoughts) AUC was 0.90 (95%CI: 0.85-0.95), and the best cutoff was 8 points of change (95%CI: 6-10). In the subgroup with clinically significant catastrophizing the best cutoff was 11 points of change (95%CI: 8-14), with an AUC of 0.89 (95%CI 0.81-0.97) for individuals with PCS-I >24 (N.=72) and 0.84 (95%CI: 0.71-0.98) for those with PCS-I >30 (N.=33).
Discussion
To our knowledge, this is the first study to examine the MIC of the PCS in Italian people with chronic LBP undergoing multidisciplinary rehabilitation. The MIC is a key parameter in both clinical practice and research, e.g., when monitoring clinical status of individual subjects.22 A logical way to determine MIC is to compare and interpret the information conveyed by multiple reference standards, calculated on the same sample according to distribution- and anchor-based methods.4, 5
We used distribution-based methods to examine some statistical group-level characteristics of scores. The ES and SRM showed moderate to large responsiveness of the PCS-I to the rehabilitation program. The size of the effect is in line with the average PCS change reported in a recent meta-analysis exploring multimodal interventions.26 The effect of our treatment was large in the rumination and, to a lesser extent, in the magnification subscales, while it was limited for the helplessness component. The few studies examining the differential relationships between the individual components/subscales of pain catastrophizing and pain outcomes have yielded heterogeneous findings.27, 28
The MDC95 in our study was 7.73 points; just a bit lower than the corresponding values reported in previous studies for PCS (analyzing different populations in different contexts), which mainly ranged from 8.8 to 10.45 points.7-9, 15
As for anchor-based methods, the quite good correlation found between changes in PCS-I score and GPE assessment indicated that participants adequately estimated their change in catastrophizing thoughts during the treatment period. As expected, the mean PCS-I change scores increased as the GPE score increased. ROC analysis showed a good ability of PCS-I change to correctly classify subjects who considered themselves as improved or not (Figure 1, 2): a baseline to follow-up change of at least 8 points (95% CI: 6-10) represented the optimal cutoff value, identifying a clinically important change for our sample. It represents a variation of about 15% of the maximum possible score.
Figure 2.
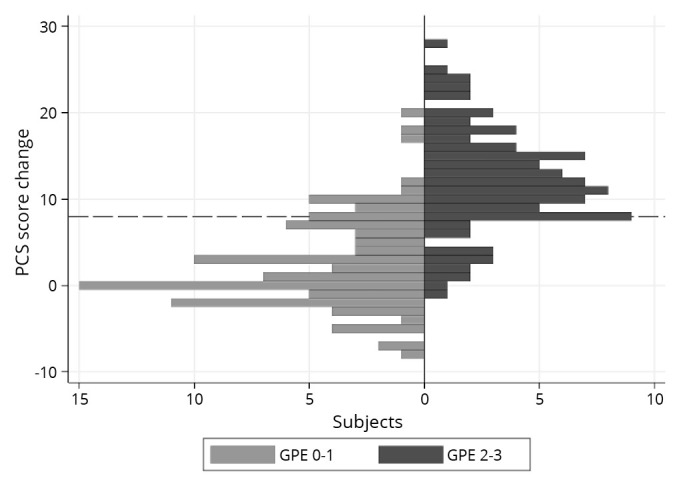
—Distribution of Pain Catastrophizing Scale changes in significantly improved (Global Perceived Effect [GPE] = 2 “better” or 3 “much better” – on the right) and not significantly improved patients (GPE = 0 “unchanged” or 1 “a little better” – on the left). In our sample (N.=205), at the optimal receiver operating characteristic cut-off of 8 points (horizontal dashed line, representing the selected value for Minimal Important Change), the sensitivity was 81.9% and specificity 81.6%.
The appropriateness of the proposed MIC value (or small range of values inside the CIs) was confirmed by triangulating our results: the MIC showed a good classification accuracy, was higher that the MDC95 value (a distribution-based parameter) and was consistent with the results related to the ‘mean change approach’ (an anchor-based group-level parameter).5, 22, 29
When two subgroups of participants were separately examined according to baseline PCS-I score,30 people without significant catastrophizing (or less severe dysfunction) at baseline needed to have the same improvement as the overall group (8 points) in order to perceive the treatment as helpful. Instead, for the so-called “catastrophizers” an 11-point MIC value (95%CI: 8-14) was required. This finding is logical because subjects with higher PCS scores have the opportunity to reduce more their catastrophic thoughts. On the other hand, it is reasonable that people without significant catastrophizing have a different perception of improvement than catastrophizers, and it is still debated whether they could benefit from any reduction in their pain-catastrophizing level.26
These MIC values, that for catastrophizers, represent a preliminary step for better assessing risk-factor targeted programs aimed at reducing pain catastrophizing in individuals or minimizing the negative impact of pain catastrophizing on pain outcomes.24, 31 Overall, our results may be useful in studies examining the conceptual model of pain catastrophizing and its interaction with other psychosocial factors related to pain experience and coping.32-34 As for the relationship between PCS scores and basic demographic characteristics, our findings are in line with a recent meta-analysis:35 in both studies, PCS scores were unrelated to age and sex.
If one wants to compare in a meaningful way the outcome of different types of clinical interventions in this field, it is crucial to have established cutoffs to interpret different levels of pain-related catastrophic thinking.36
Limitations of the study
The main limitations of this study are represented by the fact that further research needs to examine: 1) whether different interventions for catastrophizing reduction are appropriate and result in overall better patient health outcomes, and which interventions may be the most effective;27, 32-34, 36 and 2) the content validity of the PCS items, also in comparison with other pain catastrophizing measures.37
Some caution in interpreting and generalizing our results is necessary, particularly when interpreting change at the individual level. First, our MIC values were based on a convenience sample of individuals who experienced a positive outcome after rehabilitation treatment; it would be good to obtain estimates of change in individuals whose outcome deteriorated, as well as in other contexts, e.g., samples undergoing different interventions or with different clinical characteristics. Likewise, it is possible that different methodological and statistical approaches could lead to different results.5 Second, some intrinsic weaknesses of GPE should be considered, e.g., the patient’s ability to selectively report the effect of the intervention related to catastrophic thoughts may be influenced by additional factors (such as change in disability, quality of life, etc.).16, 38, 39 Lastly, in the ROC analysis of the subgroup of catastrophizers the sample size was small and thus the CI of the MIC was quite large: therefore, this finding needs to be confirmed in a larger sample.
Conclusions
In conclusion, our findings show that the PCS is a responsive measure in Italian individuals with chronic LBP undergoing multidisciplinary rehabilitation. We recommend these MIC estimates for use as a preliminary and “context-specific” reference point when assessing improvement or planning clinical studies on similar samples, paying attention to the baseline level of catastrophizing and clinical characteristics of the population under investigation.
References
- 1.Sullivan MJ, Bishop SR, Pivik J. The Pain Catastrophizing Scale: development and validation. Psychol Assess 1995;7:524–32. 10.1037/1040-3590.7.4.524 [DOI] [Google Scholar]
- 2.Sullivan MJ. The Pain Catastrophizing Scale – User Manual. Montreal, QC: McGill University; 1995-2009.
- 3.Adams VJ, Walker B, Jepson D, et al. Measurement characteristics and clinical utility of the Pain Catastrophizing Scale in individuals experiencing low back pain. Arch Phys Med Rehabil 2017;98:2350–1. 10.1016/j.apmr.2017.03.005 [DOI] [Google Scholar]
- 4.Terwee CB, Dekker FW, Wiersinga WM, Prummel MF, Bossuyt PM. On assessing responsiveness of health-related quality of life instruments: guidelines for instrument evaluation. Qual Life Res 2003;12:349–62. https://www.ncbi.nlm.nih.gov/entrez/query.fcgi?cmd=Retrieve&db=PubMed&list_uids=12797708&dopt=Abstract 10.1023/A:1023499322593 [DOI] [PubMed] [Google Scholar]
- 5.Revicki D, Hays RD, Cella D, Sloan J. Recommended methods for determining responsiveness and minimally important differences for patient-reported outcomes. J Clin Epidemiol 2008;61:102–9. https://www.ncbi.nlm.nih.gov/entrez/query.fcgi?cmd=Retrieve&db=PubMed&list_uids=18177782&dopt=Abstract 10.1016/j.jclinepi.2007.03.012 [DOI] [PubMed] [Google Scholar]
- 6.Pincus T, Rusu A, Santos R. Responsiveness and construct validity of the depression, anxiety, and positive outlook scale (DAPOS). Clin J Pain 2008;24:431–7. https://www.ncbi.nlm.nih.gov/entrez/query.fcgi?cmd=Retrieve&db=PubMed&list_uids=18496308&dopt=Abstract 10.1097/AJP.0b013e318164341c [DOI] [PubMed] [Google Scholar]
- 7.George SZ, Valencia C, Beneciuk JM. A psychometric investigation of fear-avoidance model measures in patients with chronic low back pain. J Orthop Sports Phys Ther 2010;40:197–205. https://www.ncbi.nlm.nih.gov/entrez/query.fcgi?cmd=Retrieve&db=PubMed&list_uids=20357418&dopt=Abstract 10.2519/jospt.2010.3298 [DOI] [PubMed] [Google Scholar]
- 8.Fernandes L, Storheim K, Lochting I, Grotle M. Cross-cultural adaptation and validation of the Norwegian pain catastrophizing scale in patients with low back pain. BMC Musculoskelet Disord 2012;13:111. https://www.ncbi.nlm.nih.gov/entrez/query.fcgi?cmd=Retrieve&db=PubMed&list_uids=22726668&dopt=Abstract 10.1186/1471-2474-13-111 [DOI] [PMC free article] [PubMed] [Google Scholar]
- 9.Morris LD, Grimmer-Somers KA, Louw QA, Sullivan MJ. Cross-cultural adaptation and validation of the South African Pain Catastrophizing Scale (SA-PCS) among patients with fibromyalgia. Health Qual Life Outcomes 2012;10:137. https://www.ncbi.nlm.nih.gov/entrez/query.fcgi?cmd=Retrieve&db=PubMed&list_uids=23173637&dopt=Abstract 10.1186/1477-7525-10-137 [DOI] [PMC free article] [PubMed] [Google Scholar]
- 10.Airaksinen O, Brox JI, Cedraschi C, Hildebrandt J, Klaber-Moffett J, Kovacs F, et al. ; COST B13 Working Group on Guidelines for Chronic Low Back Pain. Chapter 4. European guidelines for the management of chronic nonspecific low back pain. Eur Spine J 2006;15:S192–300. https://www.ncbi.nlm.nih.gov/entrez/query.fcgi?cmd=Retrieve&db=PubMed&list_uids=16550448&dopt=Abstract 10.1007/s00586-006-1072-1 [DOI] [PMC free article] [PubMed] [Google Scholar]
- 11.Maher C, Underwood M, Buchbinder R. Non-specific low back pain. Lancet 2017;389:736–47. https://www.ncbi.nlm.nih.gov/entrez/query.fcgi?cmd=Retrieve&db=PubMed&list_uids=27745712&dopt=Abstract 10.1016/S0140-6736(16)30970-9 [DOI] [PubMed] [Google Scholar]
- 12.Walton DM, Wideman TH, Sullivan MJ. A Rasch analysis of the pain catastrophizing scale supports its use as an interval-level measure. Clin J Pain 2013;29:499–506. https://www.ncbi.nlm.nih.gov/entrez/query.fcgi?cmd=Retrieve&db=PubMed&list_uids=23328327&dopt=Abstract 10.1097/AJP.0b013e318269569c [DOI] [PubMed] [Google Scholar]
- 13.Meroni R, Piscitelli D, Bonetti F, Zambaldi M, Cerri CG, Guccione AA, et al. Rasch Analysis of the Italian version of Pain Catastrophizing Scale (PCS-I). J Back Musculoskeletal Rehabil 2015;28:661–73. https://www.ncbi.nlm.nih.gov/entrez/query.fcgi?cmd=Retrieve&db=PubMed&list_uids=25408121&dopt=Abstract 10.3233/BMR-140564 [DOI] [PubMed] [Google Scholar]
- 14.Osman A, Barrios FX, Gutierrez PM, Kopper BA, Merrifield T, Grittmann L. The Pain Catastrophizing Scale: further psychometric evaluation with adult samples. J Behav Med 2000;23:351–65. https://www.ncbi.nlm.nih.gov/entrez/query.fcgi?cmd=Retrieve&db=PubMed&list_uids=10984864&dopt=Abstract 10.1023/A:1005548801037 [DOI] [PubMed] [Google Scholar]
- 15.Monticone M, Baiardi P, Ferrari S, Foti C, Mugnai R, Pillastrini P, et al. Development of the Italian version of the Pain Catastrophising Scale (PCS-I): cross-cultural adaptation, factor analysis, reliability, validity and sensitivity to change. Qual Life Res 2012;21:1045–50. https://www.ncbi.nlm.nih.gov/entrez/query.fcgi?cmd=Retrieve&db=PubMed&list_uids=21912846&dopt=Abstract 10.1007/s11136-011-0007-4 [DOI] [PubMed] [Google Scholar]
- 16.Kamper SJ, Maher CG, Mackay G. Global rating of change scales: a review of strengths and weaknesses and considerations for design. J Manual Manip Ther 2009;17:163–70. https://www.ncbi.nlm.nih.gov/entrez/query.fcgi?cmd=Retrieve&db=PubMed&list_uids=20046623&dopt=Abstract 10.1179/jmt.2009.17.3.163 [DOI] [PMC free article] [PubMed] [Google Scholar]
- 17.Monticone M, Ambrosini E, Rocca B, Magni S, Brivio F, Ferrante S. A multidisciplinary rehabilitation programme improves disability, kinesiophobia and walking ability in subjects with chronic low back pain: results of a randomised controlled pilot study. Eur Spine J 2014;23:2105–13. https://www.ncbi.nlm.nih.gov/entrez/query.fcgi?cmd=Retrieve&db=PubMed&list_uids=25064093&dopt=Abstract 10.1007/s00586-014-3478-5 [DOI] [PubMed] [Google Scholar]
- 18.Portney LG, Watkins MP. Foundations of clinical research: applications to practice. Third edition. Upper Saddle River, NJ: Pearson/Prentice Hall; 2009. [Google Scholar]
- 19.Weir JP. Quantifying test-retest reliability using the intraclass correlation coefficient and the SEM. J Strength Cond Res 2005;19:231–40. https://www.ncbi.nlm.nih.gov/entrez/query.fcgi?cmd=Retrieve&db=PubMed&list_uids=15705040&dopt=Abstract [DOI] [PubMed] [Google Scholar]
- 20.Bonett DG. Sample size requirements for estimating intraclass correlations with desired precision. Stat Med 2002;21:1331–5. https://www.ncbi.nlm.nih.gov/entrez/query.fcgi?cmd=Retrieve&db=PubMed&list_uids=12111881&dopt=Abstract 10.1002/sim.1108 [DOI] [PubMed] [Google Scholar]
- 21.Cohen J. Statistical Power Analysis for the Behavioral Sciences. Second edition. Hillsdale, NJ: Lawrence Erlbaum Associates, Inc; 1988. [Google Scholar]
- 22.Terwee CB, Roorda LD, Dekker J, Bierma-Zeinstra SM, Peat G, Jordan KP, et al. Mind the MIC: large variation among populations and methods. J Clin Epidemiol 2010;63:524–34. https://www.ncbi.nlm.nih.gov/entrez/query.fcgi?cmd=Retrieve&db=PubMed&list_uids=19926446&dopt=Abstract 10.1016/j.jclinepi.2009.08.010 [DOI] [PubMed] [Google Scholar]
- 23.Franchignoni F, Vercelli S, Giordano A, Sartorio F, Bravini E, Ferriero G. Minimal clinically important difference of the disabilities of the arm, shoulder and hand outcome measure (DASH) and its shortened version (QuickDASH). J Orthop Sports Phys Ther 2014;44:30–9. https://www.ncbi.nlm.nih.gov/entrez/query.fcgi?cmd=Retrieve&db=PubMed&list_uids=24175606&dopt=Abstract 10.2519/jospt.2014.4893 [DOI] [PubMed] [Google Scholar]
- 24.Scott W, Wideman TH, Sullivan MJ. Clinically meaningful scores on pain catastrophizing before and after multidisciplinary rehabilitation: a prospective study of individuals with subacute pain after whiplash injury. Clin J Pain 2014;30:183–90. https://www.ncbi.nlm.nih.gov/entrez/query.fcgi?cmd=Retrieve&db=PubMed&list_uids=23552561&dopt=Abstract 10.1097/AJP.0b013e31828eee6c [DOI] [PubMed] [Google Scholar]
- 25.Chibnall JT, Tait RC. Long-term adjustment to work-related low back pain: associations with socio-demographics, claim processes, and post-settlement adjustment. Pain Med 2009;10:1378–88. https://www.ncbi.nlm.nih.gov/entrez/query.fcgi?cmd=Retrieve&db=PubMed&list_uids=20021598&dopt=Abstract 10.1111/j.1526-4637.2009.00738.x [DOI] [PubMed] [Google Scholar]
- 26.Schütze R, Rees C, Smith A, Slater H, Campbell JM, O’Sullivan P. How can we best reduce pain catastrophizing in adults with chronic noncancer pain? A systematic review and meta-analysis. J Pain 2018;19:233–56. https://www.ncbi.nlm.nih.gov/entrez/query.fcgi?cmd=Retrieve&db=PubMed&list_uids=29122652&dopt=Abstract 10.1016/j.jpain.2017.09.010 [DOI] [PubMed] [Google Scholar]
- 27.Gilliam WP, Craner JR, Morrison EJ, Sperry JA. The mediating effects of the different dimensions of pain catastrophizing on outcomes in an interdisciplinary pain rehabilitation program. Clin J Pain 2017;33:443–51. https://www.ncbi.nlm.nih.gov/entrez/query.fcgi?cmd=Retrieve&db=PubMed&list_uids=27437567&dopt=Abstract 10.1097/AJP.0000000000000419 [DOI] [PubMed] [Google Scholar]
- 28.Meints SM, Wang V, Edwards RR. Sex and race differences in pain sensitization among patients with chronic low back pain. J Pain 2018;19:1461–70. https://www.ncbi.nlm.nih.gov/entrez/query.fcgi?cmd=Retrieve&db=PubMed&list_uids=30025944&dopt=Abstract 10.1016/j.jpain.2018.07.001 [DOI] [PMC free article] [PubMed] [Google Scholar]
- 29.de Vet HC, Terluin B, Knol DL, Roorda LD, Mokkink LB, Ostelo RW, et al. Three ways to quantify uncertainty in individually applied “minimally important change” values. J Clin Epidemiol 2010;63:37–45. https://www.ncbi.nlm.nih.gov/entrez/query.fcgi?cmd=Retrieve&db=PubMed&list_uids=19540720&dopt=Abstract 10.1016/j.jclinepi.2009.03.011 [DOI] [PubMed] [Google Scholar]
- 30.Wang YC, Hart DL, Stratford PW, Mioduski JE. Baseline dependency of minimal clinically important improvement. Phys Ther 2011;91:675–88. https://www.ncbi.nlm.nih.gov/entrez/query.fcgi?cmd=Retrieve&db=PubMed&list_uids=21372203&dopt=Abstract 10.2522/ptj.20100229 [DOI] [PubMed] [Google Scholar]
- 31.Williams AC, Eccleston C, Morley S. Psychological therapies for the management of chronic pain (excluding headache) in adults. Cochrane Database Syst Rev 2012;11:CD007407. https://www.ncbi.nlm.nih.gov/entrez/query.fcgi?cmd=Retrieve&db=PubMed&list_uids=23152245&dopt=Abstract 10.1002/14651858.CD007407.pub3 [DOI] [PMC free article] [PubMed]
- 32.Sullivan MJ. The communal coping model of pain catastrophising: clinical and research implications. Can Psychol 2012;53:32–41. 10.1037/a0026726 [DOI] [Google Scholar]
- 33.Martinez-Calderon J, Jensen MP, Morales-Asencio JM, Luque-Suarez A. Pain catastrophizing and function in individuals with chronic musculoskeletal pain: A systematic review and meta-analysis. Clin J Pain 2019;35:279–93. https://www.ncbi.nlm.nih.gov/entrez/query.fcgi?cmd=Retrieve&db=PubMed&list_uids=30664551&dopt=Abstract 10.1097/AJP.0000000000000676 [DOI] [PubMed] [Google Scholar]
- 34.Wertli MM, Burgstaller JM, Weiser S, Steurer J, Kofmehl R, Held U. Influence of catastrophizing on treatment outcome in patients with nonspecific low back pain: a systematic review. Spine 2014;39:263–73. https://www.ncbi.nlm.nih.gov/entrez/query.fcgi?cmd=Retrieve&db=PubMed&list_uids=24253796&dopt=Abstract 10.1097/BRS.0000000000000110 [DOI] [PubMed] [Google Scholar]
- 35.Wheeler CH, Williams AC, Morley SJ. Meta-analysis of the psychometric properties of the Pain Catastrophizing Scale and associations with participant characteristics. Pain 2019;160:1946–53. https://www.ncbi.nlm.nih.gov/entrez/query.fcgi?cmd=Retrieve&db=PubMed&list_uids=30694929&dopt=Abstract 10.1097/j.pain.0000000000001494 [DOI] [PubMed] [Google Scholar]
- 36.Wertli MM, Eugster R, Held U, Steurer J, Kofmehl R, Weiser S. Catastrophizing-a prognostic factor for outcome in patients with low back pain: a systematic review. Spine J 2014;14:2639–57. https://www.ncbi.nlm.nih.gov/entrez/query.fcgi?cmd=Retrieve&db=PubMed&list_uids=24607845&dopt=Abstract 10.1016/j.spinee.2014.03.003 [DOI] [PubMed] [Google Scholar]
- 37.Crombez G, De Paepe AL, Veirman E, Eccleston C, Verleysen G, Van Ryckeghem DM. Let’s talk about pain catastrophizing measures: an item content analysis. PeerJ 2020;8:e8643. https://www.ncbi.nlm.nih.gov/entrez/query.fcgi?cmd=Retrieve&db=PubMed&list_uids=32181053&dopt=Abstract 10.7717/peerj.8643 [DOI] [PMC free article] [PubMed] [Google Scholar]
- 38.Engel L, Beaton DE, Touma Z. Minimal clinically important difference: a review of outcome measure score interpretation. Rheum Dis Clin North Am 2018;44:177–88. https://www.ncbi.nlm.nih.gov/entrez/query.fcgi?cmd=Retrieve&db=PubMed&list_uids=29622290&dopt=Abstract 10.1016/j.rdc.2018.01.011 [DOI] [PubMed] [Google Scholar]
- 39.Bobos P, Ziebart C, Furtado R, Lu Z, MacDermid JC. Psychometric properties of the global rating of change scales in patients with low back pain, upper and lower extremity disorders. A systematic review with meta-analysis. J Orthop 2020;21:40–8. https://www.ncbi.nlm.nih.gov/entrez/query.fcgi?cmd=Retrieve&db=PubMed&list_uids=32082038&dopt=Abstract 10.1016/j.jor.2020.01.047 [DOI] [PMC free article] [PubMed] [Google Scholar]
Associated Data
This section collects any data citations, data availability statements, or supplementary materials included in this article.
Data Availability Statement
The data associated with the paper are not publicly available but are available from the corresponding author on reasonable request.